Embed Size (px)
Citation preview

Information Systems Education Journal (ISEDJ) 13 (5) ISSN: 1545-679X September 2015
©2015 EDSIG (Education Special Interest Group of the AITP) Page 12 www.aitp-edsig.org /www.isedj.org
Introducing Big Data Concepts
in an Introductory Technology Course
Mark Frydenberg [email protected]
Computer Information Systems Department
Bentley University, Waltham, MA 02452, USA
Abstract
From their presence on social media sites to in-house application data files, the amount of data that
companies, governments, individuals, and sensors generate is overwhelming. The growth of Big Data in both consumer and enterprise activities has caused educators to consider options for including Big Data in the Information Systems curriculum. Introducing Big Data concepts and technologies in the classroom often is reserved for advanced students in database or programming courses. This paper explores approaches for integrating Big Data into the Information Systems curriculum, and presents a sample lesson for presenting basic Big Data concepts to first year students in a general education Information Technology course. As the need for IT professionals with Big Data skills will continue to
increase, including these topics in a general education technology curriculum is especially pertinent.
Keywords: Big Data, Technology Concepts, Google, Data Visualization
1. INTRODUCTION
The rise of Web 2.0 applications (2004-2009)
saw the Internet evolve as a platform upon which users would generate their own content and run applications on many devices. "Data as the next 'Intel inside'," a reference to Tim O'Reilly's analogy that data powers web applications much in the same way that
processors power computers, became the mantra for companies moving their products and services online (O'Reilly, 2005). In the years that followed, the growth of commerce and social applications on the web, the proliferation of mobile devices, the rise of cloud computing,
the ubiquity of Internet access in consumer and
enterprise activities, and the emergence of the Internet of Things has resulted in daily digital activities that generate large quantities of data. Such large databases often are kept on servers distributed across the Internet. New technologies make it possible to gather, store, query, and retrieve all of this data over the
Internet.
Social networking sites, open government and healthcare databases, e-commerce transactions and automated sensors are among the many
daily digital interactions that generate data to be stored online for analysis of possible trends. With these activities comes information on social interests, consumer trends, and business prospects that if understood, could provide insights into business intelligence, social trends,
and organizational opportunities.
In the highly cited report Big Data: The Next Frontier for Competition, the McKinsey Foundation (Manyika, Chui, Bughin, Dobbs, Roxburgh, & Byers, 2011) states that the
increase in the amount of information produced
through these actions and transactions will provide important insights to organization that can understand such large data sets. They define Big Data as "data sets whose size is beyond the ability of typical database software tools to capture, store, manage, and analyze." The value of Big Data "…comes from the
patterns that can be derived by making connections between pieces of data, about an individual, about individuals in relation to others,

Information Systems Education Journal (ISEDJ) 13 (5) ISSN: 1545-679X September 2015
©2015 EDSIG (Education Special Interest Group of the AITP) Page 13 www.aitp-edsig.org /www.isedj.org
about groups of people, or simply about the structure of information itself" (boyd & Crawford, 2011, p. 1). Business, education, and government sectors routinely produce and
manage terabytes and petabytes of data, and rely on distributed tools to store and make sense of it all. As the enterprise finds value from Big Data and the information it contains, introducing Big Data concepts into the undergraduate Information
Systems classroom becomes a necessary curriculum addition in order to prepare tomorrow's IT professionals and knowledge workers.
This literature review describes programs for
teaching big data concepts to Information Systems majors and minors, and the narrative shares a lesson for introducing basic Big Data concepts to first-year students in a general education introductory IT course. The author presents a teaching exercise that gives students an appreciation for the issues without requiring
significant technology experience.
2. BIG DATA IN THE INFORMATION SYSTEMS CURRICULUM
Where and how to introduce Big Data concepts in the information systems curriculum has
received much discussion. "IS programs, faculty
members, and text books have so far been, in practice, somewhat lukewarm about their relationship with Big Data" (Topi, 2013, p. 12). Many degree programs in information systems are introducing courses in business analytics and
data mining so Information Systems majors can develop skills in managing and interpreting large scale enterprise data sets (King & Satyanarayana, 2013), (Grossniklaus & Maier, 2012). These courses require basic database skills usually taught in the undergraduate business education curriculum.
General education courses also could expose students to Big Data concepts by presenting students with hands-on exercises involving
online databases, productivity tools, and data visualization tools. Doing so offers students the opportunity to develop familiarity and skills with
these tools from an enterprise perspective. Today’s students need to understand the requirements for storage space, processing power, Internet connectivity, security, and ways to access or update information online in order to recommend solutions to their future
employers (Frydenberg & Andone, 2011). Students who learn about relational databases
need to understand where that technology falls short. So often, textbooks provide sample datasets, which are nicely structured, well formed, and conducive to a particular problem.
In the real world, data sets are not always so clean and well-structured. As the business education curriculum evolves, educators must consider current technology trends such as Big Data to determine where and how to integrate these topics. "Business
analytics is one of the fastest growing areas of focus for Information Systems (IS) programs, particularly at the graduate level. IS departments are establishing new analytics programs at a fast pace, and companies are
very interested in graduates with strong
capabilities in business analytics. Within this broad topic area, Big Data continues to become increasingly important, even though the concept itself is at times confusing and continues to evolve" (Topi, 2013, p. 12). The remainder of this paper presents a lesson
for introducing big data concepts in a general education introductory technology course at a business university.
3. A LESSON FOR TEACHING BIG DATA CONCEPTS
IN A GENERAL EDUCATION CONTEXT
IT 101 (Introduction to Information Technology and Computing Systems) is a first-year required general education course for all students at Bentley University, a business university in Massachusetts. The course introduces students
to types of hardware and software, operating systems, cloud storage, the Internet and the World Wide Web, HTML, wireless networking, multimedia, spreadsheet and database applications, and cloud computing concepts. Introducing Big Data in an introductory
technology course allows students to apply their knowledge of several of these topics (especially databases, the Internet and World Wide Web, and cloud computing) in order to understand the
technological issues required to store, search, and maintain Big Data sets, and Excel as a data analysis and visualization tool for smaller data
sets. This section describes a series of classroom demonstrations and activities piloted in seven sections of IT 101 over two consecutive semesters. The same instructor presented this
material to each section. The presentation was preceded by a survey to ascertain students'
Information Systems Education Journal (ISEDJ) 13 (5) ISSN: 1545-679X September 2015
©2015 EDSIG (Education Special Interest Group of the AITP) Page 14 www.aitp-edsig.org /www.isedj.org
familiarity with Big Data concepts. A follow-up survey captured student feedback after students completed a homework assignment on the topic.
Volume, Velocity, Variety The terms volume, velocity, and variety have become synonymous with features of Big Data sets (Russom, 2011), (Laney, 2001; 2012) (Big Data 3 V's: Volume, Variety, Velocity (Infographic), 2013). Others have added Value and Veracity as additional V's of Big Data to
suggest that data is a company's important asset, and that a company's data must be accurate. Gartner analyst Doug Laney first described the
growth of large data sets in three dimensions:
volume (the amount of data generated), velocity (the rate at which data is generated), and variety (the different formats in which data can appear.) In 2001, as companies and consumers began to use the Internet for e-commerce, and nearly five years before the dawn of the Web as a social and collaborative platform, Laney (2001)
wrote:
While enterprises struggle to consolidate systems and collapse redundant databases to enable greater operational, analytical, and collaborative consistencies, changing economic conditions have made this job
more difficult. E-commerce, in particular,
has exploded data management challenges along three dimensions: volumes, velocity and variety.
With this historical context, students are ready
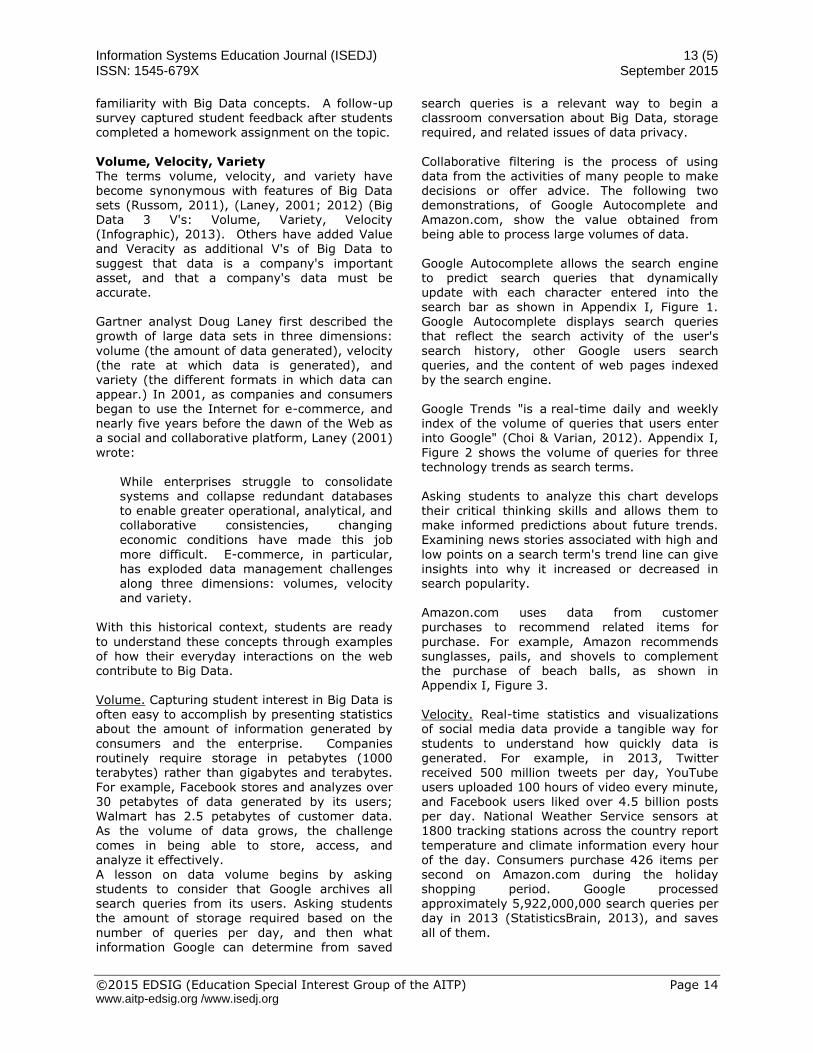
to understand these concepts through examples of how their everyday interactions on the web contribute to Big Data. Volume. Capturing student interest in Big Data is often easy to accomplish by presenting statistics about the amount of information generated by
consumers and the enterprise. Companies routinely require storage in petabytes (1000 terabytes) rather than gigabytes and terabytes. For example, Facebook stores and analyzes over
30 petabytes of data generated by its users; Walmart has 2.5 petabytes of customer data. As the volume of data grows, the challenge
comes in being able to store, access, and analyze it effectively. A lesson on data volume begins by asking students to consider that Google archives all search queries from its users. Asking students the amount of storage required based on the
number of queries per day, and then what information Google can determine from saved
search queries is a relevant way to begin a classroom conversation about Big Data, storage required, and related issues of data privacy.
Collaborative filtering is the process of using data from the activities of many people to make decisions or offer advice. The following two demonstrations, of Google Autocomplete and Amazon.com, show the value obtained from being able to process large volumes of data.
Google Autocomplete allows the search engine to predict search queries that dynamically update with each character entered into the search bar as shown in Appendix I, Figure 1. Google Autocomplete displays search queries
that reflect the search activity of the user's
search history, other Google users search queries, and the content of web pages indexed by the search engine. Google Trends "is a real-time daily and weekly index of the volume of queries that users enter into Google" (Choi & Varian, 2012). Appendix I,
Figure 2 shows the volume of queries for three technology trends as search terms. Asking students to analyze this chart develops their critical thinking skills and allows them to make informed predictions about future trends. Examining news stories associated with high and
low points on a search term's trend line can give
insights into why it increased or decreased in search popularity. Amazon.com uses data from customer purchases to recommend related items for
purchase. For example, Amazon recommends sunglasses, pails, and shovels to complement the purchase of beach balls, as shown in Appendix I, Figure 3. Velocity. Real-time statistics and visualizations of social media data provide a tangible way for
students to understand how quickly data is generated. For example, in 2013, Twitter received 500 million tweets per day, YouTube users uploaded 100 hours of video every minute,
and Facebook users liked over 4.5 billion posts per day. National Weather Service sensors at 1800 tracking stations across the country report
temperature and climate information every hour of the day. Consumers purchase 426 items per second on Amazon.com during the holiday shopping period. Google processed approximately 5,922,000,000 search queries per day in 2013 (StatisticsBrain, 2013), and saves
all of them.

Information Systems Education Journal (ISEDJ) 13 (5) ISSN: 1545-679X September 2015
©2015 EDSIG (Education Special Interest Group of the AITP) Page 15 www.aitp-edsig.org /www.isedj.org
In a business context, it is important for organizations to be able to analyze data that changes quickly in order to make good business decisions. "The Road," an IBM-produced video
describes the importance of data analytics, and poses the question:
"If you were to stand at a road, and the cars are whipping by, and all you can do is take a snapshot of the way the road looked five minutes ago, how would you know when to cross the road? 9 out of 10 organizations still
make decisions this way every day, using out of date information. The organizations that are the most competitive are the ones who are going to be able to make sense of what they learn as fast as they learn it."
(IBM, 2013)
To visualize data that changes quickly, consider TweetPing.net, shown in Appendix I, Figure 4. TweetPing is a visualization that illustrates the velocity of data generated by Twitter users. The real-time map becomes denser as more Tweets are processed and plotted. The app records the
location of origin, hashtags, mentions, and tracks total Tweets, words, and characters in each Tweet. Variety. Digital information may be represented and stored in a variety of formats that can be easily read and interpreted by both humans and computer programs.
While much data is structured, stored in rows and columns, unstructured data generally is more complex, and may include items such as Tweets, social media "likes" or updates, retina scans, Wikipedia articles, fingerprints, and facial
recognition features. This information usually does not originate in a format that is easily searchable or fit into relational database tables. Its growth in recent years has contributed to the development of new technologies for interacting with and processing unstructured Data. Students can investigate these sources of
unstructured data. For example, facial recognition is an up and coming technology that helps in crime fighting, advertising, and social networking. These applications process facial
data points and compare them to other faces stored in a database in order to produce appropriate content. For example, Facebook's
Deepface technology is accurate in recognizing faces 97% of the time, and is used to make suggestions of people to tag in photographs. In industry, digital advertising kiosks use cameras to scan the person looking at a monitor, and then display content appropriate to the person's
age and gender, as determined by facial recognition software.
To show that data is not always represented in neat rows and columns, the instructor searched dbPedia, a semantic database obtained from of Wikipedia, using Relfinder
(http://www.visualdataweb.org/relfinder.php). Relfinder uses data from dbPedia, an index of Wikipedia's text content stored in RDF (representational data format) format, to find relationships between seemingly unrelated topics (Exner & Nugues, 2012). RDF uses triples of values (object1, relationship, object2) to store
relationships between objects. Students can see that searching for relationships produces different results than searching plain text. In Appendix I, Figure 5, Relfinder shows commonalities between Madonna and Aretha
Franklin based on information in dbPedia.
Introducing Big Data Technologies Several new technologies take advantage of the distributed nature of large databases and parallel processing needed to process them quickly. Today’s students should at least be aware of the problems that technologies such as
Hadoop or MapReduce try to solve, so they might better succeed as 21st century IT professionals. "Choosing the best collaboration partners requires a good understanding of the technologies themselves, knowledge of the key solutions and solution types available in the marketplace, and general organizational skills
and knowledge related to technical resource
acquisition." (Topi, 2013, p. 13) Querying large datasets can be time consuming and costly without an appropriate hardware and infrastructure. The instructor provided a lesson
to students using Google BigQuery (Frydenberg, 2013). Google BigQuery is an easy to use technology that allows students to learn about distributed databases, SQL queries, and data mining. Google BigQuery is a query service for running SQL-like queries against multiple terabytes of data in seconds. It is one of
Google’s core technologies that has been used for data analytics tasks since 2006. Google BigQuery performs rapid SQL-like queries against online database tables, using the
processing power of Google's big data infrastructure. Google provides several large sample databases for querying, including
Shakespeare, birth and weather station information for use with BigQuery. Advanced users can upload their own databases (Sato, 2012). After a short demonstration of BigQuery in the
classroom, the instructor distributed a tutorial handout for students to follow (Frydenberg,

Information Systems Education Journal (ISEDJ) 13 (5) ISSN: 1545-679X September 2015
©2015 EDSIG (Education Special Interest Group of the AITP) Page 16 www.aitp-edsig.org /www.isedj.org
Drinking from the Fire Hose: Tools for Teaching Big Data Concepts in the Introductory IT Classroom, 2013) working in small groups, where students took on the roles of reader,
doer, and checker (Frydenberg, Flipping Excel, 2013) to complete the assignment. Appendix I, Figure 6 shows details about the public natality (birth) database, which has 137,826,763 rows, and takes up 21.9 GB of storage. It provides birth information from 1969
through 2008. Appendix I, Figure 7 shows a Google BigQuery query to display the average age of birth mothers grouped by year and state.
(Programmable Web, 2012) It took Google
BigQuery 2 seconds to process 2.5 GB of information when performing this query, which results in 1840 rows retrieved and summarized from the table. After performing the query in Google BigQuery, students can use a BigQuery Connector tool
from https://bigquery-connector.appspot.com/ to import the results into Excel for further analysis. Appendix I, Figure 8 shows a pivot table report in Excel summarizing average age of birth mothers grouped by state during this period. Spark lines provide a handy visualization of this data.
Examining the spark lines clarifies the trend that mother ages has increased during the years for which data is available. Performing the analytics and visualization in Excel (or any other client side data visualization tool) is not nearly as
computationally intensive as processing 21.9 GB of data in the original online database.
4. METHODOLOGY Students in seven sections of an introductory IT course received a presentation demonstrating
velocity, variety, and volume as described here, as well as a hands-on activity using Google BigQuery as described in the previous section. They completed questionnaires before and after
so the study could ascertain the development of their understanding of Big Data.
166 students (64 female, 102 male) voluntarily completed a survey prior to the lesson on Big Data; 160 students (64 female, 96 male) completed the survey after the lesson. The first set of questions, shown in Appendix I,
Figure 9, asked about awareness of big data and other current technology developments. It is
interesting to note that while student awareness of technology developments was at about 60%, relatively few students agreed that they were familiar with "big data" before the exercise. This
number nearly doubled after the lesson. Many were aware of social networking sites as a popular source of online data. Responses were provided in a 5-point Likert scale (from strongly disagree to strongly agree).
Students before and after the lesson responded
similarly about their familiarity with technology news and developments, and as expected, the number of students "familiar with the phrase 'Big Data'" increased after the lesson.
After the lesson, students were asked two
additional questions related to the relevance of data analysis and Big Data, as shown in Appendix I, Figure 10. The majority of students agreed or strongly agreed that it is important to know how to analyze and interpret data, and that Big Data is
a relevant topic that will impact their own lives as digital students. Students commented on aspects of the lesson that they found helpful, as shown in Appendix I, Figure 11. The demos for velocity, volume and variety, and using Google Big Query, and instructing students
about the role of Social Media in generating Big
Data were the most useful elements of the lesson. This is likely because of the hands-on experience with these tools that makes the topic relevant for students.
When asked what students learned about Big Data, in addition to their new awareness of Big Data technology concepts, their responses also touched on social and privacy concerns. Said one student: "Big Data has become a part of our everyday lives. It is tracing our locations
through our phones and we constantly leave paths through various social media sites." Another student commented, "Every move we make seems to be recorded and every human
being is leaving a data trail that will be there after the human being is long gone."
About learning Big Data concepts in a general education introductory technology course, one student commented, "I found the presentation quite informative, and appreciated the exposure to material, particularly the Google applications of which I was not previously aware. I believe
the content was relevant, crucial and necessary in what many would consider the 'technological

Information Systems Education Journal (ISEDJ) 13 (5) ISSN: 1545-679X September 2015
©2015 EDSIG (Education Special Interest Group of the AITP) Page 17 www.aitp-edsig.org /www.isedj.org
age,' and I have begun to realize that informing myself of news and materials in this field may prove beneficial, if not necessary." Others wrote that they "had never heard about Big Data
specifically and [are] now very interested in the topic."
5. SUMMARY
Both consumers and the enterprise make use of collaborative tools, social networking sites,
Internet-connected devices, and online transactions that produce large quantities of data every day. Big Data offers new challenges and technologies for storing, accessing, and processing large sets data as fast as it is being
generated.
This paper presents a lesson for introductory students to learn about Big Data concepts and technologies. It offers relevant examples of Volume, Velocity, and Variety of Big Data, and outlines a hands-on experience querying an online database with Google BigQuery, and then
using Excel to create a visualization of the selected data. By considering social media, commerce, and public databases, students can gain exposure to Big Data concepts and technologies in their introductory IT course.
6. REFERENCES
Big Data 3 V's: Volume, Variety, Velocity
(Infographic). (2013, July 25). Retrieved January 10, 2014, from What's the Big Data?:
http://whatsthebigdata.com/2013/07/25/big-data-3-vs-volume-variety-velocity-infographic/
Boyd, d., & Crawford, K. (2011). Six
Provocations for Big Data. A Decade in Time: Symposium on the Dynamics of the Internet and Society (p. 17). Oxford Internet Institute.
Choi, H., & Varian, H. (2012). Predicting the
Pressent with Google Trends. Economic Record, 88(1), 2-9.
Exner, P., & Nugues, P. (2012). Entity
extraction: From unstructured text to
DBpedia RDF triples. The Web of Linked Entities Workshop (WoLE).
Frydenberg, M. (2013). Drinking from the Fire
Hose: Tools for Teaching Big Data Concepts
in the Introductory IT Classroom. The
Proceedings of the Information Systems Education Conference. San Antonio, TX. Retrieved from http://proc.isecon.org/2013/workshops/267
4.html
Frydenberg, M. (2013). Flipping Excel. The
Proceedings of the Information Systems Education Conference. San Antonio, TX.
Retrieved from http://isedj.org/2013-11/N1/ISEDJv11n1p63.html
Frydenberg, M., & Andone, D. (2011). Learning
for 21st century skills. 2011 International
Conference on Information Society (i-Society). London: IEEE.
Google. (n.d.). Google Trends. Retrieved from
http://google.com/trends
Grossniklaus, M., & Maier, D. (2012, March).
The curriculum forecast for Portland: cloudy with a chance of data. ACM SIGMOD Record, 44(1), pp. 74-77.
IBM. (2013, May 10). The Road: Intelligent
Data Management and Analytics. Retrieved January 10, 2014, from Daily Motion: http://www.dailymotion.com/video/xdaoae_i
bm-commercial-the-road-intelligent_tech
King, B. R., & Satyanarayana, A. (2013).
Teaching Data Mining in the Era of Big Data. 2013 ASEE Annual Conference. King, B. R.,
& Satyanarayana, A. Teaching Data Mining in the Era of Big Data. In 2013 ASEE Annual Conference. http://www.asee.org/public/conferences/20/papers/7580/view.
Laney, D. (2001). 3D Data Management:
Controlling Data Volume, Velocity, and Variety. Application Delivery Strategies Metagroup.
Laney, D. (2012, January 14). Deja VVVu:
Others Claiming Gartner’s Construct for Big Data. Retrieved January 1, 2014, from Doug Laney: http://blogs.gartner.com/doug-laney/deja-vvvue-others-claiming-gartners-
volume-velocity-variety-construct-for-big-data/
Manyika, J., Chui, M., Bughin, J., Dobbs, R.,
Roxburgh, C., & Byers, A. H. (2011, May).
Big data: The next frontier for innovation, competition, and productivity. Retrieved

Information Systems Education Journal (ISEDJ) 13 (5) ISSN: 1545-679X September 2015
©2015 EDSIG (Education Special Interest Group of the AITP) Page 18 www.aitp-edsig.org /www.isedj.org
January 1, 2014, from McKinsey and Company: http://www.mckinsey.com/insights/business_technology/big_data_the_next_frontier_for
_innovation
O'Reilly, T. (2005, September 30). What is Web
2.0: Design Patterns and Business Models for the Next Generation of Software.
Retrieved from O'Reilly Web 2.0: http://oreilly.com/pub/a/web2/archive/what-is-web-20.html?page=1
Programmable Web. (2012, August 29). Three
Techniques for Visualizing Data from Google BigQuery. Retrieved from Programmable
Web: http://www.programmableweb.com/news/th
ree-techniques-visualizing-data-google-bigquery/how-to/2012/08/29
Russom, P. (2011). Big Data Analytics. Renton,
WA: The Data Warehousing Institute.
Sato, K. (2012). Retrieved from An Inside Look
at Google BigQuery: https://cloud.google.com/files/BigQueryTechnicalWP.pdf
StatisticsBrain. (2013). Google Annual Search
Statistics. Retrieved from StatisticBrain.com: http://www.statisticbrain.com/google-searches/
Topi, H. (2013, March). Where is big data in
your information systems curriculum? ACM Inroads, 12-13.
Editor’s Note:
This paper was selected for inclusion in the journal as an ISECON 2014 Distinguished Paper. The acceptance rate is typically 7% for this category of paper based on blind reviews from six or more peers including three or more former best papers authors who did not submit a paper in 2014.

Information Systems Education Journal (ISEDJ) 13 (5) ISSN: 1545-679X September 2015
©2015 EDSIG (Education Special Interest Group of the AITP) Page 19 www.aitp-edsig.org /www.isedj.org
Appendix I
Figure 1. Google Autocomplete.
Figure 2. Google Trends.
Figure 3. Big Data allows Amazon to make purchase recommendations.

Information Systems Education Journal (ISEDJ) 13 (5) ISSN: 1545-679X October 2015
©2015 EDSIG (Education Special Interest Group of the AITP) Page 20
www.aitp-edsig.org /www.isedj.org
Figure 4. TweetPing is a Twitter visualization in real-time.
Figure 5. Relfinder determines relationships from text data stored in RDF format.

Information Systems Education Journal (ISEDJ) 13 (5) ISSN: 1545-679X October 2015
©2015 EDSIG (Education Special Interest Group of the AITP) Page 21
www.aitp-edsig.org /www.isedj.org
Figure 6. Details and sample natality information from Google BigQuery.
Figure 7. Query and Results with Google BigQuery.

Information Systems Education Journal (ISEDJ) 13 (5) ISSN: 1545-679X October 2015
©2015 EDSIG (Education Special Interest Group of the AITP) Page 22
www.aitp-edsig.org /www.isedj.org
Figure 8. Creating a visualization using a pivot table and sparklines (column AQ) in Excel.
Figure 9. Big Data awareness.

Information Systems Education Journal (ISEDJ) 13 (5) ISSN: 1545-679X October 2015
©2015 EDSIG (Education Special Interest Group of the AITP) Page 23
www.aitp-edsig.org /www.isedj.org
Figure 10. Student Perception of Relevance of Big Data
Figure 11. Student reaction to aspects of the Big Data lesson.