Embed Size (px)
Citation preview

UNICEF Malaysia Working Paper Series
WP/2017/002
Introducing and Costing a Child Grant in Malaysia
A Step Forward for Socially Inclusive and Economically Productive Malaysia
Dr. Amjad Rabi, Altaf Deviyati, Pashmina Naz Ali, and Erica Mattellone
UNICEF Malaysia Country Office
August 16, 2017

Introducing and Costing a Child Grant in Malaysia A Step Forward for Socially Inclusive and Economically Productive Malaysia
© United Nations Children’s Fund (UNICEF), Malaysia (2017)
Wisma UN, Second Floor, Block C
Kompleks Pejabat Damansara
Jalan Dungun, Damansara Heights
50490, Kuala Lumpur, Malaysia
August 2017
This is a working document. It has been prepared to facilitate the exchange of knowledge and to
stimulate discussion. The text has not been edited to official publication standards and UNICEF
accepts no responsibility for errors.

Introducing and Costing a Child Grant in Malaysia A Step Forward for Socially Inclusive and Economically Productive Malaysia
Dr. Amjad Rabi, Altaf Deviyati, Pashmina Ali, and Erica Mattellone
UNICEF Malaysia Country Office
August 16, 2017

2 | P a g e
TABLE OF CONTENTS
1. RESULTS SUMMARY AND POLICY RECOMMENDATIONS .............................................................................. 4
1.1. RESULTS SUMMARY AND DISCUSSIONS .............................................................................................. 4
1.2. WHY INVESTING ON EARLY CHILDHOOD GRANT ................................................................................ 5
2. INTRODUCTION ............................................................................................................................................. 7
2.1. STUDY OBJECTIVE AND OVERVIEW ..................................................................................................... 7
2.2. SOCIAL PROTECTION: DEFINITIONS ..................................................................................................... 7
2.3. GLOBAL PERSPECTIVE OF SOCIAL PROTECTION .................................................................................. 8
2.4. GOVERNMENT COMMITMENTS AND ENGAGEMENT IN SOCIAL PROTECTION ................................... 9
3. SOCIOECONOMIC BACKGROUND ............................................................................................................... 12
3.1 DEMOGRAPHIC PROFILE .................................................................................................................... 12
3.2 CHILD POVERTY ................................................................................................................................. 16
4. INTEGRATED SOCIAL PROTECTION SYSTEM: FRAMEWORK AND IMPACT .................................................. 19
4.1. FRAMEWORK ..................................................................................................................................... 19
4.2. TARGETING, BENEFIT PARAMETERS, AND CONDITIONALITY ............................................................ 20
5. COSTING THE SYSTEM OF CASH TRANSFERS............................................................................................... 22
5.1. PROJECTION METHODOLOGY ............................................................................................................ 22
5.2. PROJECTION OF THE DETERMINANTS OF SOCIAL PROTECTION........................................................ 22
5.3. PROJECTION OF THE CHILD GRANT ................................................................................................... 23
6. MONITORING, EVALUATION, AND LEARNING ............................................................................................ 26
6.1. BASELINE AND FOLLOW-UP SURVEYS ............................................................................................... 26
6.2. EVALUABILITY ASSESSMENT .............................................................................................................. 27
6.3. PROGRAM MONITORING AND REPORTING ...................................................................................... 27
6.4. EVALUATION AND LEARNING ............................................................................................................ 28
REFERENCES .......................................................................................................................................................... 30
ANNEX 1 - COSTED MONITORING, EVALUATION AND LEARNING PLAN .............................................................. 32
3 | P a g e
LIST OF TABLES
Table 1: Summary Results from the Projection of Costs and Number of Beneficiaries ......................... 5
Table 2: Population in Million, from Independence 1957 to 2050 ....................................................... 14
Table 3: Benefit Parameters of the Proposed Income Security Package .............................................. 21
Table 4: Population Projection (Medium Variant) Main Characteristics, 2017-2030 .......................... 22
Table 5: Coverage Rates Projection Assumptions ................................................................................ 23
Table 6: Costing Results: Number Beneficiaries in thousands, 2017-2030 .......................................... 24
Table 7: Costing Results: Overall Cost in in Billion RM, Percentage of GDP, and Percentage of
Government Expenditure ...................................................................................................................... 24
LIST OF FIGURES
Figure 1: Major Components of Social Protection ................................................................................. 7
Figure 2: Total Fertility Rates, 1957 – 2050 ......................................................................................... 12
Figure 3: Life Expectancy in years (left graph) and Under 5 Mortality, Deaths per 1000 lives, 1950-
2050 ...................................................................................................................................................... 12
Figure 4: Population Pyramid, 1980 - 2050 .......................................................................................... 13
Figure 5: Number of Dependents per 100 Persons of Working Age (15-64), 1950-20100 .................. 14
Figure 6: Population Growth Rates by Major Age Groups, per cent, and Demographic Window of
Opportunity (start and end period), 2000-2100 .................................................................................... 15
Figure 7: Post-Working Population as Percent of Total Population, 1950-2050 ................................. 15
Figure 8: Absolute Poverty Rate by Age Groups, 2009, 2014 .............................................................. 17
Figure 9: Relative Poverty in OECD countries and Malaysia, 2014 .................................................... 17
Figure 10: the UN adopted Social Protection Floor .............................................................................. 19
Figure 11: Projection Model Components and Dependency Structure ................................................. 22
Figure 12: Macroeconomic Model’s Assumptions- GDP Growth Rate and CPI Rate ......................... 23

4 | P a g e
1. RESULTS SUMMARY AND POLICY RECOMMENDATIONS
1.1. Results Summary and Discussions
This rapid exercise illustrates the affordability of introducing a Child Grant in Malaysia that is based
on the inclusive lifecycle approach. The study uses a range of cost scenarios to build evidence and
concrete figures to allow policy makers to better assess opportunities and potential challenges while
considering the benefit parameters (i.e. benefit level, indexation, age cut-off). It is hoped that this study
will initiate a broader discussion with stakeholders to arrive at policy recommendations to better
respond to such opportunities and challenges.
In theory, targeting resources to only those who need them most is the most efficient way of disbursing
social transfers. However, from accumulated experience across many countries, poverty targeting tends
to stigmatize the poor, be administratively challenging to manage, vulnerable to being misused, socially
divisive, and politically contentious. Given the level of development of Malaysia and its aspiration to
reach a developed-nation status and socially inclusive society, the study argues to move away from the
charity-model (poverty targeting), into a more inclusive and coherent social protection system. For the
Child Grant proposed, the use of universal approach (categorical targeting) is proposed as a more
appropriate targeting mechanism in Malaysia. The selection of categories is based on their correlation
with poverty and other sought developmental outcomes such as nutrition and social cohesion. For
instance, poverty in Malaysia has a clear age dimension. The proportion of children in poverty is
higher than the proportion of working age adults or elderly, and this has been observed in the last
three household income surveys since 2009. Selecting this group makes a lot of sense as an effective
targeting approach. An alternative option would be one that goes from pregnancy to 2 years (1000 days).
The rationale for such a model would be that this is the most vulnerable phase in an infant’s life, would
support women during pregnancy and breastfeeding periods, and that a shorter time period would make
way for higher benefit amounts, which would enable a more tangible contribution to the household
income. The coverage of total children will reduce and cost will also be reduced. A combination with
both options (under five or 1000 days) may include an option where the benefit is introduced for the
1000-days and over time, age cut-off can be increased to cover up to five years of age.
Number of right-claimers and costs of these options are summarized below (more details included in
subsequent sections).

5 | P a g e
Table 1: Summary Results from the Projection of Costs and Number of Beneficiaries
Eligibility
2017
Monthly
Amount
(MR)
Number of Beneficiaries (in
thousands)
Expenditure
(% of GDP)
2017 2021 2031 2017 2021 2031
1000 Days (From Pregnancy
until Under 2)
150
1,286.37 1,227.93
1,201.54 0.17% 0.13% 0.08%
200 0.23% 0.18% 0.11%
Under 5
150
2,082.19 2,074.4
2,040.32
0.34% 0.28% 0.17%
200 0.45% 0.37% 0.23%
1.2. Why Investing on Early Childhood Grant
As discussed, the period of greatest vulnerability for the survival and development of the child is from
pre-birth to five-years, and within that the period as a foetus and the first two years (UNICEF 2011).
The proposed Child Grant would be mainly to help ensure that the mother has resources for her own
better nutrition, to cover pregnancy-related health or social expenditures, and to be able to afford
additional rest during her pregnancy, post-partum and during breastfeeding by outsourcing some of her
work burden. As discussed earlier, poverty is positively correlated with age groups e.g. childhood.
Targeting this group injects income to the households’ budget and support reduction of poverty. More
importantly, to break the cycle of becoming academically and economically disadvantaged later in life,
investing in a child’s early years through a preventative approach reduces the risk of poverty and social
exclusion in the long run. More specifically, investing in the first 1000 day for a child, results in long-
term impact. Robust evidence suggests that investments within this window can be crucial in the
prevention of child undernutrition, overweight, and poor child development outcomes with long-lasting
effects on human capital formation (Black, 2013). Research has shown that school-age children who
suffered from an episode of severe acute malnutrition in the first few years of life had poorer IQ levels,
cognitive function, and school achievement, as well as greater behavioral problems compared to
matched controls or siblings who were never malnourished (Prado & Dewey , 2012). Longitudinal
studies have consistently shown that children who were stunted in the first 2 years of life continued to
show deficits in cognition and school achievement from age five-years to adolescence (Prado & Dewey
, 2012).
Currently in Malaysia, the prevalence of stunting in children 0-5 years of age is 17.7 percent (Ministry
of Health, 2017), which is just slightly below the 20 percent threshold indicating a public health concern.
The prevalence of wasting is high in Malaysia at 8 percent which indicates a serious public health
concern (Ministry of Health, 2017). From a development’s perspective, both the prevalence of stunting
and wasting results in a significant loss in terms of productivity. In one estimate, undernutrition was

6 | P a g e
found to reduce a nation’s economic advancement by at least 8 percent as a result of direct productivity
losses, losses via poorer cognition, and losses via reduced schooling (Black, 2013, pp. 9-10).
The proposed cash grant can also be viewed as a measure to off-set some of the welfare loss resulted
from the recent introduction of the consumption tax, the GST. A coherent social cash transfer program
that ultimately results in an income transfer from the rich to the poor can play a significant role as an
economic stimulus to foster economic growth. This is due to the fact that poor households have a high
marginal propensity to consume. The additional incomes poor households receive (from the program
or other sources) are essentially spent on basic necessities, whereas the incremental reductions to the
incomes of richer households as a result of financing the benefit from taxes, are not expected to reduce
their consumption with the commensurate amount. This gives a rise to a multiplier effect: the increased
consumption resulting from the benefit, leads to increased incomes of local producers and service
providers, which further leads to increased consumption, etc.

7 | P a g e
2. INTRODUCTION
2.1. Study Objective and Overview
The objective of the study is to offer to the Government of Malaysia a set of strategies and options
regarding the integration of a social protection benefits in light of the Government’s vision of a
consolidated and coherent social protection system. The proposed interventions are in line with
UNICEF’s agenda of promoting social protection and child-sensitive policy-making, directly building
on the United Nations Convention on the Rights of the Child (CRC) and the ILO Recommendation on
Social Protection Floors, as well as national-level commitments in Malaysia. Specifically, this study
attempts to identify and propose a set of Social Protection interventions and conduct a costing exercise
for the proposed interventions until 2030 in order to provide evidence and concrete figures on cost
development under different scenarios. In doing so, the study analyses the underlying demographic,
inflation, and economic growth environment in Malaysia, which established the need and opportunities
for country-specific social sector investments that are pro-demographic profile and promote
macroeconomic stability. Ultimately, this study is hoped to shed lights on opportunities and challenges
and initiate a broader discussion with stakeholders to arrive at policy recommendations to better respond
to such opportunities and challenges.
2.2. Social Protection: Definitions
Definitions and terminology used in discussing social protection have evolved over time and tend to
differ slightly among different schools of thought. Social protection is generally understood as the
combination of social insurance – (i.e. contributory forms of social provisioning) and social assistance
(i.e. transfers which cover wide chapters of the population), and are generally funded from public
sources (ILO 2012) (see figure 1). A broader understanding refers to social protection as the set of public
and private policies and Programs aimed at preventing, reducing and eliminating economic and social
vulnerabilities to poverty and deprivation (UNICEF 2012). A life-cycle approach posits social
protection in the three phases of life - infant and childhood, adulthood and working life, and old age -
with access to health services as a component accompanying all three phases. This framework is used
in the social protection floors initiative adopted in ILO Recommendation 202 a (ILO 2012).
Figure 1: Major Components of Social Protection
Source: Based on the ILO definition of Social Protection (ILO 2012)

8 | P a g e
One can identify a range of instruments of social protection:
� Social cash transfers;
� Programs to ensure economic and social access to education, health, water and sanitation and
other social services;
� Social support services such as care facilities;
� Legislation and policies to ensure child rights, equity and non-discrimination in children’s and
families’ access to services and employment/livelihoods (UNICEF 2012).
The Child Grant discussed in this study falls under the social cash transfer component. Social cash
transfers are defined as flows of money to households to alleviate household poverty, hunger or
malnutrition, and achieve other social outcomes. The grants are generally designed to address income
insecurity, avert or protect from risk, and give greater freedom of choice in consumption decisions.
2.3. Global Perspective of Social Protection1
Some form of universal social protection coverage has been in place in most higher-income countries
since the 1950s, in the context of their post- World War II welfare state arrangements (Esping-Andersen
1990). While most low income countries have featured social security for the formal sector since their
independence, broader forms of social protection covering rural populations and the informal economy
was introduced in waves. The Latin American examples of large-scale Programs such as Bolsa Familia
(the Family Grant) in Brazil, and Oportunidades (opportunities) program in Mexico have been in place
in various forms since the 1990s, as a response to cushion the economic and social impacts of structural
adjustment Programs . Moreover, at the time, beyond its role as a safety net, social protection was
presented as a macroeconomic stabilizer, with the argument that the higher propensity to consume of
lower income quintiles would increase aggregate demand and revitalize an economy in recession. The
introduction or upgrading of social protection as crisis responses was the first wave. Recently, the
discourse has moved on into a more normative mode, with progressive governments, Civil Society
Organizations, academics and multilateral agencies make a case for social protection from a rights-
based angle.
At the global level, many of the multilateral agencies have been promoting the right to social protection.
In 2012, the ILO annual conference adopted the Recommendation on the Social Protection Floors (R
202), which is now being vetted in numerous countries (ILO 2012). It uses the life cycle approach.
Many analysts and advocates have shown how child-oriented social protection is particularly important
(see box 1). Other notable examples include the work of the Special Rapporteurs of the Office of the
High Commissioner on Human Rights (Sepulveda and Nyst 2012; Alston 2014), and the policy
positions of the ADB (Handanyani 2010; ADB 2013; ESCAP 2011a). Most multilateral agencies have
social protection strategies in place (UNICEF 2012a; World Bank 2012; European Commission 2012).
1 Citation in this section is from Koehler 2014c unless stated otherwise.

9 | P a g e
Two additional challenges are shaping the social protection agenda. One is the intensifying impact of
climate change and civil conflict, which result in complex emergencies. Social protection in the form
of transfers to displaced populations is increasingly important, and in many countries, social protection
includes an emergency fund for social assistance that can come into play quickly if needed.
The second globally recognized challenge stems from the increasingly disparities in-country income
and wealth disparities (Milanovic 2010; Ortiz, Chai and Cummins 2011; Piketty 2014). If social
protection expenditures are covered from national taxation revenues, and have a pro-poor expenditure
bias, they can serve to shift income from the higher to lower income quintiles. There are also proposals
for a dedicated fund to jump-start social protection in low-income countries, financed from special
forms of funding in rich countries. In that format, social protection could take on a redistributive
function.
BOX 1 Child-related Social Protection Social protection is a strategic and essential tool in helping children and their families fulfil their rights and in expanding their opportunities to reach their full potential. However, across the world, children and families with children are at great risk of income poverty and multidimensional poverty. Many of the 18,000 children who die every day across the world could survive if adequate social protection were in place (UNICEF 2014; ILO 2014). The life-cycle approach to social protection is therefore particularly relevant. For example, at the global norm-creating level, the ILO Recommendation 202 on social protection floors posits income security for children as a core point, with the objective being to ensure access to nutrition, education, care, health services, and other goods and services (ILO 2012). Minimum income security is understood as related to a life in dignity, and is to correspond to at least national poverty lines. Another principle is universality, meaning that income security refers to all children resident in a country, as per the commitment of the CRC (ILO 2014). Child-relevant social protection can come in various formats – free access to social services or school meals, monetary family benefits, or child grants. Currently, 108 countries have in place specific child or family benefit legislation (ILO 2014). Public expenditure on child-related social protection measures are estimated at 0.4 per cent of GDP worldwide, average 0.2 per cent of GDP in Asia and the Pacific, and reach as much as 3 to 4 per cent in Europe (ILO 2014). In Western Europe, Australia and Canada, and in Mongolia, the schemes are universal (ILO 2014). Evidence from various studies and evaluations shows that social protection benefits have resulted in better nutritional status, an increase in the use of health services, including for ante- and post-natal care, higher school enrolment, and to a lesser extent to better outcomes on school performance. Child-sensitive social protection, therefore, considers different dimensions of children’s well-being and addresses “the inherent social disadvantages, risks and vulnerabilities children may be born into, as well as those acquired later in childhood” (UNICEF 2014)
2.4. Government Commitments and Engagement in Social Protection
Social protection is an important policy tool for the realization of human security and achieving equity
and social justice. Building on the Universal Declaration of Human Rights, the CRC posits the right to
social protection for children in its Article 26:

10 | P a g e
1. “States Parties shall recognize for every child the right to benefit from social security, including
social insurance, and shall take the necessary measures to achieve the full realization of this
right in accordance with their national law.
2. The benefits should, where appropriate, be granted, taking into account the resources and the
circumstances of the child and persons having responsibility for the maintenance of the child,
as well as any other consideration relevant to an application for benefits made by or on behalf
of the child.”
CRC Article 27 corroborates this, arguing that
2. “States Parties recognize the right of every child to a standard of living adequate for the child's
physical, mental, spiritual, moral and social development.
3. States Parties, in accordance with national conditions and within their means, shall take
appropriate measures to assist parents and others responsible for the child to implement this
right and shall in case of need provide material assistance and support Programs, particularly
with regard to nutrition, clothing and housing.”
Other CRC articles that support the child right to Social Protection include: CRC 18, 19, 24, 28, and
32.
In the 11th Malaysian Development Plan 2016-2020, human capital development was identified as a
critical enabler for driving and sustaining Malaysia’s economic growth and supporting the transition of
all economic sectors towards sustainable and inclusive economy (Economic Planning Unit, 2016).
Evidence is clear, as discussed later, on the relationship between investment in the first 1000 days in
life and cognitive capital (and therefore more productive labor force). Malaysia has a range of public
social protection arrangements including contributory and non-contributory schemes. The contributory
schemes, which cover the formal social protection schemes include the Civil Service Pension Scheme,
the Employees Provident Fund (EPF), the Social Security Organisation (SOCSO), the Armed Forces
Fund (LTAT) and the Workers’ Compensation Scheme. Non-contributory arrangements, or social
assistance, are administered by the Ministry of Women, Family, and Community Development, which
usually poverty-targeted (means-tested) (Sim, 2010). In 2012, the government introduced the Bantuan
Rakyat 1 Malaysia (BR1M) program, which is very large social assistance program that provides a one-
off payment to households with monthly income of less than RM3000. In addition to public schemes,
Zakat, the Islamic welfare institution, collects and distributes cash and in-kind assistance to specified
list of qualified recipients at states level (Ragayah H.M.Z, 2002).
As Malaysia moves towards high income nation status, Malaysia should move away from the charity-
model (poverty targeting) into a more inclusive system when addressing the issue of poverty.
Discussions have been ongoing to consolidate the existing protection measures. Such plans and efforts
to create an effective social protection are aligned with the Sustainable Development Goals (SDGs).
Specifically, they will contribute to achieving the third target of SDG 1 (the complete elimination of
extreme poverty in the world through the establishment of social protection systems and measures for
11 | P a g e
all), SDG 8 (sustained, shared and sustainable economic growth; full, productive employment and
decent work for all), and SDG 10 (the reduction of inequalities between countries and within them).
It is important to underline that social protection is a cross-sectorial issue for children. Social protection
can play a key role in addressing some of the barriers that stand in the way of ensuring child rights and
improving children’s wellbeing (UNICEF 2012). From a child-rights commitment, social protection
needs to be child-sensitive and therefore prioritize measures that directly or indirectly impact children,
especially young children. This is because children face age-specific vulnerabilities that differ from
those of adults (ILO 2014). These include the fact that child needs for nutrition and intellectual and
emotional stimulation cannot be postponed, and if these rights and requirements are not met, the
negative impact is irreversible. This fact is coupled with the observation that children tend to be over-
represented among the poor in Malaysia as we discuss later.
The interests of children, therefore, require special attention during the process of designing or re-
designing of the country’s social protection system. Moreover, by reaching out to those who are
economically and socially excluded, social protection complements and underpins sector interventions
in health and nutrition, education, water and sanitation, child protection including issues around children
in conflict and child labor, HIV/AIDS and other areas. It can thus reinforce support to child rights,
improve outcomes and increase equity for children, while at the same time supporting social justice and
national cohesion (UNICEF 2012).

12 | P a g e
3. SOCIOECONOMIC BACKGROUND
3.1 Demographic Profile
According to the 2015 revision of the World Population Prospects, Malaysia’s population was estimated
to have reached 31.164 million in 2017. Over the last 10 years, Malaysia’s population grew at a rate
averaged 1.53 percent annually, which is higher than that of South East Asia (1.178 per cent). By 2050,
the growth rate will still be positive at 0.39 percent, but will switch signs as population is projected to
start declining by 2070 (UN, 2016).
The pattern of declining natural population growth (excluding migration) can be explained by two
underlying factors: fertility rates and mortality rates. Since independence of 1957, Total Fertility Rate
(TFR) decreased by almost 70 percent, from 6.1 children per woman to 1.97 children per woman in
2017. It is expected to decline further and reach 1.73 children per woman by 2050 (UN, 2016).
Figure 2: Total Fertility Rates, 1957 – 2050
Source: Based on data from (UN, 2016)
The second factor, the mortality rate, has shown improvement over the same period. The Under-Five
mortality rate declined significantly from a rate of 111.2 deaths per 1,000 live births in 1957 to 8.06
deaths per 1,000 live births in 2017. Life expectancy at birth, therefore, increased steadily and reached
72.9 years as of today, a 15 years increase since independence. It is expected to increase further and
add 8 more years by 2050 (UN, 2016).
Figure 3: Life Expectancy in years (left graph) and Under 5 Mortality, Deaths per 1000 lives, 1950-2050

13 | P a g e
Source: Based on data from (UN, 2016)
In additional to the natural population change (fertility and mortality), net migration has also shaped a
key feature of Malaysia’s demographic characteristics. Latest available data on international migrant
stocks estimated that the international migrant stock constituted 8.3 percent of the total population as
of 2013, significantly higher than regional comparators (UN, 2016).
Combining these factors together (fertility, mortality, and migration), Malaysia’s population is expected
to grow, but at a decreasing rate, until 2070, a year will mark the beginning of declining population for
the first time in Malaysia’s history. However, it has seen significant changes in its population structure.
As of 2017, the mean characteristic of the Malaysia’s population is its broad middle section of its
population pyramid, providing favorable demographic profile for the labor market.
Figure 4: Population Pyramid, 1980 - 2050
Source: Author’s calculation based on data from UN (2016)
The population dynamics discussed earlier has three main potential consequences:
� While population growth will continue to increase over the next few decades, number of
children will decrease.

14 | P a g e
Table 2: Population in Million, from Independence 1957 to 2050
Source: Based on data from (UN, 2016)
The likelihood of steady and possibly increased population growth, despite the declining
fertility rate can be explained by a phenomenon called the “demographic momentum,” which
occurs due to the fact that more women are in their reproductive years.
� The reduction in young dependency ratio (the ratio of children under 15 years of age per
working-age person) will be taken over by the rapid increase by the old-age dependency ratio
(the ratio of elderly over 65 year-old per working-age person). In fact, the year 2050 will mark
a point when old-age dependency ration will exceed that of young dependency ratio for the first
time in Malaysia (in other words, elderly over 65 years-old will exceed pre-working age
population age 15 and below).
Figure 5: Number of Dependents per 100 Persons of Working Age (15-64), 1950-20100
Source: Author’s calculation based on data from UN (2016)
� While up to this point Malaysia has enjoyed a favourable demographic profile started in 1965,
during which the working-age population expands at a higher rate than the general population,
the country is now a few years away of the end of this favourable demographic period, widely
referred to as the “demographic window of opportunity”, since the expansion of the working-
age population, and the concomitant enlargement of the labor force, can present a favourable

15 | P a g e
condition for sustained economic growth path if the country create sufficient jobs to absorb the
rapid entry to the labor marker as Malaysia indeed did successfully.
Figure 6: Population Growth Rates by Major Age Groups, per cent, and Demographic Window of Opportunity (start and end period), 2000-2100
Source: Author’s calculation based on data from UN (2016)
� As a result of falling fertility rate and longer life expectancy, Malaysia’s population has been
aging at a very high pace than that of other countries. The author’s calculation indicates that
Malaysia will be considered as an ‘aging nation’, defined when post working population (65+)
constitute 7 percent of the total population, by 2020. It will reach an ‘aged nation, defined when
post working population (65+) constitute 14 percent of the total population by 2045.
Figure 7: Post-Working Population as Percent of Total Population, 1950-2050

16 | P a g e
Source: Author’s calculation based on data from UN (2016)
3.2 Child Poverty
Malaysia is among the leaders in developing countries that have made sustained and rapid progress
in tackling poverty and improving the quality of life of the population (UNDP, 2013). Between
1970 and 2014, the incidence of absolute poverty decreased from almost 50 percent of the population
in the 1970s to only 0.6 percent in 2014 (Economic Planning Unit, 2015). More recent decrease in the
incidence of poverty was also coupled with an overall income distribution improvement. Gini
coefficient declined from 0.441 in 2009 to 0.401 in 2014. Mean monthly household income of the
bottom 40 percent of the households’ income group increased at higher rate than the income of the
overall population (Economic Planning Unit, 2016).
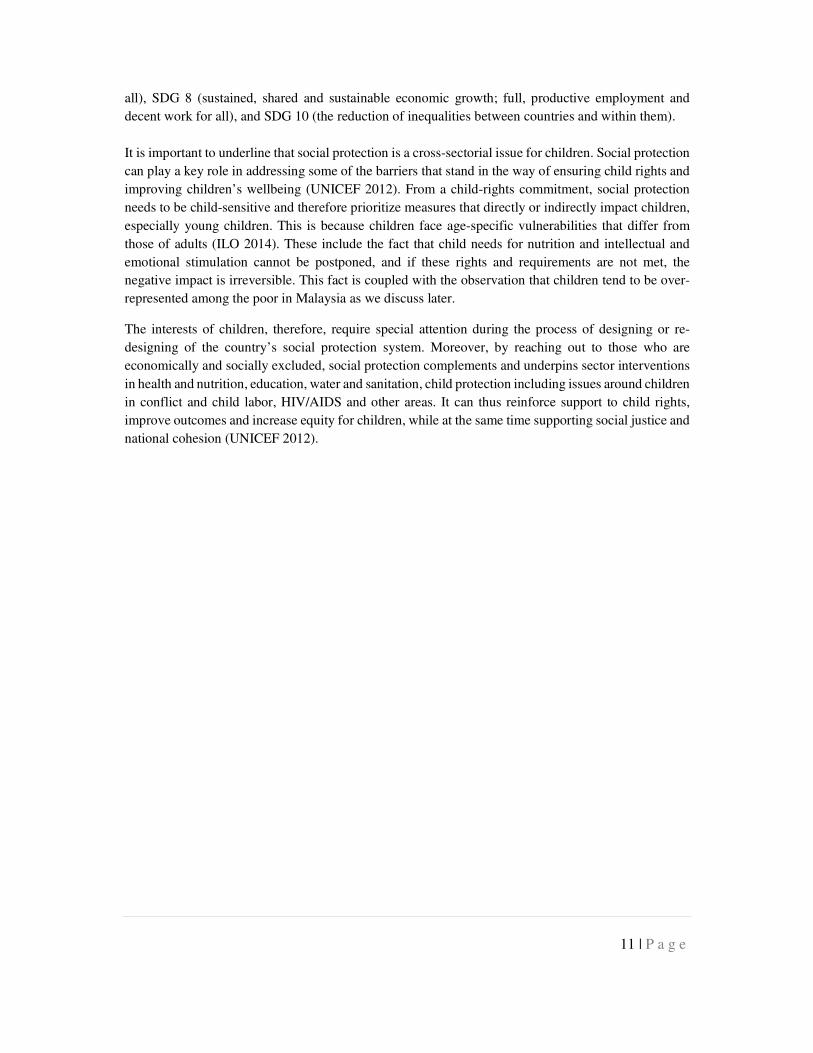
Like many countries, poverty in Malaysia has an age dimension. The proportion of children in both
absolute poverty is higher than the proportion of working age adults or elderly persons in poverty
(Redmond , Praino , & Sidiquee , 2017).
17 | P a g e
Figure 8: Absolute Poverty Rate by Age Groups, 2009, 2014
Source: Based on data from (Redmond , Praino , & Sidiquee , 2017)
It is to be highlighted that poverty among children is very sensitive to the poverty line used. For instance,
if the poverty line is doubled, the percentage of children live in poverty will increase from 1.6 percent
to 15 percent, which indicates the high vulnerability of households with children as many non-poor
are hovering around the poverty line (Redmond , Praino , & Sidiquee , 2017).
Similarly, using a relative poverty measure similar to that of OECD countries, defined as
households with less than half median income, the proportion of children living in poverty was
estimated at 21.1 percent for the year of 2012, higher than that of all persons in Malaysia and also
still high in comparison with that in other OECD countries (Ragayah H.M.Z, 2002).
Figure 9: Relative Poverty in OECD countries and Malaysia, 2012

18 | P a g e
Source: From (Redmond , Praino , & Sidiquee , 2017)

19 | P a g e
4. INTEGRATED SOCIAL PROTECTION SYSTEM: FRAMEWORK AND IMPACT
4.1. Framework
UNICEF’s approach to social protection argues for integrated systems to address the multiple and
compounding vulnerabilities faced by children and their families. As one of the cooperating agencies,
UNICEF’s engagement and key principles for Social Protection support the realization of the UN
adopted Social Protection Floor Initiative (SPF-I). The SPF-I emphasizes the need to guarantee a basic
set of rights across the life cycle (from children to old-age). This basic set of right aims at enabling and
empowering all members of a society to access a minimum package of transfers and services at all
times.
Figure 10: the UN adopted Social Protection Floor
Source: ILO (2012)
Within this framework, two main limitations have been identified in this exercise:
1- It does not map out all existing social protection provisions that might also fall under the
economic security part of the SPF.
A wide selection and fragmented cash transfer programs exist in Malaysia. Due to data
availability and time constraints, this rapid exercise does not analyse them. In addition, the
proposed Child Grant is sought to complement the existing programs for stronger impact,
particularly among vulnerable households. More specifically, the proposed Child Grant is
promoted as the first level of the safety net where households with children receive the benefit
to help meet part of the expenses associated with school, nutrition, old-age and other
20 | P a g e
vulnerability. The existing programs are additional benefits that can address the extra and
special needs of the particular household. The combined benefits will, therefore, have a
consolidated and stronger impact.
2- It does not cover access to essential services part of the SPF, which needs to be carefully looked
at in a separate exercise and by theme (e.g. access to health, access to quality education etc.).
4.2. Targeting, Benefit Parameters, and Conditionality
Targeting
Using the lifecycle approach in line with the SPF, this paper looks at only two groups: pregnant women
and children. The period of greatest vulnerability for the survival and development of the child is from
pre-birth to five years, and within that the period as a foetus and the first two years (UNICEF 2011b).
One consideration in the selection of benefits therefore relates to the observation that an impact on child
malnutrition in particular would require an intervention to set in before the infant’s birth. This leads to
include a benefit during a mother’s pregnancy. The purpose would be to help ensure that she has
resources for her own better nutrition, to cover pregnancy-related health or social expenditures, or to be
able to afford some rest during her pregnancy, post-partum and during breastfeeding by outsourcing
some of her work burden. The fact that the first two years are the most sensitive in turn leads to one
suggestion proposing a grant for the first 1000 days (i.e. between the start of a woman’s pregnancy and
her child’s second birthday). Further, as discussed earlier, poverty incidence increases among
households with children. Extending the age cut-off makes a lot of sense as an effective targeting
approach. The study costs the scenario to extend coverage to five years-old.
Using a lifecycle approach in line with the SPF covering two groups: pregnant women and children
will also support the policy objective to consolidate the fragmented programs that characterize the
current system.
It is to be noted that while benefits proposed hypothetically cover all individuals falling under the
eligibility criteria of the particular group it belongs to, it is assumed that a form of targeting is implicitly
built in:
1. Self-selection targeting: the low level benefit amount coupled with other administrative burden
to register and receive the benefit, are likely to result in less than 100 per cent take up, as higher
income groups may not claim the benefit.
2. Categorical targeting: the lifecycle approach recognizes that poverty is positively correlated
with age groups e.g. childhood. It is also to note that poverty is positively correlated with the
number of children in the household. Therefore, cash transfers that varied with the number of
children in the household are pro-poor, even if non-poor households receive the same per-child
benefit amount. Moreover, with the inclusion of financing mechanism such as tax, the impact
can be even further strengthened and the result is a net transfer from the rich household to the
poor household.

21 | P a g e
Benefit Parameters: benefits covered, eligibility, and benefits amount
For the categories discussed earlier, a set of scenarios are investigated. They propose different age cut-
offs and a range of benefit levels. The range of alternative age levels and benefit amounts may serve to
provide policy makers with an estimate of respective costs. These can then be assessed in line with
societal aspirations on social outcomes, and government commitments, and weighed against the
background of Malaysia’s current and potential fiscal space.
Table 3: Benefit Parameters of the Proposed Income Security Package
Scenario Coverage Monthly Benefit Eligibility
Pregnancy Benefit
1. Pregnancy Benefit A National RM150 Pregnant women, last 5 months of pregnancy
2. Pregnancy Benefit B National RM200 Pregnant women, last 5 months of pregnancy
Child Grant
4. Under 2 years A National RM150 All children under 2 years of age
5. Under 2 years B National RM200 All children under 2 years of age
7. Under 5 years A National RM150 All children under 5 years of age
8. Under 5 years B National RM200 All children under 5 years of age
While the above benefit amounts are low in value as a stand-alone benefit, they are meant to
complement other existing programs and provide the first level of income security for the household as
a unit explained in the SPF in figure 8, especially in the event of loss of income.
Conditionality
There is increasing evidence on the impact and outcomes of both conditional cash transfers2 and
unconditional transfers. Although there is evidence to suggest that both have positive outcomes, the
particular role and attribution of these outcomes to conditionality remains an open debate. Linkages to
other sought positive behaviour changes can be also investigated (eg health check-ups). The study is
hoped to initiate a broader discussion with cross-sectorial experts to ultimately decide whether
conditionality and linkages are desired, and if yes, what they are.
2 conditional cash transfers are given to beneficiaries conditional on particular actions, such as sending children to school or attending regular health check-ups

22 | P a g e
5. COSTING THE SYSTEM OF CASH TRANSFERS
5.1. Projection Methodology
In this study, the projection exercise is divided into two parts: First, projection of the underlying factors
(demographic and macroeconomic). Second, under a set of specified assumptions on the benefit
parameters discussed earlier (eligibility conditions, coverage, benefit level etc.), beneficiaries, benefit
level, and overall costs are projected until 2030 for each benefit. The linkages and dependency structure
of the projection parts are illustrated in the following diagram.
Figure 11: Projection Model Components and Dependency Structure
5.2. Projection of the Determinants of Social Protection
For the demographic projection, the study uses the medium-variant population projection made
available by the United Nations Department of Economic and Social Affairs, Population Division (UN,
2016). The data set is disaggregated by sex and single-year age. The following table summarizes the
population projection’s main characteristics relevant to the study.
Table 4: Population Projection (Medium Variant) Main Characteristics, 2017-2030

23 | P a g e
Source: Author’s calculation based on data from UN DESA (2016).
For the macroeconomic model, the study uses the IMF’s latest3 medium-term forecast for real GDP
growth rate and inflation rate, which covers until 2022. From 2023 to 2030, the rates are fixed at the
rate of 2022. GDP in current prices and per capita GDP are calculated for the projection period.
Figure 12: Macroeconomic Model’s Assumptions- GDP Growth Rate and CPI Rate
Source: Based on data from IMF (2017).
5.3. Projection of the Child Grant
The first assumption that needs to be specified is regarding coverage ratio among the underlying
population. The following table summarizes the coverage ratios assumed for each individual program4.
Table 5: Coverage Rates Projection Assumptions
Category Underlying population Coverage ratio
3 Data obtained on May 16, 2017 from the IMF website 4 Note also that rates above are interpolated between the specified years

24 | P a g e
2017 2020 2030
Pregnancy Expecting mothers 80 % 80 % 80 %
Child benefit - less than 2 years-old - less than 5 years-old
80 % 80 %
80 % 80 %
80 % 80 %
Applying these rates into the corresponding age groups that was already projected gives the specific
program’s beneficiaries as shown in table 7.
Table 6: Costing Results: Number Beneficiaries in thousands, 2017-2030
Source: Authors’ calculation based on data from UN (2016)
Over the projection period, benefits are assumed to maintain real value in RM (indexed with inflation).
However, as the economy is expected to grow in real terms, benefit level will decline in relative value
over the projection period5. Alternative indexation is to maintain the benefit level ratio to per capita
GDP over the projection horizon.
The total benefit amount spent under each scenario is calculated as the product of the beneficiaries and
the benefit amount for each year in the projection period for each scenario. Administrative cost is
assumed conservatively at 20 per cent of the benefit amount. The following table summarizes the cost
of each program expressed in RM, percentage of GDP, and percentage of Government expenditure.
Table 7: Costing Results: Overall Cost in in Billion RM, Percentage of GDP, and Percentage of Government Expenditure
5 For results of this alternative indexation, the author can provide them in a separate note.

25 | P a g e
Source: Authors’ calculation based on data from IMF (2017) and UN (2016)

26 | P a g e
6. MONITORING, EVALUATION, AND LEARNING
Monitoring, evaluation and learning are central to help ensure that the Child Grant program will make
the biggest difference in the life of children and their households. Monitoring is the periodic oversight
of the implementation of a program, which seeks to establish the extent to which input deliveries, work
schedules, other required actions and targeted outputs are proceeding according to plan, so that timely
action can be taken to make the necessary adjustments. Evaluation is a process to determine as
systematically and objectively as possible the relevance, effectiveness, efficiency, sustainability and
impact of a Program in light of the specified objectives. By supporting learning and accountability,
evaluation helps continuously improve Program performance and results. Both monitoring and
evaluation contribute to promote learning for improving ongoing initiatives and future planning,
programming and decision making.
To support rigorous monitoring and evaluation of how access to the Child Grant program affects key
aspects of child well-being and their households, it is necessary to collect baseline and follow-up
information to be able to compare and measure its impact. The data should be analysed using rigorous
evaluation methods, enabling the government to identify the impacts of the Child Grant itself, isolated
from other factors, its relevance, its operational effectiveness and cost to provide a justification for
investing in the Child Grant and plan for an extension of the program (such as increasing the age cut-
off), as well as to assess its sustainability. It is to be highlighted that cash transfers in other countries
are found to have positive institutional externalities (Fiszbein, Schady, & Ferreira, 2009). Through their
emphasis on monitoring and evaluation, cash transfer Programs have strengthened a results culture
within the public sector.
6.1. Baseline and Follow-up Surveys
It is proposed to start immediately with data collection to establish baseline data using a two-stage
sampling process (cluster sampling). First, a random sample of locations, defined as the catchment areas
for specific cash-distribution points, is drawn from the national administrative databases. Second,
children under the age of five are randomly selected from the identified cash-distribution points in order
to identify a group of households who enrolled the Child Grant program shortly after the child’s birth,
compared to a group that enrolled later (at age 4 of the child or older) and a group with similar
observable characteristics that did not enrol the Program yet (i.e., propensity score matching6). The
baseline survey will use a combination of qualitative and quantitative methods to collect data, and adopt
an identical survey protocol for comparing households receiving the ‘treatment’ (such as the Child
Grant from shortly after the child’s birth) with the ‘comparison’ groups in order to provide a robust
basis for measuring casual Program impacts at the end of a period when a follow-up survey will be
conducted.
6 Propensity score matching constructs a statistical comparison group by matching observations on recipients to observations on non-recipients (or other recipient groups) with similar values of their propensity to receive Program benefits or to receive benefits at a particular time or dosage. This procedure yields an estimate of the average impact of the cash transfer on those that receive it – what is termed in the evaluation literate, the average impact of the treatment on the treated.

27 | P a g e
The results of the baseline survey will be then compared to other national household surveys to ensure
that the sample is representative of the corresponding national population. The follow-up survey’s
objective is primarily to track the impact of the Program by providing an update on the current
nutritional status of children in the both treatment and comparison locations.
The specific dimension to be used to assess causal impact may include:
• Nutritional status of under-fives children in both treatment and comparison household groups;
• Household income and expenditure patterns;
• Knowledge, attitude and practices of key behaviours that impact infant and child health and nutrition practices;
• Existing levels of infant and young children feeding practices.
The primary sample groups for the survey are household members and the children themselves.
Community members, social and health workers officials will also be part of the qualitative component
of the survey. At follow-up, an additional component of the questionnaire will ask recipients about
various aspects of the program operations.
6.2. Evaluability Assessment7
It is recommended before starting the program to conduct an Evaluability Assessment to ensure that the
objectives are adequately defined and its results verifiable. The Evaluability Assessment will ensure
that the program can be “evaluated in a reliable and credible fashion”. Specifically, the Evaluability
Assessment will determine:
• Robustness of the theory of change and results framework;
• Availability and reliability of data and information to inform the Program monitoring framework and evaluation;
• Feasibility of operational and impact evaluations.
In other words, Evaluability Assessment will make sure that the Child Grant is ‘Evaluation Ready’:
when carried out, at the end of the initiative it will deliver evaluative judgement about the impacts of
the initiative using and producing concrete evidence and data.
6.3. Program Monitoring and Reporting
Alongside the introduction of the Child Grant, performance monitoring and reporting are central to the
program implementation strategy. Monitoring can uncover programmatic and procedural glitches, such
as administrative complexity, delay in delivery, or erroneous exclusion of eligible population, which
can then be address to improve Program delivery. Collecting and analysing systematic and frequent
information will not only help identifying problems related to Program implementation, but will also
create a database that can be used for further improvement and innovation. Moreover, monitoring is
important not only to ensure that all aspects of the Child Grant are being implemented as intended, but
also to provide a ‘feedback loop’ to empower recipients.
7 This section is cited from (Davies, 2013)

28 | P a g e
To this end, the Program will put in place a monitoring system to promote effective program delivery
and maintaining accountability. This will include the definition of monitoring procedures that should
be implemented systematically by those responsible for the implementation of the Child Grant.
A Management and Information System (MIS) will collect information on the Child Grant recipients,
frequency and amount of transfers, and progress on complementary Programs . Malaysia has already
effective systems in place that can be used for effectively managing such data and evidence. This can
be strengthened by tools to help analyse the data and produce analytical reports for program reporting
in real-time (e.g., using electronic forms and tablets). Second, verification will ensure that money under
the Child Grant is reaching the intended recipients within the agreed timeframe and parameters
mentioned above. Methods for verification will include field visits that will be carried out using an
electronic Field Monitoring Template. Lastly, an independent audit firm should be identified to conduct
random payment verification. This independent verification is important to help address unique
challenges that may be missed during formal field visits.
6.4. Evaluation and Learning
Baseline and follow-up surveys along with routine monitoring data collection are key elements for a
rigorous operational and impact evaluations to be completed after a period long enough to see results
(i.e.. 3 years or more). Such evaluations will provide decision-makers with concrete evidence and
objective information about the relevance and operational effectiveness of the Child Grand
implementation, the cost of the program in light of its effectiveness, and the impact and sustainability
of the Child Grant against the sought objectives and the results framework. Moving forward, this
evidence will be the base for informed policy formulation and building political capital for a program
extension. Good practices and lessons learnt can also be identified in the evaluation process, which
allow improvement in the Program design and targeting through adjustments to the implementation
approach or strategies.
The main research questions covered in the evaluation will include, but not limited to, the following:
• What is the impact of the Child Grant on nutrition outcomes for children under five?
o What is the impact of the Child Grant on household’s expenditure patterns? o Does the accompanying communication for development information package have an
impact on key behaviours that impact infant and child health and nutrition practices?
• To what extent are the objectives of the Child Grant achieved?
• What are the major factors influencing the achievement or non-achievement of the objectives?
o To what extent are all eligible children receive the benefits? If not, why?
• Is the Program cost-efficient?
• What is the likely sustainability of the Program results?
It is proposed that the methodology of the impact evaluation aims to measure ‘causal program impacts’
of the Child Grant as the difference between observed outcomes for the recipient and what would have
been the outcomes if this group had not received the Child Grant or received it later versus earlier. The
evaluation will thus employ ‘non-experimental’ approaches rather than a randomised experiment
because of the universality of the Child Grant and the enrolment of children to the Child Grant a

29 | P a g e
different ages. The baseline and follow-up surveys will provide the necessary data for comparing
households receiving the treatment versus other groups. In the absence of randomisation, the evaluation
will address the problem of selection bias through ‘matching’ treatment households to comparison
group households, based on observable characteristics at the time their application or enrolment into
the program. The impact of the program is then estimated as the average difference in the outcome for
each treatment household from a weighted average of outcomes in each similar comparison group
household from the matched sample. It is important to note here that the comparison group does not
need to be a non-recipient of the programme, but it will consist of recipients with differing treatment
levels or the timing thereof.
Using mixed methods, the evaluation will control for factors that might lead to an erroneous attribution
of causality, including individual and household traits such as: poverty status, exposure to shocks,
demographic characteristics and other variables. The quantitative data will be used for descriptive
statistics on recipient’s perceptions and experiences of implementation of the Child Grant. The
qualitative part will include: Focus Group Discussions (FGDs), In-Depth Interviews (IDIs) and Key
Informative Interviews (KIIs).
As previously mentioned, at follow-up, an additional component of the questionnaire will ask recipients
about various aspects of the Program operations, providing information for the operational evaluation.
The surveys and the methodology for the operational and impact evaluations will be reviewed by an
external ethical review board to ensure compliance with international ethical guidelines.

30 | P a g e
REFERENCES
Bank, W. (2017, April). Malaysia Overview. Retrieved from World Bank:
http://www.worldbank.org/en/country/malaysia/overview
Black R.E, V. C. (2013). Maternal and Child Undernutrition and Overweight in Low-income
and middle-income countries. The Lancet, 40.
Black, R. A. (2013). Maternal and Child Nutrition: Building Momentum for Impact. The
Lancet, 372-375.
BNGRC. (2016, July). Bureau National de Gestion des Risques et Catastrophes . Retrieved
from http://www.bngrc-mid.mg/
Davies, R. (2013). Planning evaluability assessments: A synthesis of the literature with
recommendations. London: DFID Working Paper 40. Retrieved from DFID Working
Papers.
Economic Planning Unit. (2015). Eleventh Malaysia Plan 2016-2020: Anchoring Growth on
People. Putrajaya.
Economic Planning Unit. (2016). Retrieved from Economic Planning Unit, Prime Minister's
Dept.
Fiszbein, A., Schady, N. R., & Ferreira, F. H. (2009). Conditional cash transfers: reducing
present and future poverty. Washington, D.C.: World Bank Publication.
Gupta RP-S, d. W. (2017). The impact of poverty on the current and future health status of
children. Paediatrics & Child Health, 667-672.
Heller, P. S. (2005). Understanding Fiscal Space. Washington D.C.: IMF.
ILO. (2011). Social Protection Floor for a Fair and Inclusive Globalization. Geneve: Report
of the Social Protection Floor Advisory Group.
ILO. (2011). Social Protection Floor for a Fair and Inclusive Globalization. Report of the
Social Protection Floor Advisory Group. Geneve.
IMF. (2015). Republic of Madagascar: 2014 Article IV Consultation- Staff Report; Press
Release; and Statement by the Excutive Director for Nepal. Washington, D.C.: IMF.
IMF. (2016, April). World Economic Outlook Database. Retrieved June 24, 2016, from
http://www.imf.org/external/pubs/ft/weo/2016/01/weodata/index.aspx
Koehler, G., & Chopra, D. (n.d.). Development and Welfare Policy in South Asia. Routledge
Explorations in Development Studies.
Lethbridge LN, P. S. (2005). Chronic poverty and childhood asthma in the MAritimes versus
the rest of Canada. Can J Public Health, 96(1):18-23.
Maplecroft. (2014, October 17). Madagascar: Fragile improvement in political stability set
to boost investment climate – Country Risk Report. Retrieved from
https://maplecroft.com/portfolio/new-analysis/2014/10/17/fragile-improvement-
political-stability-set-boost-investment-climate-country-risk-report/
Ministry of Health. (2017, June). Institute for Public Health. Retrieved from National Health
& Morbidity Survey : http://www.iku.gov.my/index.php/research-eng/list-of-
research-eng/iku-eng/nhms-eng/nhms-2016
31 | P a g e
Ortiz, I., Chai, J., & Cummins, M. (2011). Identifying Fiscal Space: Options for Social and
Economic Development for Children and Poor Households in 182 Countries. New
York: UNICEF.
Paul, G. J., Martinez, S. W., & Rubio-Codina, M. (2012). Investing cash transfers to raise
long-term living standards. American Economic Journal: Applied Economics, 164-
192.
Prado , K., & Dewey , K. (2012). Nutrition and brain development in early life. A&T
Technical Brief. Issue 4, .
Ragayah H.M.Z, L. H. (2002). Social Protection in Malaysia. In M. H. E.Adam, Social
Protection in Southeast and East Asia (pp. 119-169). Singapore: Friedrich Ebert
Stiftung.
Redmond , G., Praino , R., & Sidiquee , N. (2017). Child Deprivation and Disparities in
Malaysia. Kuala Lumpur: MWFCD & UNICEF.
Republic of Madagascar. (2015). Politique Nationale de Protection Sociale. Antananarivo.
Republic of Madagascar. (2016). FACT SHEET ON CBI: SOCIAL PROTECTION SECTOR.
Antananarivo.
Roy, R., Heuty, A., & Letouze, E. (2009). Fiscal Space for What? Analatical Issues from
Humand Development Perspectives. Paper for the G20 Workshop on Fiscal Space.
Istanbul: UNDP.
Sadoulet, E., de Janvry, A., & Davis, B. (2001). Cash transfer programs with income
multipliers: PROCAMPO in Mexico. World development, 1043-1056.
Sim, O. F. (2010). Social Protection in Malaysia – Current State and Challenges Towards
Practical and Sustainable Social Protection n East Asia: A Compassionate
Community’. In M. G. Asher, Social Protection in East Asia – Current State and
Challenges. (pp. 182-219). Jakarta: ERIA.
The United Nations. (2016, June). The Official United Nations Site for MDG Indicators.
Retrieved from http://mdgs.un.org/unsd/mdg/Host.aspx?Content=Data/snapshots.htm
The World Bank. (2014 , October 24). A New Approach to Social Protection in Madagascar
Empowers the Poor to Help Themselves. ANTANANARIVO, Madagascar. Retrieved
from http://www.worldbank.org/en/news/feature/2014/10/28/a-new-approach-to-
social-protection-in-madagascar-empowers-the-poor-to-help-themselves
The World Bank. (2014). Face of poverty in Madagascar: Poverty, Gender and Inequality
Assessment. Africa Region.
UN. (2016). Department of Economic and Social Affairs, Population Division. World
Population Prospects: The 2010 Revision, CD-ROM Edition.
UN. (2016). Department of Economic and Social Affairs, Population Division. World
Population Prospects: The 2010 Revision, CD-ROM Edition.
UNDESA. (2013, October). World Population Prospects: The 2012 Revision. New York.
Retrieved January 21, 2014, from http://esa.un.org/unpd/wpp/index.htm
UNDP. (2013). Malaysia Human Development Report: Redesigning an Inclusive Future.
Kuala Lumpur: UNDP.

32 | P a g e
UNICEF. (2010). Social Protection: Accelerating the MDGs with Equity. New York.
UNICEF. (2011). Public Finance and Social Budgeting, learning Module. New York:
UNICEF.
UNICEF. (2012, February). Integrated Social Protection System: Enhancing Equity for
Children. Retrieved from
http://www.unicef.org/socialpolicy/files/Presentation_Jennifer_Yablonski_UNICEF_
_20_Feb_2012.pdf
UNICEF and NTAG. (2012). Nutrition Assessment Of Children 0-59 Months In The Districts
Of Mid & Far Western Regions Of Nepal. Kathmandu.
WB. (2016). World Development Indicators (WDI). Retrieved from
http://data.worldbank.org/data-catalog/world-development-indicators
Wilkins R, H. C. (2000). The Changing Health Status of Canada's children. ISUMA Can J
Policy Res, 57-63.

33 | P a g e
ANNEX 1 - COSTED MONITORING, EVALUATION AND LEARNING PLAN
The table below draws from the Monitoring, Evaluation and Learning Plan presented in Section
5 ‘ to frame proposed exercises to collect baseline and follow-up information to be able to
compare and measure the relevance, effectiveness, efficiency, impact and sustainability of the
program.
Exercise Title Purpose of the
Exercise Intended Use of
the Findings Expected
Start Date Anticipated
Cost
1 Evaluability Assessment
To determine if the program is ‘Evaluation Ready’, conduct some sample size calculations and prepare a short memo on evaluation design options.
To inform the robustness of the Theory of Change and results framework, and the feasibility of an operational and impact evaluation.
Before the start of the program
$25,000
2 Program Monitoring and Reporting
To collect frequent, real-time information on the program implementation.
To provide regular feedback on the program implementation.
Throughout the program
$50,000
3 Operational Evaluation
To conduct an assessment of the operational relevance, effectiveness and efficiency (incl. cost-effectiveness) of the Child Grant implementation.
To inform the operational roll-out of the Child Grant, including its relevance, effectiveness and efficiency.
After 18 months of implementation of the program
$75,000
4 Impact Evaluation (including baseline and follow-up surveys)
To determine the impact and sustainability of the Child Grant on nutrition outcomes for children under five.
To inform policy makers on possible impact and continuation of the program.
Throughout baseline and follow up surveys to be conducted at the start and end of program implementation
$400,000 (the price tag may vary based on the products required, cost of data collection in Malaysia, type of outcome indicators, etc.)


![JAG Berhad AnnualReport2018...Level 7, Menara Milenium, Jalan Damanlela, Pusat Bandar Damansara, u v , ] P Z U 50490 Kuala Lumpur, t ] o Ç Z W l µ µ v d o Z } v v } X W = ò ì](https://img.dokumen.tips/doc/110x75/612673a658df2465c7173d87/jag-berhad-level-7-menara-milenium-jalan-damanlela-pusat-bandar-damansara.jpg)