Embed Size (px)
Citation preview
South African Journal of Geomatics, Vol. 6. No. 3, October 2017
295
Introducing an agricultural land capability framework for land
reform beneficiaries
T.H Kabanda
Geography, Sol Plaatje University, Private Bag X5008, Kimberley, 8300
Email: [email protected]
DOI: http://dx.doi.org/10.4314/sajg.v6i3.2
Abstract
This study incorporated remote sensing, geographic information system (GIS), and geostatistics
to assess land capability in two sites acquired through land reform program. The relationships and
interactions between components and parameters that are necessary for analysing the capability of
agricultural land were investigated for an effective management system. The parameters taken into
consideration were biophysical environment (soil texture, organic matter content, soil depth etc.),
socio-economic and policy. The primary data included climatic data and soil samples obtained at 1
m depth; the secondary data included satellite imagery, topographic map, and agricultural
statistics. The resulting land capability maps showed that the study areas have moderate to very
high capability for summer crops. It is concluded that in order for land reform to contribute to
sustainable livelihoods for land reform beneficiaries, agricultural land capability study should be
integrated in land reform policy before issuing land to land reform beneficiaries.
Keywords: land reform, land capability, remote sensing, GIS
1. Introduction
Availability of land and its productive resources is generally very important for rural poor to
improve their living conditions and lessen poverty. Land reform is the redistribution of property or
rights in land for the benefit of the landless, tenants and farm labourers (Warriner, 1969). In modern
times, land form has been defined as a manmade change to land tenure usually aimed at changing
land distribution (Anaafo, 2015; Torhonen, 2004). Post 1994 South Africa, land reform has played
an important part of the rebuilding and growth plan of the new African National Congress (ANC)
administration. The South African land reform policy intends to mainly address the ethnically
slanted land ownership, which sprang from the 1913 Land Act and consequent legislation,
decreasing poverty and contributing to economic growth, particularly in areas that were
marginalised through apartheid laws, and securing land and tenure rights of the marginalised people
(DLA, 1997).
The land reform program thus intends to attain goals of both equity (in terms of land access and
possession) and productivity (greater land use), while also contributing to the expansion of the rural
economy in the country. In terms of overall achievements, land reform in South Africa consistently
has fallen far behind the targets set by the state, and behind popular expectations (Binswanger-
South African Journal of Geomatics, Vol. 6. No. 3, October 2017
296
Mkhize et al., 2009). Land tenure targets were to blame for the country’s failed land reform
programme, and 25% of the national department of agriculture’s budget in 2012 was spent on
recapitalising 595 claimed farms (Farmers weekly, 2012). According to the national Minister for
Agriculture, Gugile Nkwinti, this amounted to R900 million that went into rehabilitating collapsed
farms handed to claimants since 1994 (Dardagan, 2012).
This research aims to assess the land capability of redistributed land for arable agriculture and to
suggest the implementation of land capability study as part of land reform policy prior to
acquisition of land. The study sites are the former Pienaars Nature Reserve near Zeerust and the
Antwerp farm near Matloding. The agricultural potential is evaluated using an agricultural land
capability framework and this research intends to recommend the outcomes to land reform policy
makers as identification of very suitable and promising crop growing areas might be made distinct
from unsuitable land use type or land degradation. It is also very important that the result of
agricultural land capability evaluation is brought into the reach of farmers. In some cases, (Lahiff
and Li, 2012), there is a prerequisite that new beneficiary’s/land owner’s exhibit profitability inside
the given three to five years and this is generally impractical for a farming start-up without adequate
knowledge of the land.
Agricultural land capability framework in this study incorporates land quality information (e.g.
land forms and soils) and socio-economic factors. The information is then integrated in a
geographic information system (GIS) to produce thematic layers for use in land capability
evaluation. Since land capability analysis requires the use of different kinds of spatial data and
information, the GIS offers a more flexible and powerful tool than conventional data processing
systems, as it provides a means of taking large volumes of different kinds of spatial data sets, and
manipulating and combining the data sets into new data sets which can be displayed in the form of
thematic maps (Al-Mashreki et al, 2011). Remote-sensing plays an increasingly significant role in
providing current and historical land-use data, and for environmental and natural resources
mapping. This is because remote sensing data provides repeated synoptic coverage with consistent
observation of a given site. Land capability evaluation is the estimation of land quality for a specific
use. This study thus makes use of GIS, geostatistics and remote sensing to develop an agricultural
land capability framework for land reform beneficiaries. According to FAO (2007), a framework
does not by itself constitute an evaluation system. Instead, it sets out a number of concepts involved
in land evaluation, some basic concepts, the structure of a capability classification and the
procedures necessary to carry out a land capability evaluation.
South African Journal of Geomatics, Vol. 6. No. 3, October 2017
297
2. Materials and Methods
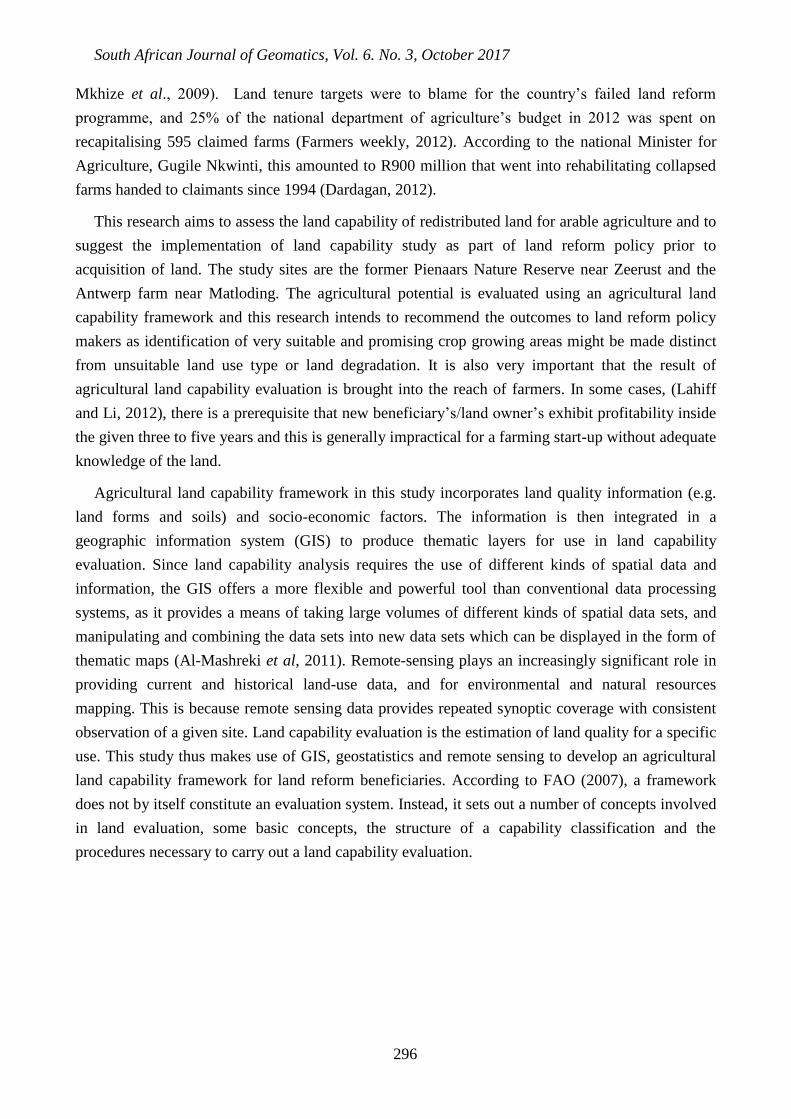
2.1 Description of the study area
Figure 1: Map of FPNR and Antwerp farm in North West Province
Figure 1 shows a map of the former Pienaars Nature Reserve (FPNR) near Zeerust and the
Antwerp farm near Matloding. The study sites are characterised by summer rainfalls with very dry
winters. Semi-arid conditions prevail in the study sites with an average annual rainfall of 300 mm in
Matloding and 500 mm in Zeerust. Great seasonal and daily variations in temperature occurs with
summers being very hot, with daily average high of 36 °C in January and winters cold with an
average daily minimum of 0,9 °C in June (READ, 2015).
2.2 Preparation of an agricultural land capability framework
Well-structured agricultural land capability framework is necessary to deliver informed decisions
on land use. The framework (Figure 2) is an in-built component of a GIS and has a tremendous
impact on the output. GIS allows for easier interaction of spatial and non-spatial data (Dale and
McLaren, 2005). Incorporating data from a variety of fields such as physical, social and economic
of a region in a capability study allows for better results.

South African Journal of Geomatics, Vol. 6. No. 3, October 2017
298
Figure 2: Methodological approach
The framework allows for the development of the land information database necessary to
provide sufficient and accurate information on land and soil features which are then converted into
thematic maps in a GIS. The thematic layers (such as soil depth, soil texture and topography) are to
be overlaid using the weight analysis to produce an agricultural land capability map for a study
area.
2.3 Remote sensing application
SPOT 5 HRG satellite images for the two study sites were acquired from the South African
National Space Agency (SANSA). The images have a spatial resolution of 10 m in bands 1 (green,
0,50 – 0,59 μm), 2 (red, 0,61–0,68 μm), and 3 (near-infrared, 0,78 – 0,89 μm), and a spatial
resolution of 20 m in band 4 (mid-infrared, 1,58 – 1,75 μm). The image covers an area
approximately 60 km × 60 km and was taken in the rainy season. The rainy season was chosen as
leaf chlorophyll is high and this is suitable for calculation of NDVI values. Geometric distortions in
the satellite imagery were removed by registering the image to a map by using ground control
points (GCP). Sets of coordinates linked with each GCP are spread uniformly over the image to
give best coverage for calculating the transformation. Hybrid classification which combines the
benefits of both supervised classification and unsupervised classification was performed. The
classification gave rise to 2 land cover classes comprising of water, woodland and bare land.
Google Earth imagery and field data were used as reference data to evaluate the correctness of the
South African Journal of Geomatics, Vol. 6. No. 3, October 2017
299
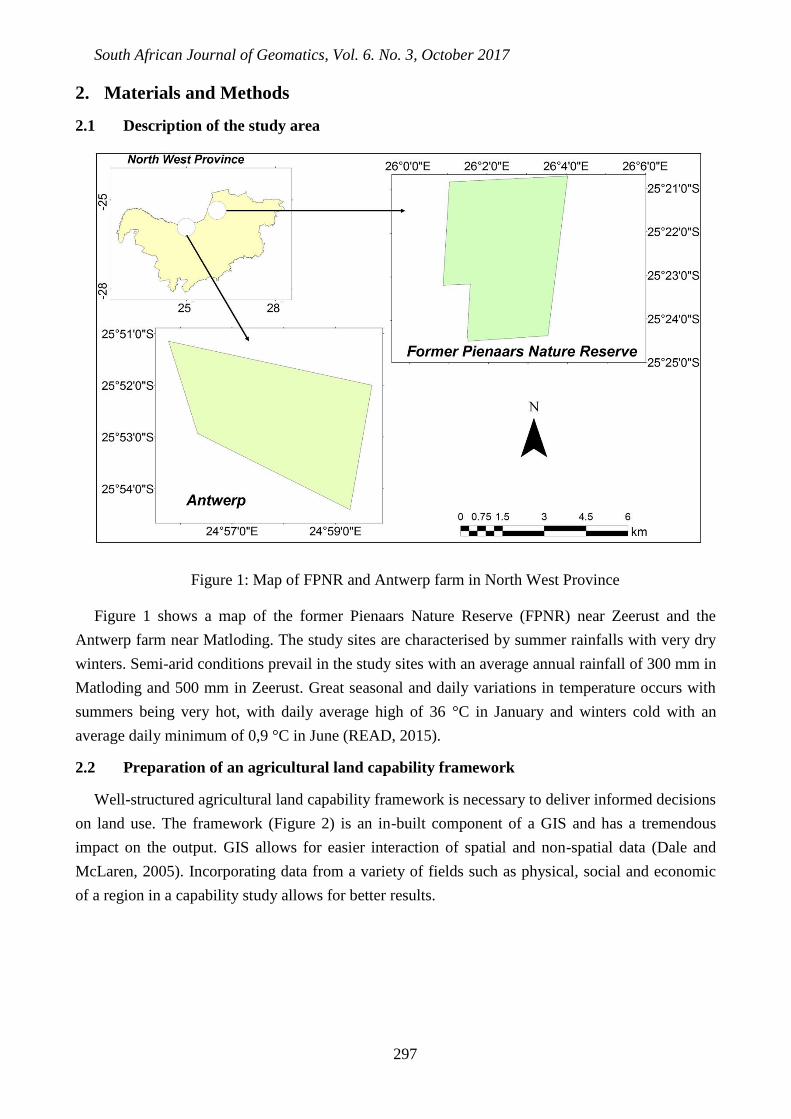
classification process. An error matrix was used to evaluate the accuracy of image classification and
can also be used to refine the classification (Lu and Weng, 2007).
Table 1: Former Pienaars Nature Reserve error matrix
REFERENCE DATA
B W
O
Tot
al
User accuracy (%)
B 28 4 32 87.50
WO 14 214 228 93.86
Total 42 218 260
Producer accuracy
(%)
66.67 98.
17
Overall accuracy = 93.08%
Overall Kappa Statistics = 0.7173
Legend: WO-Woodland, B-Bare land,
The ERDAS Imagine Accuracy Assessment tool was used to select stratified random reference
points; a minimum of fifty points were selected in each of the three land cover categories of interest.
According to Congalton (1991), a total of 250 reference pixels or more are required to approximate
the mean accuracy of a class to within plus or minus 5%.

South African Journal of Geomatics, Vol. 6. No. 3, October 2017
300
Table 2: Error matrix for the classification of the Antwerp (2013-02-11)
REFERENCE DATA
WO B Total User accuracy (%)
WO 176 21 197 87.83
B 8 55 63 87.30
Tot
al
184 76 260
Producer accuracy
(%)
94.86 72.3
7
Overall accuracy = 87.56%
Overall Kappa Statistics = 0.7195
Legend: WO - Woodland, B - Bare land
The FPNR had an accuracy of 93,08% and the overall kappa statistic of 0,7173 (Table 1) and for
Antwerp farm the accuracy was 87,56% (Table 2) and the overall kappa statistic, κ, was 0,7195.
The kappa statistic calculates inter-rater agreement for qualitative objects (McHugh, 2012).
2.4 Soil sampling and geostatistical analysis
Soil sampling in this study was done during the late summer (March and May of 2014) as the
best time to collect soil samples for fall-seeded crops (e.g. cereals and grains) is when the field is
idle, and in the summer works well (FAO, 2007). A total of 30 sampling sites (15 per site) were
collected at 100 cm depth using auger bores. For interpolation and to show spatial association in
observations measured at sampled sites, a semivariogram was used, as follows (Kerry et al., 2010):
ϒ (h) =
Where γ is the semivariogram value plotted on the dependent axis, N (h) is the number of data
pairs within the class of distance and direction used for the lag vector h, is the starting location
and is the ending location, also the variable is isotropic.
Physical and chemical parameters were analysed from the soil samples. Soil texture was
determined using sieve analysis, in sieve analysis the sieves are arranged by the size of the aperture
in mm. The purpose of a sieve analysis is to determine the amount of clay, silt, and sand particles in
a given soil. Grahm colorimetric method was used to measure organic matter in the soil. The
method comprised adding a soil sample in a flask to a potassium dichromate solution where it was
swirled and allowed to stand for 30 minutes for settling of soil particles. A pipet was used to add 10
drops of diphenylamine indicator and swirled until the colour changed from dark brown through
blue to a deep green; the colour was matched with organic matter endpoint colour standard. Soil pH

South African Journal of Geomatics, Vol. 6. No. 3, October 2017
301
was calculated using the potentiometric method and soil suspension was done with purified water in
1:1 ratio. The pH was then measured using a Lamotte 1741 pH Tracer meter.
2.5 Selection of promising crops
Promising crops were selected based on existing cropping systems, social acceptance of crops
and economic status of the society, and from farmers’ long experience. Summer field crops are well
suitable for the North West Province climatic conditions. Information on the growth requirements
for maize and sorghum were acquired from farmers and literature (DAFF, 2010). The information
resulted in the construction of climatic and soil requirements tables (Table 3).
Table 3: Diagnostic characteristics for sorghum
Characteristics Capable Moderate Incapable
Texture Clay Loam Sandy
pH 5,5 – 7,5 7,5 – 8,5 <4,5
Drainage Well drained Moderately well Imperfectly drained
Clay (%) 10% - 20 10% - 30 >30
Depth (cm) >100 80 - 100 <80
Temp (°C) 27 – 30 7 - 10 <7
Rainfall (mm) 300 – 750 200 - 300 <200
2.6 Land capability assessment
The Spatial Analyst function in ArcGIS was used to generate thematic maps of textural class,
soil depth, drainage condition and clay percentage. The thematic maps were then overlaid to create
a land capability map. The land capability classes were defined using the rating method after FAO
(2007). Each one of the classes of thematic layers for texture class, soil depth, pH and clay
percentage was categorised into (i) good, (ii) fair, (iii) moderate, (iv) average, (v) poor and (vi) not
capable with respect to land capability for agricultural purposes. Capability weights were given to
each thematic layer after considering their characteristics.
The weighted aggregation technique in ArcGIS was used to carry out the weighting for each
thematic layer. This technique works by combining multiple layers and applying a common
measurement scale of values to each layer, weighting each according to its importance, and adding
them together to create an integrated analysis. Input factors favouring agriculture were changed
from descriptive form into agricultural land capability ratings to allow for the calculation and other
South African Journal of Geomatics, Vol. 6. No. 3, October 2017
302
mathematical processes in GIS analysis. Also because these factors have different value scales and
not all of them are equally important.
3. Results
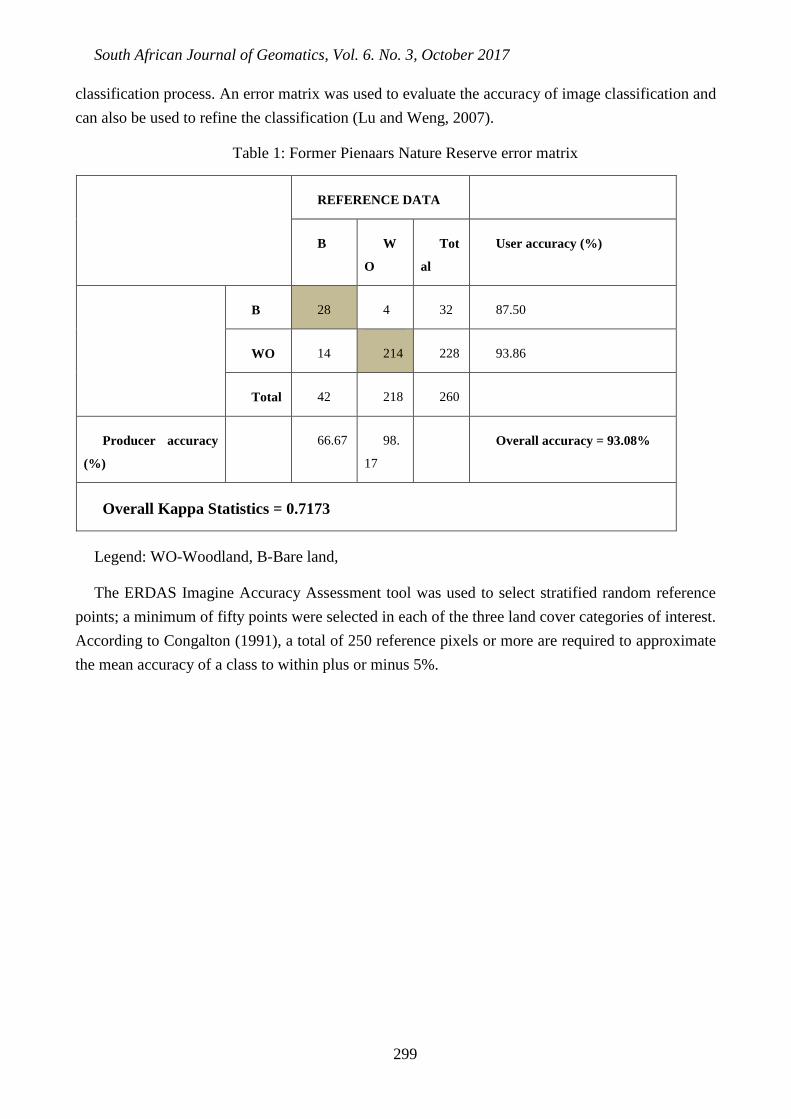
3.1 Land use structure
The former Pienaars Nature Reserve (FPNR) covers an area of 29,8 km2; the landscape is
dominated by vegetation cover (92,7%) whilst bare land makes up 7,4%. The FPNR remains largely
uninhabited, and a 2011 census recorded just three households, although surrounding communities
do graze their livestock within FPNR (STATSA, 2012). Antwerp farm consists of 88,4% of
woodland and 11,6% is bare land (Figure 3).
Figure 3: Land use classes of FPNR and Antwerp farm
3.2 Physical properties
Figure 4 shows Clay loam accounts for 11,75% of FPNR while sandy loam covers 67,33% and
clay (light) at 20,92%. Clay loam soils are heavy as the soil mixture contains more clay than other
types. Clay loam has imperfect drainage and this can stunt plant growth due to the characteristic of
swelling of the soil to retain water when it is very wet and cracking during very dry conditions.
These drawbacks can be lessened by adding organic matter over time (Chesworth, 2008). Figure 4
shows that sandy soil texture covers the entire Antwerp farm.
Moderately well drained soil covers 88,25% of FPNR and in moderately well drained soil, water
is removed from the soil at a lower rate and thus the soil is wet for longer periods. Periodically, the
soil can be wet enough that mesophytic crops (examples are maize and many fruit trees and

South African Journal of Geomatics, Vol. 6. No. 3, October 2017
303
vegetables) are affected as wetness markedly restricts the growth of mesophytic crops, unless
artificial drainage is provided (Belt et al., 2007). Sand texture class in Antwerp farm has a
somewhat excessive drainage class i.e. water is rapidly lost.
Figure 4: Soil texture and drainage of FPNR and Antwerp farm
3.3 Chemical properties
The effect of soil pH is great on the solubility of minerals or nutrients. The pH range of 7.1 to 7.5
in FPNR is due to Ferric Luvisols soils, these have high cation exchange capacity (Chesworth,
2008). Cation exchange capacity (CEC) is dependent on soil pH, thus a high CEC means the soil is
acidic as more cations are available.
4. Discussion
4.1 Maize cultivation land capability evaluation
The FPNR is highly capable for cultivation of maize, with 83% being highly and moderately
capable. This area consists of clay (light) and sandy loam soil texture. Maize production generally
takes place on soils with clay content of less than 10% (sandy soils) or in excess of 30% (clay and
clay-loam soils) (DAFF (b), 2010). Marginal capable soil covers 17% of the FPNR and the presence
of clay loam prevents good internal drainage and optimal moisture regime. The sandy soils of
Antwerp farm are capable for maize cultivation as it provides good internal drainage and an optimal
moisture regime. The crop needs to be highly irrigated during the dry periods as the soil needs to be
able to retain few weeks of water or the crop suffers. With a soil depth of 100 cm, it is free from

South African Journal of Geomatics, Vol. 6. No. 3, October 2017
304
restrictive layers (hardpan) and has a pH of higher than 4.5. Figure 5 shows the land capability
classified map for maize in the FPNR.
Figure 5: Land capability classified map for maize in the FPNR and Antwerp farm
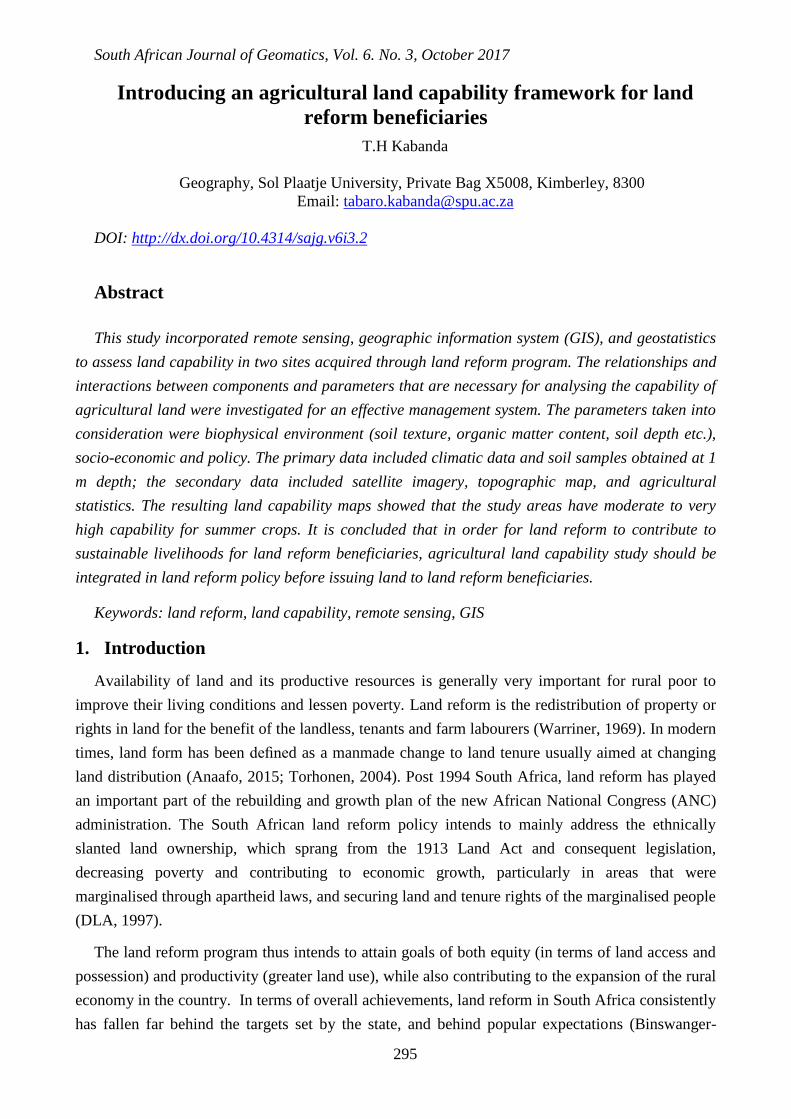
4.2 Sorghum cultivation land capability evaluation
Grain sorghum can be grown on many different soils and the presence of shallow soil depth and
clay loam texture means that only 15% of FPNR is highly capable for sorghum. Moderately capable
area covers 74% of FPNR and consists both of sandy loam and clay (light) soil.
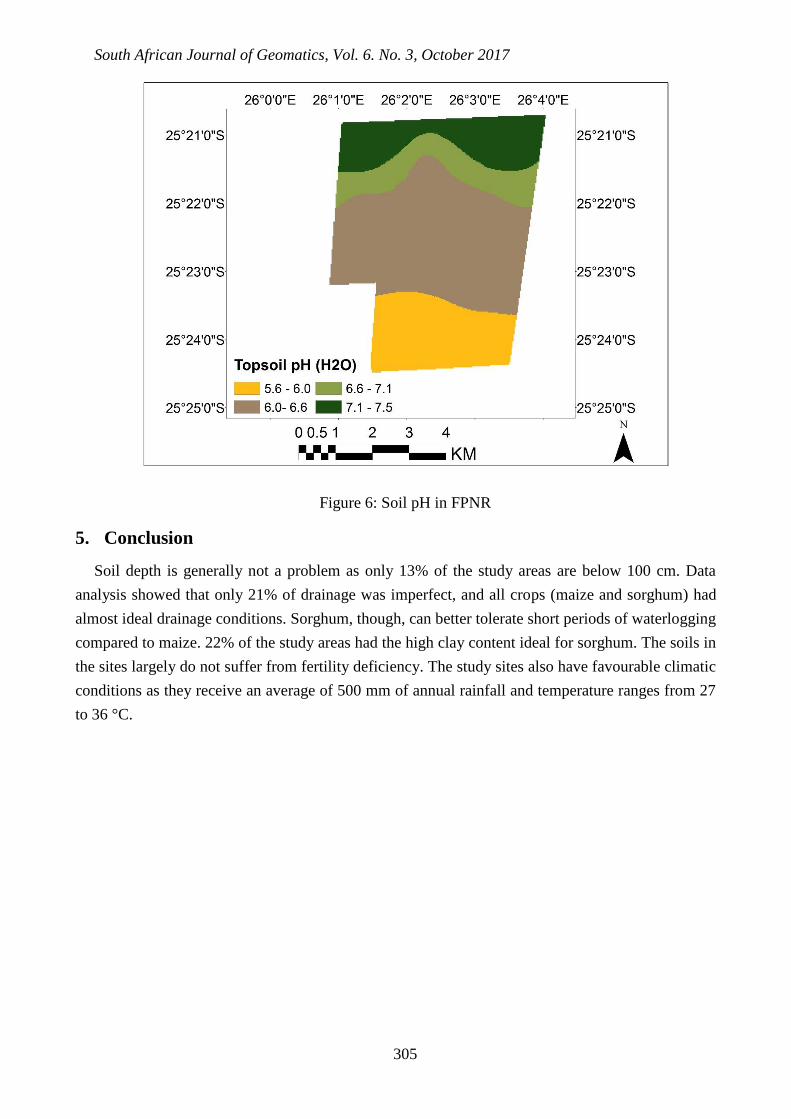
The marginal capability in FPNR covers 11%. This area has a pH range from 6.0 to 6.6 (Figure
6). Sorghum usually grows poorly on sandy soils and with Antwerp farm covered by sandy soil
texture, the area is marginally capable for cultivation. All other factors such as pH of 6.1, a soil
depth of 100 cm and a deep well-drained fertile soil are appropriate. Figure 7 shows the land
capability classified map for sorghum in FPNR and Antwerp farm.
South African Journal of Geomatics, Vol. 6. No. 3, October 2017
305
Figure 6: Soil pH in FPNR
5. Conclusion
Soil depth is generally not a problem as only 13% of the study areas are below 100 cm. Data
analysis showed that only 21% of drainage was imperfect, and all crops (maize and sorghum) had
almost ideal drainage conditions. Sorghum, though, can better tolerate short periods of waterlogging
compared to maize. 22% of the study areas had the high clay content ideal for sorghum. The soils in
the sites largely do not suffer from fertility deficiency. The study sites also have favourable climatic
conditions as they receive an average of 500 mm of annual rainfall and temperature ranges from 27
to 36 °C.

South African Journal of Geomatics, Vol. 6. No. 3, October 2017
306
Figure 7: Land capability classified map for sorghum in the FPNR and Antwerp farm
A large part of this study was tied to the development of a framework intended to determine
agricultural land capability. There is generally no comprehensive policy that is intended to provide
support for agricultural development to land claimants after land transfer. Land capability
evaluation should form part of post-settlement assistance to beneficiaries as they and the authorities
will have information on the relative capability for agriculture on their land. Also, the risk of land
degradation and the necessity to manage land within its capability should be acknowledged at the
state level. The more that land is used within its capability, the more sustainable will be the land
management practices. This study therefore proposes the application of land capability study as part
of land reform policy preceding the acquirement of land to land beneficiaries and also as part of
post-transfer support.
References
Al-Mashreki, MH., Akhir, JBM., Rahim, SA., Desa, KM., Lihan, T & Haider, AR 2011, ‘Land suitability
evaluation for sorghum crop in the Ibb Governorate, Republic of Yemen using remote sensing and GIS
techniques’, Australian journal of basic and applied sciences, vol. 5, pp 359–368.
Anaafo, D 2015, ‘Land reforms and land rights change: A case study of land stressed groups in the Nkoranza
South Municipality, Ghana’, Land Use Policy, vol 42, pp 538-546.
Belt, SV., van der Grinten, M., Malone, G., Patterson, P & Shockey, R 2007, ‘Windbreak Plant Species for
Odour Management around Poultry Production Facilities’, Maryland Plant Materials Technical Note No.
1. USDA-NRCS National Plant Materials Center, Beltsville, MD. 21p.

South African Journal of Geomatics, Vol. 6. No. 3, October 2017
307
Binswanger-Mkhize, H.P, Bourguignon, C & Brink, R 2009, ‘Agricultural Land Redistribution: Toward
Greater Consensus’, International Bank for Reconstruction and Development / The World Bank. 1818 H
Street NW, Washington DC 20433.
Baniya, N 2008, ‘Land suitability evaluation using GIS for vegetable crops in Kathmandu valley, Nepal’
Ph.D. thesis submitted to Humboldt University of Berlin.
Chesworth, W 2008, ‘Encyclopaedia of Soil Science (Encyclopaedia of Earth Sciences)’, Springer 2008,
XXVI, 902 p.
DAFF 2010, ‘Maize— Production guideline’, Directorate Plant Production, Private Bag X250, Pretoria 0001.
ARC-Grain Crops Institute, Pretoria, South Africa.
DAFF 2013, ‘Strategic plan 2011/12 to 2014/15’, Directorate Agricultural Information Services Private Bag
X144, Pretoria 0001.
Dale, PF & McLaren, RA 2005, ‘GIS in land administration’. In: Harlow & Longman, eds. Geographical
Information Systems: Principles, Techniques, Management and Applications, Abridged Edition ed. New
York: John Wiley & Sons, Inc., pp. 859-875.
Dardagan, C 2012, ‘Land reform a failure’. Accessed 2015-12-03, Available: http://www.plaas.org.za/news-
categories/land-reform?page=58
DLA (Department of Land Affairs) 1997, ‘White Paper on South African Land Policy’, Pretoria: DLA.
FAO 2007, ‘The state of food and agriculture 2007’. FAO, Viale delle Terme di Caracalla, 00100 Rome,
Italy.
Farmers weekly 2012, ‘Land reform a failure, says minister’. Accessed 2015-11-13, Available:
http://alibuye.co.za/?p=165.
Kerry, R., Oliver, MA & Frogbrook, ZL 2010. ‘Geostatistical applications for precision agriculture’,
International Journal of Applied Earth Observation and Geoinformation, Vol 5, pp 55–64.
Lahiff, E & Li, G 2012. ‘Land redistribution in South Africa: A critical review’. Agricultural Land
Redistribution and Land Administration in Sub-Saharan Africa, 27.
Lu, D & Weng, Q 2007. ‘A survey of image classification methods and techniques for improving
classification performance’, International Journal of Remote Sensing, vol. 28(5), pp 823–870.
McHugh, M 2012, ‘Interrater reliability: the kappa statistic’, Biochemia Medica, vol. 22(3): pp 276–282.
READ. 2015, ‘Climate Change Vulnerability: North West Province’. Climate Support Programme (CSP).
Pegasys Strategy and Development (Pty) Ltd
STATSSA (Statistics South Africa), 2012, ‘Census 2011 Statistical release’, Statistics South Africa, Private
Bag X44, Pretoria 0001. Available: www.statssa.gov.za.
Törhönen, M 2004, ‘Sustainable land tenure and land registration in developing countries, including a
historical comparison with industrialised country’. Computers, Environment and Urban Systems, vol.
28(5), 545-586.
Warriner, D 1969, ‘Land reform in principle and practice’, Clarendon Press: Oxford. ISSN: 1356-9228.