Embed Size (px)
Citation preview
Intro to SPSS
Kin 260Jackie Kiwata
Overview Intro to SPSS
Defining Variables Entering Data Analyzing Data SPSS Output
Analyzing Data Max, Min, Range Percentiles Mode, Median, Mean Standard Deviation
What is SPSS?
Stands for Statistical Package for the Social Sciences
Well suited for survey and experimental research
Includes statistical analysis and graphical presentation of data

Opening SPSS
Start > Programs > Coursework > SPSS
Choose Type in data to begin

The SPSS Windows
Data View: Used for data input
Variable View: Used for adding variables and defining variable properties
How to use SPSS in general
1. Define variables in Variable View2. Enter data in Data View3. Analyze4. Get Output
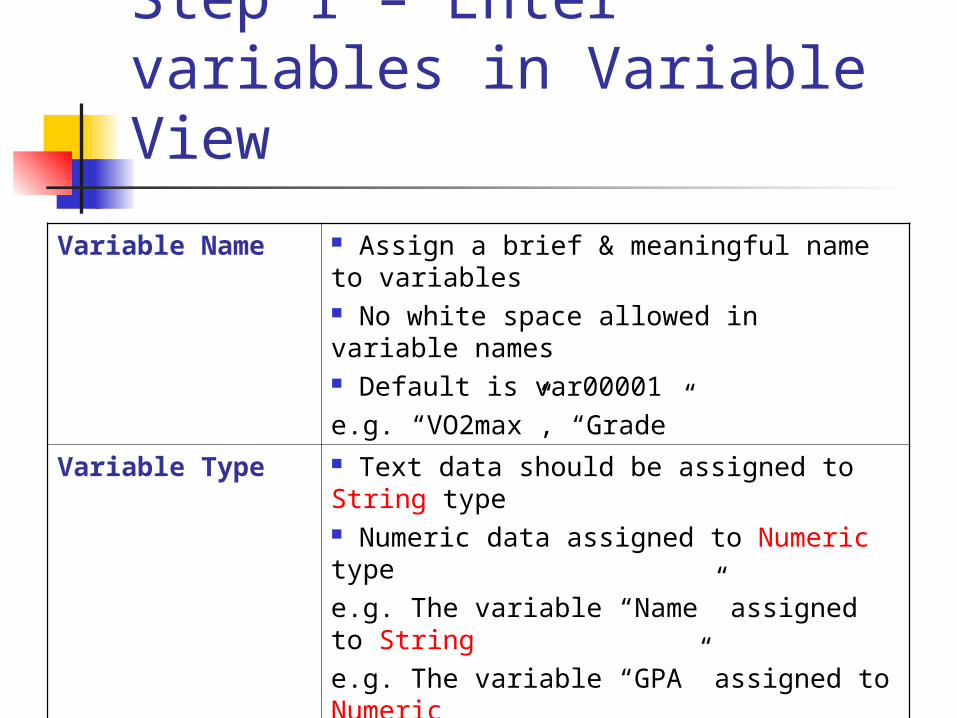
Step 1 – Enter variables in Variable View
Variable Name Assign a brief & meaningful name to variables No white space allowed in variable names Default is var00001e.g. “VO2max”, “Grade”
Variable Type Text data should be assigned to String type Numeric data assigned to Numeric typee.g. The variable “Name” assigned to Stringe.g. The variable “GPA” assigned to Numeric
Value Labels Use value labels for variables with constant valuese.g. The variable “Gender” would have Male and Female labels
Ex 1 – Defining Variables
Define 2 variables Name – name of person GPA – grade point average with 2
decimal places
Step 2 - Enter Data
Enter data after defining variables If variables are defined as
Numeric, SPSS will only accept numeric digits
If variables are defined as String, SPSS will accept any keyboard character
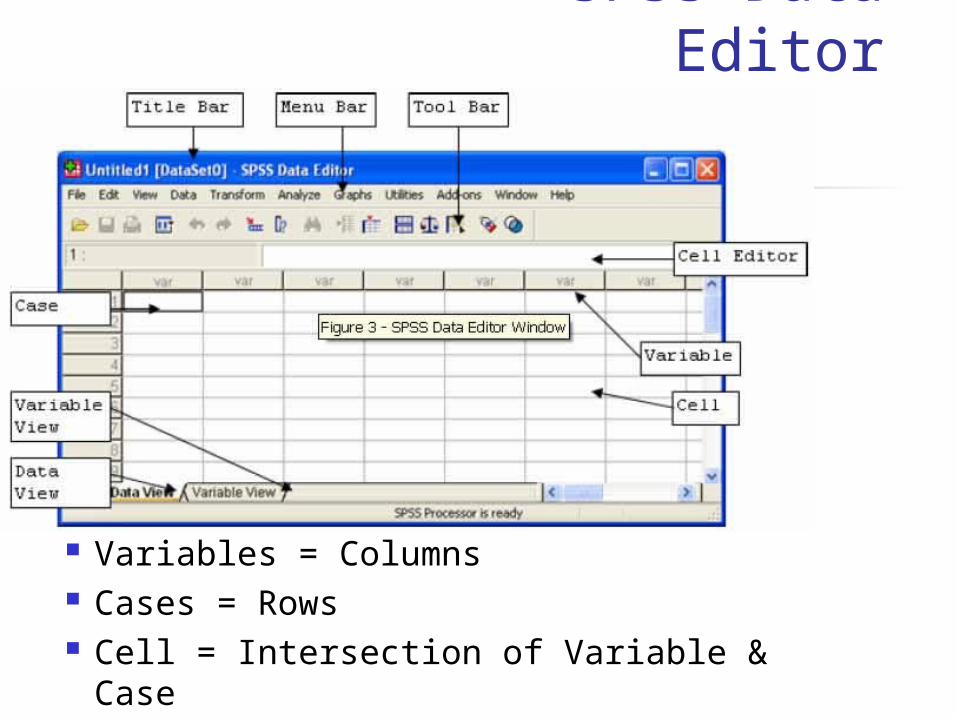
SPSS Data Editor
Variables = Columns Cases = Rows Cell = Intersection of Variable & Case

Ex 2 – Enter Data
Name GPA
Jimmy 3.52
Sheila 2.57
Amanda 3.89
Derek 3.60
Step 3 – Analyze Data
Today, we will analyze: Minimum, maximum, range Percentiles Mode, median, mean Standard Deviation
Should know concept and/or how to do by hand in addition to using SPSS
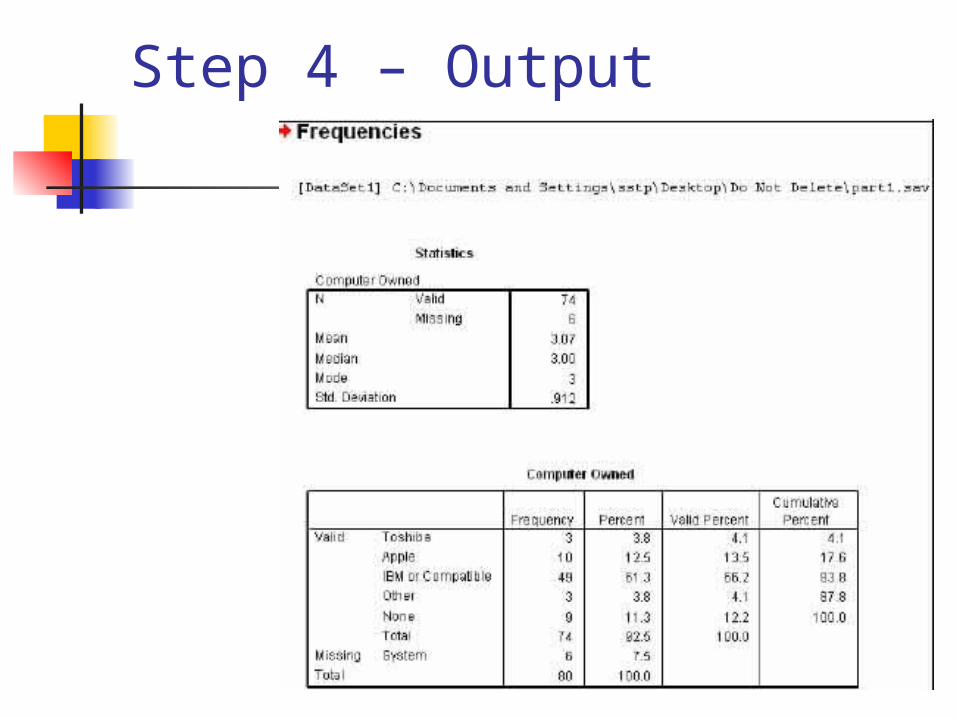
Step 4 – Output
Ex 3 – Find Mean of GPA
Use SPSS to find the GPA mean of the students
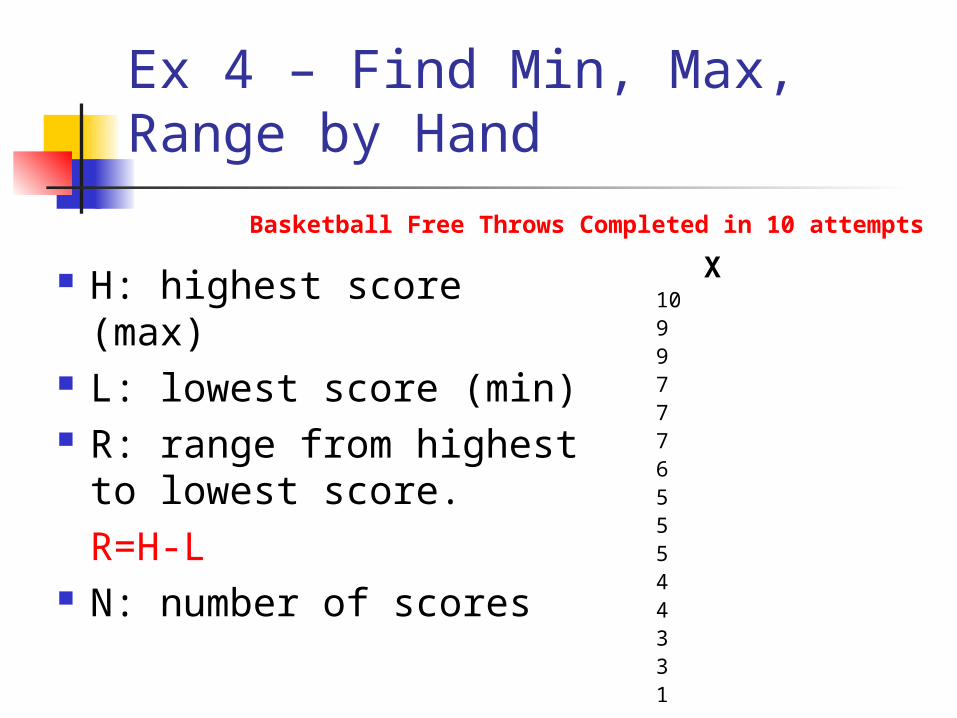
Ex 4 – Find Min, Max, Range by Hand
H: highest score (max) L: lowest score (min) R: range from highest
to lowest score. R=H-L
N: number of scores
X10997776555443 31
Basketball Free Throws Completed in 10 attempts
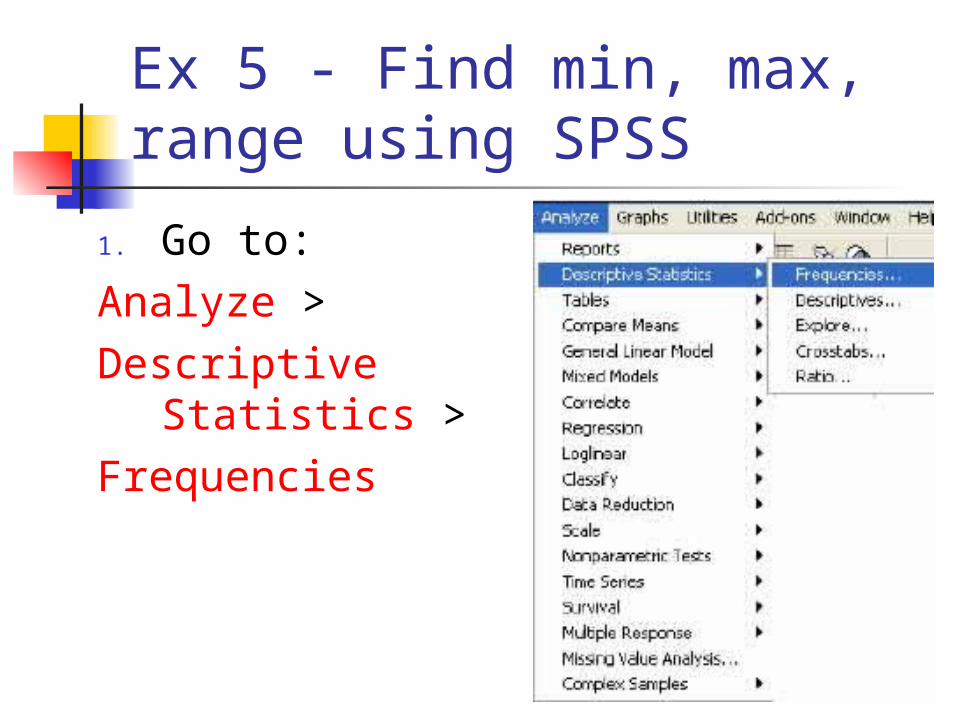
Ex 5 - Find min, max, range using SPSS
1. Go to: Analyze >Descriptive Statistics
>Frequencies

SPSS: Frequencies
2. Add variables to analysis3. Click on Statistics button

SPSS: Statistics
4. Checkbox the statistics
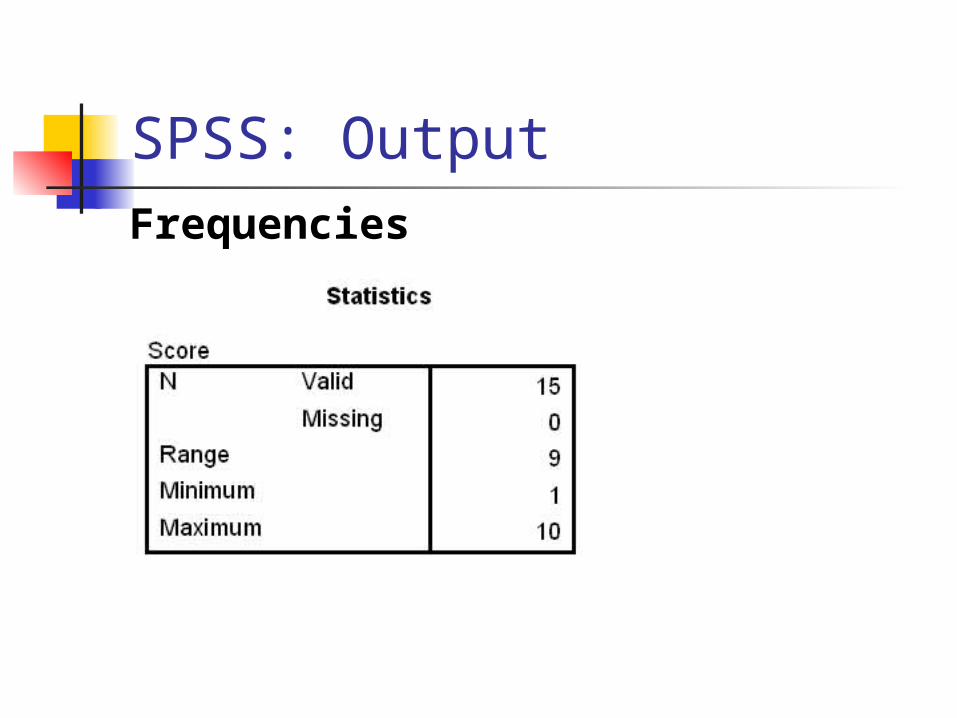
SPSS: OutputFrequencies
Saving Output Table
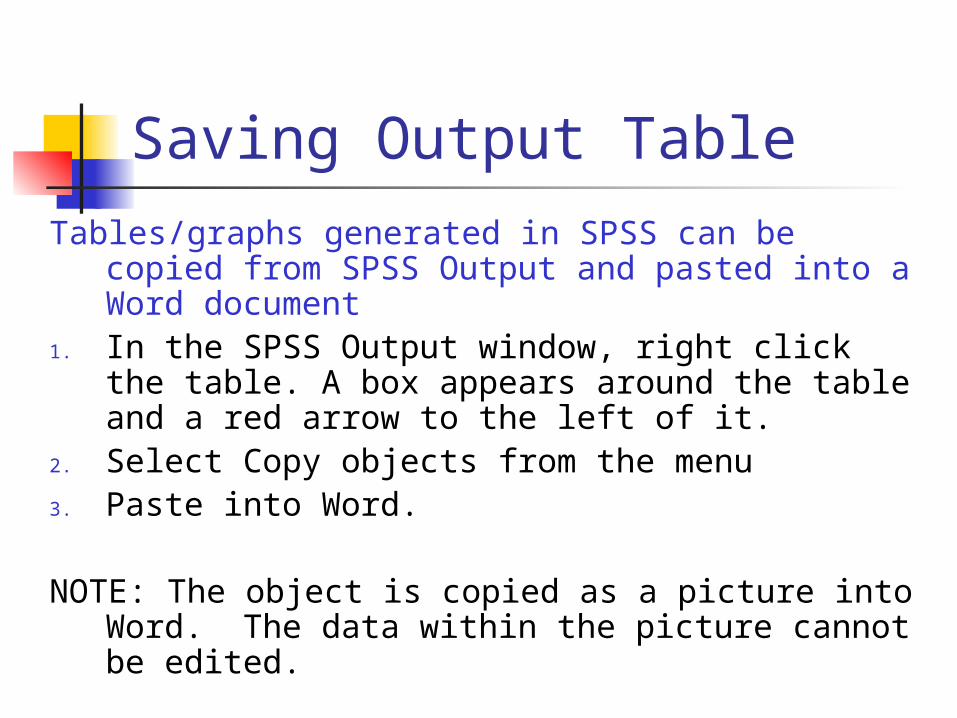
Tables/graphs generated in SPSS can be copied from SPSS Output and pasted into a Word document
1. In the SPSS Output window, right click the table. A box appears around the table and a red arrow to the left of it.
2. Select Copy objects from the menu3. Paste into Word.
NOTE: The object is copied as a picture into Word. The data within the picture cannot be edited.

Percentiles
A point on a continuous scale of 100 divisions such that a certain fraction of raw scores lies at or below that point
e.g. The 75th percentile is equal to or better than ¾ of the scores
e.g. The 50th percentile is equal to or better than ½ of the scores

Percentile Problem
A high school basketball coach decides the 60th percentile should be the cutoff point for selecting varsity team athletes.
If the coach uses free throw scores as a criterion, how many baskets must a player make to qualify?

By Hand - Percentiles
1. Convert percentile to decimal2. Multiply decimal by N and round
off to the nearest integer.3. Value obtained is the number of
scores from the bottom, so count from the bottom up.

By Hand – Percentiles, con’t.
1. Convert percentile to decimal.60% = .60
2. Multiply decimal by N and round off if necessary.60 * 15 = 9
3. Count that many scores from the bottom up.9 scores from the bottom is 6.
Therefore, a player needs to make 6 or more free throws in order to qualify.
X = Basketball free throws completed in 10 attempts
1099777655544 N=153 H=103 L=11
R=10-1=9
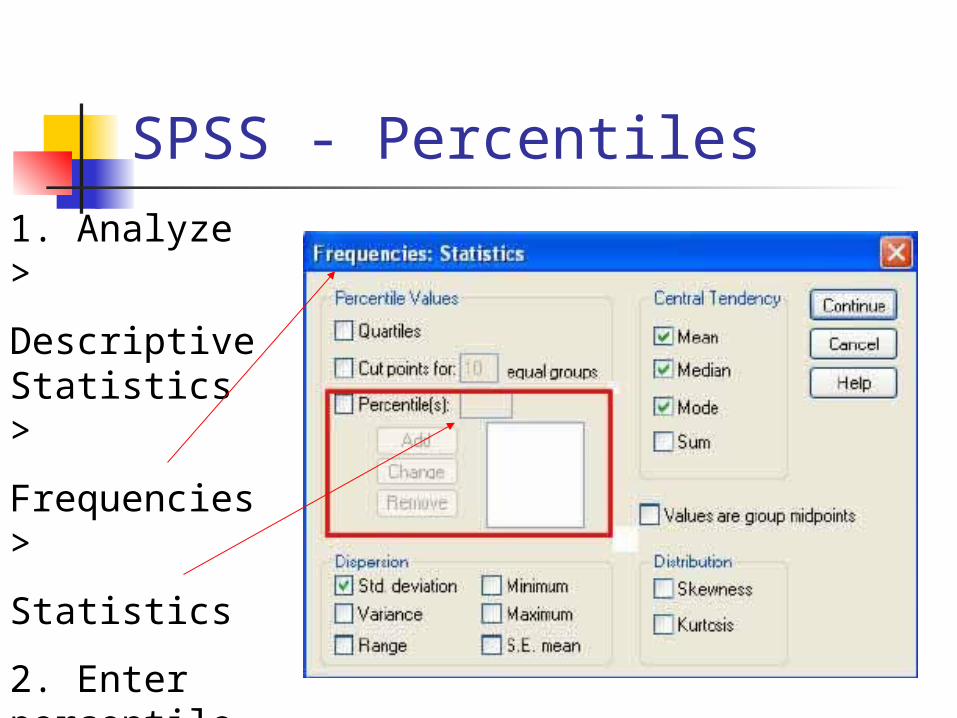
SPSS - Percentiles1. Analyze >
Descriptive Statistics >
Frequencies >
Statistics
2. Enter percentile

Percentile Output
What’s wrong with this result?

Mode
The score that occurs most frequently Can be bimodal or multimodal
E.g. 1, 2, 3, 4, 4, 5, 5, 5, 6, 6, 6, 7 Mode = ?
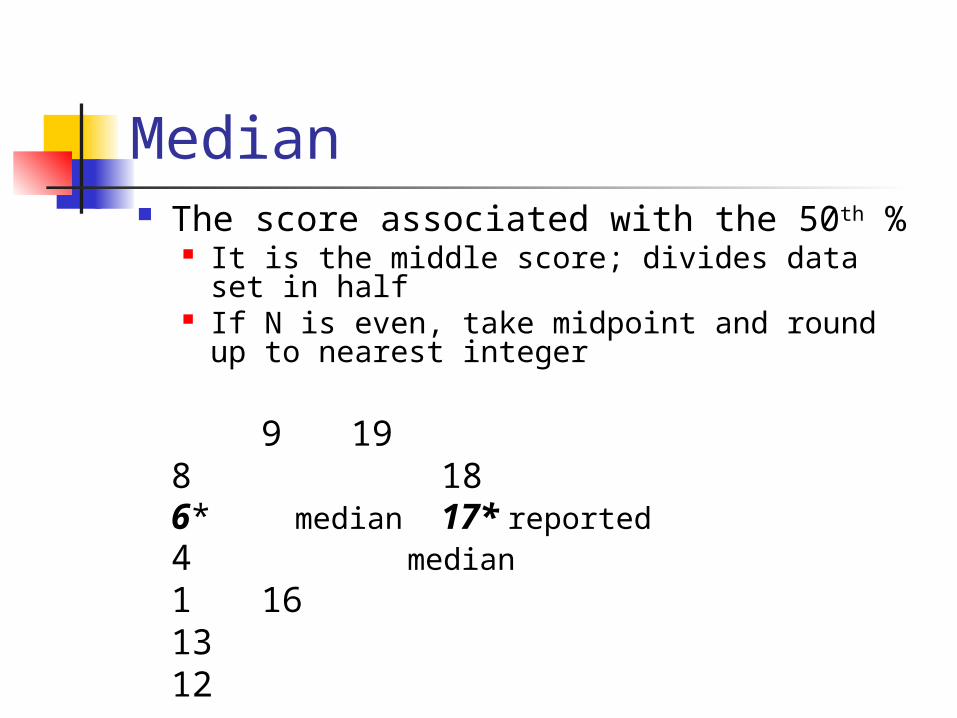
Median The score associated with the 50th %
It is the middle score; divides data set in half If N is even, take midpoint and round up to
nearest integer
9 198 186* median 17*
reported4 median1 16
1312
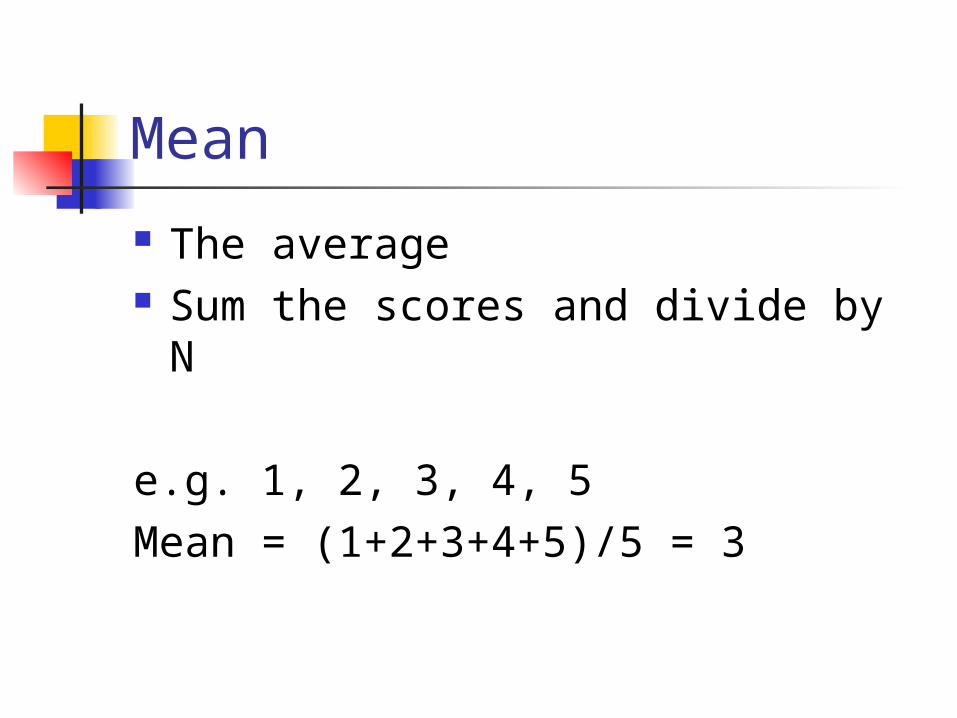
Mean
The average Sum the scores and divide by N
e.g. 1, 2, 3, 4, 5Mean = (1+2+3+4+5)/5 = 3
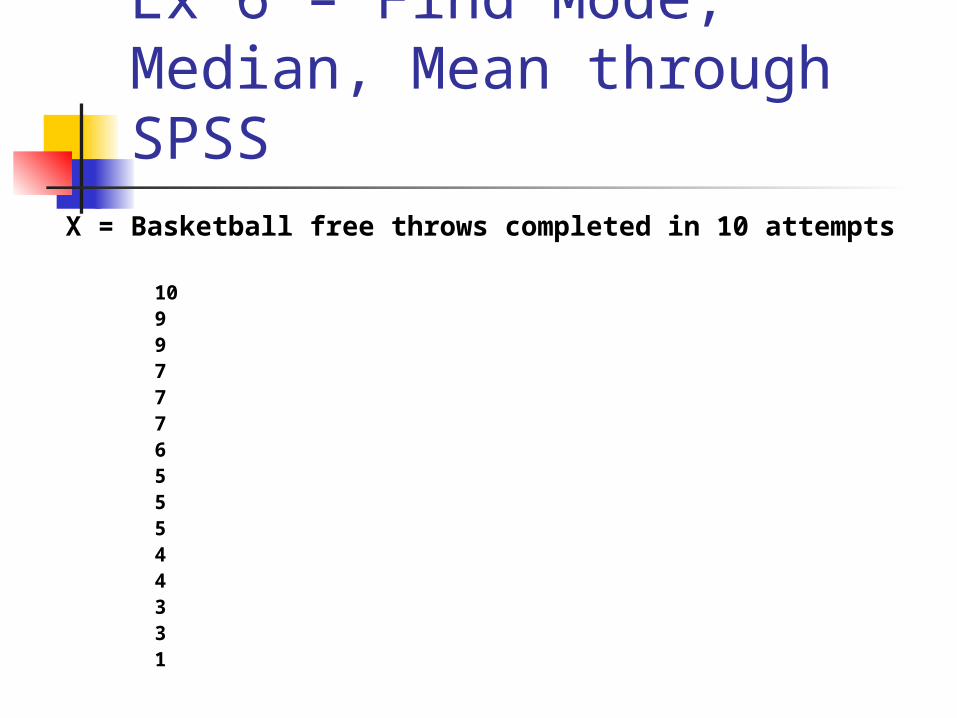
Ex 6 – Find Mode, Median, Mean through SPSS
X = Basketball free throws completed in 10 attempts
10997776555443 31
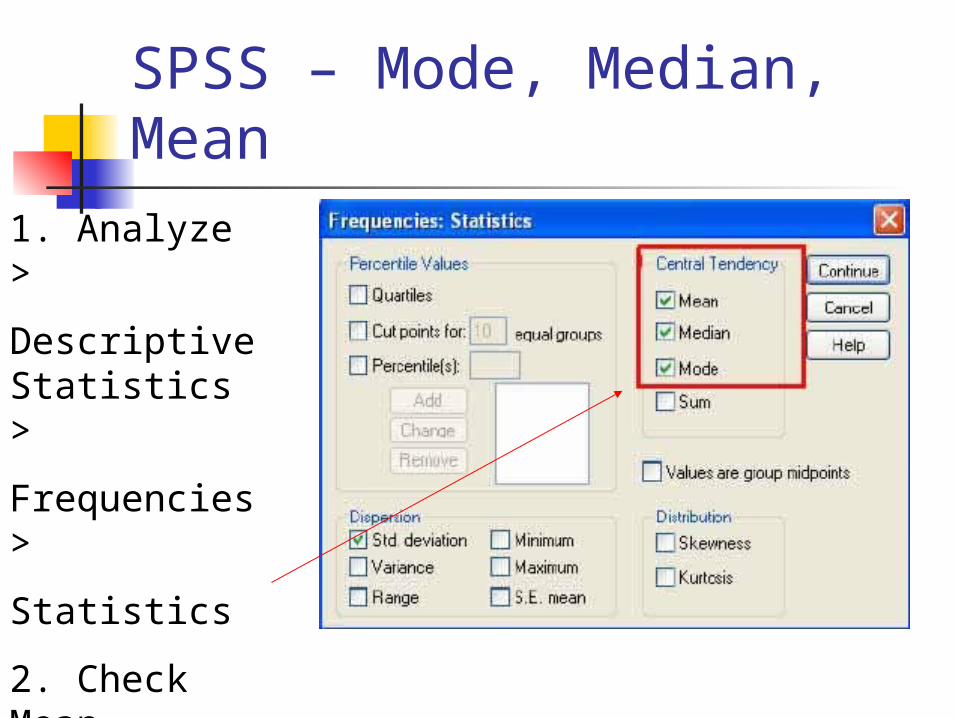
SPSS – Mode, Median, Mean
1. Analyze >
Descriptive Statistics >
Frequencies >
Statistics
2. Check Mean, Median, Mode
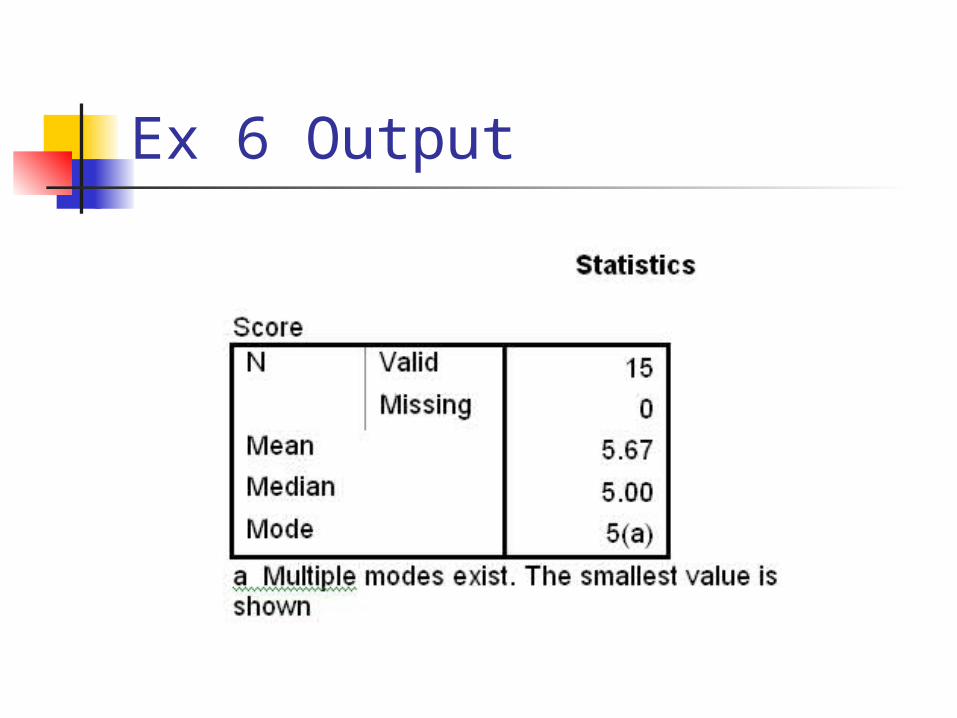
Ex 6 Output
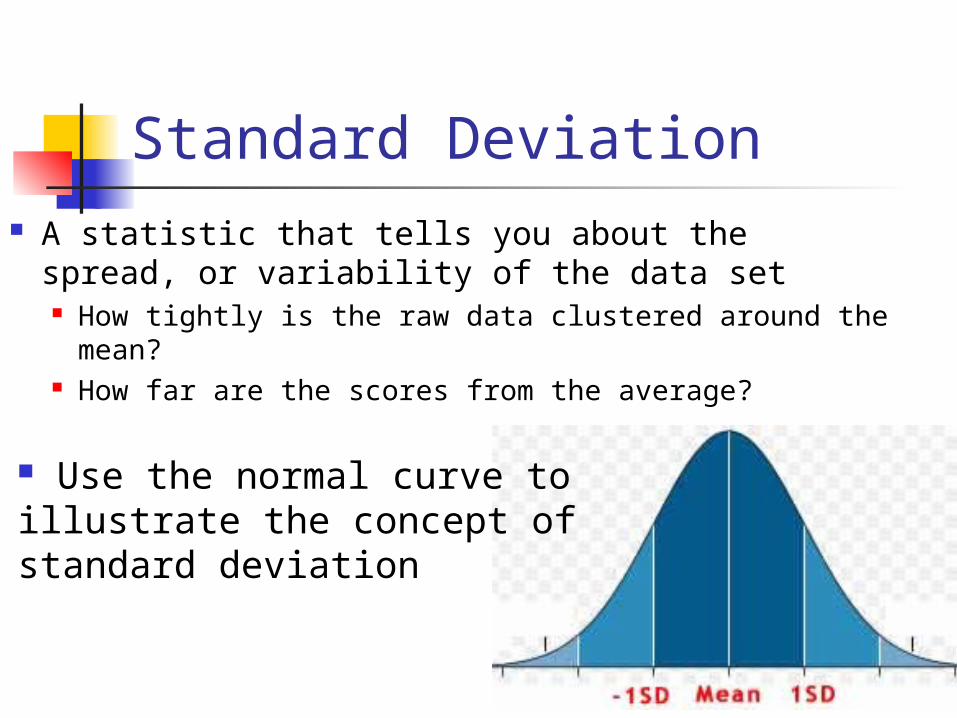
Standard Deviation A statistic that tells you about the spread, or
variability of the data set How tightly is the raw data clustered around the
mean? How far are the scores from the average?
Use the normal curve to illustrate the concept of standard deviation
Standard Deviation con’t.
Large SD indicates many data points are far from the mean Normal curve is longer and flatter
Small SD indicates many data points are close to the mean Normal curve is steeper and narrower
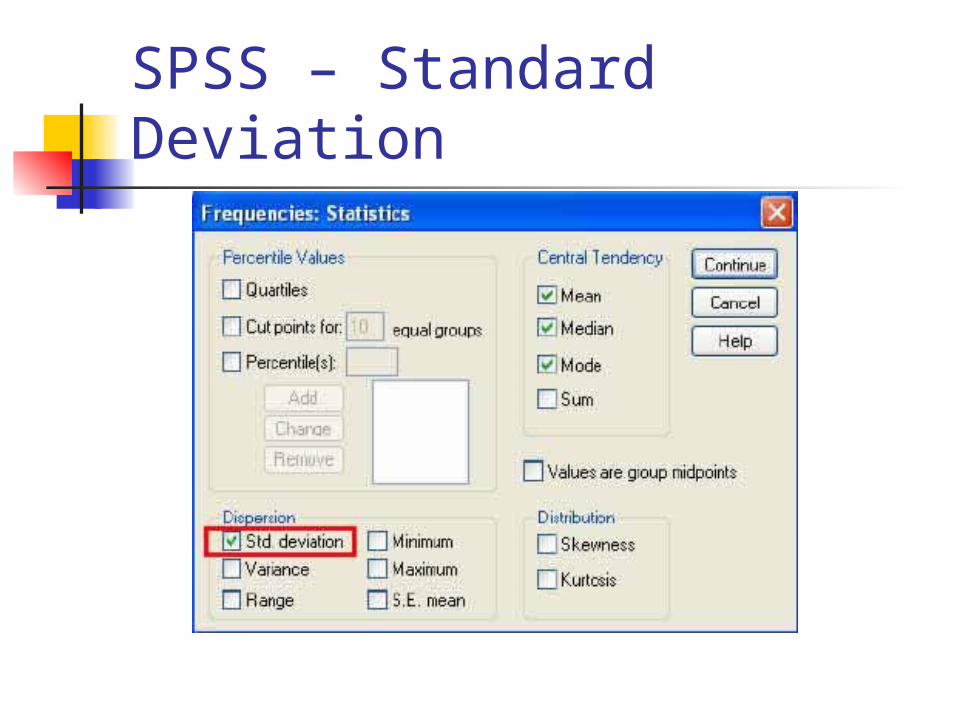
SPSS – Standard Deviation
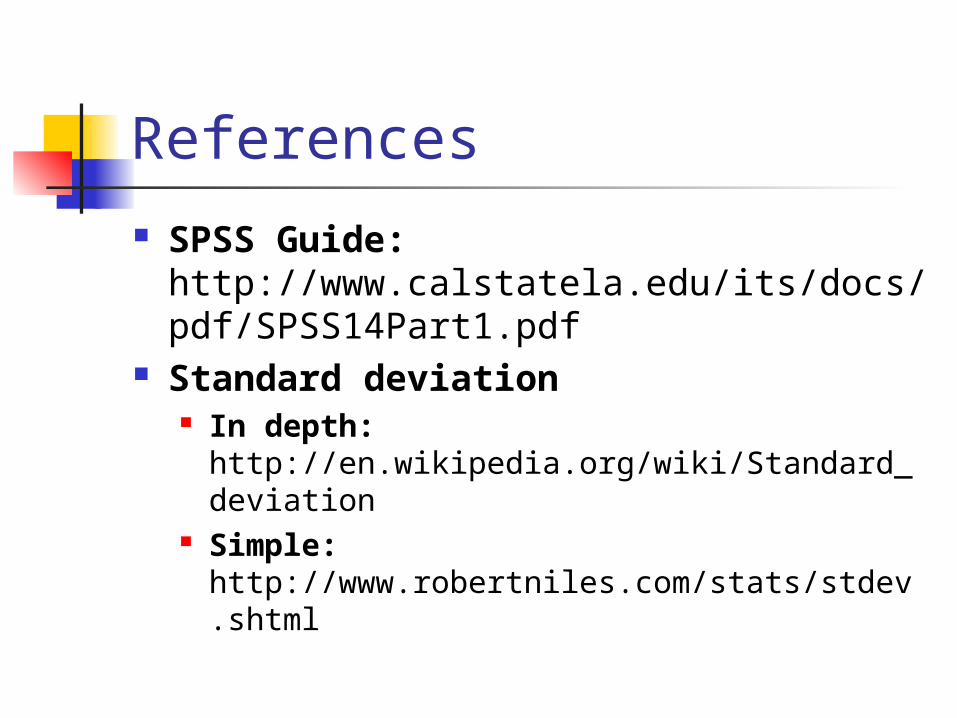
References SPSS Guide:
http://www.calstatela.edu/its/docs/pdf/SPSS14Part1.pdf
Standard deviation In depth:
http://en.wikipedia.org/wiki/Standard_deviation
Simple: http://www.robertniles.com/stats/stdev.shtml