Embed Size (px)
Citation preview

INTRINSYC TECHNOLOGIES CORPORATION
QUARTERLY REPORT
THIRD QUARTER FISCAL 2017
For the Three and Nine Months ended September 30, 2017 and 2016

Chief Executive Officer Letter
Dear Fellow Shareholder,
Intrinsyc reported revenue of US$4.8 million (CDN$6.0 million), up 6% from the previous quarter and 19% over the
same period in the prior year. The increase from the comparable periods was due to higher revenue from the Company’s
computing products. Net income performance in the third quarter was higher than the previous quarter due primarily
to an increase in revenue.
The Company continued its steady progress with our fourth consecutive quarter of revenue growth. Revenue would
have been higher except for the deferral of revenue from engineering services projects performed in the quarter, and
delays in shipping some hardware orders. We expect to recognize revenue from the deferred engineering services
projects and hardware sales in the fourth quarter. Another factor that hampered higher revenue growth in the quarter
was the availability of engineering resources.
Intrinsyc has been able to achieve four consecutive quarters of revenue growth in spite of the sequential and substantial
decline in revenue derived from our largest client in the years 2014 – 2016. The combination of the decline in relatively
higher margin engineering services revenue from this client and our increased R&D spending, as well as the increase in
the value of the Canadian dollar, has impacted our EBITDA performance in 2017. We are optimistic that our client will
receive the necessary funding to re-engage with Intrinsyc.
We launched our first development kit and System on Module (“SOM”), the Open-Q™ 2100, to target the wearable
computing market in the second quarter. The wearable computing market is forecasted to be worth over $34 billion by
2020, by CCS Insight in their February 2016, “Global Wearable Forecast.”
In the third quarter, Ken Tough, Director of Engineering Services at Intrinsyc, wrote a blog:
https://www.intrinsyc.com/future-wearables-open-q-2100/, “The Future of Wearables” In this blog, Ken addresses the
technical challenges in the wearables market and how Intrinsyc’s Open-Q™ 2100 platform, based on the Snapdragon
2100 Wear from Qualcomm Technologies, Inc., is the ideal platform for small form factor wearables; such as smart
watches, fitness trackers, elderly and kid trackers, and more.
Intrinsyc was invited by Qualcomm to present our wearable computing solutions at the Wearable Computing VIP session
at the Qualcomm 4G/5G summit, in Hong Kong, in early October.
We have significant interest in our Open-Q 2100, and already signed our first agreement to assist in the development of
a pet tracking device. We expect this product will be in production in the first quarter of 2018 and we will begin to ship
computing modules for production at that time.
The Open-Q™ 626 Development Kit and System on Module (“SOM”) was launched in the third quarter. The Open-
Q™ 626 is ideal for connected camera devices and the trend toward putting more computing power in devices near the
edges of networks, like sensor modules and gateways. Higher processing power in IoT devices is less expensive because
filtering and analytics where the data is collected can reduce communications costs, and it enables faster decisions, rather
than waiting for computations and analytics to take place in the cloud. The Open-Q™ 626 is based on the Snapdragon
626 from Qualcomm Technologies Inc. This chip can capture 24-megapixel images and 4K video at 30 frames per
second, and also has the capability for deep learning.
We signed our first development services agreement with a client for the 626, even prior to announcing the Open-Q™
626 on August 30, 2017. The agreement with this client will not include the purchase of computing modules, however
Intrinsyc is being paid for engineering services performed and will receive a per device royalty once the client ships
their product. We have several prospective OEM clients for the 626 in our sales pipeline.
Just after quarter end, we announced the Open-Q™ 660 Hardware Development Kit, based on the Snapdragon 660 from
Qualcomm Technologies, Inc. The Snapdragon 660 is designed to provide a leap in performance; supporting advanced
photography and enhanced gaming, in addition to long battery life for top-tier mobile devices. The Open-Q™ 660 is an

early-access platform that supports the ecosystem of technology companies and application providers to integrate and
innovate for devices based on the latest Snapdragon mobile platform, as well as provide original equipment
manufacturers (“OEMs”), developers and engineers with next generation software technology and tools to accelerate
development and testing of devices.
Continuing our prolific product development pace, the Company is working in collaboration with Qualcomm to
introduce two new products in the fourth quarter that are targeted at voice controlled products, such as smart speakers
and other connected home devices. According to Global Market Insights, June 2017 Report, the Smart Speaker Market
size was over US$400 million in 2016 and is predicted to grow at an estimated CAGR of over 50% from 2017 to 2024.
With these new product introductions, the Company now has computing solutions across all four tiers of Qualcomm’s
Snapdragon processors, 200 Series, 400 Series, 600 Series, and 800 Series. This enables Intrinsyc to address a broad set
of IoT product opportunities. Our broad set of IoT computing solutions puts us into a favorable competitive position and
makes Intrinsyc a valuable technology partner for Qualcomm’s IoT initiatives.
We followed up last quarter’s strong order booking with another excellent quarter, positioning the Company for
accelerated revenue growth in the fourth quarter. As a reminder, in the second quarter we received an order valued at
US$2,990,000 for memory components, which are planned for use in building computing modules for a Global 500
company. Revenue from the sale of memory components will be in approximately even installments in Q4 of 2017, and
Q1 and Q2 of 2018. While not contractually obligated at this time, beyond the purchase of these memory components,
we expect our client to place future orders for full computing modules that incorporate this memory. Should this occur
as planned, the Company would recognize additional revenues in excess of US$10,000,000 through early fiscal 2019
from this client.
Quarterly Business Highlights
• The Company increased design and production wins for Open-Q™ computing modules from 42 to 44 and 18 to 19,
respectively, during the quarter. Design and production wins are important metrics to track our progress in building
Intrinsyc’s business with scalable repeat revenue.
• Received an order, from an existing client, that is valued at US$916,000. The non-cancellable order incorporates
memory purchased by the client under a previous order valued at US$100,000, resulting in a net value of
US$816,000. This order is expected to ship in the fourth quarter.
• Received orders that are in aggregate valued at US$623,000. One order is from a medical device company that plans
to use a next-generation design of the Company’s Open-Q™ embedded computing modules, currently in
development; and the second order is for the development of a custom designed embedded computing module. The
second order includes a provision for a per-unit royalty fee as the client ships their product. Product development
services are expected to be completed in 2017.
• Ken Tough, Manager, Director of Engineering Services at Intrinsyc, wrote a blog:
https://www.intrinsyc.com/future-wearables-open-q-2100/, “The Future of Wearables” In this blog Ken addresses
the technical challenges in the wearables market and how Intrinsyc’s Open-Q 2100 platform, is the ideal platform
for small form factor wearables; such as smart watches, fitness trackers, elderly and kid trackers, and more. The
wearable computing market is forecasted to be worth over $34 billion by 2020, by CCS Insight in their February
2016 “Global Wearable Forecast.”
• Intrinsyc launched its first development kit and system-on-module, the Open-Q™ 2100, to target the wearable
computing market in the second quarter. By July, the Company received its first design win for use in a pet tracking
device. Intrinsyc expects to start shipping modules for commercial products beginning in the first quarter 2018.
• Announced the availability of the Open-Q™ 626 System on Module (“SOM”) and Development Kit and signed its
first agreement for product development services based on this module. The Open-Q™ 626 is ideal for connected
camera devices and the trend toward putting more computing power in devices near the edges of networks, like
sensor modules and gateways. Higher processing power in IoT devices is less expensive because filtering and
analytics where the data is collected can reduce communications costs, and it enables faster decisions, rather than
waiting for computations and analytics to take place in the cloud.
• Received approval from the TSX regarding the notice filed by the Company to establish a normal course issuer
bid (“NCIB”) program to purchase, for cancellation, up to 500,000 common shares or approximately 2.4% of
Intrinsyc’s issued and outstanding common shares, as at September 21, 2017. The NCIB program commenced on
October 4, 2017 and will terminate on October 3, 2018, or on such earlier date as the Company may complete its
purchases pursuant to a Notice of Intention filed with the TSX. To date, the Company has purchased and cancelled
90,000 common shares for CDN$146,528.
Financial Highlights
Three Month Comparative Results
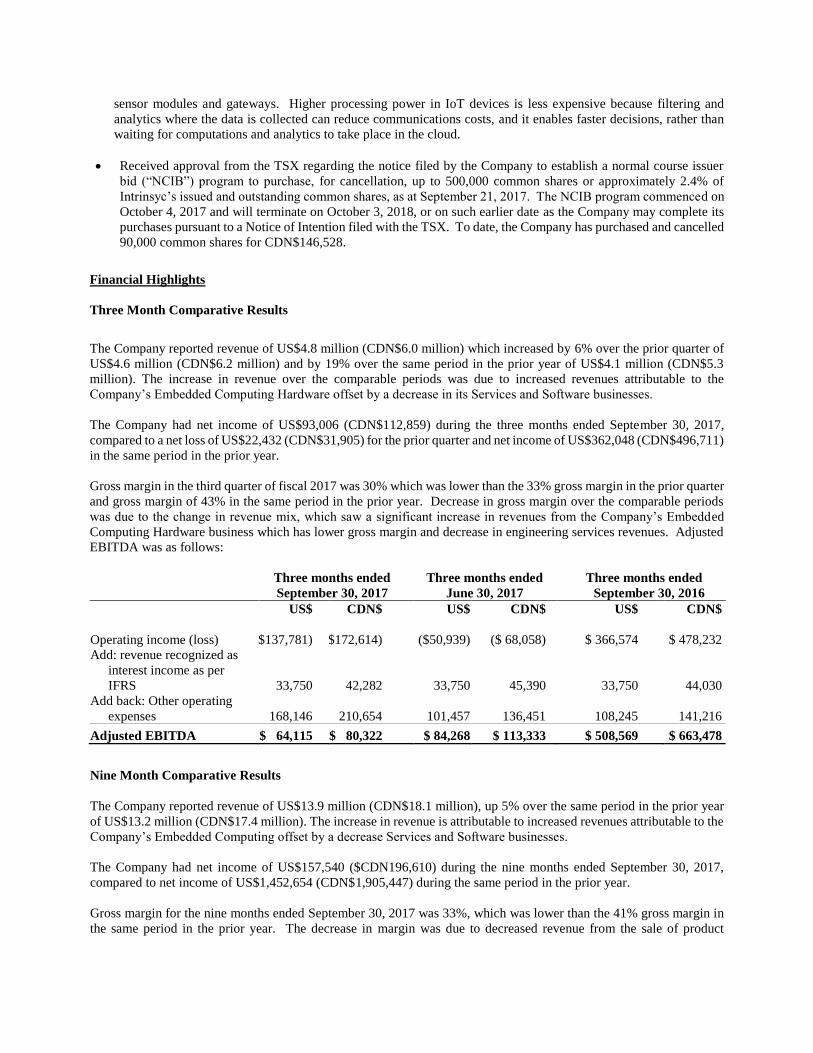
The Company reported revenue of US$4.8 million (CDN$6.0 million) which increased by 6% over the prior quarter of
US$4.6 million (CDN$6.2 million) and by 19% over the same period in the prior year of US$4.1 million (CDN$5.3
million). The increase in revenue over the comparable periods was due to increased revenues attributable to the
Company’s Embedded Computing Hardware offset by a decrease in its Services and Software businesses.
The Company had net income of US$93,006 (CDN$112,859) during the three months ended September 30, 2017,
compared to a net loss of US$22,432 (CDN$31,905) for the prior quarter and net income of US$362,048 (CDN$496,711)
in the same period in the prior year.
Gross margin in the third quarter of fiscal 2017 was 30% which was lower than the 33% gross margin in the prior quarter
and gross margin of 43% in the same period in the prior year. Decrease in gross margin over the comparable periods
was due to the change in revenue mix, which saw a significant increase in revenues from the Company’s Embedded
Computing Hardware business which has lower gross margin and decrease in engineering services revenues. Adjusted
EBITDA was as follows:
Three months ended
September 30, 2017
Three months ended
June 30, 2017
Three months ended
September 30, 2016
Operating income (loss)
US$
($137,781)
CDN$
($172,614)
US$
($50,939)
CDN$
($ 68,058)
US$
$ 366,574
CDN$
$ 478,232
Add: revenue recognized as
interest income as per
IFRS 33,750 42,282 33,750 45,390 33,750 44,030
Add back: Other operating
expenses 168,146 210,654 101,457 136,451 108,245 141,216
Adjusted EBITDA $ 64,115 $ 80,322 $ 84,268 $ 113,333 $ 508,569 $ 663,478
Nine Month Comparative Results
The Company reported revenue of US$13.9 million (CDN$18.1 million), up 5% over the same period in the prior year
of US$13.2 million (CDN$17.4 million). The increase in revenue is attributable to increased revenues attributable to the
Company’s Embedded Computing offset by a decrease Services and Software businesses.
The Company had net income of US$157,540 ($CDN196,610) during the nine months ended September 30, 2017,
compared to net income of US$1,452,654 (CDN$1,905,447) during the same period in the prior year.
Gross margin for the nine months ended September 30, 2017 was 33%, which was lower than the 41% gross margin in
the same period in the prior year. The decrease in margin was due to decreased revenue from the sale of product

development engineering services, offset by an increase in sales of hardware products. Adjusted EBITDA was as
follows:
Nine months ended
September 30. 2017
Nine months ended
September 30, 2016
Operating income (loss)
US$
($184,069)
CDN$
($ 234,966)
US$
$ 1,069,627
CDN$
$ 1,409,843
Add: revenue recognized as
interest income as per
IFRS 101,250 132,351 101,250 133,826
Add back: Other operating
expenses 334,132 432,527 344,122 455,111
Adjusted EBITDA $ 251,313 $ 329,912 $ 1,514,999 $ 1,998,780
Financial Position as at September 30, 2017
Working capital as of September 30, 2017 was US$12.1 million (CDN$15.1 million) inclusive of cash and short term
investments of US$7.7 million (CDN$9.6 million). This is compared to net working capital of US$11.7 million
(CDN$15.7 Million) as of December 31, 2016 inclusive of cash and short-term investments of US$7.6 million
(CDN$10.1 million).
Looking Forward
We are excited by our growth opportunities driven by our new products and our very strong technology partnerships.
Our new products generate design wins; providing revenue from engineering services and ultimately repeat hardware
sales. We intend to maintain our high pace of product introduction for the foreseeable future. To enable our expected
growth, we are aggressively focused on recruiting engineers and enhancing our product development and delivery
capabilities.
Based on our previously announced booked orders and backlog, we expect accelerated growth in the fourth quarter and
into 2018.
I thank you for your continued confidence in Intrinsyc and look forward to reporting to you on our further achievements.
Yours sincerely,
“Tracy Rees”
President and Chief Executive Officer
November 8, 2017

INTRINSYC TECHNOLOGIES CORPORATION
For the Three and Nine Months ended September 30, 2017
Part I. Financial Information
Page
Financial Statements
a) Interim Condensed Consolidated Statements of Financial Position as at September 30, 2017 and
December 31, 2016 (unaudited) 1
b) Interim Condensed Consolidated Statements of Operations and Comprehensive Loss for the three
and nine months ended September 30, 2017 and September 30, 2016 (unaudited) 2
c) Interim Condensed Consolidated Statements of Changes in Shareholders’ Equity for the three and
nine months ended September 30, 2017 and September 30, 2016 (unaudited) 3
d) Interim Condensed Consolidated Statements of Cash Flows for the three and nine months ended
September 30, 2017 and September 30, 2016 (unaudited) 4
e) Notes to Consolidated Financial Statements 5
Management’s Discussion and Analysis of Financial Condition and Results of Operations 20
Risks and Uncertainties 40
Certifications of Interim Filings 47

NOTICE OF NO AUDITOR REVIEW OF INTERIM FINANCIAL STATEMENTS
Under National Instrument 51-102, Part 4, subsection 4.3(3) (a), if an auditor has not performed a review of the
interim financial statements, they must be accompanied by a notice indication that financial statements have not
been reviewed by an auditor.
The accompanying unaudited interim condensed consolidated financial statements of the Company have been prepared
by management and approved by the Audit Committee of the Board of Directors of the Company and the Board of
Directors of the Company.
The Company’s independent auditors have not performed a review of these interim condensed consolidated financial
statements in accordance with the standards established by CPA Canada for a review of interim financial statements by
an entity’s auditors.
“George Reznik”
Chief Financial Officer
November 8, 2017

1
INTRINSYC TECHNOLOGIES CORPORATION
Interim Condensed Consolidated Statements of Financial Position
(Unaudited and Expressed in U.S. Dollars)
As at
September 30,
2017
December 31,
2016
ASSETS
Current assets
Cash and cash equivalents $ 4,546,543 $ 5,381,518
Short-term investments 3,132,350 2,169,402
Trade and other receivables (notes 4 and 11) 4,345,613 3,783,870
Loan to customer (note 5) 1,736,250 1,657,500
Inventory (note 6) 2,400,027 1,294,302
Prepaid expenses 193,134 136,378
16,353,917 14,422,970
Non-Current Assets
Prepaid expenses 28,385 24,085
Equipment (note 7) 333,461 351,500
Intangible assets (note 8) 109,146 111,851
Total assets $ 16,824,909 $ 14,910,406
LIABILITIES AND SHAREHOLDERS' EQUITY
Current liabilities
Trade and other payables $ 3,254,934 $ 2,168,678
Deferred revenue 1,012,596 586,793
Total liabilities 4,267,530 2,755,471
Shareholders' equity
Share capital (note 9) 109,058,054 108,977,225
Other capital reserves – share based payments 10,214,222 10,050,147
Deficit (106,807,333) (106,964,873)
Translation of operations reserve 92,436 92,436
Total shareholders' equity 12,557,379 12,154,935
Total liabilities and shareholders' equity $ 16,824,909 $ 14,910,406
Commitments and contingencies (note 10)
See accompanying notes to interim condensed consolidated financial statements

2
INTRINSYC TECHNOLOGIES CORPORATION
Interim Condensed Consolidated Statements of Operations (Unaudited and Expressed in U.S. Dollars)
For the
Three months
ended
September 30,
2017
Three months
ended
September 30,
2016
Nine months
ended
September 30,
2017
Nine months
ended
September 30,
2016
Revenues (note 12) $ 4,825,003 $ 4,065,815 $ 13,866,447 $ 13,158,679
Cost of sales (note 12) 3,390,311 2.279,910 9,341,990 7,885,207
1,434,692 1,785,905 4,524,457 5,273,472
Expenses
Sales and marketing 608,700 580,885 2,002,413 1,837,388
Research and development 282,728 273,075 938,893 619,611
Administration 512,899 457,126 1,433,088 1,402,724
Other operating expenses (note 14) 168,146 108,245 334,132 344,122
1,572,473 1,419,331 4,708,526 4,203,845
Operating income (loss) (137,781) 366,574 (184,069) 1,069,627
Other expenses (earnings) Foreign exchange loss (gain) (189,440) 54,622 (191,259) (228,619)
Interest income (62,275) (50,096) (180,596) (156,708)
(251,715) 4,526 (371,855) (385,327)
Income before income taxes 113,934 362,048 187,786 1,454,954
Income tax expense 20,928 - 30,246 2,300
Net income and comprehensive
income for the period $ 93,006 $ 362,048 $ 157,540 $ 1,452,654
Income per share (basic) $0.00 $0.02 $0.00 $0.07
Income per share (fully diluted) $0.00 $0.02 $0.00 $0.07
Weighted average number of
shares outstanding – basic (note
9(e)) 21,159,237 21,060,343 21,129,006 20,910,910
Weighted average number of
shares outstanding – fully
diluted (note 9(e)) 21,850,560 21,782,325 21,782,216 21,510,466
See accompanying notes to interim condensed consolidated financial statements

3
INTRINSYC TECHNOLOGIES CORPORATION Interim Condensed Consolidated Statements of Changes in Shareholders’ Equity
(Unaudited and Expressed in U.S. Dollars)
Share
Capital
Other
Capital
Reserves –
Share
Based
Payments Deficit
Translation
of
Operations
Reserve
Total
Shareholders’
Equity
Balance, January 1, 2017 $108,977,225 $ 10,050,147 ($106,964,873) $ 92,436 $ 12,154,935
Net income for the period - - 157,540 - 157,540
Issued upon exercise of stock
options 44,477 - - - 44,477
Reclassification upon exercise
of stock options 36,352 (36,352) - - -
Share-based compensation - 200,427 - - 200,427
Balance, September 30,
2017 $109,058,054 $ 10,214,222 ($106,807,333) $ 92,436 $ 12,557,379
Balance, January 1, 2016 $108,583,237 $ 10,106,356 ($108,627,655) $ 92,436 $ 10,154,374
Net income for the period - - 1,452,654 - 1,452,654
Issued upon exercise of stock
options 205,973 - - - 205,973
Reclassification upon exercise
of stock options 163,142 (163,142) - - -
Share-based compensation - 203,906 - - 203,906
Balance, September 30,
2016 $108,952,352 $ 10,147,120 ($107,175,001) $ 92,436 $ 12,016,907
See accompanying notes to interim condensed consolidated financial statements

4
INTRINSYC TECHNOLOGIES CORPORATION Interim Condensed Consolidated Statements of Cash Flows
(Unaudited and Expressed in U.S. Dollars)
For the
Three months
ended
September 30,
2017
Three months
ended
September 30,
2016
Nine months
ended
September 30,
2017
Nine months
ended
September 30,
2016
Cash provided by (used in):
Operating Activities Net income (loss) for the period $ 93,006 $ 362,048 $ 157,540 $ 1,452,654
Adjustments to reconcile net loss to net cash
flows: Depreciation of equipment (note 7) 25,467 24,144 72,485 65,694
Amortization of intangible assets (note 8) 19,884 24,532 61,220 74,522
Share-based compensation 122,795 59,569 200,427 203,906
Accrued interest on convertible loan (45,000) (45,000) (135,000) (135,000)
Unrealized foreign exchange (127,284) 22,774 (126,468) (125,315)
88,868 448,067 230,204 1,536,461
Working capital adjustments: Trade and other receivables (471,381) 219,892 (556,042) (278,601)
Inventory (645,240) 83,995 (1,105,725) (367,831)
Prepaid expenses (106,141) (49,189) (61,056) (60,090)
Trade and other payables 677,680 (311,737) 1,003,719 (496,665)
Deferred revenue 234,675 (7,818) 425,803 66,221
(310,407) (64,857) (293,301) (1,136,966)
Cash provided by (used in) operating activities (221,539) 383,210 (63,097) 399,495
Investing Activities Redemption (purchase) of short-term
investments (684,250) (817,477) (794,654) (1,826,483)
Interest received on convertible loan (note 5) 11,250 22,500 56,250 90,000
Purchase of equipment (note 7) (5,416) (2,089) (54,446) (241,872)
Purchase of intangible assets (note 8) (1,230) (15,000) (58,515) (72,665)
Cash used in investing activities (679,646) (812,066) (851,365) (2,051,020)
Financing Activities Issuance of common shares 15,643 14,496 44,477 205,973
Cash provided by financing activities 15,643 14,496 44,477 205,973
Increase (decrease) in cash and cash equivalents (885,542) (414,360) (869,985) (1,445,552)
Foreign exchange effect on cash and cash
equivalents 26,912 (3,358) 35,010 65,208
Cash and cash equivalents, beginning of the period 5,405,173 4,935,089 5,381,518 5,897,715
Cash and cash equivalents, end of the period $ 4,546,543 $ 4,517,371 $ 4,546,543 $ 4,517,371
Supplementary information
Interest received $ 32,047 $ 24,883 $ 98,963 $ 97,307
Income taxes paid $ 2,916 $ - $ 17,711 $ 2,300
See accompanying notes to interim condensed consolidated financial statements.

INTRINSYC TECHNOLOGIES CORPORATION Notes to Interim Condensed Consolidated Financial Statements
(Unaudited and Expressed in U.S. Dollars)
5
1. REPORTING ENTITY
Intrinsyc Technologies Corporation (formerly Intrinsyc Software International, Inc.) (“Intrinsyc” or the “Company”) is
a public company domiciled in Canada and incorporated on August 31, 1992 under the laws of Alberta and continued
under the Company Act (British Columbia) on July 19, 1995. Articles of Continuance were filed under the Canada
Business Corporations Act on May 1, 2003 to continue the Company federally and change the name of the Company
from Intrinsyc Software, Inc. to Intrinsyc Software International, Inc. Articles of Amendment were filed under the Canada
Business Corporations Act on June 17, 2014 to change the name of the Company to Intrinsyc Technologies Corporation.
The Company’s principal business office is Suite 300, 885 Dunsmuir Street, Vancouver, British Columbia, V6C 1N5 and
its registered office is Suite 2000, 1066 West Hastings Street, Vancouver, British Columbia, V6E 3X2.
The Company is an Internet of Things (“IoT”) product development company, offering hardware development kits,
computing modules, proprietary software products, and engineering design and development services. These solutions
are focused on the fast growing high-performance IoT product market; including; augmented and virtual reality, drones,
robotics, digital signage, automotive, IP cameras, medical systems, wearable technology, and many others. The Company
provides value by enabling device makers and technology suppliers to deliver compelling, next generation mobile and
embedded wireless devices with faster time to market, higher quality, and differentiating innovation.
The interim condensed consolidated financial statements of the Company, as at, and for the three and nine months ended
September 30, 2017 and September 30, 2016 comprise the Company and its subsidiaries (together referred to as the
“Company” and individually as “Company entities”).
2. BASIS OF PRESENTATION
Statement of Compliance
These interim condensed consolidated financial statements, which have been approved by the Board of Directors on
November 6, 2017, have been prepared in accordance with International Accounting Standard 34, Interim Financial
Reporting (“IAS 34”). These interim condensed consolidated financial statements have been prepared using the historical
cost basis and the same accounting policies as those disclosed in the Company’s annual financial statements as at and for
the year ended December 31, 2016. Accordingly, these interim condensed consolidated financial statements do not
include all disclosures required for annual financial statements and should be read in conjunction with the Company’s
annual financial statements as at and for the year ended December 31, 2016 (which were prepared in accordance with
International Financial Reporting Standards, or “IFRS”).
3. SIGNIFICANT ACCOUNTING POLICIES
New Standards and Interpretations Not Yet Adopted
Standards issued but not yet effective up to the date of issuance of the Company's interim condensed consolidated
financial statements are listed below. This listing is of standards and interpretations issued, which the Company
reasonably expects to be applicable at a future date. The Company is currently assessing the impact of the following
standards on the interim condensed consolidated financial statements and intends to adopt these standards when they
become effective.
IFRS 9 – Financial Instruments: Classification and Measurement
IFRS 9 - Financial Instruments replaces the current IAS 39 Financial Instruments Recognition and Measurement. The
standard introduces new requirements for classifying and measuring financial assets and liabilities. The Company will
start the application of IFRS 9 in the financial statements effective from January 1, 2018. The Company has evaluated
the impact on the financial statements of IFRS 9 and believes there will be no impact to the financial statements.

INTRINSYC TECHNOLOGIES CORPORATION Notes to Interim Condensed Consolidated Financial Statements
(Unaudited and Expressed in U.S. Dollars)
6
3. SIGNIFICANT ACCOUNTING POLICIES (continued)
IFRS 15 – Revenue from Contracts with Customers
IFRS 15 – Revenue from Contracts with Customers. The standard replaces all existing revenue requirements in IFRS
and applies to all revenue arising from contracts with customers. The standard outlines the principles an entity must
apply to measure and recognize revenue. The core principle is that an entity will recognize revenue at an amount that
reflects the consideration to which the entity expects to be entitled in exchange for transferring goods or services to a
customer.
The principles in IFRS 15 will be applied using a five-step model:
1) Identify the contract(s) with a customer;
2) Identify the performance obligations in the contract;
3) Determine the transaction price;
4) Allocate the transaction price to the performance obligations in the contract; and
5) Recognize revenue when (or as) the entity satisfies a performance obligation
The standard also specifies how to account for the incremental costs of obtaining a contract and the costs directly related
to fulfilling a contract. The Company will start the application of IFRS 15 in the financial statements effective from
January 1, 2018. The Company has begun the process of evaluating the impact on the financial statements of IFRS 15 but
is not yet possible to make a reliable estimate of its impact.
4. TRADE AND OTHER RECEIVABLES
September 30, 2017
December 31, 2016
Trade and other receivables $ 4,138,213 $ 3,589,523
Less: Allowance for doubtful accounts (95,616) (95,616)
Unbilled revenue 303,016 289,963
$ 4,345,613 $ 3,783,870
Included in trade and other receivables balance as at September 30, 2017 was an amount of $95,616 (December 31, 2016
- $95,616) payable by a customer that had not been fully insured with Export Development Canada (“EDC” – see Note
11) by the Company. Subsequent to September 30, 2017, the Company settled with this customer for $60,000 (less third
party collection fees). Payments are to be made in four (4) equal payments on October 10, 2017, October 24, 2017,
November 7, 2017 and November 22, 2017. The customer has made the first payment.
At September 30, 2017, unbilled revenue on open contracts accounted for using the percentage of completion method
amounted to $303,016 (December 31, 2015 - $289,963).
5. LOAN TO CUSTOMER
On October 1, 2014, the Company announced that it invested in Stream TV Networks, Inc. (“Stream TV”), a current
customer of Intrinsyc, an amount of $1,500,000 in the form of a subordinated, secured convertible promissory note
bearing interest at three percent (3%) per annum with a maturity date of December 31, 2015 (the “Note”). Interest is
payable on the earlier of (i) December 31, 2015 or (ii) when converted to Stream TV shares. Stream TV committed to
acquire a minimum of $3,000,000 in Intrinsyc products, services, and royalties over the next twelve months.
INTRINSYC TECHNOLOGIES CORPORATION Notes to Interim Condensed Consolidated Financial Statements
(Unaudited and Expressed in U.S. Dollars)
7
5. LOAN TO CUSTOMER (continued)
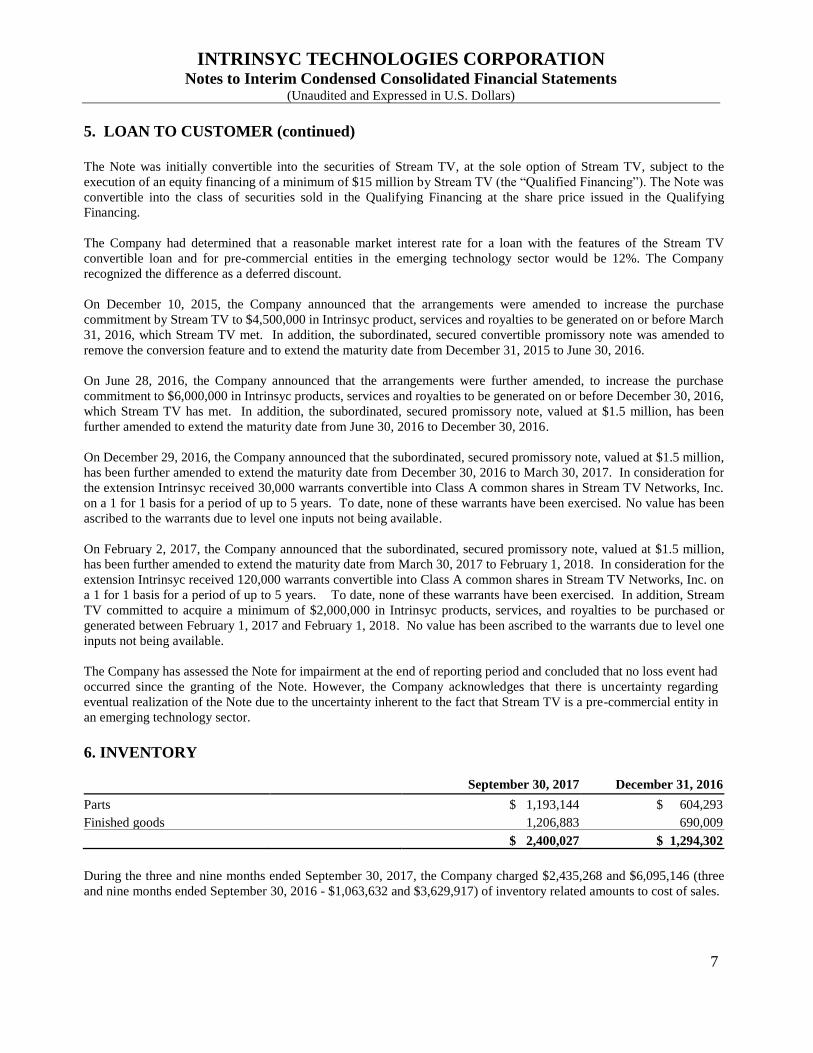
The Note was initially convertible into the securities of Stream TV, at the sole option of Stream TV, subject to the
execution of an equity financing of a minimum of $15 million by Stream TV (the “Qualified Financing”). The Note was
convertible into the class of securities sold in the Qualifying Financing at the share price issued in the Qualifying
Financing.
The Company had determined that a reasonable market interest rate for a loan with the features of the Stream TV
convertible loan and for pre-commercial entities in the emerging technology sector would be 12%. The Company
recognized the difference as a deferred discount.
On December 10, 2015, the Company announced that the arrangements were amended to increase the purchase
commitment by Stream TV to $4,500,000 in Intrinsyc product, services and royalties to be generated on or before March
31, 2016, which Stream TV met. In addition, the subordinated, secured convertible promissory note was amended to
remove the conversion feature and to extend the maturity date from December 31, 2015 to June 30, 2016.
On June 28, 2016, the Company announced that the arrangements were further amended, to increase the purchase
commitment to $6,000,000 in Intrinsyc products, services and royalties to be generated on or before December 30, 2016,
which Stream TV has met. In addition, the subordinated, secured promissory note, valued at $1.5 million, has been
further amended to extend the maturity date from June 30, 2016 to December 30, 2016.
On December 29, 2016, the Company announced that the subordinated, secured promissory note, valued at $1.5 million,
has been further amended to extend the maturity date from December 30, 2016 to March 30, 2017. In consideration for
the extension Intrinsyc received 30,000 warrants convertible into Class A common shares in Stream TV Networks, Inc.
on a 1 for 1 basis for a period of up to 5 years. To date, none of these warrants have been exercised. No value has been
ascribed to the warrants due to level one inputs not being available.
On February 2, 2017, the Company announced that the subordinated, secured promissory note, valued at $1.5 million,
has been further amended to extend the maturity date from March 30, 2017 to February 1, 2018. In consideration for the
extension Intrinsyc received 120,000 warrants convertible into Class A common shares in Stream TV Networks, Inc. on
a 1 for 1 basis for a period of up to 5 years. To date, none of these warrants have been exercised. In addition, Stream
TV committed to acquire a minimum of $2,000,000 in Intrinsyc products, services, and royalties to be purchased or
generated between February 1, 2017 and February 1, 2018. No value has been ascribed to the warrants due to level one
inputs not being available.
The Company has assessed the Note for impairment at the end of reporting period and concluded that no loss event had
occurred since the granting of the Note. However, the Company acknowledges that there is uncertainty regarding
eventual realization of the Note due to the uncertainty inherent to the fact that Stream TV is a pre-commercial entity in
an emerging technology sector.
6. INVENTORY
September 30, 2017
December 31, 2016
Parts $ 1,193,144 $ 604,293
Finished goods 1,206,883 690,009
$ 2,400,027 $ 1,294,302
During the three and nine months ended September 30, 2017, the Company charged $2,435,268 and $6,095,146 (three
and nine months ended September 30, 2016 - $1,063,632 and $3,629,917) of inventory related amounts to cost of sales.

INTRINSYC TECHNOLOGIES CORPORATION Notes to Interim Condensed Consolidated Financial Statements
(Unaudited and Expressed in U.S. Dollars)
8
7. EQUIPMENT
The following table presents details of movement in the carrying value of equipment by type:
Cost
Computers
and
Equipment
Furniture
and
Fixtures
Leasehold
Improvements
Total
Balance, January 1, 2016 $ 1,819,590 $ 836,859 $ 734,850 $ 3,391,299
Additions 45,822 50,343 176,332 272,497
Balance, December 31, 2016 $ 1,865,412 $ 887,202 $ 911,182 $ 3,663,796
Additions 34,920 19,526 - 54,446
Balance, September 30, 2017 $ 1,900,332 $ 906,728 $ 911,182 $ 3,718,242
Accumulated Depreciation
Computers
and
Equipment
Furniture
and
Fixtures
Leasehold
Improvements
Total
Balance, January 1, 2016 ($ 1,705,871) ($ 781,036) ($ 734,850) ($ 3,221,757)
Depreciation (44,229) (23,148) (23,162) (90,539)
Balance, December 31, 2016 ($ 1,750,100) ($ 804,184) ($ 758,012) ($ 3,312,296)
Depreciation (29,297) (23,495) (19,693) (72,485)
Balance, September 30, 2017 ($ 1,779,397) ($ 827,679) ($ 777,705) ($ 3,384,781)
Net Book Value
Computers
and
Equipment
Furniture
and
Fixtures
Leasehold
Improvements
Total
Balance, December 31, 2016 $ 115,312 $ 83,018 $ 153,170 $ 351,500
Balance, September 30, 2017 $ 120,935 $ 79,049 $ 133,477 $ 333,461
8. INTANGIBLE ASSETS
The following table presents details of movement in the carrying value of the intangible assets by type:
Cost
Acquired
Software
Technology
Computer
Software
Customer
Relationships
Patent
Portfolio
Trademark
and Brand
Total
Balance, January 1,
2016 $ 791,800 $ 1,191,731 $ 32,834 $ 36,324 $ 12,724 $ 2,065,413
Additions - 77,401 - - - 77,401
Balance, December 31,
2016 $ 791,800 $ 1,269,132 $ 32,834 $ 36,324 $ 12,724 $ 2,142,814
Additions - 58,515 - - - 58,515
Balance, September 30,
2017 $ 791,800 $ 1,327,647 $ 32,834 $ 36,324 $ 12,724 $ 2,201,329

INTRINSYC TECHNOLOGIES CORPORATION Notes to Interim Condensed Consolidated Financial Statements
(Unaudited and Expressed in U.S. Dollars)
9
8. INTANGIBLE ASSETS (continued)
Accumulated Amortization
Acquired
Software
Technology
Computer
Software
Customer
Relationships
Patent
Portfolio
Trademark
and Brand
Total
Balance, January 1,
2016 ($791,800) ($1,060,957) ($ 32,834) (($ 36,324) ($ 12,724) ($1,934,639)
Amortization - (96,324) - - - (96,324)
Balance, December 31,
2016 ($791,800) ($1,157,281) ($ 32,834) (($ 36,324) ($ 12,724) ($2,030,963)
Amortization - (61,220) - - - (61,220)
Balance, September 30,
2017 ($791,800) ($1,218,501) ($ 32,834) (($ 36,324) ($ 12,724) ($2,092,183)
Net Book Value
Acquired
Software
Technology
Computer
Software
Customer
Relationships
Patent
Portfolio
Trademark
and Brand
Total
Balance, December 31,
2016 $ - $ 111,851 $ - $ - $ - $ 111,851
Balance, September 30,
2017 $ - $ 109,146 $ - $ - $ - $ 109,146
9. SHARE CAPITAL
Authorized
Unlimited number of preference shares without par value; and
Unlimited number of common shares without par value.
Issued and outstanding
[a] Preference Shares
There are no preference shares outstanding as at September 30, 2017.
[b] Common Shares
Number of
common
shares
Amount
Outstanding, January 1, 2016 20,748,606 $108,583,237
Issued upon exercise of stock options 353,183 220,300
Reclassification upon exercise of stock options - 173,688
Outstanding, December 31, 2016 21,101,789 $108,977,225
Issued upon exercise of stock options 70,799 44,477
Reclassification upon exercise of stock options - 36,352
Outstanding, September 30, 2017 21,172,588 $109,058,054

INTRINSYC TECHNOLOGIES CORPORATION Notes to Interim Condensed Consolidated Financial Statements
(Unaudited and Expressed in U.S. Dollars)
10
9. SHARE CAPITAL (continued)
[c] Stock Options
The Company has a rolling incentive stock option plan. Under the terms of the Company’s stock option plan, the
Board of Directors may grant options to directors, officers, employees, consultants and service providers equal to the
lower of: (i) up to 10% of issued and outstanding common shares of the Company from time to time less one share;
and, (ii) 3,750,000 common shares. The plan provides for the granting of options at the closing price of the
Company’s stock on the day prior to the grant date. Options granted generally vest over three years with the first
one-third vesting at the first anniversary date of the grant and the balance vesting in equal amounts at the end of each
quarter thereafter. There are no cash settlement alternatives. The Company does not have a past practice of cash
settlement for these share options.
The Company determines the term of each option at the time it is granted, with options generally having a five-year
term. As of September 30, 2017, the Company was entitled to grant 2,117,257 incentive stock options under the plan
of which 1,335,809 have been granted.
A summary of the Company’s share option activity for the nine months ended September 30, 2017 is as follows:
Outstanding options
Number of
options
Weighted average exercise
price (in Canadian dollars)
Outstanding, January 1, 2016 1,901,141 $ 0.79
Options granted 124,500 1.23
Options exercised (353,183) 0.81
Options forfeited (604,069) 0.76
Options expired (4,774) 0.92
Outstanding, December 31, 2016 1,063,615 $ 0.84
Options granted 423,500 2.05
Options exercised (70,799) 0.87
Options forfeited (80,507) 1.43
Outstanding, September 30, 2017 1,335,809 $ 1.21
The following table summarizes the share options outstanding as at September 30, 2017:
Options outstanding Options exercisable
Range of
exercise price
(in Canadian dollars)
# of
common
shares
Weighted
average
remaining
contractual life
Weighted
average
exercise price
(in Canadian
dollars)
# of options
exercisable
Weighted average
exercise price
(in Canadian
dollars)
$ 0.52 - $ 0.76 167,892 0.98 $ 0.54 164,892 $ 0.53
$ 0.77 - $ 0.88 298,680 1.72 $ 0.80 291,763 $ 0.80
$ 0.89 - $ 0.91 386,757 2.67 $ 0.89 310,353 $ 0.89
$ 0.92 - $ 2.29 482,480 4.48 $ 1.96 61,558 $ 1.76
1,335,809 2.90 $ 1.21 828,566 $ 0.85
The weighted average fair value of stock options granted during the three and nine months ended September 30, 2017
was CDN $0.99 and CDN $1.22 per share (September 30, 2016 – CDN $0.86 and CDN $0.81 per share, respectively).
The total stock-based compensation calculated for three and nine months ended September 30, 2017 was $74,678
and $143,814 (three and nine months ended September 30, 2016 - $59,569 and $203,906 respectively).

INTRINSYC TECHNOLOGIES CORPORATION Notes to Interim Condensed Consolidated Financial Statements
(Unaudited and Expressed in U.S. Dollars)
11
9. SHARE CAPITAL (continued)
The fair value of each option granted was estimated on the date of grant using the Black-Scholes Option Pricing
Model with the following weighted average assumptions:
Three months
ended
September 30,
2017
Three months
ended
September 30,
2016
Nine months
ended
September 30,
2017
Nine months
ended
September 30,
2016
Expected life (in years) 4.2 4.2 3.9 4.2
Risk-free interest rate 1.60% 0.59% 1.03% 0.62%
Volatility 80.48% 92.18% 80.97% 96.46%
Dividend yield 0.00% 0.00% 0.00% 0.00%
The expected life of the share options is based on historical data and current expectations and is not necessarily
indicative of exercise patterns that may occur. The expected volatility reflects the assumption that the historical
volatility over a period similar to the life of the options is indicative of future trends, which may not necessarily be
the actual outcome either.
[d] Restricted Share Units (“RSUs”)
The Company adopted a restricted share unit plan (the “RSU Plan”) which was approved by its shareholders on May
16, 2017. The aggregate maximum number of shares available for issuance from treasury under the RSU Plan shall
not exceed 500,000 shares. The 500,000 RSUs are a separate pool from the Company’s incentive stock option plan.
The grant-date fair value of the restricted share units equals the fair market value of the corresponding shares at the
grant date and the Intrinsic Value valuation model is used. The fair value of these equity-settled awards is recognized
as compensation expense over the period that related services are rendered with a corresponding increase in equity.
The total amount expensed is recognized over the vesting period on a tranche basis, which is the period over which
all the specified vesting conditions should be satisfied.
During the three and nine months ended September 30, 2017, the Company granted 219,000 RSUs to certain
employees and directors under its RSU Plan. These RSUs vest over three years as to one third on each anniversary
of the grant date. Compensation for the three and nine months ended September 30, 2017 was $48,117 and $56,613
($nil for the three and nine months ended September 30, 2016).
A summary of the Company’s RSU activity for the nine months ended September 30, 2017 is as follows:
Number of
RSUs
Outstanding, December 31, 2016 -
RSUs granted 219,000
RSUs vested -
RSUs forfeited -
Outstanding, September 30, 2017 219,000
The weighted average fair value of RSUs granted during the three and nine months ended September 30, 2017 was
CDN $2.04 per share. There were no RSUs granted during the three and nine months ended September 30, 2016.
INTRINSYC TECHNOLOGIES CORPORATION Notes to Interim Condensed Consolidated Financial Statements
(Unaudited and Expressed in U.S. Dollars)
12
9. SHARE CAPITAL (continued)
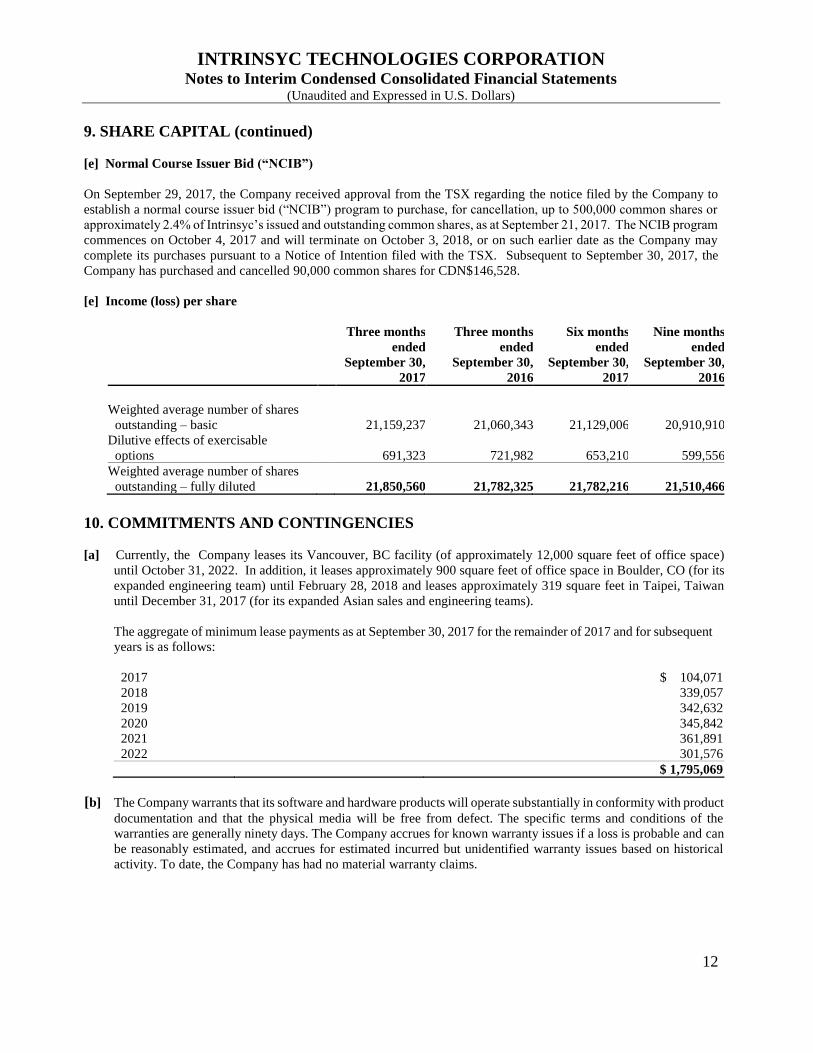
[e] Normal Course Issuer Bid (“NCIB”)
On September 29, 2017, the Company received approval from the TSX regarding the notice filed by the Company to
establish a normal course issuer bid (“NCIB”) program to purchase, for cancellation, up to 500,000 common shares or
approximately 2.4% of Intrinsyc’s issued and outstanding common shares, as at September 21, 2017. The NCIB program
commences on October 4, 2017 and will terminate on October 3, 2018, or on such earlier date as the Company may
complete its purchases pursuant to a Notice of Intention filed with the TSX. Subsequent to September 30, 2017, the
Company has purchased and cancelled 90,000 common shares for CDN$146,528.
[e] Income (loss) per share
Three months
ended
September 30,
2017
Three months
ended
September 30,
2016
Six months
ended
September 30,
2017
Nine months
ended
September 30,
2016
Weighted average number of shares
outstanding – basic
21,159,237 21,060,343 21,129,006 20,910,910
Dilutive effects of exercisable
options
691,323 721,982 653,210 599,556
Weighted average number of shares
outstanding – fully diluted
21,850,560 21,782,325 21,782,216 21,510,466
10. COMMITMENTS AND CONTINGENCIES
[a] Currently, the Company leases its Vancouver, BC facility (of approximately 12,000 square feet of office space)
until October 31, 2022. In addition, it leases approximately 900 square feet of office space in Boulder, CO (for its
expanded engineering team) until February 28, 2018 and leases approximately 319 square feet in Taipei, Taiwan
until December 31, 2017 (for its expanded Asian sales and engineering teams).
The aggregate of minimum lease payments as at September 30, 2017 for the remainder of 2017 and for subsequent
years is as follows:
2017 $ 104,071
2018 339,057
2019 342,632
2020 345,842
2021 361,891
2022 301,576
$ 1,795,069
[b] The Company warrants that its software and hardware products will operate substantially in conformity with product
documentation and that the physical media will be free from defect. The specific terms and conditions of the
warranties are generally ninety days. The Company accrues for known warranty issues if a loss is probable and can
be reasonably estimated, and accrues for estimated incurred but unidentified warranty issues based on historical
activity. To date, the Company has had no material warranty claims.

INTRINSYC TECHNOLOGIES CORPORATION Notes to Interim Condensed Consolidated Financial Statements
(Unaudited and Expressed in U.S. Dollars)
13
10. COMMITMENTS AND CONTINGENCIES (continued)
[c] The Company may be subject to a variety of claims and suits that arise from time to time in the ordinary course of
business. Although management currently believes that resolving claims against the Company, individually or in
aggregate, will not have a material adverse impact on the Company’s financial position, results of operations, or
cash flows, these matters are subject to inherent uncertainties and management’s view of these matters may change
in the future. To date, there are no claims or suits outstanding.
11. EXPORT DEVELOPMENT CANADA
On July 31, 2009, the Company entered into an agreement with EDC whereby EDC agreed to provide 90% insurance
coverage for the Company’s invoiced sales for a premium of between CDN $0.76 to CDN $1.41 per CDN $100 of
monthly invoiced sales (certain customers are excluded from this coverage). The initial policy period was from July 1,
2009 to June 30, 2010 with an automatic yearly renewal unless the policy is terminated by the Company (the policy has
been renewed until June 30, 2018). The maximum liability coverage at any one time is CDN $185,000 for domestic sales
and CDN $7,000,000 for sales outside of Canada. As of September 30, 2017, 79% of trade receivables were covered by
EDC insurance (December 31, 2016 – 68%)
During the three and nine months ended September 30, 2017, the Company recorded total premiums of $36,114 (CDN
$43,285) and $108,980 (CDN $142,617) in sales and marketing as compared to total premiums of $26,041 (CDN
$33,974) and $51,221 (CDN $64,979) for the three and nine months ended September 30, 2016.
12. SEGMENTED INFORMATION
Operating segments
The Company currently has the following two operating segments:
• Embedded Computing Hardware segment includes the sales of the Company’s proprietary computer modules and
development kits. The Company offers original equipment manufacturers (“OEMs”) off-the-shelf and customized
embedded computing modules.
• Services and Software segment includes turnkey product design and development services, as well as other
engineering services and device software, including royalties. As well, it includes revenue generated from
software products including: J-Integra® Enterprise Interoperability Software (“EIS”), and RapidRIL Telephony
Software, including maintenance and support agreements for these products. These products and services are
sold to OEMs, original device manufacturers (“ODMs”), technology providers, and other companies.
Corporate includes all operating expenses of the Company.
Information regarding the operations of each operating segment is included below. Performance is based on revenue
less cost of sales. A breakdown of revenues and cost of sales for each operating segment for the three and nine months
ended September 30, 2017 and September 30, 2016 is as follows:

INTRINSYC TECHNOLOGIES CORPORATION Notes to Interim Condensed Consolidated Financial Statements
(Unaudited and Expressed in U.S. Dollars)
14
12. SEGMENTED INFORMATION (continued)
Three months ended
September 30, 2017
Embedded
Computing
Hardware
Services and
Software
Corporate Total
Revenue $ 2,983,668 $ 1,841,335 $ - $ 4,825,003
Cost of sales 2,398,784 991,527 - 3,390,311
584,884 849,808 - 1,434,692
Operating expenses - - 1,572,473 1,572,473
Operating income (loss) $ 584,884 $ 849,808 ($1,572,473) ($ 137,781)
Three months ended
September 30, 2016
Embedded
Computing
Hardware
Services and
Software
Corporate Total
Revenue $ 1,462,719 $ 2,603,096 $ - $ 4,065,815
Cost of sales 1,104,250 1,175,660 - 2,279,910
358,469 1,427,436 - 1,785,905
Operating expenses - - 1,419,331 1,419,331
Operating profit (loss) $ 358,469 $ 1,427,436 ($1,419,331) $ 366,574
Nine months ended
September 30, 2017
Embedded
Computing
Hardware
Services and
Software
Corporate Total
Revenue $ 7,881,269 $ 5,985,178 $ - $ 13,866,447
Cost of sales 6,158,347 3,183,643 - 9,341,990
1,722,922 2,801,535 - 4,524,457
Operating expenses - - 4,708,526 4,708,526
Operating profit (loss) $ 1,722,922 $ 2,801,535 ($4,708,526) ($ 184,069)
Nine months ended
September 30, 2016
Embedded
Computing
Hardware
Services and
Software
Corporate Total
Revenue $ 4,943,140 $ 8,215,539 $ - $ 13,158,679
Cost of sales 3,818,986 4,066,221 - 7,885,207
1,124,154 4,149,318 - 5,273,472
Operating expenses - - 4,203,845 4,203,845
Operating profit (loss) $ 1,124,154 $ 4,149,318 ($4,203,845) $ 1,069,627

INTRINSYC TECHNOLOGIES CORPORATION Notes to Interim Condensed Consolidated Financial Statements
(Unaudited and Expressed in U.S. Dollars)
15
12. SEGMENTED INFORMATION (continued)
Geographic information
The Company’s equipment is located as follows:
September 30,
2017
December 31,
2016
Canada $ 325,757 $ 341,560
United States 7,704 9,940
Total $ 333,461 $ 351,500
The Company earned revenues attributed to the following countries based on the location of the customer:
Three months
ended
September 30,
2017
Three months
ended
September 30,
2016
Nine months
ended
September 30,
2017
Nine months
ended
September 30,
2016
United States $ 2,757,559 $ 3,023,932 $ 9,111,700 $ 9,978,557
Asia Pacific 1,487,494 419,261 2,936,475 1,224,209
Europe 448,254 344,297 1,422,011 1,374,077
Canada 129,960 278,325 388,868 581,159
Other 1,736 - 7,393 677
$ 4,825,003 $ 4,065,815 $ 13,866,447 $ 13,158,679
Significant customers
In each respective period, revenues from customers which amounted to 10% of more of the Company’s revenues
accounted for the following percentage of the Company’s total revenues and accounts receivable, as indicated below:
Three months
ended
September 30,
2017
Nine months
ended
September
30, 2017
% of
Trades
Receivable at
September 30,
2017
Three months
ended
September 30,
2016
Nine months
ended
September 30,
2016
% of
Trades
Receivable at
September 30,
2016
Customer 1 18% 19% 11% 6% 10% -%
Customer 2 12% 13% 20% <1% 2% <1%
Customer 3 1% 4% 16% 20% 24% 32%
The above customers for the prior periods are referenced due to their being greater than the Company’s ten percent of
total revenue threshold in the respective prior periods. Receivables owing from Customers 1 and 2 are fully insured by
EDC insurance in the event of payment default while receivables owing from Customer 3 is only partially covered by
EDC insurance.

INTRINSYC TECHNOLOGIES CORPORATION Notes to Interim Condensed Consolidated Financial Statements
(Unaudited and Expressed in U.S. Dollars)
16
13. EXPENSES BY NATURE
Total salaries and wages as well as other personnel related expenses included in Cost of Sales and Expenses for the three
and nine months ended September 30, 2017 were $1,969,876 and $6,112,994 compared $2,052,711 and $5,831,616
during the three and nine months ended June 30, 2017.
14. OTHER OPERATING EXPENSES
Other operating expenses consist of the following:
Three months
ended
September 30,
2017
Three months
ended
September 30,
2016
Nine months
ended
September 30,
2017
Nine months
ended
September 30,
2016
Depreciation of equipment (note 7) $ 25,467 $ 24,144 $ 72,485 $ 65,694
Amortization of intangible assets (note 8) 19,884 24,532 61,220 74,522
Share-based compensation (note 9(c) and
(d))
122,795 59,569 200,427 203,906
$ 168,146 $ 108,245 $ 334,132 $ 344,122
15. CAPITAL DISCLOSURES
The Company’s objectives for managing capital are:
• To safeguard the Company’s ability to continue as a going concern, so that it can provide adequate returns for
shareholders and benefits for other stakeholders.
• To maintain a capital base so as to maintain investor, creditor, customer and market confidence.
The Company considers the items included in the interim condensed consolidated statements of changes in shareholders’
equity as capital. The Company manages the capital structure and makes adjustments to it (by either issuing new shares
or buying back shares) in the light of changes in economic conditions and the risk characteristics of the underlying assets.
16. FINANCIAL INSTRUMENTS
[a] Financial assets and liabilities
The Company has classified cash and cash equivalents as held-for-trading financial assets, measured at fair value
with short-term investments being classified as available for sale financial assets. Trade and other receivables as
well as the customer loan are classified as loans and receivables, measured at amortized cost. Trade and other
payables are classified as other liabilities, measured at amortized cost.
The carrying values and fair values of financial assets (liabilities) as at September 30, 2017 and December 31, 2016
are summarized as follows:

INTRINSYC TECHNOLOGIES CORPORATION Notes to Interim Condensed Consolidated Financial Statements
(Unaudited and Expressed in U.S. Dollars)
17
16. FINANCIAL INSTRUMENTS (continued)
September 30, 2017 December 31, 2016
Carrying
Value
Fair
Value
Carrying
Value Fair Value
Held-for-Trading $ 4,546,543 $ 4,546,543 $ 5,381,518 $ 5,381,518
Available for Sale $ 3,132,350 $ 3,132,350 $ 2,169,402 $ 2,169,402
Loans and Receivables $ 6,081,863 $ 6,081,863 $ 5,441,370 $ 5,441,370
Other Liabilities ($3,254,934) ($3,254,934) ($2,168,678) ($2,168,678)
[b] Fair Value Disclosure
At September 30, 2017, the Company’s financial instruments which are measured at fair value on a recurring basis
were its cash and cash equivalents and short term investments. As of September 30, 2017, Available for Sale
financial assets totalling $3,132,350 were classified Level 2 (December 31, 2016 - $2,169,402).
[c] Risk Management
Disclosures relating to exposure to risks, in particular credit risk, liquidity risk, foreign currency risk, and interest
rate risk are provided below.
[i] Credit Risk
Credit risk is the risk of an unexpected loss if a customer or counterparty to a financial instrument fails to meet
its contractual obligations. The Company's financial instruments that are exposed to concentrations of credit
risk are primarily cash and cash equivalents, short-term investments, trade and other receivables and customer
loan. The Company limits its exposure to credit risk with respect to cash and cash equivalents by investing
available cash, from time to time, in short-term deposits with Canadian financial institutions and commercial
paper with a rating not less than R1. With respect to trade and other receivables, the Company engages EDC to
perform ongoing credit evaluations of Intrinsyc’s customers’ financial condition and requires letters of credit
or other guarantees whenever deemed necessary.
Trade and other receivables were aged as follows as at September 30, 2017 and December 31, 2016:
September 30,
2017
December 31,
2016
Current $ 2,894,122 $ 2,950,373
31-60 days
Over 60 days
327,332
1,124,159
302,486
531,011
$ 4,345,613 $ 3,783,870
[ii] Liquidity Risk
Liquidity risk is the risk that the Company will not be able to meet its financial obligations as they fall due. The
Company's approach to managing liquidity risk is to ensure, as far as possible, that it will always have sufficient
liquidity to meet liabilities when due. The contractual maturity of the majority of accounts payable is within
one month.

INTRINSYC TECHNOLOGIES CORPORATION Notes to Interim Condensed Consolidated Financial Statements
(Unaudited and Expressed in U.S. Dollars)
18
16. FINANCIAL INSTRUMENTS (continued)
Trade and other payables were aged as follows as at September 30, 2017 and December 31, 2016:
September 30,
2017
December 31,
2016
Current $ 2,023,964 $ 1,585,838
31-60 days
Over 60 days
617,053
613,917
580,364
2,476
$ 3,254,934 $ 2,168,678
[iii] Foreign Currency Risk
Although substantially all of the Company’s revenues are received in U.S. dollars, the Company incurs
operating costs primarily attributable to its services business and has outstanding trade and other payables
denominated in Canadian dollars and other foreign currencies. Fluctuations in the exchange rates between
these currencies could have a material effect on the business, financial condition and results of operations. The
Company maintains certain assets, inclusive of a portion of its treasury investments, in Canadian dollars which
are translated to its U.S. dollar functional currency resulting in an unrealized foreign exchange gain or loss.
With all other variables remaining constant, assuming a 10% weakening of the Canadian dollar versus the U.S.
dollar would have had the following impact on net loss as follows in the table below. An assumed 10%
strengthening of the Canadian dollar versus the U.S. dollar would have had an equal but opposite effect on the
amounts shown below:
A 10% change in the New Taiwanese dollar to U.S. dollar exchange rate would have an approximate $13,000
impact on net income for three and nine months ended September 30, 2017 (three and nine months ended
September 30, 2016– $5,000).
[iv] Interest Rate Risk
The Company's exposure to interest rate fluctuations is primarily interest earned on its cash and cash equivalents
as well as its short-term investments. During the three months ended September 30, 2017, the Company earned
$62,275 of interest income on its cash and cash equivalents as well as its short-term investments and customer
loan. An increase or decrease of 100 basis points in the average interest rate earned during the period would have
adjusted net earnings by approximately $77,000. This analysis assumes that all other variables, in particular
foreign currency rates, remain constant.
Source of net earnings/loss
variability from changes in
foreign exchange rates
Three Months
ended
September 30,
2017
Three Months
ended
September 30,
2016
Nine Months
ended
Nine Months
ended
September 30,
2017 September 30,
2016 Statement of Financial Position
exposure ($284,683) ($ 193,905) ($284,683) ($193,905)
Net Cost of Sales/Operating Expenses
(net exposure) 158,279 164,334 492,489 515,835
Net exposure ($ 126,403) ($ 29,571) $ 207,806 $ 321,930
INTRINSYC TECHNOLOGIES CORPORATION Notes to Interim Condensed Consolidated Financial Statements
(Unaudited and Expressed in U.S. Dollars)
19
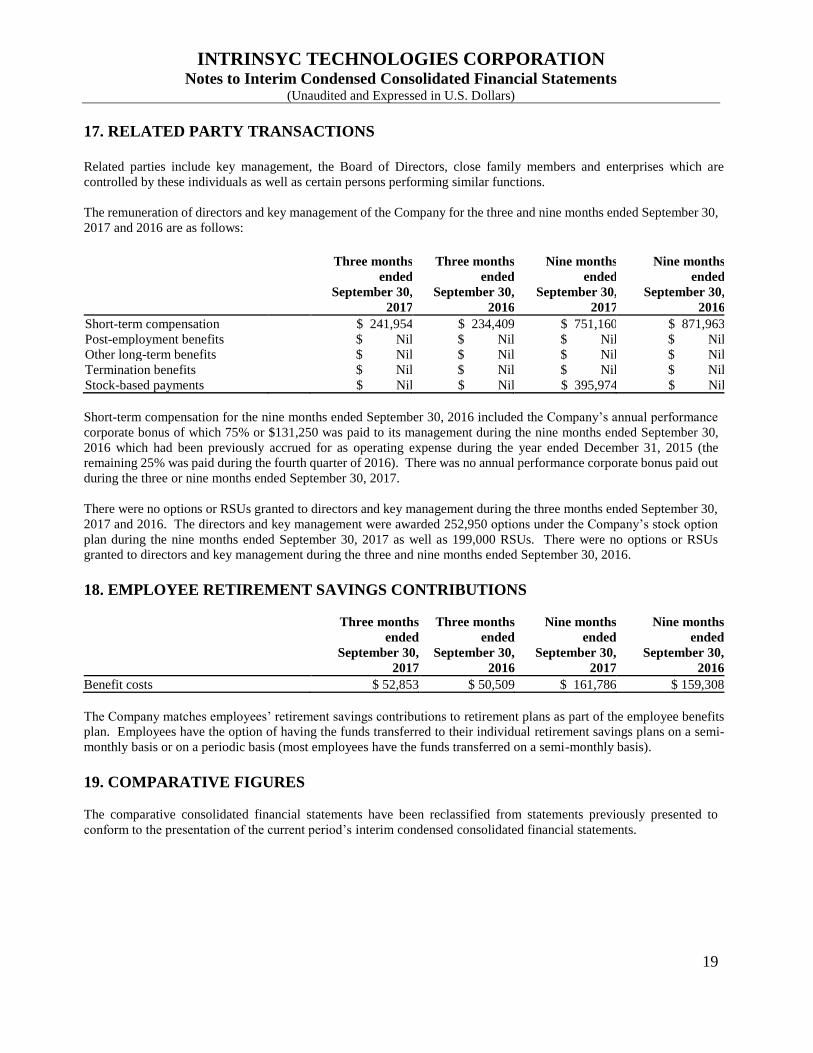
17. RELATED PARTY TRANSACTIONS
Related parties include key management, the Board of Directors, close family members and enterprises which are
controlled by these individuals as well as certain persons performing similar functions.
The remuneration of directors and key management of the Company for the three and nine months ended September 30,
2017 and 2016 are as follows:
Three months
ended
September 30,
2017
Three months
ended
September 30,
2016
Nine months
ended
September 30,
2017
Nine months
ended
September 30,
2016
Short-term compensation $ 241,954 $ 234,409 $ 751,160 $ 871,963
Post-employment benefits $ Nil $ Nil $ Nil $ Nil
Other long-term benefits $ Nil $ Nil $ Nil $ Nil
Termination benefits $ Nil $ Nil $ Nil $ Nil
Stock-based payments $ Nil $ Nil $ 395,974 $ Nil
Short-term compensation for the nine months ended September 30, 2016 included the Company’s annual performance
corporate bonus of which 75% or $131,250 was paid to its management during the nine months ended September 30,
2016 which had been previously accrued for as operating expense during the year ended December 31, 2015 (the
remaining 25% was paid during the fourth quarter of 2016). There was no annual performance corporate bonus paid out
during the three or nine months ended September 30, 2017.
There were no options or RSUs granted to directors and key management during the three months ended September 30,
2017 and 2016. The directors and key management were awarded 252,950 options under the Company’s stock option
plan during the nine months ended September 30, 2017 as well as 199,000 RSUs. There were no options or RSUs
granted to directors and key management during the three and nine months ended September 30, 2016.
18. EMPLOYEE RETIREMENT SAVINGS CONTRIBUTIONS
Three months
ended
September 30,
2017
Three months
ended
September 30,
2016
Nine months
ended
September 30,
2017
Nine months
ended
September 30,
2016
Benefit costs $ 52,853 $ 50,509 $ 161,786 $ 159,308
The Company matches employees’ retirement savings contributions to retirement plans as part of the employee benefits
plan. Employees have the option of having the funds transferred to their individual retirement savings plans on a semi-
monthly basis or on a periodic basis (most employees have the funds transferred on a semi-monthly basis).
19. COMPARATIVE FIGURES
The comparative consolidated financial statements have been reclassified from statements previously presented to
conform to the presentation of the current period’s interim condensed consolidated financial statements.

20
INTRINSYC TECHNOLOGIES CORPORATION
Management’s Discussion and Analysis of
Financial Condition and Results of Operations
For the Three and Nine Months ended September 30, 2017
MANAGEMENT’S DISCUSSION AND ANALYSIS
This Management’s Discussion and Analysis has been prepared by management as of November 8, 2017 and should
be read in conjunction with the audited consolidated financial statements of Intrinsyc Technologies Corporation (the
“Company” or “Intrinsyc”) and related notes thereto for the year ended December 31, 2016 (prepared in accordance
with International Financial Reporting Standards or “IFRS”). All amounts are presented in United States (U.S.) dollars
unless otherwise noted. Additional information about the Company, including the Company’s Annual Information
Form (“AIF”) is available on SEDAR at www.sedar.com.
DISCLAIMER FOR FORWARD-LOOKING STATEMENTS
The following Management’s Discussion and Analysis contains statements which, to the extent that they are not
recitations of historical fact, may constitute forward-looking information under applicable Canadian securities
legislation. Such forward-looking statements or information includes financial and other projections as well as
statements regarding the Company's future plans, objectives, performance, revenues, growth, profits, operating
expenses or the Company’s underlying assumptions. The words “may”, “would”, “could”, “will”, “likely”, “expect”,
“anticipate”, “intend”, “plan”, “forecast”, “project”, “estimate” and “believe” or other similar words and phrases may
identify forward-looking statements or information. Persons reading this Management’s Discussion and Analysis are
cautioned that such statements or information are only predictions, and that the Company's actual future results or
performance may be materially different. Factors that could cause actual events or results to differ materially from
those suggested by these forward-looking statements include, but are not limited to: the need to develop, integrate and
deploy software solutions to meet its customers’ requirements; the possibility of development or deployment difficulties
or delays; the dependence on its customers’ satisfaction; the timing of entering into significant contracts; its customers’
continued commitment to the deployment of the Company’s solutions; the risks involved in developing integrated
software solutions and integrating them with third-party products and services; reliance on products manufactured by
other companies for resale or distribution and reliance on third-party suppliers; the performance of the global economy
and growth in software industry sales; market acceptance of the Company’s products and services; customer and
industry analyst perception of the Company and its technology vision and future prospects; the success of certain
business combinations engaged in by the Company or by its competitors; possible disruptive effects of organizational
or personnel changes; technological change; new products and standards; risks related to acquisitions and international
expansion; reliance on large customers; concentration of sales; international operations and sales; management of
growth and expansion; dependence upon key personnel and hiring; reliance on a limited number of suppliers; risks
related to the Company’s competition; the Company’s not adequately protecting its intellectual property; risks related
to product defects and product liability; currency exchange rate risk; and including, but not limited to, other factors
described in the Company’s reports filed on SEDAR, including its financial statements and management’s discussion
and analysis for the year ended December 31, 2016, and those referred to under the heading “Risk Factors”. In drawing
a conclusion or making a forecast or projection set out in the forward-looking information, the Company takes into
account the following material factors and assumptions in addition to the above factors: the Company’s ability to
execute on its business plan; the acceptance of the Company’s products and services by its customers; the timing of
execution of outstanding or potential customer contracts by the Company; the sales opportunities available to the
Company; the Company's subjective assessment of the likelihood of success of a sales lead or opportunity; the
Company's historic ability to generate sales leads or opportunities; and that sales will be completed at or above the
Company's estimated margins. This list is not exhaustive of the factors that may affect the Company’s forward-looking
information. These and other factors should be considered carefully and readers should not place undue reliance on
such forward-looking information. All forward-looking statements made in this Management’s Discussion and
Analysis are qualified by this cautionary statement and there can be no assurance that actual results or developments
anticipated by the Company will be realized. The Company disclaims any intention or obligation to update or revise
forward-looking information, whether as a result of new information, future events or otherwise, except as required by
law.

21
OVERVIEW
The Company was incorporated under the laws of Alberta on August 31, 1992 under the name I.T.C.
Microcomponents Inc. and continued under the laws of British Columbia on July 19, 1995. The Company changed
its name to Intrinsyc Software, Inc. on June 16, 1997. Articles of Continuance were filed under the Canada Business
Corporations Act on May 1, 2003 to continue the Company federally and change the name of the Company from
Intrinsyc Software, Inc. to Intrinsyc Software International, Inc. On June 17, 2014, the Company changed its name to
Intrinsyc Technologies Corporation. The Company’s principal business office is Suite 300, 885 Dunsmuir Street,
Vancouver, British Columbia, V6C 1N5 and its registered office is Suite 2000, 1066 West Hastings Street, Vancouver,
British Columbia, V6E 3X2. The Company is listed on the Toronto Stock Exchange (“TSX”) under the trading symbol
ITC.
The Company is a product developer and provides software, engineering services, and integrated solutions that enable
next-generation embedded and wireless products. Solutions span the development life cycle from concept to
production and help device makers and technology suppliers create compelling differentiated products with faster
time-to-market.
CORPORATE SUMMARY
The Company provides solutions for the development and production of embedded and Internet of Things (“IoT”)
devices. The Company’s embedded computing products include: embedded development kits, vertical market
reference designs and development platforms, mobile application development platforms, and production-ready
embedded computers.
These products, combined with Intrinsyc’s engineering services, help device makers and silicon vendors deliver
embedded and IoT products with faster time-to-market, as well as improved innovation and quality. Additionally, the
Company has legacy proprietary software that provides a bridge between Java and COM based computing platforms
under the brand, J-Integra®.
The Company is focused on expanding its client base with new design wins for embedded computing products and
accelerating time to market for client’s products. Achievement of these objectives will provide a path to long-term
scalable revenue. With this objective in mind the Company transitioned from primarily providing non-recurring
engineering services to focus on the sales of embedded computing products, and complementary comprehensive
product design and development services. As a result of this transition, the Company changed revenue segmentation
and reporting from Embedded Solutions, General Engineering Services and Other Software Solutions to Embedded
Computing Hardware and Services and Software. While Services and Software will provide a higher margin
percentage, Embedded Computing is expected to be the engine for scalable revenue growth.
The Company’s business segments are described below.
Embedded Computing Hardware
The Embedded Computing Hardware segment includes the sales of the Company’s proprietary computer modules,
development kits, and related hardware technology.
• Production-ready embedded computing products include the Open-Q™ line of system on modules (“SOM”) and
single board computers (“SBC”); including the Open-Q™ 800, Open-Q™ 805, Open-Q™ 810, Open-Q™ 410,
Open-Q™ 820, Open-Q™ 835, Open-Q™ 626 and Open-Q™ 2100 System on Modules (“SOM”), and the Open-
Q™ 600 SBC. The Company sells these solutions as production-ready computing products and also makes
custom variants of these products that are tailored specifically to client requirements.
• Embedded development kits include the DragonBoard™ 800, Open-Q™ 805 Development Kit, DragonBoard
810™, Open-Q™ 820 Development Kit, Open-Q™ 2100, Open-Q™ 626 and Open-Q 600 SBC.
22
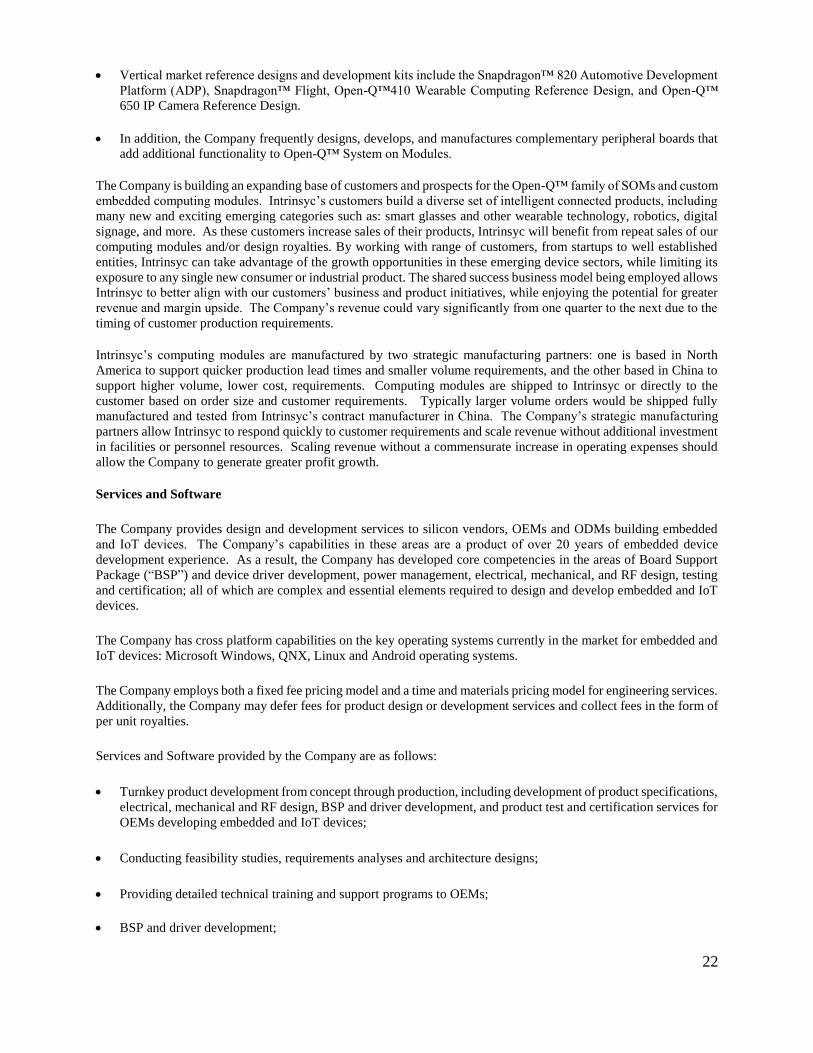
• Vertical market reference designs and development kits include the Snapdragon™ 820 Automotive Development
Platform (ADP), Snapdragon™ Flight, Open-Q™410 Wearable Computing Reference Design, and Open-Q™
650 IP Camera Reference Design.
• In addition, the Company frequently designs, develops, and manufactures complementary peripheral boards that
add additional functionality to Open-Q™ System on Modules.
The Company is building an expanding base of customers and prospects for the Open-Q™ family of SOMs and custom
embedded computing modules. Intrinsyc’s customers build a diverse set of intelligent connected products, including
many new and exciting emerging categories such as: smart glasses and other wearable technology, robotics, digital
signage, and more. As these customers increase sales of their products, Intrinsyc will benefit from repeat sales of our
computing modules and/or design royalties. By working with range of customers, from startups to well established
entities, Intrinsyc can take advantage of the growth opportunities in these emerging device sectors, while limiting its
exposure to any single new consumer or industrial product. The shared success business model being employed allows
Intrinsyc to better align with our customers’ business and product initiatives, while enjoying the potential for greater
revenue and margin upside. The Company’s revenue could vary significantly from one quarter to the next due to the
timing of customer production requirements.
Intrinsyc’s computing modules are manufactured by two strategic manufacturing partners: one is based in North
America to support quicker production lead times and smaller volume requirements, and the other based in China to
support higher volume, lower cost, requirements. Computing modules are shipped to Intrinsyc or directly to the
customer based on order size and customer requirements. Typically larger volume orders would be shipped fully
manufactured and tested from Intrinsyc’s contract manufacturer in China. The Company’s strategic manufacturing
partners allow Intrinsyc to respond quickly to customer requirements and scale revenue without additional investment
in facilities or personnel resources. Scaling revenue without a commensurate increase in operating expenses should
allow the Company to generate greater profit growth.
Services and Software
The Company provides design and development services to silicon vendors, OEMs and ODMs building embedded
and IoT devices. The Company’s capabilities in these areas are a product of over 20 years of embedded device
development experience. As a result, the Company has developed core competencies in the areas of Board Support
Package (“BSP”) and device driver development, power management, electrical, mechanical, and RF design, testing
and certification; all of which are complex and essential elements required to design and develop embedded and IoT
devices.
The Company has cross platform capabilities on the key operating systems currently in the market for embedded and
IoT devices: Microsoft Windows, QNX, Linux and Android operating systems.
The Company employs both a fixed fee pricing model and a time and materials pricing model for engineering services.
Additionally, the Company may defer fees for product design or development services and collect fees in the form of
per unit royalties.
Services and Software provided by the Company are as follows:
• Turnkey product development from concept through production, including development of product specifications,
electrical, mechanical and RF design, BSP and driver development, and product test and certification services for
OEMs developing embedded and IoT devices;
• Conducting feasibility studies, requirements analyses and architecture designs;
• Providing detailed technical training and support programs to OEMs;
• BSP and driver development;

23
• Electrical, Mechanical and RF Design;
• FPGA Design and Development;
• Camera Driver Development and Tuning;
• Power management services for OEMs designing small form factor products which are needed to improve battery
life while simultaneously increasing applications and features that drive growth in power utilization;
• Embedded and IoT application development;
• RapidRIL™ Telephony Software and wireless integration services;
• J-Integra, a scalable, high-performance middleware solution for connecting Java directly to .NET, COM, and
Exchange objects.
SIGNIFICANT EVENTS FOR THIRD QUARTER OF 2017
Financial Events
• Revenue increased by 6% from the three months ended June 30, 2017 and by 19% from the three months ended
September 30, 2016. The increase over the comparable periods was due to increased revenues attributable to the
Company’s Embedded Computing Hardware offset by a decrease in its Services and Software businesses.
• Expenses (excluding other operating expenses)1 decreased by 4% from the three months ended June 30, 2017 due
to decreased product development costs, tradeshow expenses and travel. Expenses increased by 7% from the three
months ended September 30, 2106 due to increased headcount, sales and marketing expenses as well as product
development expenses.
• Net income for the three months ended September 30, 2017 was $93,006 compared to net loss of $22,432 for the
three months ended June 30, 2017 and net income of $362,048 during the three months ended September 30,
2016.
• Cash used in operations was $221,539 during the three months ended September 30, 2017 compared to cash
provided by operations of $3,780 for the three months ended June 30, 2017 and cash provided by operations of
$383,210 for the three months ended September 30, 2016.
• Received approval from the TSX regarding the notice filed by the Company to establish a normal course issuer
bid (“NCIB”) program to purchase, for cancellation, up to 500,000 common shares or approximately 2.4% of
Intrinsyc’s issued and outstanding common shares, as at September 21, 2017. The NCIB program commenced
on October 4, 2017 and will terminate on October 3, 2018, or on such earlier date as the Company may complete
its purchases pursuant to a Notice of Intention filed with the TSX. To date, the Company has purchased and
cancelled 90,000 common shares for CDN$146,528.
Business Highlights
• Received an order, from an existing client, that is valued at $916,000. The non-cancellable order incorporates
memory purchased by the client under a previous order valued at $100,000, resulting in a net value of $816,000.
1 Expenses (excluding other operating expenses) is a non-IFRS measure that does not have a standard meaning and may not be comparable to a
similar measure disclosed by other issuers (it includes Sales and marketing, Research and development, and Administration expenses). This
measure does not have a comparable IFRS measure and is used by the Company to manage and evaluate its cash operating expenses.
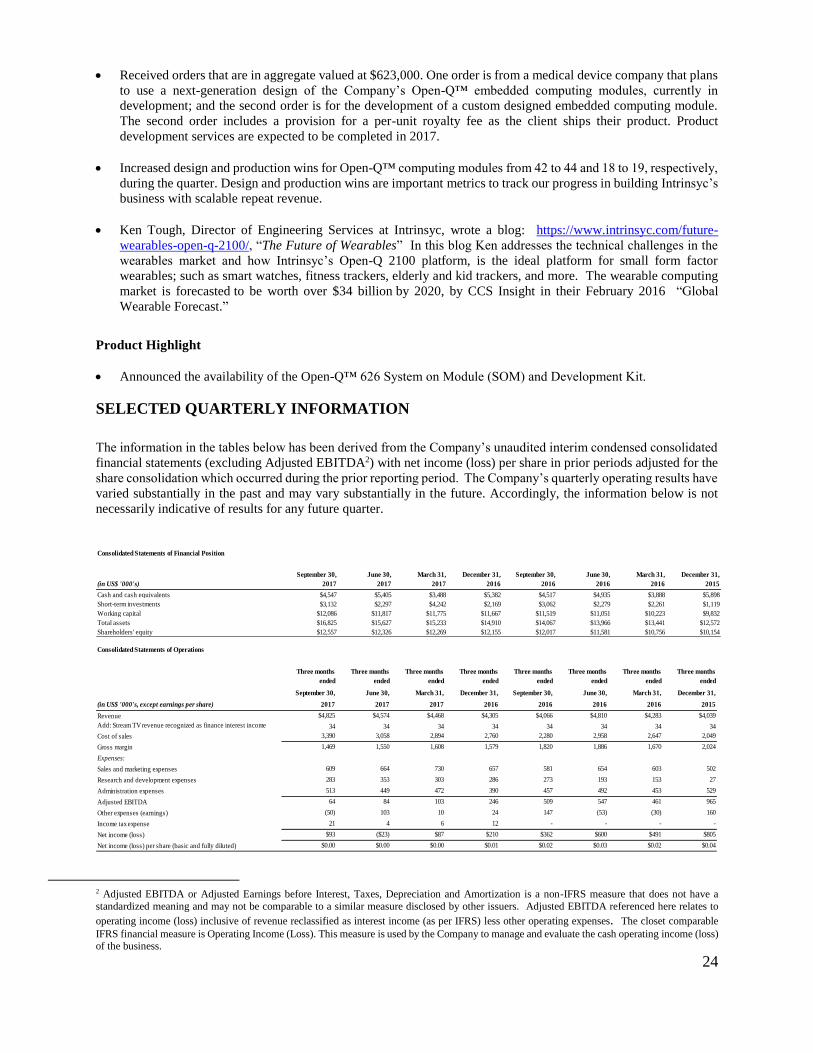
24
• Received orders that are in aggregate valued at $623,000. One order is from a medical device company that plans
to use a next-generation design of the Company’s Open-Q™ embedded computing modules, currently in
development; and the second order is for the development of a custom designed embedded computing module.
The second order includes a provision for a per-unit royalty fee as the client ships their product. Product
development services are expected to be completed in 2017.
• Increased design and production wins for Open-Q™ computing modules from 42 to 44 and 18 to 19, respectively,
during the quarter. Design and production wins are important metrics to track our progress in building Intrinsyc’s
business with scalable repeat revenue.
• Ken Tough, Director of Engineering Services at Intrinsyc, wrote a blog: https://www.intrinsyc.com/future-
wearables-open-q-2100/, “The Future of Wearables” In this blog Ken addresses the technical challenges in the
wearables market and how Intrinsyc’s Open-Q 2100 platform, is the ideal platform for small form factor
wearables; such as smart watches, fitness trackers, elderly and kid trackers, and more. The wearable computing
market is forecasted to be worth over $34 billion by 2020, by CCS Insight in their February 2016 “Global
Wearable Forecast.”
Product Highlight
• Announced the availability of the Open-Q™ 626 System on Module (SOM) and Development Kit.
SELECTED QUARTERLY INFORMATION
The information in the tables below has been derived from the Company’s unaudited interim condensed consolidated
financial statements (excluding Adjusted EBITDA2) with net income (loss) per share in prior periods adjusted for the
share consolidation which occurred during the prior reporting period. The Company’s quarterly operating results have
varied substantially in the past and may vary substantially in the future. Accordingly, the information below is not
necessarily indicative of results for any future quarter.
2 Adjusted EBITDA or Adjusted Earnings before Interest, Taxes, Depreciation and Amortization is a non-IFRS measure that does not have a
standardized meaning and may not be comparable to a similar measure disclosed by other issuers. Adjusted EBITDA referenced here relates to
operating income (loss) inclusive of revenue reclassified as interest income (as per IFRS) less other operating expenses. The closet comparable
IFRS financial measure is Operating Income (Loss). This measure is used by the Company to manage and evaluate the cash operating income (loss) of the business.
Consolidated Statements of Financial Position
September 30, June 30, March 31, December 31, September 30, June 30, March 31, December 31,
(in US$ '000's) 2017 2017 2017 2016 2016 2016 2016 2015
Cash and cash equivalents $4,547 $5,405 $3,488 $5,382 $4,517 $4,935 $3,888 $5,898
Short-term investments $3,132 $2,297 $4,242 $2,169 $3,062 $2,279 $2,261 $1,119
Working capital $12,086 $11,817 $11,775 $11,667 $11,519 $11,051 $10,223 $9,832
Total assets $16,825 $15,627 $15,233 $14,910 $14,067 $13,966 $13,441 $12,572
Shareholders' equity $12,557 $12,326 $12,269 $12,155 $12,017 $11,581 $10,756 $10,154
Consolidated Statements of Operations
Three months
ended
Three months
ended
Three months
ended
Three months
ended
Three months
ended
Three months
ended
Three months
ended
Three months
ended
September 30, June 30, March 31, December 31, September 30, June 30, March 31, December 31,
(in US$ '000's, except earnings per share) 2017 2017 2017 2016 2016 2016 2016 2015
Revenue $4,825 $4,574 $4,468 $4,305 $4,066 $4,810 $4,283 $4,039
Add: Stream TV revenue recognized as finance interest income 34 34 34 34 34 34 34 34
Cost of sales 3,390 3,058 2,894 2,760 2,280 2,958 2,647 2,049
Gross margin 1,469 1,550 1,608 1,579 1,820 1,886 1,670 2,024
Expenses:
Sales and marketing expenses 609 664 730 657 581 654 603 502
Research and development expenses 283 353 303 286 273 193 153 27
Administration expenses 513 449 472 390 457 492 453 529
Adjusted EBITDA 64 84 103 246 509 547 461 965
Other expenses (earnings) (50) 103 10 24 147 (53) (30) 160
Income tax expense 21 4 6 12 - - - -
Net income (loss) $93 ($23) $87 $210 $362 $600 $491 $805
Net income (loss) per share (basic and fully diluted) $0.00 $0.00 $0.00 $0.01 $0.02 $0.03 $0.02 $0.04

25
FINANCIAL RESULTS FOR THE THREE MONTHS ENDED SEPTEMBER 30, 2017
The following analysis of the results of operations for the three months ended September 30, 2017 includes
comparisons to the three months ended June 30, 2017 and September 30, 2016.
Revenue
The Company currently has the following two operating segments:
• Embedded Computing Hardware segment includes the sales of the Company’s proprietary computer modules and
development kits. The Company offers OEMs off-the-shelf and customized embedded computing modules.
• Services and Software segment includes turnkey product design and development services, as well as other
engineering services and device software, including royalties. As well, it includes revenue generated from
software products including: J-Integra® Enterprise Interoperability Software (“EIS”), and RapidRIL Telephony
Software, including maintenance and support agreements for these products. These products and services are
sold to OEMs, original device manufacturers (“ODMs”), technology providers, and other companies.
Revenue by Source
Three months
ended
September 30,
2017 %
Three months
ended
June 30,
2017 %
Three months
ended
September 30,
2016 %
Services and Software $ 1,841,335 38% $ 2,004,101 44% $ 2,603,096 59%
Embedded Computing
Hardware 2,983,668 62% 2,569,841 56% 1,462,719 41%
Total revenue $ 4,825,003 100% $ 4,573,942 100% $ 4,065,815 100%
Revenue increased by 6% from the three months ended June 30, 2017 and by 19% from the three months ended
September 30, 2016. The increase over the comparable periods was due to increased revenues attributable to the
Company’s Embedded Computing Hardware offset by a decrease in its Services and Software businesses.
Services and Software revenue was approximately $1.8 million during the three months ended September 30, 2017 as
compared to approximately $2.0 million for the three months ended June 30, 2017and approximately $2.6 million for
the three months ended September 30, 2016. The decrease over the comparable periods was due to decreased service
revenue related to the development of customer products based on the Company’s Embedded Computing products.
Total revenues attributable to the Company’s Embedded Computing Hardware increased by 16% during the three
months ended September 30, 2017 compared to the three months ended June 30, 2017 and by 104% compared to the
three months ended September 30, 2016. This increase was due to increased sales of Development Kits, and Open-
Q™ SOMs.
To date, the Company has had a significant portion of its revenue derived from its largest customers. In each respective
period, revenues from customers which amounted to 10% or more of the Company’s revenues accounted for the
following percentages of the Company’s total revenues:
Three months ended
September 30,
2017
Three months ended
June 30,
2017
Three months ended
September 30,
2016
Revenue $1,427,891 $1,901,091 $796,040
Percentage of total revenue 30% 42% 20%
There were two (2) customers that accounted for 30% of the total revenue for the three months ended September 30,
2017 as compared two (2) customers that accounted for 42% of the total revenues for the three months ended June 30,
2017 and one (1) customer that accounted 20% of the total revenues for the three months ended September 30, 2016.

26
The Company earned revenues attributed to the following geographical regions based on the location of the customer:
Three months ended
September 30,
2017 %
Three months ended
June 30,
2017 %
Three months ended
September 30,
2016 %
United States $ 2,757,559 57% $ 3,245,954 71% $ 3,023,932 75%
Asia Pacific 1,487,494 31% 834,650 18% 419,261 10%
Europe 448,254 9% 421,635 9% 344,297 8%
Canada 129,960 3% 66,046 1% 278,325 7%
Other 1,736 <1% 5,657 <1% - -%
$ 4,825,003 100% $ 4,573,942 100% $ 4,065,815 100%
The Company continues to generate the majority of its revenue from the United States market but there has been an
increase in revenues from the Asia Pacific region.
Gross Margin3
Gross margins vary by revenue segment, with aggregate gross margin being typically in the range of 35% to 55% for
Services and Software segment and 15% to 25% for Embedded Computing segment. As a result, the overall gross
margin is a blend of the margins attributable to each respective business segment.
The Company’s cost of sales includes Canadian and New Taiwan Dollar denominated costs which are translated into
the Company’s U.S. functional currency. Gross margin for the three months ended September 30, 2017 was 30%,
which was lower than the 33% gross margin and 43% gross margin for the three months ended June 30, 2017 and
September 30, 2016, respectively. Decrease in gross margin over the comparable periods was due to the change in
revenue mix, which saw a significant increase in revenues from the Company’s Embedded Computing Hardware
business which has a much lower gross margin and decrease in engineering services gross margin as well as a
strengthening of the Canadian Dollar.
Expenses
Three months ended
September 30,
2017
Three months ended
June 30,
2017
Three months ended
September 30,
2016
Sales and marketing $ 608,700 $ 663,610 $ 580,885
Research and development 282,728 353,297 273,075
Administration 512,899 448,618 457,126
Other operating expenses 168,146 101,457 108,245
Total expenses $ 1,572,473 $ 1,566,982 $ 1,419,331
As a percentage of total revenue 33% 34% 35%
3 Gross Margin is a non-IFRS measure that does not have a standard meaning and may not be comparable to a similar measure disclosed by other
issuers. Gross Margin referenced here relates to revenues less cost of sales. This measure does not have a comparable IFRS measure and is used by the Company to manage and evaluate the operating performance of the Company.
Three months ended
September 30,
2017 %
Three months ended
June 30,
2017 %
Three months ended
September 30,
2016 %
Revenues $ 4,825,003 100% $ 4,573,942 100% $ 4,065,815 100%
Cost of sales 3,390,311 70% 3,057,899 67% 2,279,910 57%
Gross margin $ 1,434,692 30% $ 1,573,722 33% $ 1,785,905 43%

27
Expenses during the three months ended September 30, 2017 were slightly higher than the three months ended June
30, 2017. An increase in stock based compensation as well as an accrual of a bonus expense was offset by decreased
product development costs, tradeshow expenses and travel.
Expenses during the three months ended September 30, 2017 were higher than the three months ended September 30,
2016 due to increased headcount, sales and marketing expenses as well as product development expenses and stock
based compensation.
Sales and Marketing
Three months ended
September 30,
2017
Three months ended
June 30,
2017
Three months ended
September 30,
2016
Sales and marketing $608,700 $663,610 $ 580,885
As a percentage of total revenue 13% 15% 14%
The Company had a total of eleven (11) employees and contractors in Sales and Marketing as at September 30, 2017
which decreased from twelve (12) as at September 30, 2016. Sales and marketing expense consists primarily of
salaries and related personnel costs, sales commissions, consulting fees, trade show expenses, marketing collateral,
advertising costs and facilities.
The decrease in expenses over the previous three months ended June 30, 2017 was due to lower trade show expenses
and commissions as well as lower personnel costs. The increase in sales and marketing expense over the previous
three months ended September 30, 2016 was due to an increase in commissions and advertising costs.
Research and Development
Three months ended
September 30,
2017
Three months ended
June 30,
2017
Three months ended
September 30,
2016
Research and development $282,728 $353,297 $273,075
As a percentage of total revenue 6% 8% 6%
Research and development expenses relate primarily to salaries and related benefit costs but exclude research and
development activities which may be performed under customer specific engagements included in the Company’s
cost of sales. The decrease in research and development costs during the three months ended September 30, 2017 over
the three months ended June 30, 2017 was attributable largely to a decrease in employee related costs for Company’s
proprietary product development activities. Research and development costs for the three months ended September
30, 2017 were slight higher than the three months ended September 30, 2016 due to employee related costs.
Administration
Three months ended
September 30,
2017
Three months ended
June 30,
2017
Three months ended
September 30,
2016
Administration $512,899 $448,618 $457,126
As a percentage of total revenue 11% 10% 11%
Administration expenses include executive and administrative staff, facilities, public company costs, insurance,
corporate variable compensation accruals, accounting, legal and strategic consulting fees as well as various general
administrative costs.
The increase over that three months ended June 30, 2017 was primarily due to the accrual of a performance bonus
while there was the reversal of a previously accrued performance bonus in the three months ended June 30, 2017. The
increase over the three months ended September 30, 2016 was due to primarily to an increase in employee related
costs.

28
Other Operating Expenses
Three months ended
September 30,
2017
Three months ended
June 30,
2017
Three months ended
September 30,
2016
Depreciation of equipment $ 25,467 $ 24,803 $ 24,144
Amortization of intangible assets 19,884 21,930 24,532
Share-based compensation 122,795 54,724 59,569
Total other operating expenses $ 168,146 $ 101,457 $ 108,245
Adjusted EBITDA
Adjusted EBITDA was $64,115 for the three months ended September 30, 2017 compared to $84,268 for the three
months ended June 30, 2017 and $508,569 for the three months ended September 30, 2016.
Three months ended
September 30,
2017
Three months ended
June 30,
2017
Three months ended
September 30,
2016
Operating income (loss) ($137,781) ($50,939) $366,574
Add: revenue recognized as interest
income as per IFRS 33,750 33,750 33,750
Add back: Other operating expenses 168,146 101,457 108,245
Adjusted EBITDA $ 64,115 $ 84,268 $508,569
Other Expenses (Earnings)
Three months ended
September 30,
2017
Three months ended
June 30,
2017
Three months ended
September 30,
2016
Foreign exchange loss (gain) ($ 189,440) $ 27,803 $ 54,622
Interest income (62,275) (59,944) (50,096)
Total other expenses (income) ($ 251,715) ($ 32,141) $ 4,526
Other income for the three months ended September 30, 2017 were attributable to a foreign exchange gain of $189,440
and interest income of $62,275. Other income for the three months ended June 30, 2017 were attributable to a foreign
exchange loss of $27,803 offset by interest income of $59,944. Other expenses for the three months ended September
30, 2016 were attributable to a foreign exchange loss of $54,622 offset by interest income of $50,096. The Company
maintains certain assets, inclusive of a portion of its treasury investments, in Canadian dollars which are translated
into its U.S. dollar functional currency which accounted for the majority of the foreign exchange gain reported above
due to the strengthening of the Canadian dollar as at September 30, 2017 over the prior periods.
Net Income (Loss)
Three months ended
September 30,
2017
Three months ended
June 30,
2017
Three months ended
September 30,
2016
Operating income (loss) ($ 137,781) ($ 50,939) $ 366,574
Total other expenses (earnings) (251,715) (32,141) 4,526
Income tax expense 20,928 3,634 -
Net income (loss) $ 93,006 ($ 22,432) $ 362,048
Earnings (loss) per share (basic and
fully diluted) $0.00 $0.00 $0.02

29
Net income for the three months ended September 30, 2017 was $93,006 or $0.00 loss per share compared to net loss
for the three months ended June 30, 2017 of $22,432 or $0.00 loss per share and to net income of $362,048 or $0.02
earnings per share for the three months ended September 30, 2016.
FINANCIAL RESULTS FOR THE NINE MONTHS ENDED SEPTEMBER 30, 2017
The following analysis of the results of operations for the nine months ended September 30, 2017 includes
comparisons to the nine-month period ended September 30, 2016.
Revenue
Revenue by Source
Nine months ended
September 30,
2017 %
Nine months ended
September 30,
2016 % Change
Services and Software $ 5,985,178 43% $ 8,215,539 62% (27%)
Embedded Computing Hardware 7,881,269 57% 4,943,140 38% 59%
Total revenue $13,866,447 100% $13,158,679 100% 5%
The increase in revenue is attributable to increased revenues attributable to the Company’s Embedded Computing
offset by a decrease Services and Software businesses.
In each respective period, revenues from customers which amounted to 10% or more of the Company’s revenues
accounted for the following percentages of the Company’s total revenues:
Nine months ended
September 30,
2017
Nine months ended
September 30,
2016 Change
Revenue $4,460,074 $4,378,048 2%
Percentage of total revenue 32% 34%
During the nine months ended September 30, 2017, two (2) customers accounted for 32% of the total revenue while
two (2) customers accounted for 34% of the total revenue for the nine months ended September 30, 2016.
The Company earned revenues attributed to the following geographical regions based on the location of the customer:
Nine months ended
September 30,
2017 %
Nine months ended
September 30,
2016 % Change
United States $ 9,111,700 66% $ 9,978,557 77% (9%)
Asia Pacific 2,936,475 21% 1,224,209 10% 140%
Europe 1,422,011 10% 1,374,077 9% 3%
Canada 388,868 3% 581,159 4% (33%)
Other 7,393 <1% 677 <1% 992%
Total revenue $ 13,866,447 100% $ 13,158,679 100% 5%
The Company continues to generate the majority of its revenue from the United States market but there has been an
increase in revenues from the Asia Pacific region.
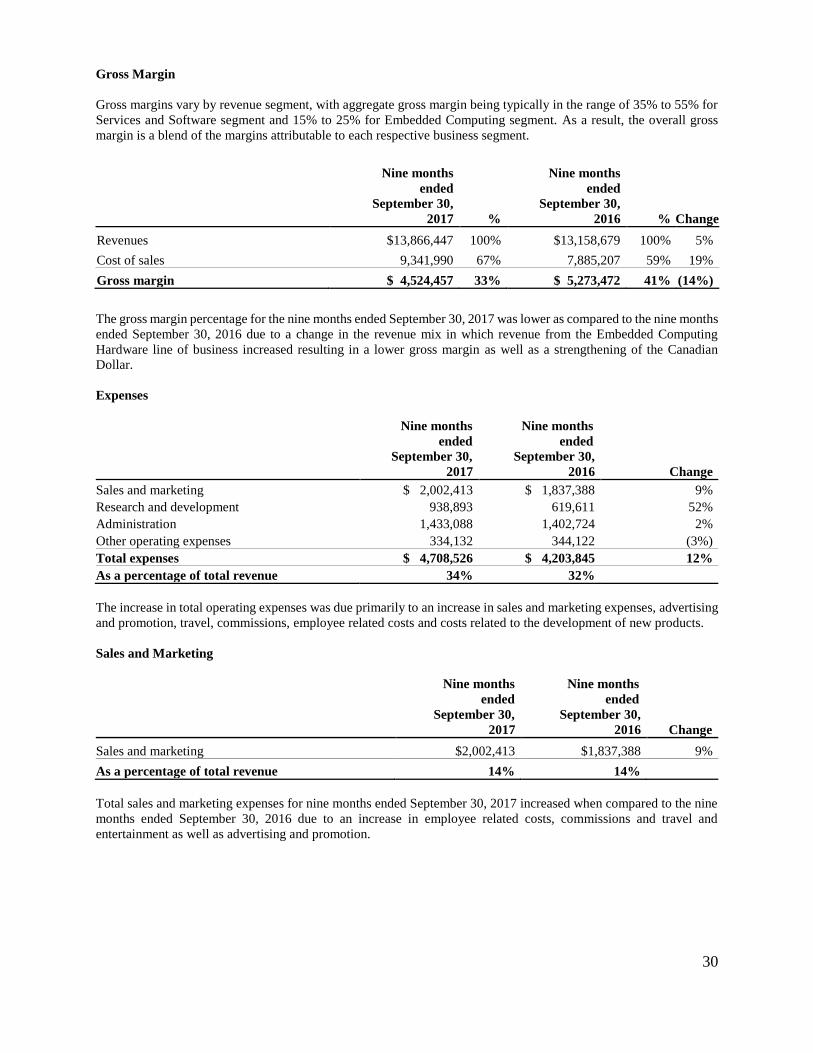
30
Gross Margin
Gross margins vary by revenue segment, with aggregate gross margin being typically in the range of 35% to 55% for
Services and Software segment and 15% to 25% for Embedded Computing segment. As a result, the overall gross
margin is a blend of the margins attributable to each respective business segment.
The gross margin percentage for the nine months ended September 30, 2017 was lower as compared to the nine months
ended September 30, 2016 due to a change in the revenue mix in which revenue from the Embedded Computing
Hardware line of business increased resulting in a lower gross margin as well as a strengthening of the Canadian
Dollar.
Expenses
Nine months
ended
September 30,
2017
Nine months
ended
September 30,
2016 Change
Sales and marketing $ 2,002,413 $ 1,837,388 9%
Research and development 938,893 619,611 52%
Administration 1,433,088 1,402,724 2%
Other operating expenses 334,132 344,122 (3%)
Total expenses $ 4,708,526 $ 4,203,845 12%
As a percentage of total revenue 34% 32%
The increase in total operating expenses was due primarily to an increase in sales and marketing expenses, advertising
and promotion, travel, commissions, employee related costs and costs related to the development of new products.
Sales and Marketing
Nine months
ended
September 30,
2017
Nine months
ended
September 30,
2016 Change
Sales and marketing $2,002,413 $1,837,388 9%
As a percentage of total revenue 14% 14%
Total sales and marketing expenses for nine months ended September 30, 2017 increased when compared to the nine
months ended September 30, 2016 due to an increase in employee related costs, commissions and travel and
entertainment as well as advertising and promotion.
Nine months
ended
September 30,
2017 %
Nine months
ended
September 30,
2016 % Change
Revenues $13,866,447 100% $13,158,679 100% 5%
Cost of sales 9,341,990 67% 7,885,207 59% 19%
Gross margin $ 4,524,457 33% $ 5,273,472 41% (14%)

31
Research and Development
Nine months
ended
September 30,
2017
Nine months
ended
September 30,
2016 Change
Research and development $938,893 $619,611 52%
As a percentage of total revenue 7% 5%
Research and development costs for the nine months ended September 30, 2017 increased over the nine months ended
September 30, 2016 due to higher employee related costs as a result of the increased investment in the development
of new products.
Administration
Nine months
ended
September 30,
2017
Nine months
ended
September 30,
2016 Change
Administration $1,433,088 $1,402,724 2%
As a percentage of total revenue 10% 10%
Administration costs for the nine months ended September 30, 2017 increased over the nine months ended September
30, 2016 due to increased employee related costs.
Other Operating Expenses
Nine months
ended
September 30,
2017
Nine months
ended
September 30,
2016 Change
Depreciation of equipment $ 72,485 $ 65,694 10%
Amortization of intangible assets 61,220 74,522 (18%)
Share-based compensation 200,427 203,906 (2%)
Total other operating expenses $ 334,132 $ 344,122 (3%)
Adjusted EBITDA
Adjusted EBITDA was $251,313 for the nine months ended September 30, 2017 compared to $1,514,999 for the nine
months ended September 30, 2016.
Nine months
ended
September 30,
2017
Nine months
ended
September 30,
2016
Operating income (loss) ($ 184,069) $ 1,069,627
Add: revenue recognized as interest
income as per IFRS 101,250 101,250
Add back: Other operating expenses 334,132 344,122
Adjusted EBITDA $ 251,313 $ 1,514,999

32
Other Expenses (Earnings)
Nine months
ended
September 30,
2017
Nine months
ended
September 30,
2016
Foreign exchange loss (gain) ($ 191,259) ($ 228,619)
Interest income (180,596) (156,708)
Total other expenses (earnings) ($ 371,855) ($ 385,327)
Net other earnings for the nine months ended September 30, 2017 was attributable to a foreign exchange gain of
$191,259 and interest income of $180,596. Net other incomes the nine months ended September 30, 2016 was
attributable to a foreign exchange gain of $228,619 and interest income of $156,708.
Net Income
Nine months
ended
September 30,
2017
Nine months
ended
September 30,
2016
Operating income (loss) ($ 184,069) $ 1,069,627
Total other expenses (earnings) (371,855) (385,327)
Income tax expense 30,246 2,300
Net income $ 157,540 $ 1,452,654
Earnings per share (basic and fully diluted) $0.00 $0.07
Net income for the nine months ended September 30, 2017 was $157,540 or $0.00 loss per share compared to net
income for the nine months ended September 30, 2016 which was $1,452,654 or $0.07 earnings per share.
LIQUIDITY AND CAPITAL RESOURCES
The Company’s near-term cash requirements relate primarily to operations, working capital and general corporate
purposes. Based on the current business plan, the Company believes cash and cash equivalents, along with its short-
term investments will be sufficient to fund the Company’s operating requirements for the next twelve months. The
Company updates its forecasts on a regular basis and will consider additional financing sources as appropriate.
As at September 30, 2017, the Company had cash and cash equivalents totalling approximately $4.6 million and short-
term investments totalling approximately $3.1 million with working capital4 of approximately $12.1 million, as
compared to cash and cash equivalents of approximately $5.4 million and short-term investments totalling
approximately $2.2 million with working capital of approximately $11.7 million as at December 31, 2016.
4 Working Capital is a non-IFRS measure that does not have a standardized meaning and may not be comparable to a similar measure disclosed by
other issuers. This measure does not have a comparable IFRS measure. Working capital as referenced herein is defined as current assets less
current liabilities. The Company believes that the inclusion of this non-IFRS financial measure provides investors with an alternative presentation useful to investors' understanding of the Company’s core operating results and trends.

33
Three Months ended September 30, 2017
Cash provided by (used in):
Three months ended
September 30,
2017
Three months ended
June 30,
2017
Three months ended
September 30,
2016
Operating activities ($ 221,539) $ 3,780 $ 383,210
Investing activities (679,646) 1,890,662 (812,066)
Financing activities 15,643 24,278 14,496
Foreign exchange effect on cash and
cash equivalents 26,912 (1,217) (3,358)
Increase (decrease) in cash and cash
equivalents ($ 858,630) $ 1,917,503 ($ 417,718)
Cash provided by (used in) operating activities for comparable periods was attributable the Company’s financial
performance.
During the three months ended September 30, 2017 cash used in investing activities was related to the purchase of
short term investments as well as the purchase of equipment and intangible assets offset by interest received on the
Stream TV loan. During the three months ended June 30, 2017 cash provided by investing activities was related to
the redemption of short term investments and interest received on the Stream TV loan offset by the purchase of
equipment and intangible assets. Cash used in investing activities during the three months ended September 30, 2016
was related to the purchase of short term investments and by the purchase of equipment and intangible assets. offset
by interest received on the Stream TV loan.
Cash provided by financing activities in all periods consisted of the exercise of employee stock options.
Nine Months ended September 30, 2017
Cash provided by (used in):
Nine months
ended
September 30,
2017
Nine months
ended
September 30,
2016
Operating activities ($ 63,097) $ 399,495
Investing activities (851,365) (2,051,020)
Financing activities 44,477 205,973
Foreign exchange effect on cash and cash
equivalents 35,010 65,208
Increase (decrease) in cash and cash
equivalents ($ 834,975) ($ 1,380,344)
Cash provided by (used in) operating activities for comparable periods was attributable the Company’s financial
performance.
Cash used in investing activities during the nine months ended September 30, 2017 was related to the purchase of
short term investments as well as the purchase of equipment and intangible assets offset by interest received on the
Stream TV convertible loan offset. Cash used in investing activities during the nine months ended September 30,
2016 was related to the purchase of short term investments and by the purchase of equipment and intangible assets.
offset by interest received on the Stream TV convertible loan.
During the nine months ended September 30, 2017 and September 30, 2016, cash provided by financing activities
consisted of the exercise of employee stock options.

34
STAFFING LEVELS
The following table summarizes the Company’s headcount, consisting of employees and contractors, by functional
group:
As at September 30,
2017
As at June 30,
2017
As at September 30,
2016
Service engineers 41 43 54
Sales and marketing 11 12 12
Research and development 11 13 8
Administration 12 9 9
Total 75 77 83
Effort spent to develop new proprietary products was classified as research and development.
COMMITMENTS
The aggregate of minimum lease payments as at September 30, 2017 for subsequent years is as follows:
2017 $ 104,071
2018 339,057
2019 342,632
2020 345,842
2021 361,891
2022 301,576
$ 1,795,069
Currently, the Company leases its Vancouver, BC facility (of approximately 12,000 square feet of office space) until
October 31, 2022. In addition, it leases approximately 900 square feet of office space in Boulder, CO (for its expanded
engineering team) until February 28, 2018 and leases approximately 319 square feet in Taipei, Taiwan until December
31, 2017 (for its expanded Asian sales and engineering teams).
ACCOUNTS RECEIVABLE INSURANCE
On July 31, 2009, the Company entered into an agreement with Export Development Canada (“EDC”) whereby EDC
agreed to provide 90% insurance coverage for the Company’s invoiced sales for a premium of between CDN $0.76 to
CDN $1.41 per CDN $100 of monthly invoiced sales (certain customers are excluded from this coverage). The initial
policy period was from July 1, 2009 to June 30, 2010 with an automatic yearly renewal unless the policy is terminated
by the Company (the policy has been renewed until June 30, 2018). The maximum liability coverage at any one time
is CDN $185,000 for domestic sales and CDN $7,000,000 for sales outside of Canada. As of September 30, 2017, 79%
of trade receivables were covered by EDC insurance (December 31, 2016 – 68%)
During the three and nine months ended September 30, 2017, the Company recorded total premiums of $36,114 (CDN
$43,285) and $108,980 (CDN $142,617) in sales and marketing as compared to total premiums of $26,041 (CDN
$33,974) and $51,221 (CDN $64,979) for the three and nine months ended September 30, 2016.
INTANGIBLE ASSETS IMPAIRMENT
None.
OFF-BALANCE SHEET ARRANGEMENTS
None.

35
TRANSACTIONS WITH RELATED PARTIES
Related parties include key management, the Board of Directors, close family members and enterprises which are
controlled by these individuals as well as certain persons performing similar functions.
The remuneration of directors and key management of the Company for the three and nine months ended September
30, 2017 and 2016 are as follows:
Three months
ended
September 30,
2017
Three months
ended
September 30,
2016
Nine months
ended
September 30,
2017
Nine months
ended
September 30,
2016
Short-term compensation $ 241,954 $ 234,409 $ 751,160 $ 871,963
Post-employment benefits $ Nil $ Nil $ Nil $ Nil
Other long-term benefits $ Nil $ Nil $ Nil $ Nil
Termination benefits $ Nil $ Nil $ Nil $ Nil
Stock-based payments $ Nil $ Nil $ 395,974 $ Nil
Short-term compensation for the nine months ended June 30, 2016 included the Company’s annual performance
corporate bonus of which 75% or $131,250 was paid to its management during the nine months ended September 30,
2016 which had been previously accrued for as operating expense during the year ended December 31, 2015 (the
remaining 25% was paid during the fourth quarter of 2016). There was no annual performance corporate bonus paid
out during the three or nine months ended June 30, 2017.
There were no options or RSUs granted to directors and key management during the three months ended September
30, 2017 and 2016. The directors and key management were awarded 252,950 options under the Company’s stock
option plan during the nine months ended September 30, 2017 as well as 199,000 RSUs. There were no options or
RSUs granted to directors and key management during the nine months ended September 30, 2016.
PROPOSED TRANSACTIONS
None.
CUSTOMER LOAN
On October 1, 2014, the Company announced that it invested in Stream TV Networks, Inc. (“Stream TV”), a current
customer of Intrinsyc, an amount of $1,500,000 in the form of a subordinated, secured convertible promissory note
bearing interest at three percent (3%) per annum with a maturity date of December 31, 2015 (the “Note”). Interest is
payable on the earlier of (i) December 31, 2015 or (ii) when converted to Stream TV shares. Stream TV committed
to acquire a minimum of $3,000,000 in Intrinsyc products, services, and royalties over the next twelve months.
The Note was initially convertible into the securities of Stream TV at the sole option of Stream TV subject to the
execution an equity financing of a minimum of $15 million by Stream TV (the “Qualified Financing”). The Note was
convertible into the class of securities sold in the Qualifying Financing at the share price issued in the Qualifying
Financing.
The Company had determined that a reasonable market interest rate for a loan with the features of the Stream TV
convertible loan and for pre-commercial entities in the emerging technology sector would be 12%. The Company
recognized the difference as a deferred discount.
On December 10, 2015, the Company announced that the arrangements were amended, to increase the purchase
commitment by Stream TV to $4,500,000 in Intrinsyc products, services and royalties to be generated on or before
March 31, 2016 which Stream TV met. In addition, the subordinated, secured convertible promissory note was
amended to remove the conversion feature and to extend the maturity date from December 31, 2015 to June 30, 2016.

36
On June 28, 2016, the Company announced that the arrangements were further amended, to increase the purchase
commitment to $6,000,000 in Intrinsyc products and royalties to be generated on or before December 30, 2016, which
has been met by Stream TV. In addition, the subordinated, secured promissory note, valued at $1.5 million, has been
further amended to extend the maturity date from June 30, 2016 to December 30, 2016.
On December 29, 2016, the Company announced that the subordinated, secured promissory note, valued at $1.5 million,
has been further amended to extend the maturity date from December 30, 2016 to March 30, 2017. In consideration
for the extension Intrinsyc received 30,000 warrants convertible into Class A common shares in Stream TV Networks,
Inc. on a 1 for 1 basis for a period of up to 5 years. To date, none of these warrants have been exercised. No value has
been ascribed to the warrants due to level one inputs not being available.
On February 2, 2017, the Company announced that the subordinated, secured promissory note, valued at $1.5 million,
has been further amended to extend the maturity date from March 30, 2017 to February 1, 2018. In consideration for
the extension Intrinsyc received 120,000 warrants convertible into Class A common shares in Stream TV Networks,
Inc. on a 1 for 1 basis for a period of up to 5 years. To date, none of these warrants have been exercised. In addition,
Stream TV committed to acquire a minimum of $2,000,000 in Intrinsyc products, services, and royalties to be
purchased or generated between February 1, 2017 and February 1, 2018. No value has been ascribed to the warrants
due to level one inputs not being available.
The Company has assessed the Note for impairment at the end of reporting period and concluded that no loss event
had occurred since the granting of the Note. However, the Company acknowledges that there is uncertainty regarding
eventual realization of the Note due to the uncertainty inherent to the fact that Stream TV is a pre-commercial entity
in an emerging technology sector.
SUBSEQUENT EVENTS
None.
CRITICAL ACCOUNTING POLICIES AND ESTIMATES
These interim condensed consolidated financial statements, which have been approved by the Board of Directors on
November 6, 2017, have been prepared in accordance with International Accounting Standard 34, Interim Financial
Reporting (“IAS 34”). These interim condensed consolidated financial statements have been prepared using the
historical cost basis and the same accounting policies as those disclosed in the Company’s annual financial statements
as at and for the year ended December 31, 2016. Accordingly, these interim condensed consolidated financial
statements do not include all disclosures required for annual financial statements and should be read in conjunction
with the Company’s annual financial statements as at and for the year ended December 31, 2016 (which were prepared
in accordance with International Financial Reporting Standards, or “IFRS”).
Revenue Recognition
Revenues consist of services from software modification, consulting, implementation, training and integration
services. These services are set forth separately in the contractual arrangements such that the total price of the customer
arrangement is expected to vary as a result of the inclusion or exclusion of these services. For those contracts where
the services are not essential to the functionality of any other element of the transaction, the Company determines
vendor-specific objective evidence (“VSOE”) of fair value for these services based upon normal pricing and
discounting practices for these services when sold separately. These services contracts are primarily time and material
based contracts. Revenue from these services is recognized at the time such services are rendered by the Company so
long as persuasive evidence of an arrangement exists, delivery has occurred, the fee is fixed or determinable, and
collectability is reasonably assured.
The Company also enters into contracts that are primarily fixed fee arrangements to render specific consulting and
software modification services. The percentage of completion method is applied to these more complex contracts that
involve the provision of services relating to the design or building of complex systems, because these services are
essential to the functionality of other elements in the arrangement. Under this method, revenue is recognized using the
percentage of completion method and is calculated based on actual hours incurred compared to the estimated total

37
hours for the services under the arrangement, so long as persuasive evidence of an arrangement exists, delivery has
occurred, the fee is fixed or determinable, and collectability is reasonably assured. If the Company does not have a
sufficient basis to measure progress towards completion, revenue is recognized when final acceptance is received by
the Company from the customer.
The Company recognizes revenue from the sale of software licenses upon the transfer of title to the customer, so long
as persuasive evidence of an arrangement exists, delivery has occurred, the fee is fixed or determinable, and
collectability is reasonably assured. The Company uses the residual method to recognize revenue on delivered
elements when a license agreement includes one or more elements to be delivered at a future date if evidence of the
fair value of all undelivered elements exists. If an undelivered element for the arrangement exists under the license
arrangement, revenue related to the undelivered element is deferred based on VSOE of the fair value of the undelivered
element. If VSOE of fair value does not exist for all undelivered elements, all revenue is deferred until sufficient
evidence exists or as elements are delivered.
The Company’s multiple-element sales arrangements include arrangements where software licenses and the associated
post contract customer support (“PCS”) are sold together. The Company has established VSOE of the fair value of the
undelivered PCS element based on the contracted price for renewal PCS included in the original multiple-element
sales arrangement, as substantiated by contractual terms. The Company’s multiple-element sales arrangements
generally include rights for the customer to renew PCS after the bundled term ends. These rights are irrevocable to
the customer’s benefit, are for specified prices, are consistent with the initial price in the original multiple-element
sales arrangement, and the customer is not subject to any economic or other penalty for failure to renew. Further, the
renewal PCS options are for services comparable to the bundled PCS and cover similar terms.
PCS revenue associated with software licenses is recognized rateably over the term of the PCS period, which typically
is one year. Any unrecognized revenue is recorded in deferred revenue. PCS revenue includes software license updates
that provide customers with rights to unspecified software product upgrades, maintenance releases and patches
released during the term of the PCS period.
The Company recognizes revenue from the sales of hardware products upon the later of transfer of title or upon
shipment of the hardware product to the customer so long as persuasive evidence of an arrangement exists, delivery
has occurred, the fee is fixed or determinable, and collectability is reasonably assured.
The Company has entered into contracts with some of its customers to bundle and resell the Company’s products with
their own products for a per unit royalty fee. Royalty revenue is recognized as the Company’s products are sold by
the Company’s customers.
The Company has entered into a contract with one of its customers to provide support services for its own customers.
Revenue is recognized rateably of the terms of the support service period, which is for a period of one year.
Allowance for Doubtful Accounts
The Company records an allowance for doubtful accounts based on specific accounts past due. The allowance is
based on the Company’s knowledge of the financial condition of its customers, the aging of the receivables, current
business environment and historical experience. A change to these factors could impact the estimated allowance and
the provision for bad debts.
New Standards and Interpretations Not Yet Adopted
Standards issued but not yet effective up to the date of issuance of the Company's consolidated financial statements
are listed below. This listing is of standards and interpretations issued, which the Company reasonably expects to be
applicable at a future date. The Company is currently assessing the impact of the following standards on the
consolidated financial statements and intends to adopt these standards when they become effective.

38
IFRS 9 – Financial Instruments: Classification and Measurement
IFRS 9 - Financial Instruments replaces the current IAS 39 Financial Instruments Recognition and Measurement.
The standard introduces new requirements for classifying and measuring financial assets and liabilities. The Company
will start the application of IFRS 9 in the financial statements effective from January 1, 2018. The Company has
evaluated the impact on the financial statements of IFRS 9 and believes there will be no impact to the financial
statements.
IFRS 15 – Revenue from Contracts with Customers
IFRS 15 – Revenue from Contracts with Customers. The standard replaces all existing revenue requirements in IFRS
and applies to all revenue arising from contracts with customers. The standard outlines the principles an entity must
apply to measure and recognize revenue. The core principle is that an entity will recognize revenue at an amount that
reflects the consideration to which the entity expects to be entitled in exchange for transferring goods or services to a
customer.
The principles in IFRS 15 will be applied using a five-step model:
1) Identify the contract(s) with a customer;
2) Identify the performance obligations in the contract;
3) Determine the transaction price;
4) Allocate the transaction price to the performance obligations in the contract; and
5) Recognize revenue when (or as) the entity satisfies a performance obligation
The standard also specifies how to account for the incremental costs of obtaining a contract and the costs directly
related to fulfilling a contract. The Company will start the application of IFRS 15 in the financial statements effective
from January 1, 2018. The Company has begun the process of evaluating the impact on the financial statements of
IFRS 15 but is not yet possible to make a reliable estimate of its impact.
FINANCIAL INSTRUMENTS AND OTHER INSTRUMENTS
The Company has classified cash and cash equivalents as held-for-trading financial assets, measured at fair value with
short-term investments being classified as available for sale financial assets. Trade and other receivables as well as
the customer loan are classified as loans and receivables, measured at amortized cost. Trade and other payables are
classified as other liabilities, measured at amortized cost.
The carrying values and fair values of financial assets (liabilities) as at September 30, 2017 and December 31, 2016
are summarized as follows:
September 30, 2017 December 31, 2016
Carrying
Value
Fair
Value
Carrying
Value
Fair
Value
Held-for-Trading $ 4,546,543 $ 4,546,543 $ 5,381,518 $ 5,381,518
Available for Sale $ 3,132,350 $ 3,132,350 $ 2,169,402 $ 2,169,402
Loans and Receivables $6,081,863 $6,081,863 $ 5,441,370 $ 5,441,370
Other Liabilities ($3,254,934) ($3,254,934) ($2,168,678) ($2,168,678)
At September 30, 2017, the Company’s financial instruments which are measured at fair value on a recurring basis
were its cash and cash equivalents and short term investments. As of September 30, 2017, Available for Sale financial
assets totalling $3,132,350 were classified Level 2 (December 31, 2016 - $2,169,402).
Disclosures relating to exposure to risks, in particular credit risk, liquidity risk, foreign currency risk, and interest rate
risk are provided below.

39
Credit Risk
Credit risk is the risk of an unexpected loss if a customer or counterparty to a financial instrument fails to meet its
contractual obligations. The Company's financial instruments that are exposed to concentrations of credit risk are
primarily cash and cash equivalents, short-term investments, trade and other receivables and customer loan. The
Company limits its exposure to credit risk with respect to cash and cash equivalents by investing available cash, from
time to time, in short-term deposits with Canadian financial institutions and commercial paper with a rating not less
than R1. With respect to trade and other receivables, the Company engages EDC to perform ongoing credit evaluations
of Intrinsyc’s customers’ financial condition and requires letters of credit or other guarantees whenever deemed
necessary.
Trade and other receivables were aged as follows as at September 30, 2017 and December 31, 2016:
September 30,
2017
December 31,
2016
Current $ 2,894,122 $ 2,950,373
31-60 days
Over 60 days
327,332
1,124,159
302,486
531,011
$ 4,345,613 $ 3,783,870
The Company has assessed the customer loan (the “Note”) for impairment at the end of reporting period and concluded
that no loss event had occurred since the granting of the Note as at September 30, 2017. However, the Company
acknowledges that there is uncertainty regarding eventual realization of the Note due to the uncertainty inherent to the
fact that Stream TV is a pre-commercial entity in an emerging technology sector.
Liquidity Risk
Liquidity risk is the risk that the Company will not be able to meet its financial obligations as they fall due. The
Company's approach to managing liquidity risk is to ensure, as far as possible, that it will always have sufficient
liquidity to meet liabilities when due. The contractual maturity of the majority of accounts payable is within one
month.
Trade and other payables were aged as follows as at September 30, 2017 and December 31, 2016:
September 30,
2017
December 31,
2016
Current $ 2,023,964 $ 1,585,838
31-60 days
Over 60 days
617,053
613,917
580,364
2,476
$ 3,254,934 $ 2,168,678
Foreign Currency Risk
Although substantially all of the Company’s revenues are received in U.S. dollars, the Company incurs operating costs
primarily attributable to its services business and has outstanding trade and other payables denominated in Canadian
dollars and other foreign currencies. Fluctuations in the exchange rates between these currencies could have a material
effect on the business, financial condition and results of operations. The Company maintains certain assets, inclusive
of a portion of its treasury investments, in Canadian dollars which are translated to its U.S. dollar functional currency
resulting in an unrealized foreign exchange gain or loss. With all other variables remaining constant, assuming a 10%
weakening of the Canadian dollar versus the U.S. dollar would have had the following impact on net loss as follows
in the table below. An assumed 10% strengthening of the Canadian dollar versus the U.S. dollar would have had an
equal but opposite effect on the amounts shown below:

40
A 10% change in the New Taiwanese dollar to U.S. dollar exchange rate would have an approximate $13,000 impact
on net income for three and nine months ended September 30, 2017 (three and nine months ended September 30,
2016– $5,000).
Interest Rate Risk
The Company's exposure to interest rate fluctuations is primarily interest earned on its cash and cash equivalents as
well as its short-term investments. During the three months ended September 30, 2017, the Company earned $62,275
of interest income on its cash and cash equivalents as well as its short-term investments and customer loan. An increase
or decrease of 100 basis points in the average interest rate earned during the period would have adjusted net earnings
by approximately $77,000. This analysis assumes that all other variables, in particular foreign currency rates, remain
constant.
DISCLOSURE OF OUTSTANDING SHARE DATA
The Company is authorized to issue an unlimited number of common shares and an unlimited number of preference
shares. As of November 8, 2017, the Company has 21,110,588 common shares issued and outstanding and no
preference shares issued and outstanding.
The Company has instituted a rolling incentive stock option plan whereby shares reserved for issuance under the plan
shall reflect the lesser of (i) 10% less 1 share of the issued and outstanding common shares of the Company from time
to time; and (ii) 3,750,000 common shares. As of November 8, 2017, the Company is entitled to grant incentive stock
options for 2,089,588 common shares under the Company’s stock option plan, of which 1,337,229 have been granted.
The Company has adopted a restricted share unit plan (the “RSU Plan”) which was approved by its shareholders on
May 16, 2017. The aggregate maximum number of shares available for issuance from treasury under the RSU Plan
shall not exceed 500,000 shares. The fair value of these equity-settled awards is recognized as compensation expense
over the period that related services are rendered with a corresponding increase in equity. The total amount expensed
is recognized over the vesting period on a tranche basis, which is the period over which all the specified vesting
conditions should be satisfied. As of November 8, 2017, the Company has granted 219,000 RSUs.
On September 29, 2017, the Company received approval from the TSX regarding the notice filed by the Company to
establish a normal course issuer bid (“NCIB”) program to purchase, for cancellation, up to 500,000 common shares
or approximately 2.4% of Intrinsyc’s issued and outstanding common shares, as at September 21, 2017. The NCIB
program commences on October 4, 2017 and will terminate on October 3, 2018, or on such earlier date as the Company
may complete its purchases pursuant to a Notice of Intention filed with the TSX. As of November 8, 2017, the
Company has purchased and cancelled 90,000 common shares for CDN$146,528.
RISKS AND UNCERTAINTIES
An investment in the securities of the Company may be regarded as speculative due to the Company’s stage of
development. Risk factors relating to the Company could materially affect the Company’s future results and could
cause them to differ materially from those described in forward-looking statements relating to the Company.
Prospective investors should carefully consider these risks.
Source of net earnings/loss variability from
changes in foreign exchange rates
Three Months
ended
September 30,
2017
Three Months
ended
September 30,
2016
Nine Months
ended
Nine Months
ended
September
30, 2017 September
30, 2016
Statement of Financial Position exposure ($284,683) ($ 193,905) ($284,683) ($193,905)
Net Cost of Sales/Operating Expenses (net
exposure) 158,279 164,334 492,489 515,835
Net exposure ($ 126,403) ($ 29,571) $ 207,806 $ 321,930

41
The following are some of the risks that are associated with the Company’s business and operations and should be
carefully considered by any potential investor in the Company’s shares:
Worsened General Economic Conditions
The decline in the global economic environment in 2009 and the continuing economic instability in certain parts of
the world resulted in increasing uncertainty regarding future revenue and customer commitments, both in terms of
timing and magnitude for such future sales. The economic crisis adversely impacted the software industry which the
Company services. If the global economic climate does not continue to recover, the Company may not generate the
sales activity required to support its operations resulting in requirement for additional restructurings and erosion of its
existing capital resources which may hinder the future viability of the Company.
Additional Financing
Even though the Company has been profitable since 2015, it has a history of operating losses and uses cash raised in
equity markets to partially fund working capital. If adequate funds are not available when required or on acceptable
terms, the Company may be required to delay, scale back or terminate its sales and marketing efforts, and may be
unable to continue operations. There can be no assurance that the Company will be able to obtain the additional
financial resources required to compete in its markets on favorable commercial terms or at all. Any equity offering
may result in dilution to the ownership interests of shareholders and may result in dilution of the value of such interests.
Research and Development
The research and development activities of the Company may be funded by its customers through engineering services
provided in addition to the Company’s investment in research and development activities. If the Company fails to
develop new products, incurs delays in developing new products, or if the product the Company develops are not
successful, the Company’s business could be harmed. Even if the Company does develop new products which are
accepted by its target markets, the Company cannot assure that the revenue from these products will be sufficient to
justify the Company’s investment in research and development. The Company is highly dependent on a strategic
partner and some customers to subsidize development of new products. There can be no assurance that our strategic
partners or customers will continue to support the Company’s product development initiatives.
Distribution of Third Party Products
The Company is a distributor or reseller of products manufactured in whole or part by other companies, including
M2M communications and embedded computing modules. There can be no assurance that we will continue to be
authorized to sell these products. Products that the Company sells may become obsolete and not replaced. This could
have a materially negative effect on future revenue.
Reliance on Third Party Suppliers
The Company’s Embedded Computing business is dependent upon third party technology suppliers, inclusive of
contract manufacturers with respect to the availability, timeliness of delivery, cost and quality of products purchased
by the Company from suppliers in addition to potential liability exposure arising from contractual arrangements with
its suppliers. Failure to receive supply of key components required to build the Company’s products on a timely basis
and of high quality can adversely impact the Company’s revenue, resulting in revenue delays and even cancellation
of customer orders.
History of Losses
Even though the Company has been profitable since 2015, it has a history of operating losses, and there can be no
assurance that the Company will be profitable in the future. As at September 30, 2017, the Company had an
accumulated deficit of approximately $106.8 million. The Company’s prospects must be considered in the context of
the implementation stage of its current strategy, the risks and uncertainties it faces, and the inability of the Company
to accurately predict its results of sales and marketing initiatives. There can be no assurances that implementation of
the Company’s strategy will result in the Company sustaining profitable operations.

42
Stock Price Volatility
The market price for the common shares of the Company fluctuates significantly, and these fluctuations tend to be
exaggerated if the trading volume is low. The market price of the common shares may rise or fall in response to
announcements of technological or competitive developments, acquisitions or strategic alliances by the Company or
its competitors, the gain or loss by the Company of significant orders or broad market fluctuations.
Product Development and Technological Change
The market for the Company’s products and services is characterized by rapidly changing technology, evolving
industry standards and frequent new product introductions. To be successful, the Company will need to enhance
existing products and to introduce new products and features in response to changing standards, customer
requirements, and technological innovations by others. There can be no assurance that the Company will be successful
in doing this in a timely manner or at all.
The embedded computing and Internet of Things industries are characterized by a continuous flow of improved
products which render existing products obsolete. There can be no assurance that products or technologies developed
by others will not render the Company’s products obsolete or non-competitive.
Sales and Marketing and Strategic Alliances
If the Company is to become successful, it must maintain and expand its marketing and technology alliances. There
is no assurance the Company will be able to reach agreements with additional alliance partners on a timely basis or at
all, or that these partners will devote sufficient resources to advancing the Company’s interests.
The Company’s strategic alliances with operating system vendors, semiconductor manufacturers, and independent
software vendors are a key part of the Company’s overall business strategy. The Company cannot, however, be certain
that it will be successful in developing new strategic relationships or that the Company’s strategic partners will view
such relationships as significant to their own business or that they will continue their commitment to the Company in
the future. The Company’s business, results of operation, financial condition and stock price may be materially
adversely affected if any strategic partner discontinues its relationship with the Company for any reason. Additionally,
the Company at times relies on the voluntary efforts of its strategic partners rather than compliance with contractual
obligations, and there are at times no minimum performance requirements. Therefore, the Company cannot be certain
that these relationships will be successful.
Dependence on a Small Number of Customers
The Company’s revenue is dependent, in large part, on significant contracts from a limited number of customers.
During the three and nine months ended September 30, 2017, approximately 30% and 32% of the Company’s
consolidated revenue was attributable to its largest two (2) customers. Revenue derived from current and future large
customers may continue to represent a significant portion of total revenue. The inability to continue to secure and
maintain a sufficient number of large contracts would have a material adverse effect on the business, financial
condition, operating results and cash flows of the Company. Moreover, the success of the Company will depend in
part upon its ability to obtain orders from new customers, as well as the financial condition and success of its customers
and general economic conditions.
Length of Sales Cycle
The typical sales cycle of the Company’s products and services is lengthy (generally between six and twelve months),
unpredictable, and involves significant investment decisions by prospective customers, as well as education of those
customers regarding the use and the benefits of the Company’s products and services. The purchase of the Company’s
products and services is often delayed while prospective customers conduct lengthy internal reviews and obtain
expenditure approvals. As a result, the Company’s quarterly financial results may vary significantly.
43
Customer Credit Risk
Historically, the Company has offered very limited credit terms to our customers. As its customer base expands, as
orders increase in size, the Company expects to offer increased credit terms and flexible payment programs to its
customers. Doing so may subject the Company to increased credit risk, higher accounts receivable with longer days
outstanding, and increases in charges or reserves, which could have a material adverse effect on its business, results
of operations and financial condition.
Visibility of Future Customer Demand
The Company generally does not obtain firm, long-term purchase commitments from its customers, and frequently
does not have visibility as to their future demand. Customers also cancel requirements, change engineering or other
service requirements, change production quantities, delay production or revise their forecasts for future orders for a
number of reasons that are beyond the Company’s control. Cancellations, reductions or delays by a significant
customer, or by a group of customers, could seriously harm the Company’s operating results and negatively affect its
working capital levels. Such cancellations, reductions or delays have occurred from time to time and may continue to
occur.
Selling Price Erosion
Average selling prices of computing products typically are higher at the time of introduction of new products, which
utilize the latest technology and tend to decrease over time as such products become commoditized and are ultimately
replaced by even newer generation products. The Company cannot predict the timing or amount of any decline in the
average selling prices of its products that it may experience in the future. In some instances, its agreements with
distributors limit the ability to reduce prices unless it can make such price reductions available to them, or price protect
their inventory. If the Company is unable to decrease per unit manufacturing costs faster than the rate at which average
selling prices continue to decline, its business, financial condition and results of operations will be harmed.
Length of Product Development Cycle and Uncertainty of our Client’s success in the Market
The Company may communicate “Design Wins”, whereby customers are in the process of developing their products
based on the Company’s embedded computing modules, either off-the-shelf or custom, or customers that have made
commitments through signed agreements. Even after deciding to purchase the Company’s embedded computing
products,, the Company’s customers may deploy the products slowly, fail to launch their products in the market, or
may not reach their unit shipment goals depending on a variety of factors, including the skill level of the customer and
the status of its own technology, the customer having sufficient working capital to develop and produce its products,
changing market conditions and competitive pressures, whether the customer has established sales channels and
established demand for their products, and other factors beyond the control of the Company. These factors create a
high degree of uncertainty and unpredictability to future revenue from the Company’s embedded computing products.
Intellectual Property Protection
The Company’s ability to compete may be affected by its ability to protect its intellectual property. It relies primarily
on a combination of copyright, trademark, patent and trade secret laws, confidentiality procedures and contractual
provisions to protect its intellectual property. While the Company believes that its products and technologies are
adequately protected against infringement, there can be no assurance of effective protection. Monitoring and
identifying unauthorized use of the Company’s technology is difficult, and the prohibitive cost of litigation may impair
the Company’s ability to prosecute any infringement. The commercial success of the Company will also depend upon
its products not infringing any intellectual property rights of others and upon no claims for infringement being made
against the Company. The Company believes that it is not infringing any intellectual property rights of third parties,
but there can be no assurance that such infringement will not occur. An infringement claim against the Company by
a third party, even if it is invalid, could have a material adverse effect on the Company because of the costs of
defending against such a claim.

44
Competition
Because of intense market competition, the Company may not succeed. The Company’s products are built upon
processor technology acquired from Qualcomm Technologies, Inc. This technology is becoming more broadly
available to Intrinsyc’s competitors and there are an increasing number of competitive products being introduced to
the market. Some of the Company’s current and potential competitors have longer operating histories, stronger brand
names and greater financial, technical, marketing and other resources than the Company. Current and potential
competitors may also have existing relationships with many of the Company’s prospective customers, and prospective
OEM customers may be developing products for their own use that are comparable to the Company’s products. In
addition, the Company expects competition to persist and intensify in the future, which could adversely affect the
Company’s ability to increase sales.
International Business Operations
The Company continues to operate internationally. International sales and the related infrastructure support operations
carry certain risks and costs such as the administrative complexities and expenses of administering a business abroad;
complications in both compliance with and also unexpected changes in regulatory requirements, foreign laws,
international import and export legislation, trading policies, tariffs and other barriers; potentially adverse tax
consequences; and uncertainties of law and enforcement relating to the protection of intellectual property and
unauthorized duplication of software. There can be no assurance that these factors will not be experienced in the future
by the Company or that they will not have a material adverse impact on the Company’s business, results of operations
and financial conditions.
Foreign Exchange Risk
Although substantially all of the Company’s revenues are received in U.S. dollars, the Company incurs operating costs
primarily attributable to its services business and has outstanding trade and other payables denominated in Canadian
dollars and other foreign currencies. The Company attempts to mitigate this risk by denominating many of its payment
obligations in U.S. dollars. The Company maintains certain assets, inclusive of a portion of its treasury investments,
in Canadian dollars. Fluctuations in the exchange rates between these currencies could have a material effect on the
business, financial condition and results of operations of the Company.
Insufficient, Excess or Obsolete Inventory
As a result of the Company’s strategy to provide greater choice and customization of our products to its customers, it
is required to maintain a high level of inventory of components. If the Company fails to maintain sufficient inventory,
it may not be able to meet demand for its products on a timely basis, and sales may suffer. If the Company
overestimates customer demand, the Company could experience excess inventory of its products and be unable to sell
those products at a reasonable price, or at all. As a result, the Company may need to record higher inventory reserves.
In addition, from time to time the Company assumes greater inventory risk in connection with the purchase or
manufacture of more specialized components in connection with higher volume sales opportunities. The Company
expects that it will experience write-downs from time to time in the future related to existing and future commitments.
If the Company is later able to sell inventory with respect to which it has taken a reserve at a profit, it may increase
the quarterly variances in operating results. Historically, the Company has written off obsolete inventory. Excess or
obsolete inventory levels for these or other reasons could result in unexpected expenses or increases in reserves against
potential future charges which would adversely affect the Company’s business and financial results.
Potential Fluctuations in Quarterly Results
The Company’s quarterly operating results may vary significantly depending on factors such as the timing of new
product introductions and changes in pricing policies by the Company and its competitors, market acceptance of new
and enhanced versions of the Company’s products and the timing of orders from its hardware customers. Because the
Company’s operating expenses are based on anticipated revenues and a high percentage of the Company’s expenses
are relatively fixed in the short term, variations in the timing of recognition of revenues can cause significant
fluctuations in operating results from quarter to quarter and may result in unanticipated quarterly earnings shortfalls
or losses. The Company may in the future experience lower profit margins as a result of an increased focus on a
hardware-based business model to the extent that revenue from the sales of machine to machine and embedded
45
computing modules may account for a greater percentage of the Company’s revenues in future quarters. The market
price of the Company’s common shares may be highly volatile in response to such quarterly fluctuations.
Dependence on Key Personnel
The Company’s future success depends largely on its ability to attract and retain talented employees. The Company
is highly dependent on a limited number of key personnel to maintain customer and strategic relationships. Loss of
key personnel could have an adverse effect on these relationships and negatively impact the Company’s financial
performance. The Company’s future results of operations will depend in part on the ability of its officers, management
and other key employees to implement and expand operational, customer support and financial control systems and
to expand, train and manage its employee base. The Company’s future performance will also depend to a significant
extent on its ability to identify, attract, train and retain highly skilled sales, technical, marketing and management
personnel. If the Company were to lose the services of any key personnel, the Company may encounter difficulties
finding qualified replacement personnel.
Acquisitions
The Company has, and from time to time in the future may, acquire businesses, products or technologies that it believes
complement or expand its existing business. Acquisitions of this type involve a number of risks, including the
possibility that the operations of the acquired business will not be profitable or that the attention of the Company’s
management will be diverted from the day-to-day operation of its business. An unsuccessful acquisition could reduce
the Company’s margins or otherwise harm its financial condition. Any acquisition could result in a dilutive issuance
of equity securities, the incurrence of debt and the loss of key employees. The Company cannot ensure that any
acquisitions will be successfully completed or that, if one or more acquisitions are completed, the acquired businesses,
products or technologies will generate sufficient revenues to offset the associated costs of the acquisitions or other
adverse effects.
Product Liability
The Company’s license agreements with its customers typically contain provisions designed to limit the Company’s
exposure to potential product liability claims. There can be no assurance that such provisions will protect the Company
from such claims. The Company does not maintain product liability insurance. A successful product liability claim
brought against the Company could have a material adverse effect upon the Company’s business, results of operations
and prospects.
Customer Loan
There is uncertainty regarding the eventual realization of the Note issued by Stream TV to the Company in respect of
the Company’s loan due to the uncertainty inherent to Stream TV being a pre-revenue entity in an emerging technology
sector. There can be no assurance that the note will be repaid.
Future Share Sales
If the Company’s shareholders sell substantial amounts of the Company’s common shares, the market price of the
Company’s common shares could decrease.
Shareholder Rights Plan
The Company has implemented a Shareholder Rights Plan (the “Plan”). The Plan provides for substantial dilution to
an acquirer making a take-over bid for the common shares of the Company unless the bid meets the requirements
described in the Plan. This could discourage a potential acquirer from making a take-over bid and make it more
difficult for a third party to acquire control of the Company, even if such acquisition or bid would be beneficial to the
Company’s shareholders.
46
Costs Not Related to Core Business
From time to time the Company may incur significant charges as a result of business segment shut-down, corporate
restructuring, or other strategic activities which are not related to its core business. These charges could have an
adverse effect on the business, financial condition, operating results or cash flow of the Company.
Management of Growth
The Company’s future results of operations will depend in part on the ability of its officers and other key employees
to implement and expand operational, customer support and financial control systems and to expand, train and manage
its employee base. The Company’s future performance will also depend to a significant extent on its ability to identify,
attract, train and retain highly skilled sales, technical, marketing and management personnel. Substantial growth in
the Company’s hardware initiatives may require the Company to raise additional capital through the issuance of
additional shares or securing financing. There can be no assurance that the Company would be able to secure
additional funding through these activities.
INTERNAL CONTROL OVER FINANCIAL REPORTING AND DISCLOSURE
CONTROLS
The Chief Executive Officer and Chief Financial Officer have designed disclosure controls and procedures to provide
reasonable assurance that material information relating to the Company is made known to them by others within the
Company. The Chief Executive Officer and Chief Financial Officer have also designed internal controls over financial
reporting to provide reasonable assurance regarding the reliability of financial reporting and preparation of the
financial statements in accordance with IFRS.
The Chief Executive Officer and Chief Financial Officer have evaluated the effectiveness of the Company’s disclosure
controls and procedures and assessed the design of the Company’s internal controls over financial reporting in
accordance with Internal Control – Integrated Framework 2013, issued by the Committee of Sponsoring
Organizations of the Treadway Commission (“COSO”). This evaluation identified no instances in which internal
controls did not operate in an effective manner. Nonetheless, the Company has further strengthened its internal control
processes to mitigate future potential material financial statement misstatements and other internal control violations
during the three months ended September 30, 2017.
Because of the inherent limitations in a control system, any control system, no matter how well designed and operated,
can provide only reasonable, not absolute, assurance that it will prevent or detect all misstatements, due to error or
fraud, from occurring in the financial statements. As the Company has a limited number of personnel, management
has concluded that a weakness exists in the design of internal controls over financial reporting caused by a lack of
adequate segregation of duties. This weakness has the potential to result in material misstatements in the Company’s
financial statements and should also be considered a weakness in its disclosure controls and procedures. Management
has concluded that taking into account the present stage of the Company’s development and the best interests of its
shareholders; the Company does not have sufficient size and scale to warrant the hiring of additional personnel to
correct this weakness at this time. To help mitigate the impact of this weakness and to ensure quality financial
reporting, supervisory controls are exercised by management and the Audit Committee is vigilant in its’ oversight.
The Chief Executive Officer and Chief Financial Officer of the Company conducted an evaluation of the disclosure
controls and procedures as required by National Instrument 52-109, “Certification of Disclosure in Issuers’ Annual
and Interim Filings” issued by the Canadian Securities Administrators. They concluded that as at September 30, 2017,
the Company’s disclosure controls and procedures were effective to provide reasonable assurance that material
information regarding required disclosures was made known to them on a timely basis.

47
FORM 52-109F2
CERTIFICATION OF INTERIM FILINGS
I, Tracy Rees, Chief Executive Officer of Intrinsyc Technologies Corporation certify the following:
1. Review: I have reviewed the interim financial report and interim MD&A (together, the “interim filings”) of
Intrinsyc Technologies Corporation (the “issuer”) for the interim period ended September 30, 2017.
2. No misrepresentations: Based on my knowledge, having exercised reasonable diligence, the interim filings do not
contain any untrue statement of a material fact or omit to state a material fact required to be stated or that is necessary
to make a statement not misleading in light of the circumstances under which it was made, with respect to the period
covered by the interim filings.
3. Fair presentation: Based on my knowledge, having exercised reasonable diligence, the interim financial report
together with the other financial information included in the interim filings fairly present in all material respects the
financial condition, financial performance and cash flows of the issuer, as of the date of and for the periods presented
in the interim filings.
4. Responsibility: The issuer’s other certifying officer(s) and I are responsible for establishing and maintaining
disclosure controls and procedures (DC&P) and internal control over financial reporting (ICFR), as those terms are
defined in National Instrument 52-109 Certification of Disclosure in Issuers’ Annual and Interim Filings, for the
issuer.
5. Design: Subject to the limitations, if any, described in paragraphs 5.2 and 5.3, the issuer’s other certifying
officer(s) and I have, as at the end of the period covered by the interim filings
a. designed DC&P, or caused it to be designed under our supervision, to provide reasonable assurance that
i. material information relating to the issuer is made known to us by others, particularly during the period in
which the interim filings are being prepared; and
ii. information required to be disclosed by the issuer in its annual filings, interim filings or other reports filed or
submitted by it under securities legislation is recorded, processed, summarized and reported within the time
periods specified in securities legislation; and
b. designed ICFR, or caused it to be designed under our supervision, to provide reasonable assurance regarding the
reliability of financial reporting and the preparation of financial statements for external purposes in accordance
with the issuer’s GAAP.
5.1 Control framework: The control framework the issuer’s other certifying officer(s) and I used to design the
issuer’s ICFR is the Internal Control – Integrated Framework (2013) issued by the Committee of Sponsoring
Organizations of the Treadway Commission (“COSO”).
5.2 ICFR – material weakness relating to design: N/A
5.3 Limitation on scope of design: N/A.
6. Reporting changes in ICFR: The issuer has disclosed in its interim MD&A any change in the issuer’s ICFR that
occurred during the period beginning on July 1, 2017 and ended on September 30, 2017 that has materially affected,
or is reasonably likely to materially affect, the issuer’s ICFR.
Date: November 8, 2017
“Tracy Rees”
Tracy Rees
Chief Executive Officer

48
FORM 52-109F2
CERTIFICATION OF INTERIM FILINGS
I, George Reznik, Chief Financial Officer of Intrinsyc Technologies Corporation certify the following:
1. Review: I have reviewed the interim financial report and interim MD&A (together, the “interim filings”) of
Intrinsyc Technologies Corporation (the “issuer”) for the interim period ended September 30, 2017.
2. No misrepresentations: Based on my knowledge, having exercised reasonable diligence, the interim filings do not
contain any untrue statement of a material fact or omit to state a material fact required to be stated or that is necessary
to make a statement not misleading in light of the circumstances under which it was made, with respect to the period
covered by the interim filings.
3. Fair presentation: Based on my knowledge, having exercised reasonable diligence, the interim financial report
together with the other financial information included in the interim filings fairly present in all material respects the
financial condition, financial performance and cash flows of the issuer, as of the date of and for the periods presented
in the interim filings.
4. Responsibility: The issuer’s other certifying officer(s) and I are responsible for establishing and maintaining
disclosure controls and procedures (DC&P) and internal control over financial reporting (ICFR), as those terms are
defined in National Instrument 52-109 Certification of Disclosure in Issuers’ Annual and Interim Filings, for the
issuer.
5. Design: Subject to the limitations, if any, described in paragraphs 5.2 and 5.3, the issuer’s other certifying
officer(s) and I have, as at the end of the period covered by the interim filings
a. designed DC&P, or caused it to be designed under our supervision, to provide reasonable assurance that
i. material information relating to the issuer is made known to us by others, particularly during the period in
which the interim filings are being prepared; and
ii. information required to be disclosed by the issuer in its annual filings, interim filings or other reports filed or
submitted by it under securities legislation is recorded, processed, summarized and reported within the time
periods specified in securities legislation; and
b. designed ICFR, or caused it to be designed under our supervision, to provide reasonable assurance regarding the
reliability of financial reporting and the preparation of financial statements for external purposes in accordance
with the issuer’s GAAP.
5.1 Control framework: The control framework the issuer’s other certifying officer(s) and I used to design the
issuer’s ICFR is the Internal Control – Integrated Framework (2013) issued by the Committee of Sponsoring
Organizations of the Treadway Commission (“COSO”).
5.2 ICFR – material weakness relating to design: N/A
5.3 Limitation on scope of design: N/A.
6. Reporting changes in ICFR: The issuer has disclosed in its interim MD&A any change in the issuer’s ICFR that
occurred during the period beginning on July 1, 2017 and ended on September 30, 2017 that has materially affected,
or is reasonably likely to materially affect, the issuer’s ICFR.
Date: November 8, 2017
“George Reznik”
George Reznik
Chief Financial Officer