Embed Size (px)
Citation preview

Intrarenal Dynamics in the Pathogenesis and Prevention
of Acute Urate Nephropathy
JOHND. CONGERand SANDORA. FALK
From the Departments of Medicine, Pathology, and Physiology, University of Colorado MedicalCenter and Veterans Administration Hospital, Denver, Colorado 80220
A B S T RA C T Tubular fluid flow, urine osmolality,and pH were selectively altered to determine therelative protective roles of these factors in a ratmodel of acute urate nephropathy. Various prehyper-uricemic conditions were established in five groupsof animals: (a) normopenic Wistar rats given no pre-treatment (Group I); (b) Wistar rats given acetazola-mide, 20 mg/kg, and isotonic NaHCO3 to produceurine alkalinization (Group II); (c) Wistar rats inwhich a moderate diuresis, similar to that observedin Group II but without urine alkalinization, wasinduced with furosemide, 2 mg/kg (Group III); (d)Wistar rats in which a high-flow solute diuresis wasinduced with furosemide, 15 mg/kg (Group IV); (e)Brattleboro rats, homozygous for pituitary diabetesinsipidus, that had a spontaneous high-flow waterdiuresis (Group V). A comparable level of hyper-uricemia (19.4+2.2 mg/100 ml) was achieved in allanimals with intravenous urate infusion. Clearanceand micropuncture studies were performed before and1 h after induction of hyperuricemia. Group I ratshad mean falls in renal plasma flow and glomerularfiltration rate of 83 and 86%, respectively; nephronfiltration rate decreased 66%, and tubular and micro-vascular pressures increased twofold. In Group IIthere were 45 and 47% declines in renal plasma flowand glomerular filtration rate, respectively, a 66%fall in nephron filtration rate, and a 30% increase intubular and vascular pressures. Moderate amountsof urate were seen in the kidneys. Group III hadchanges in renal function identical to Group II sug-gesting that the moderate prehyperuricemic diuresisin the latter group and not urine alkalinization pro-duced the partial protection observed. Groups IV
Portions of this study appeared in abstract form in theProceedings of the 8th Annual Meeting of the AmericanSociety of Nephrology, Washington, D. C., 25-26 November1975, 8: 60.
Received for publication 8 November 1976 and in revisedform 7 January 1977.
and V were completely and comparably protectedwith renal function studies unchanged from con-trols.
It is concluded that high tubular fluid flow, whetherinduced by a solute or water diuresis, is the primarymechanism of protection in acute urate nephropathy.At most, urine alkalinization plays a minor preventiverole.
INTRODUCTIONIt is an established clinical observation that abruptrenal failure can occur as the result of uric acidand urate deposition within the kidney (1-8). Althoughhyperuricemia per se is considered to be the neces-sary and immediate cause of this disorder, the rela-tively poor correlation between the plasma uratelevel and degree of renal dysfunction (5-9) suggeststhat additional factors must modify the rate of uricacid and urate precipitation and the severity ofconsequent renal damage. In vitro studies have shownthe importance of solvent pH and ionic strength indetermining the solubility of uric acid and its sodiumsalt (10-12). These findings have been the basis forthe use of forced diuresis and urine alkalinization inthe treatment of acute urate nephropathy (13). How-ever, neither the actual mechanism of protection northe relative efficacy of these two modalities of manage-ment have been determined, since the critical intra-renal factors that lead to uric acid and urate deposi-tion in the in vivo setting have not been clearlyestablished.
An animal model recently developed in our labora-tory (14) seemed to lend itself to an investigationof the roles of intrarenal dynamics in the pathogenesisand prevention of acute urate nephropathy. Theeffects of changes in tubular fluid flow rate, urinepH, and urine osmolality on the magnitude of renaldamage from acute hyperuricemia were evaluated inthe rat with clearance, micropuncture, and morphologictechniques.
TheJournal of Clinical Investigation Volume 59 May 1977 786-793786
The results indicated that high tubular fluid flowrate induced by either a solute or water diuresiswas the primary factor preventing the development ofacute urate nephropathy. Urine alkalinization had nodetectable protective effect in this model.
METHODSThe model of acute urate nephropathy is described in de-tail in a previous report (14). Male Wistar rats and Brattle-boro rats, homozygous for hypothalamic diabetes insipidus,and weighing 250-300g, were fasted overnight but per-mitted free access to water. They were anesthetized withpentobarbital (60 mg/kg i.p.) and supplemental doses ofpentobarbital (5-10 mg/kg i.v.) were given as necessaryduring the study. After anesthesia oxonic acid (250 mg/kg),a uricase inhibitor, was given intraperitoneally. The ratswere placed on a heated surgical table (370C) and preparedfor clearance and micropuncture experiments as previouslyoutlined (14). Polyethylene catheters were placed in theright external jugular vein, left renal vein via the rightfemoral vein, right femoral artery, and the ureter of theleft kidney which had been positioned for micropuncture.The femoral artery catheter was attached to a pressure trans-ducer (model 267B, Hewlett-Packard Co., Palo Alto, Calif.)and the blood pressure recorded on a Hewlett-Packardrecorder (model 7702B). Isotonic Ringer's solution con-taining inulin, para-aminohippurate (PAH)l and oxonicacid was infused via the jugular vein catheter at 50 IL/kgper min in Wistar rats. For Brattleboro rats the infusionrate was adjusted to match spontaneous urine flow rateas estimated from the 24-h volume before study. The aver-age rate of delivery into these Brattleboro rats was 150±30 ,ul/min. The concentrations of inulin and PAH weresufficient to give plasma levels of 50-100 mg/100 ml and2-4 mg/100 ml, respectively. Oxonic acid content was ad-justed to deliver 2 mg/kg per min. 1 h before the experi-ments, 1 ml of blood was removed from the femoral arteryand replaced with an equal volume of isotonic Ringer'ssolution. Aliquots of this blood equal in volume to samplestaken for inulin, PAH, and urate analysis were returned tothe animal during the study to maintain stability of hemato-crit.
To determine the effects of tubular fluid flow rate,urine pH, and osmolality on the severity of kidney damagefrom hyperuricemia, the rats were divided into five groupseach receiving a different treatment before hyperuricemiawas induced (Table I). Group I included Wistar ratsgiven no pretreatment. Group II included Wistar rats inwhich urine alkalinization was produced by giving acetazola-mide intravenously (20 mg/kg per h) and a maintenanceinfusion of isotonic sodium bicarbonate. The latter wasgiven at the same rate and with the same inulin, PAH,and oxonic acid content as the isotonic Ringer's solutiondescribed above. Group III contained Wistar rats in whicha diuresis quantitatively similar to that observed in Group IIwas established, but without a change in urine pH (UpH).This was accomplished by giving intravenous furosemide,2.0 mg/kg. Group IV included Wistar rats in which a highflow solute diuresis was induced by the intravenous in-jection of furosemide (15 mg/kg). Group V contained Brattle-
' Abbreviations used in this paper: GFR, glomerular filtra-tion rate; PAH, para-aminohippurate; P,,te, plasma urateconcentration; RPF, renal plasma flow; SNGFR, singlenephron GFR; Uosm, urine osmolality; UpH, urine pH;U,rate, urinary urate concentration; V, urine flow rate.
TABLE IDescription of Animal Groups Studied
Group I Normopenic Wistar rats, no pretreatmentGroup II Wistar rats, alkaline urine, moderate diuresisGroup III Wistar rats, acid urine, moderate diuresisGroup IV Wistar rats, high-flow solute diuresisGroup V Brattleboro rats, high-flow water diuresis
boro rats with a spontaneous high-flow water diuresis.They were given no specific treatment except for the adjust-ment in Ringer's solution infusion rate described above.Urine losses were replaced with equal volumes of iso-tonic Ringer's solution in Groups III and IV and with iso-tonic sodium bicarbonate in Group II.
30 min after beginning the selected pretreatment, allanimals were subjected to the following experimentalprotocol.
Control studies. Samples of femoral artery (0.4 ml) andrenal vein blood (0.1 ml) were obtained between two timed50-,A collections of urine. Inulin, PAH, and urate con-centrations were determined on blood and urine samples.Osmolality and pH were measured on urine samples. Timedcollections of tubular fluid were obtained from four orfive last proximal tubular loops with oil-filled micropipettes(8-10 j,m OD) as previously described (15). Using aservo-null pressure apparatus (Instrumentation for Physiologyand Medicine, San Diego, Calif.), hydrostatic pressureswere measured in 5-10 proximal tubules, 3-5 efferentarterioles, and 5-10 peritubular capillaries.
Experimental studies. After the control measurementswere completed, lithium urate,2 prepared by dissolving uricacid in a warmed solution of saturated lithium carbonateand adjusted to pH of 7.4, was injected into the jugularcatheter over 5 min. The total dose was 300 mg/kg deliveredin a volume of 3 ml. Femoral artery blood (0.3 ml) forurate concentration was obtained 3 min after the injec-tion, the time when urate achieved its highest level in theplasma. 1 h later repeat femoral artery and renal vein bloodand ureteral urine collections for inulin, PAH, urate, osmolal-ity, and pH were obtained. Repeat tubular fluid collec-tions were made from four to five new last proximaltubular sites. During collection, the intratubular pressureexisting in that tubule was monitored with a pressurepipette positioned just distal to the oil block. Fluid collec-tion was controlled to maintain pressure constant. Hydro-static pressures were remeasured in proximal tubules,efferent arterioles, and peritubular capillaries.
Morphologic studies. A detailed description of both thegross and microscopic lesions in this model has beenreported previously (14). In this study comparisons weremade under a dissecting microscope of kidneys, sec-tioned in planes parallel to their long axes. Each kidneywas photographed to document the degree of uric acidand urate deposition.
Analytical methods. Plasma and urine inulin and PAHwere measured with a Technicon AutoAnalyzer (TechniconInstruments Corp., Tarrytown, N. Y.). Urate content wasmeasured by a colorimetric uricase method (AmericanMonitor Corp., Indianapolis, Ind.) and urine osmolality de-termined with a model 3L osmometer (Advanced Instru-
2 In a prior set of control studies (14) there were nomeasurable effects of lithium per se on water handling orother parameters of renal function at 1 h with the dosesemployed in the present experiments.
Acute Urate Nephropathy 787
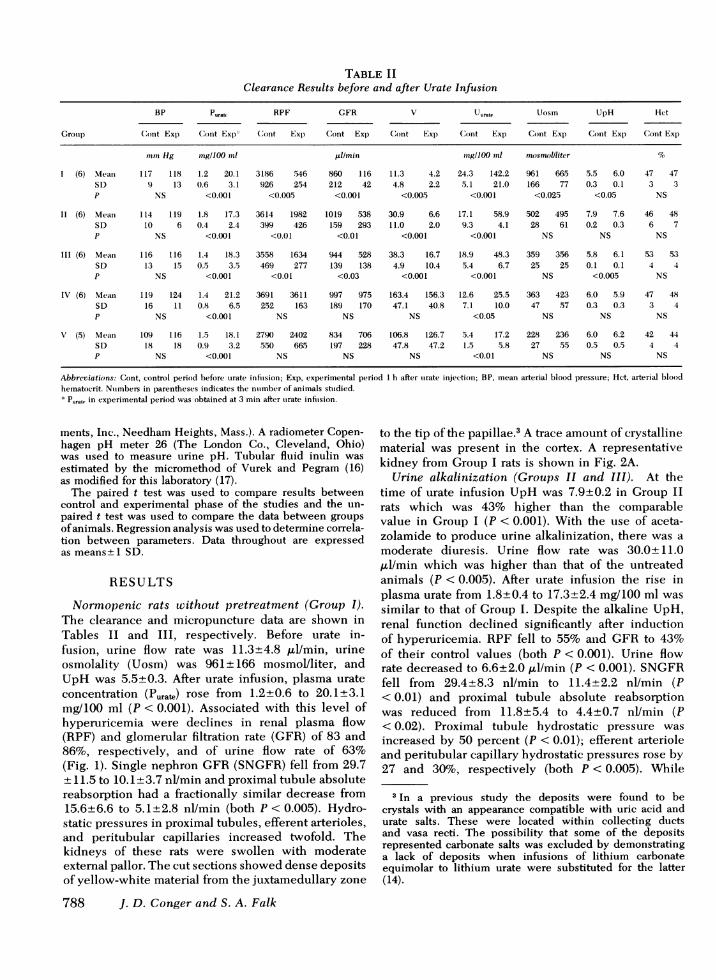
TABLE IIClearance Results before and after Urate Infusion
BP Puratt RPF GFR V Uurate Uosm UpH Het
Grotup Cont Exp Cont Exp (Cont Exxp Cont Exp Cont Exp C(ont Exp Cont Exp Cont Exp Cont Exp
min Hg mng/100 ml ul/min mng/100 mnl nmsmollliter %
1 (6) Meani 117 118 1.2 20.1 3186 .546 860 116 11.3 4.2 24.3 142.2 961 665 5.5 6.0 47 47SD 9 13 0.6 3.1 926 254 212 42 4.8 2.2 5.1 21.0 166 77 0.3 0.1 3 3P NS <0.001 <0.005 <0.001 <0.005 <0.001 <0.025 <0.05 NS
II (6) Mean 114 119 1.8 17.3 3614 1982 1019 .538 30.9 6.6 17.1 58.9 502 495 7.9 7.6 46 48SD 10 6 0.4 2.4 399 426 159 293 11.0 2.0 9.3 4.1 28 61 0.2 0.3 6 7P NS <0.001 <0.01 <0.01 <0.001 <0.001 NS NS NS
III (6) Mean 116 116 1.4 18.3 3558 1634 944 528 38.3 16.7 18.9 48.3 359 356 5.8 6.1 53 53SD 13 1.5 0.5 3.5 469 277 139 138 4.9 10.4 5.4 6.7 25 25 0.1 0.1 4 4P NS <0.001 <0.01 <0.03 <0.001 <0.001 NS <0.005 NS
IV (6) Mean 119 124 1.4 21.2 3691 3611 997 975 163.4 156.3 12.6 25.5 363 423 6.0 5.9 47 48SD 16 11 0.8 6.5 252 163 189 170 47.1 40.8 7.1 10.0 47 57 0.3 0.3 3 4P NS <0.001 NS NS NS <0.05 NS NS NS
V (5) Mean 109 116 1.5 18.1 2790 2402 834 706 106.8 126.7 5.4 17.2 228 236 6.0 6.2 42 44SD 18 18 0.9 3.2 550 665 197 228 47.8 47.2 1.5 5.8 27 55 0.5 0.5 4 4P NS <0.001 NS NS NS <0.01 NS NS NS
Abbreviations: Cont, control period before torate inftusion; Exp, experimental period I h after turate injection; BP, inean arterial blood pressture; Het, arterial bloodhematocrit. Nutmbers in parentheses indicates the ntumber of animals sttudied.* Punde in experimental period was obtained at 3 min after torate inftusion.
ments, Inc., Needham Heights, Mass.). A radiometer Copen-hagen pH meter 26 (The London Co., Cleveland, Ohio)was used to measure urine pH. Tubular fluid inulin wasestimated by the micromethod of Vurek and Pegram (16)as modified for this laboratory (17).
The paired t test was used to compare results betweencontrol and experimental phase of the studies and the un-paired t test was used to compare the data between groupsof animals. Regression analysis was used to determine correla-tion between parameters. Data throughout are expressedas means±1 SD.
RESULTS
Normopenic rats without pretreatment (Group I).The clearance and micropuncture data are shown inTables II and III, respectively. Before urate in-fusion, urine flow rate was 11.3±4.8 gl/min, urineosmolality (Uosm) was 961±166 mosmol/liter, andUpH was 5.5±0.3. After urate infusion, plasma urateconcentration (Purate) rose from 1.2±0.6 to 20.1±3.1mg/100 ml (P < 0.001). Associated with this level ofhyperuricemia were declines in renal plasma flow(RPF) and glomerular filtration rate (GFR) of 83 and86%, respectively, and of urine flow rate of 63%(Fig. 1). Single nephron GFR(SNGFR) fell from 29.7± 11.5 to 10.1±3.7 nl/min and proximal tubule absolutereabsorption had a fractionally similar decrease from15.6±6.6 to 5.1±2.8 nl/min (both P < 0.005). Hydro-static pressures in proximal tubules, efferent arterioles,and peritubular capillaries increased twofold. Thekidneys of these rats were swollen with moderateexternal pallor. The cut sections showed dense depositsof yellow-white material from the juxtamedullary zone
788 J. D. Conger and S. A. Falk
to the tip of the papillae.3 A trace amount of crystallinematerial was present in the cortex. A representativekidney from Group I rats is shown in Fig. 2A.
Urine alkalinization (Groups II and III). At thetime of urate infusion UpH was 7.9±0.2 in Group IIrats which was 43% higher than the comparablevalue in Group I (P < 0.001). With the use of aceta-zolamide to produce urine alkalinization, there was amoderate diuresis. Urine flow rate was 30.0±11.0,ul/min which was higher than that of the untreatedanimals (P < 0.005). After urate infusion the rise inplasma urate from 1.8±0.4 to 17.3±2.4 mg/100 ml wassimilar to that of Group I. Despite the alkaline UpH,renal function declined significantly after inductionof hyperuricemia. RPF fell to 55% anid GFR to 43%of their control values (both P < 0.001). Urine flowrate decreased to 6.6±2.0 Al/min (P < 0.001). SNGFRfell from 29.4±8.3 nl/min to 11.4±2.2 nl/min (P< 0.01) and proximal tubule absolute reabsorptionwas reduced from 11.8±5.4 to 4.4±0.7 nl/min (P< 0.02). Proximal tubule hydrostatic pressure wasincreased by 50 percent (P < 0.01); efferent arterioleand peritubular capillary hydrostatic pressures rose by27 and 30%, respectively (both P < 0.005). While
3 In a previous study the deposits were found to becrystals with an appearance compatible with uric acid andurate salts. These were located within collecting ductsand vasa recti. The possibility that some of the depositsrepresented carbonate salts was excluded by demonstratinga lack of deposits when infusions of lithium carbonateequimolar to lithium urate were substituted for the latter(14).

TABLE IIIMicropuncture Results before anid after Urate Infusion
SNGFR Jv PPr PE:A PC
Group Cont Exp Cont Exp Cont Exp Cont Exp Cont ExI)
nl/min inm Hg
I (6) Mean 29.7 10.1 15.6 5.1 10.6 26.1 14.2 26.4 10.9 18.1SD 11.5 3.7 6.6 2.8 3.7 5.1 2.6 2.3 2.3 1.0P <0.005 <0.005 <0.005 <0.001 <0.001
II (6) Mean 29.4 11.4 11.8 4.4 11.0 16.1 15.5 19.7 9.9 12.9SD 8.3 2.2 5.4 0.7 1.5 3.9 1.5 2.8 1.6 1.6P <0.01 <0.02 <0.01 <0.005 <0.005
III (6) Mean 26.4 14.5 14.6 8.7 10.6 15.8 15.7 20.3 10.5 12.6SD 9.2 5.2 5.6 2.0 1.6 2.9 0.8 3.2 0.8 1.1P <0.02 <0.03 <0.01 <0.05 <0.01
IV (6) Mean 25.4 26.8 12.6 14.3 10.3 11.7 15.3 16.3 10.7 11.6SD 6.9 7.5 3.8 3.8 1.3 2.1 1.4 1.1 0.8 1.0P NS NS NS NS NS
V (5) Mean 29.8 25.9 14.6 10.2 10.4 10.6 14.3 15.0 11.6 10.6SD 2.5 5.6 3.4 3.1 1.2 0.8 1.7 0.9 1.1 1.4P NS <0.01 NS NS NS
Abbreviations: Jv, proximal tubule absolute reabsorption; Pp, proximal tubule hydrostaticpressure; PEA, efferent arteriole hydrostatic pressure; Pc, peritubular capillary hydrostaticpressure. Numbers in parentheses represent the number of animals studied.
the fall in renal function in Group II was highlysignificant when compared to prehyperuricemicparameters, the declines in RPF and GFRand eleva-tions of tubular and vascular pressures were lessthan those in Group I animals (all P < 0.01).
The cut section of a kidney from a Group II ratis shown in Fig. 2B. There was a moderate amountof crystal deposition in the medulla and papilla,but less than that noted in Group I kidneys.
To determine whether the partial protection ofrenal function observed in Group II rats was a conse-quence of urine alkalinization or the moderate diuresispresent before urate infusion, the results were com-pared to those in Group III. The latter group had aprehyperuricemic urine flow rate of 38.3+4.9 ,ul/minwhich was not different from that for Group II,but the UpH of 5.8+0.1 was significantly more acidthan that of Group IL (P < 0.001) and similar to thatof Group I. After urate infusion, the decline in renalfunction in Group III was nearly identical to that ofGroup II (Fig. 1). In the former animals RPF fellfrom 3,588+460 to 1,634+277 ,ul/min. In the lattergroup the same parameter was reduced from 3,614+300 to 1,982 ,ul/min. Likewise, the fall in GFR inGroup III (944±+139 to 528±+138 ,ul/min) was the sameas that of Group II (1,019+159 to 538+293 ul/min).The decreases in urine flow rate (V) also were notdifferent between the two groups. When comparing
micropuncture results, there was a close parallelwith the clearance studies. There were like declinesin SNGFRand similar increases in micropressuremeasurements for the two groups.
The cut sections of Group III kidneys, as illustratedin Fig. 2C, had a moderate amount of urate deposi-
I T1TI
I AC 11: EZiSTUDY GROUP
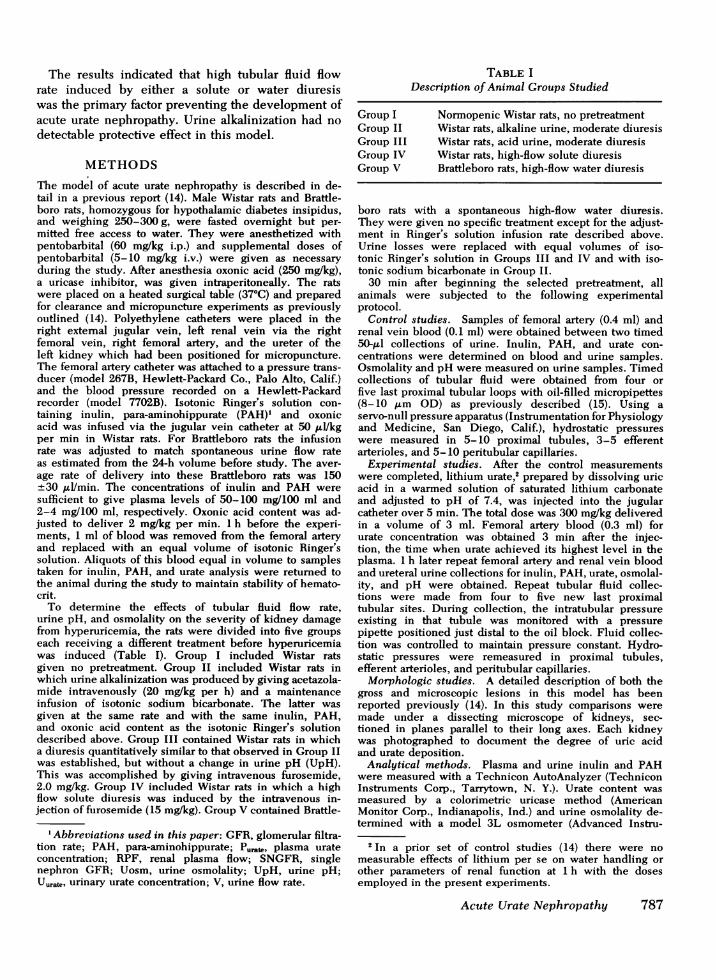
FIGURE 1 Percent of control values of renal plasma flow,glomerular filtration rate, and urine flow rate in the fivegroups of rats after induction of comparable levels of hyper-uricemia. I, no pretreatment; II, urine alkalinization andmoderate diuresis; III, acid urine and moderate diuresis;IV, high-flow solute diuresis; and V, high-flow water diuresis.
Acute Urate Nephropathy 789
c0
16 1
XX X~~~"
': ~ .a~; s ::*s 4 .: :.t, eSs,, .:::N.r,a .:;.'9,
tion similar in density to that seen in Group II
animals.High-flow solute diuresis (Group IV). In these ani-
mals, V was 163.4 ul/min before induction of hyper-uricemia, which was 15 times the correspondingvalue in Group I. Uosm was less than half, but UpHwas acid and not different from that of the untreatedrats. The change in P,at, after infusion was similar tothat in Group I, increasing from 1.4±0.8 to 21.2+6.5mg/100 ml (P < 0.001). Despite the rise in plasmaurate, renal function did not change. RPF, GFR, andV all remained at control levels as show in Fig. 1.Micropuncture measurements also continued atcontrol levels.
The kidneys of Group IV rats had a normal ex-
ternal appearance. In three of the six animals there
790 J. D. Conger and S. A. Falk
FIGuRE 2 Appearance of the cut surfaces of representativekidneys from animals in each of the five study groups: (A)Group I, no pretreatment; (B) Group II, urine alkaliniza-tion and moderate diuresis; (C) Group III, acid urine andmoderate diuresis; (D) Group IV, high-flow solute diuresis;(E) Group V, high-flow water diuresis. The white-streakeddeposits represent uric acid and urates.
were occasional streaks of uric acid in the papillae,otherwise there were no abnormalities detected on cutsections (Fig. 2D).
High-flow water diuresis (Group V). In the Brattle-boro rats the prehyperuricemic urine flow rate was106.8+47.8 ,ul/min, the Uosm 228 mosmol/liter andUpH 6.0+0.5. The Uosm was significantly lower thanany other group (P < 0.01). UpH was similar to GroupI. With urate infusion, the plasma level rose to 18.1+3.2 mg/100 ml, similar to that in Group I. As inGroup IV there was no measurable change in RPF,GFR, or V after hyperuricemia. Except for a slightfall in proximal reabsorption, none of the micropunc-ture parameters varied significantly between thecontrol and experimental periods.
There were rare patchy crystalline deposits noted in
the kidneys of two rats. In three of five animals nocrystals were seen (Fig. 2E).
DISCUSSION
The predominant abnormalities in this model of hyper-uricemia with acute renal failure (Group I) weretubular and vascular obstruction resulting in markeddeclines of renal blood flow and glomerular filtra-tion (14). The underlying pathologic lesion was thedeposition within collecting ducts, deep cortical, andmedullary vessels of uric acid and urate crystals.The biochemical factors that predispose to urate dep-osition are in large part related to the solubilitycharacteristics of this substance according to invitro studies (10-12). Plasma urate is present primarilyas the sodium salt and the normally measured levelsare relatively close to the in vitro determined solubilitylimit (10-12). A number of properties peculiar to therenal environment enhance the tendency to urateprecipitation within this organ. These include activesecretion of urate (18, 19), the renal concentratingmechanism, and the pH of tubular fluid relative tothe pKa of uric acid. The effects of these factors areto increase the concentration of urate in the tubularsystem and convert the major fraction of the ionizedsalt form to the less soluble acid form at pH levelsachieved beyond the distal tubule.4 Even at normalfiltered levels of urate, conditions are frequently suchthat the solubility of uric acid as determined by invitro measurements is approached or exceeded in thefinal urine (10). Based on these measurements, it isnot surprising that marked hyperuricemia, as occurs inneoplastic diseases and as was mimicked by the pres-ent experiments, should lead to deposition of uratesand uric acid in the kidney. On the other hand,there is considerable clinical evidence that despitesuch marked hyperuricemia the degree of renal dys-function that results is highly variable (5-9). For thisreason the present set of experiments was designedto examine the importance of dynamic factors withinthe kidney in the pathogenesis and prevention of acuiteurate nephropathy. The roles of tubular fluid flow rate,UpH, and Uosm were studied by selectively alteringthese parameters in a setting of relatively constanthyperuricemia.
V was of greatest significance in determining theseverity of urate deposition and renal fumnction im-pairment. Both the high-dose furosemide and Brattle-boro rats had complete protection from the renal dam-age of hyperuricemia. High urinary flow rates wereunique to these two groups of animals. Intermediatepreservation of kidney function was associated with
4The pKa of uric acid is 5.7 (9). Distal tubular fluidpH in normal hydropenic rats averages 6.3 (22).
120'r-
O 100'
0
z 80.
a: 60
L- 404
20
.00 .
0 gO0 (r = 0.7635,P<0.001)
20 40 60 80 100 120 140 160 180 200
PREHYPERURICEMICURINE FLOWRATE (MI/min)
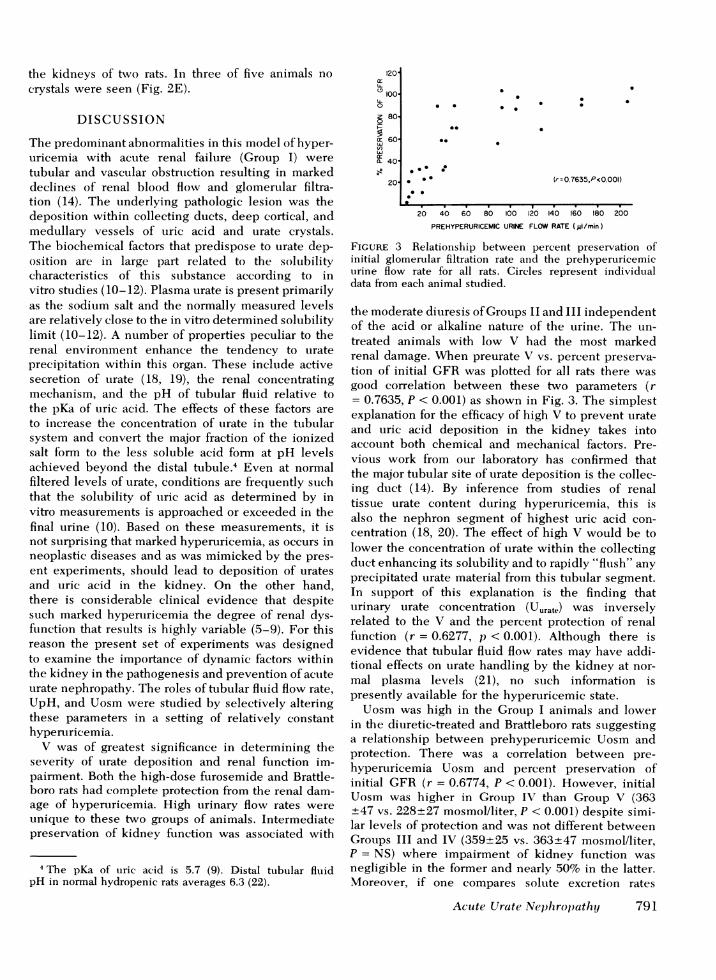
FIGURE 3 Relationship between percent preservation ofinitial glomerular filtration rate and the prehyperuricemicuirine flow rate for all rats. Circles represent individualdata from each animal studied.
the moderate diuresis of Groups II and III independentof the acid or alkaline nature of the urine. The un-treated animals with low V had the most markedrenal damage. When preurate V vs. percent preserva-tion of initial GFRwas plotted for all rats there wasgood correlation between these two parameters (r= 0.7635, P < 0.001) as shown in Fig. 3. The simplestexplanation for the efficacy of high V to prevent urateand uric acid deposition in the kidney takes intoaccount both chemical and mechanical factors. Pre-vious work from our laboratory has confirmed thatthe major tubular site of urate deposition is the collec-ing duct (14). By inference from studies of renaltissue urate content during hyperuricemia, this isalso the nephron segment of highest uric acid con-centration (18, 20). The effect of high V would be tolower the concentration of urate within the collectingduct enhancing its solubility and to rapidly "flush" anyprecipitated urate material from this tubular segment.In support of this explanation is the finding thaturinary urate concentration (Uurate) was inverselyrelated to the V and the percent protection of renalfunction (r = 0.6277, p < 0.001). Although there isevidence that tubular fluid flow rates may have addi-tional effects on urate handling by the kidney at nor-mal plasma levels (21), no such information ispresently available for the hyperuricemic state.
Uosm was high in the Group I animals and lowerin the diuretic-treated and Brattleboro rats suggestinga relationship between prehyperuricemic Uosm andprotection. There was a correlation between pre-hyperuricemia Uosm and percent preservation ofinitial GFR (r = 0.6774, P < 0.001). However, initialUosm was higher in Group IV than Group V (363+47 vs. 228+27 mosmol/liter, P < 0.001) despite simi-lar levels of protection and was not different betweenGroups III and IV (359+25 vs. 363+47 mosmol/liter,P = NS) where impairment of kidney function wasnegligible in the former and nearly 50% in the latter.Moreover, if one compares solute excretion rates
Acute Urate Nephropathy 791
.
*.*
*0
.
(Uosm x V) between Groups IV and V, the value forthe former was more than twice that of the latter(59.3+7.7 vs. 24.3+2.9 mosmol/min) suggesting thaturine flow was a much more critical factor than soluteexcretion rate per se, since protection was similar.
It does not seem likely that the protective effectof the high-dose furosemide was related to a drugeffect blocking tubular secretion rather than promotinga diuresis for two reasons. First, in the control periodthe clearance of urate exceeded that of inulin indicat-ing a net secretion of urate into the tubule and thusactually increasing the tubular load of urate. Secondly,if the protective effect were specifically related to adirect drug effect, then there should not have beenequal preservation of renal function in the Bratflebororats that received no pharmacologic agents to promotediuresis.
Despite alkalinization of the urine to 7.9±0.2 withacetazolamide and NaHCO3 in Group II rats, onlypartial preservation of kidney function was seen.Moreover, it is likely that this level of protection wasdue to the diuretic properties of acetazolamide ratherthan its alkalinizing effect, since identical renal func-tion and morphologic results were seen in the low-dose furosemide group. These latter rats had pre-urate urine flow rates similar to those of acetazola-mide NaHCO3-treated animals but a UpH of only5.8±0.1 which was not different from the untreatedanimals. In light of in vitro studies outlined above,it was surprising that urinary alkalinization wasnot more effective in preventing intrarenal deposits ofurate. Klinenberg et al. (12) measured the solubilityof uric acid in sodium phosphate buffer over an ex-tensive range of pH. At pH 7.9, the mean level ofUpH in Group II animals, uric acid solubility was140 mg/100 ml. This value is more than twice theUurate measured in Group III rats after urate in-fusion. Based on previous studies of fluid pH invarious tubular segments during NaHCO3 loading(22), it is unlikely that pH was lower than that of thefinal urine at any site more proximal in the nephron.Thus, it is also unlikely that UpH was a falselyhigh estimate of hydrogen ion activity in the distalnephron where precipitation occurred. This lack ofrelationship between tubular fluid pH and urate dep-osition suggests that either the urine measurementdid not accurately reflect the concentration of uratein the collecting duct system or that in vitro measure-ments of solubility and precipitation are not entirelyapplicable to urate precipitation phenomena in thetubular fluid environment. The report of Epstein andPigeon (20) would argue against the former possibility.Even though they failed to show a good overallcorrelation between papillary and Uurat at levels ofhyperuricemia comparable to those in the presentstudy, the mean papillary urate at most was only
792 J. D. Conger and S. A. Falk
50% higher than Uurate. Based on these findings, papil-lary urate in the Group II rats still should have beenbelow the in vitro measured solubility for pH 7.9.Thus, it seems likely that within the kidney the rela-tionship between urate deposition and tubular fluidpH is not so critical as in vitro studies would suggest.
The implications of these experiments are thatmaintenance of high distal nephron flow is the majorfactor in preventing acute urate nephropathy andthat urine alkalinization is of minor importance. How-ever, such conclusions should be drawn with con-siderable caution when applied to the clinical setting.There may be important species differences betweenrats and man that are not obviated by simply block-ing uricase activity as was done in this model. More-over, it is possible that pH-related solubility may bea more critical pathogenetic factor at levels of filteredurate and at pH values not examined in this study.For these reasons it would be inappropriate to suggestthat urine alkalinization be abandoned as a thera-peutic modality in hyperuricemic acute renal failure.On the other hand, the data from this investigationdo seem to indicate that tubular fluid flow is themost critical pathogenetic factor in this syndrome andthat the primary method of its prevention is theestablishment of high rates of urine flow.
ACKNOWLEDGMENTSThe authors wish to thank Ms. Susan Christie and Mr.Martin Kondreck for technical assistance, Ms. DottieGoodman and Mrs. Daisy Rodarte for help with manuscriptpreparation, and Dr. Robert Schrier for his critical review ofthe work.
These experiments were supported by the NationalInstitutes of Health (grant HL-18097) and Veterans Ad-ministration Research Funds.
REFERENCES
1. Merrill, D., and H. Jackson, Jr. 1943. The renal complica-tions of leukemia. N. Engl. J. Med. 228: 271-276.
2. Frei, E., III, C. J. Bentzel, R. Rieselbach, and J. B.Block. 1963. Renal complications of neoplastic disease.
J. Chronic Dis. 16: 757-776.3. Kritzler, R. A. 1958. Anuria complicating the treatment
of leukemia. Am. J. Med. 25: 532-538.4. Weintraub, L. R., J. A. Penner, and M. C. Meyers.
1964. Acute uric acid nephropathy in leukemia. Reportof a case treated with peritoneal dialysis. Arch. Intern.Med. 113: 111-114.
5. Handa, S. P. 1971. Acute renal failure in associationwith hyperuricemia: Its recovery with ethacrynic acid.South. Med. J. 64: 676-678.
6. Steinberg, S. M., M. A. Galen, J. M. Lazarus, E. G.Lowrie, C. L. Hampers, and N. Jaffe. 1975. Hemo-dialysis for acute anuric uric acid nephropathy. Am. J.Dis. Child. 129: 956-958.
7. Watts, R. W. E., P. J. Watkins, J. Q. Matthias, and D. A.Gibbs. 1966. Allopurinol and acute uric acid nephrop-athy. Br. Med. J. 1: 205-208.
8. Kjellstrand, C. M., D. C. Campbell, II, B. von Hartitzsch,

and T. J. Buselmeier. 1974. Hyperuricemic acute renalfailure. Arch. Intern. Med. 133: 349-359.
9. Krakoff, I. H. 1966. Use of allopurinol in preventinghyperuricemia in leukemia and lymphoma. Cancer(Phila.). 19: 1489-1496.
10. Peters, J. P., and D. D. Van Slyke. 1946. QuantitativeClinical Chemistry. The Williams & Wilkins Co., Balti-more. 2nd edition. 1041 pp.
11. Talbott, J. H. 1964. Gout. Grune & Stratton, Inc., NewYork, 2nd edition. 261 pp.
12. Klinenberg, J. R., R. Bluestone, L. Schlosstein, J. Wais-man, and M. W. Whitehouse. 1973. Urate depositiondisease. Howis it regulated and how can it be modified?Ann. Intern. Med. 78: 99-111.
13. Rieselbach, R. E., C. J. Bentzel, E. Cotlove, E. Frei,III, and E. J. Freireich. 1964. Uric acid excretion andrenal function in the acute hyperuricemia of leukemia.Pathogenesis and therapy of uric acid nephropathy.Am. J. Med. 37: 872-884.
14. Conger, J. D., S. A. Falk, S. J. Guggenheim, and T. J.Burke. 1976. A micropuncture study of the early phaseof acute urate nephropathy. J. Clin. Invest. 58: 681-689.
15. Bartoli, E., J. D. Conger, and L. E. Earley. 1973. Effect
of intraluminal flow on proximal tuibtular reabsorption.J. Clin. Invest. 52: 843-849.
16. Vurek, G. G., and S. E. Pegram. 1966. Fluorometricmethod for the determination of nanogram quantitiesof inulin. Anal. Biochem. 16: 409-419.
17. Conger, J. D., H. N. Rhoads, S. N. Christie, and T. J.Burke. 1975. A modification of the fluorescence methodfor micro-inulin determinations. Kidney Int. 8: 334-337.
18. Mudge, G. H. 1965. The renal tubular transport of urate.Arthritis Rheum. 8: 686-693.
19. Greger, R., F. Lang, and P. Deetjen. 1971. Handlingof uric acid by the rat kidney. I. Microanalysis of uricacid in proximal tubular fluid. Pfluegers Arch. Euir. J.Physiol. 324: 279-287.
20. Epstein, F. H., and G. Pigeon. 1964. Experimental uratenephropathy: studies of the distribution of urate inrenal tissue. Nephron. 1: 144-157.
21. Weinman, E. J., G. Eknoyan, and W. N. Suki. 1975.The influence of the extracellular fluid volume on thetubular reabsorption of uric acid. J. Clin. Invest. 55:283-291.
22. Malnic, G., M. de Mello Aires, and G. Giebisch. 1972.Micropuncture study of renal tubular hydrogen ion trans-port in the rat. Am. J. Physiol. 222: 147-158.
Acute Urate Nephropathy 793


![ReviewArticle EarlyChildhoodCaries:Epidemiology,Aetiology,andPrevention · 2019. 7. 30. · Enamel is highly mineralized and has extraordinary mechanical properties[44,45,47,50,51].einteriorofatoothconsists](https://img.dokumen.tips/doc/110x75/60cfea67efb18d388957a417/reviewarticle-earlychildhoodcariesepidemiologyaetiologyandprevention-2019-7.jpg)


![Percutaneous Nephrolithotomy Versus Retrograde Intrarenal Surgery… · RIRS was compared with standard PCNL in four studies [15–18], miniperc in four [13,19–21], and microperc](https://img.dokumen.tips/doc/110x75/5b83a76e7f8b9a866e8d7b94/percutaneous-nephrolithotomy-versus-retrograde-intrarenal-rirs-was-compared.jpg)