Embed Size (px)
Citation preview

Intra-molecular Versus Inter-molecular Force

Intramolecular ForcesForces that hold compounds together
Ionic Transfer of electrons between a cation and
anionExample: saltsTypically solids at room temperature
CovalentSharing of electrons to achieve an octetBetween 2 or more nonmetalsCould be solids, liquids, or gases at room
temperature

Intermolecular ForcesThese are weak forces that exist
between moleculesVan der Waals ForcesLondon dispersion Dipole dipoleHydrogen bonding (strongest)
4th intermolecular force is an ion dipole force between an ionic compound and a polar compound (usually water)

States of Matter
Take time and talk with your table about properties and differences between a solid, liquid, and gas that have been discussed before today.

SolidsFixed and rigid arrangement and shape
Not compressible
Does not flow
Vibrational motion
Usually the most dense out of the three phases
Definite shape and volume
“High” intermolecular forces

LiquidsSlightly compressible
Takes the shape of the container
Intermolecular forces exist
More space between molecules
More motion
Takes the shape of the container with definite volume
Properties such as surface tension, viscosity, and adhesion/cohesion forces

Properties of water
https://www.youtube.com/watch?v=iOOvX0jmhJ4

Gases
No definite shape or volume
Highly compressible
Little to no IMF (follow the KMT)
High motion

States of Matter and IMF
The strength of the IMF will decide the state of matter of the substance.
For example, a large polar molecule sucrose C6H12O6 is a solid at room temperature while O2 is non-polar and a gas at room temperature

IMF and Properties
The higher the IMF, the higher theBoiling pointViscositySurface tensionCapillary actionhttps://www.youtube.com/watch?v=B
qQJPCdmIp8
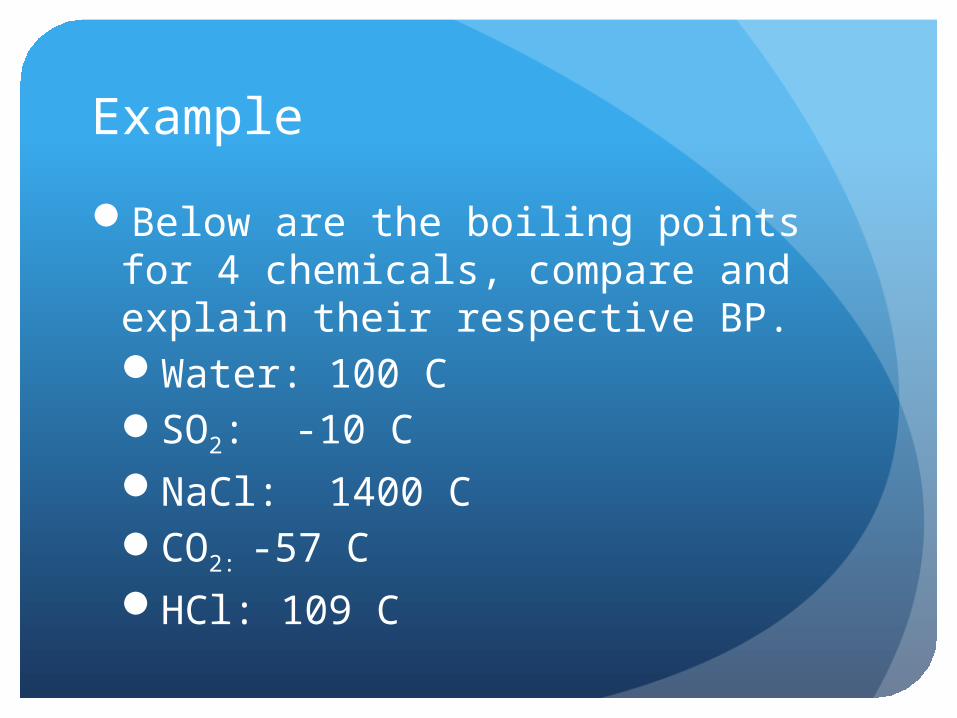
Example
Below are the boiling points for 4 chemicals, compare and explain their respective BP.Water: 100 CSO2: -10 CNaCl: 1400 CCO2: -57 CHCl: 109 C

Classify phase changes as Exothermic or Endothermic

Heating Curves• Plot of temperature change versus heat
added is a heating curve.• During a phase change, adding heat
causes no temperature change.– These points are used to calculate Hfus and Hvap.
• Supercooling: When a liquid is cooled below its melting point and it still remains a liquid.
• Achieved by keeping the temperature low and increasing kinetic energy to break intermolecular forces.

Heat Curves

Vapor Pressure
Explaining Vapor Pressure on the Molecular Level
• Some of the molecules on the surface of a liquid have enough energy to escape the attraction of the bulk liquid.
• These molecules move into the gas phase.• As the number of molecules in the gas
phase increases, some of the gas phase molecules strike the surface and return to the liquid.
• After some time the pressure of the gas will be constant at the vapor pressure.
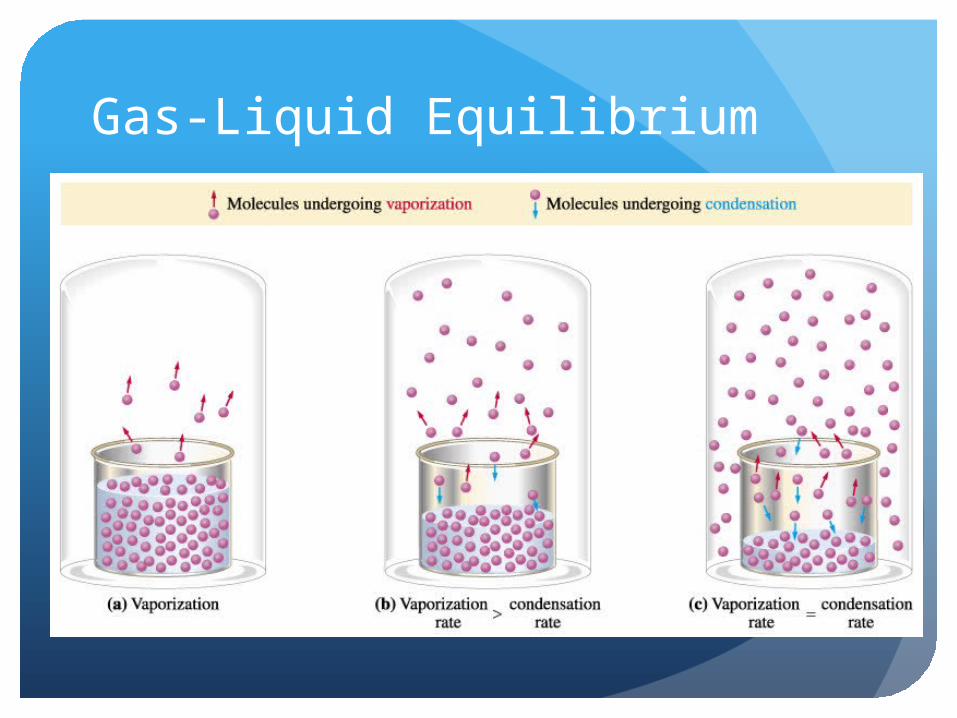
Gas-Liquid Equilibrium

Vapor Pressure
Volatility, Vapor Pressure, and Temperature
• If equilibrium is never established then the liquid evaporates.
• Volatile substances evaporate rapidly.• The higher the temperature, the higher
the average kinetic energy, the faster the liquid evaporates.

Vapor Pressure Graphs

Vapor Pressure and Boiling Point• Liquids boil when the external
pressure equals the vapor pressure.• Temperature of boiling point
increases as pressure increases.• Two ways to get a liquid to boil:
increase temperature or decrease pressure.
• Normal boiling point is the boiling point at 760 mmHg (1 atm).

How does a Pressure Cooker work?

Phase Diagrams• Phase diagram: plot of pressure vs.
Temperature summarizing all equilibria between phases.
• Given a temperature and pressure, phase diagrams tell us which phase will exist.

• Features of a phase diagram:– Triple point: temperature and pressure at
which all three phases are in equilibrium. – Vapor-pressure curve: generally as
pressure increases, temperature increases.
– Critical point: critical temperature and pressure for the gas.
– Melting point curve: as pressure increases, the solid phase is favored if the solid is more dense than the liquid.
– Normal melting point: melting point at 1 atm.

Phase Diagrams