Embed Size (px)
Citation preview

www.ceep.cas.cn
BingYue Liu
Department of Statistics and FinanceUniversity of Science and Technology of China
June 18-21, Singapore
Interval Tests for Structural Breaks in the Dependence:
Empirical Evidence of Oil and Gold Markets
40th IAEE International Conference

www.ceep.cas.cn
Interval Tests for Structural Breaks
Introduction
Crude Oil
•Important commodity
•Large trading volume
•Low price
Gold•Important precious metal
•Hedge heaven
Co-movement•Positive
•Dynamic
Guidance•Investment portfolio
•Risk management
2

www.ceep.cas.cn
Literature
Baffes (2007), Hammoudeh and Yuan (2008), Soytas et al.
(2009), Sari et al. (2010), Narayan et al. (2010), Zhang and Wei
(2010), Reboredo (2013)•Method
Static relationship
Linear relationship
•Conclusion
Short-term or long-term relationship
Causal relationship
But•Market volatility
•Market mechanism change under extreme market shock
Structural (Large) change in dependence
3
Interval Tests for Structural Breaks

www.ceep.cas.cn
Contribution
Apply TVCopula to analyze dependence of oil & gold•Nonlinear
•Dynamic
•Small change in dependence
Change point test to analyze dependence of oil & gold•Large change in dependence
•But
Extreme shocks last not long
Hardly capture the dependent features in extreme risk period
Propose change interval test•Capture the dependent features in an extreme period
•Test the effect of extreme shocks on the co-movement across markets
•Empirical evidence of crude oil and gold markets
4
Interval Tests for Structural Breaks

www.ceep.cas.cn 5
Interval Tests for Structural Breaks
0 t1 t2 t3 t4 t5 T
Dependent
Rela
tionship
Comparision between Change Point and Change Interval

www.ceep.cas.cn 6
Interval Tests for Structural Breaks

www.ceep.cas.cn 7
Interval Tests for Structural Breaks
, , 1
1
ˆ arg max log | ;i
T
i i t i t t i
t
f x
F , 1, 2i , and then 1, 2, 1
1
ˆ ˆ ˆarg max log , | ;T
t t t t
t
c u u
F
1 2ˆ ˆ ˆ ˆ, ,IFM
1
0 0ˆ 0,IFMT N G
www.ceep.cas.cn
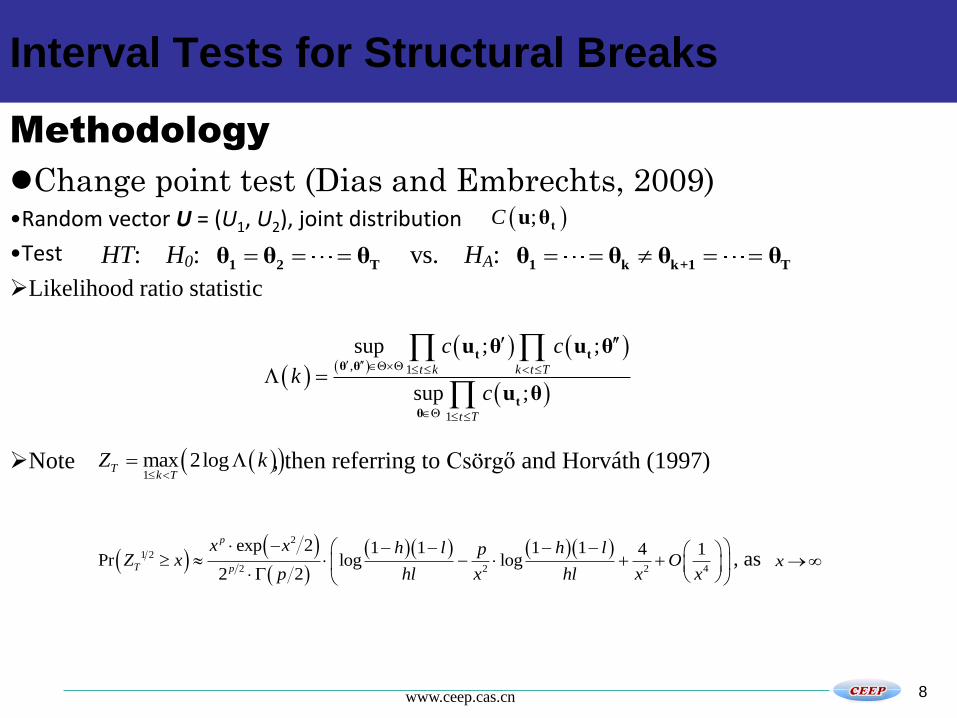
Methodology
Change point test (Dias and Embrechts, 2009)•Random vector U = (U1, U2), joint distribution
•Test
Likelihood ratio statistic
Note , then referring to Csörgő and Horváth (1997)
8
Interval Tests for Structural Breaks
;Ct
u θ
HT: H0: 1 2 Tθ θ θ vs. HA:
1 k k+1 Tθ θ θ θ
, 1
1
sup ; ;
sup ;
t k k t T
t T
c c
kc
t tθ θ
tθ
u θ u θ
u θ
1max 2logT
k TZ k
2
1 2
2 2 2 4
exp 2 1 1 1 1 4 1Pr log log
2 2
p
T p
x x h l h lpZ x O
p hl x hl x x
, as x

www.ceep.cas.cn
Methodology
Change interval test•Define parameter space
•Construct hypothesis test
9
Interval Tests for Structural Breaks
1 1 2 21 1, , : , ,
1 T 1 k k k k Tθ θ θ θ θ θ θ θQ ,
11
0 , , : 1 T 1 2 Tθ θ θ θ θQ ,
1 1
12
0 1, , : , 1 T 1 k k Tθ θ θ θ θ θQ ,
2 2
13
0 1, , : , 1 T 1 k k Tθ θ θ θ θ θQ .
HT11: H0: 11
0, , 1 Tθ θ Q vs. HA: 11
0, , 1 Tθ θ Q Q ,
HT12: H0: 12
0, , 1 Tθ θ Q vs. HA: 12
0, , 1 Tθ θ Q Q ,
HT13: H0: 13
0, , 1 Tθ θ Q vs. HA: 13
0, , 1 Tθ θ Q Q .
Null hypothesis
HT11: No change point
HT12: No change point or
only one change point in k1
HT13: No change point or
only one change point in k2

www.ceep.cas.cn 10
Interval Tests for Structural Breaks

www.ceep.cas.cn
Empirical Analysis
11
Interval Tests for Structural Breaks
Estimates for marginal distribution models
Oil
Model: t tr a , t t ta , 2 2 2
1 1 1t t t tI a , 0,1t t
1.07e-04 0.008* a 0.012** 0.961*** 0.050*** 8.465***
Gold
Model: t tr a , t t ta , 2 2 2
1 1t t ta , 0,1t t
0.049** 0.013*** 0.038*** 0.954*** 5.247***
Note: a *, **, *** denote the significant levels of 10%, 5% and 1%, respectively.
Oil & Gold: volatility clustering
Oil: volatility asymmetry
Oil & Gold: innovation symmetric fat-tailed distribution

www.ceep.cas.cn
Empirical Analysis
12
Interval Tests for Structural Breaks
Change point test over the whole sample period
Period n T 1 2
Tz 1 2 1 2
T TP Z z H0 (0.95) Time of Change
Normal
1/4/2006–4/29/2016 1 2546 5.542 4.40e-06 R. a 10/9/2013
1/4/2006–10/9/2013 1 1913 1.851 1 -- --
10/10/2013–4/29/2016 1 633 2.765 0.165 -- --
t
1/4/2006–4/29/2016 2 2546 5.720 1.16e-05 R. 10/9/2013
1/4/2006–10/9/2013 2 1913 2.758 0.608 -- --
10/10/2013–4/29/2016 2 633 2.739 0.516 -- --
Clayton
1/4/2006–4/29/2016 1 2546 4.749 2.22e-04 R. 11/7/2013
1/4/2006–11/7/2013 1 1934 2.347 0.484 -- --
11/8/2013–4/29/2016 1 612 2.183 0.525 -- --
Note: a R. denotes the null hypothesis is rejected at the 5% level.
Change point test can only check out one change point over the whole sample period.

www.ceep.cas.cn
Empirical Analysis
13
Interval Tests for Structural Breaks
Change interval test for financial crisis over the whole sample period
Copula n
Initial Period: 7/1/2008–6/30/2009
Period of Change Change Interval Test Statistics
1k 2k HT11 HT12 HT13
Normal 1 9/10/2008 4/23/2009 13.677** a 6.828** 13.140**
t 2 9/9/2008 4/23/2009 14.440** 6.046* 13.012**
Clayton 1 9/9/2008 6/11/2009 9.570** 6.872** 9.567**
All Copula -- 9/9/2008 4/23/2009 -- -- --
Note: a *, ** denote the significant levels of 5% and 1%, respectively.
Change interval period: 9/9/2008-4/23/2009

www.ceep.cas.cn
Empirical Analysis
14
Interval Tests for Structural Breaks
Change point test for pre-crisis period
Period n T 1 2
Tz 1 2 1 2
T TP Z z H0 (0.95) Time of Change
Pre-crisis Period: 1/4/2006–9/9/2008
Normal
1/4/2006–9/9/2008 1 666 2.637 0.223 -- --
t
1/4/2006–9/9/2008 2 666 2.602 0.660 -- --
Clayton
1/4/2006–9/9/2008 1 666 2.275 0.457 -- --
Note: a R. denotes the null hypothesis is rejected at the 5% level.
No change point in the pre-crisis period.

www.ceep.cas.cn 15
Change point test for post-crisis period
Period n T 1 2
Tz 1 2 1 2
T TP Z z H0 (0.95) Time of Change
Post-crisis Period: 4/24/2009–4/29/2016
Normal
4/24/2009–4/29/2016 1 1728 7.030 4.56e-10 R. a 4/27/2010
4/24/2009–4/27/2010 1 248 2.371 0.311 -- --
4/28/2010–4/29/2016 1 1480 4.007 0.004 R. 10/9/2013
4/28/2010–10/9/2013 1 847 3.434 0.028 R. 9/19/2011
10/10/2013–4/29/2016 1 633 2.765 0.165 -- --
4/28/2010–9/19/2011 1 343 2.542 0.238 -- --
9/20/2011–10/9/2013 1 504 2.344 0.382 -- --
t
4/24/2009–4/29/2016 2 1728 6.739 2.67e-08 R. 4/27/2010
4/24/2009–4/27/2010 2 248 2.328 0.793 -- --
4/28/2010–4/29/2016 2 1480 4.488 0.003 R. 10/9/2013
4/28/2010–10/9/2013 2 847 3.455 0.103 -- --
10/10/2013–4/29/2016 2 633 2.739 0.516 -- --
Clayton
4/24/2009–4/29/2016 1 1728 5.707 1.68e-06 R. 5/5/2010
4/24/2009–5/5/2010 1 253 1.671 0.854 -- --
5/6/2010–4/29/2016 1 1475 3.869 0.007 R. 11/7/2013
5/6/2010–11/7/2013 1 863 2.205 0.539 -- --
11/8/2013–4/29/2016 1 612 2.183 0.525 -- --
Note: a R. denotes the null hypothesis is rejected at the 5% level.

www.ceep.cas.cn 16
Interval Tests for Structural Breaks
Test for the structural change between pre-crisis and post-crisis
Sample Period Financial Crisis Period
1/4/2006–4/27/2010 9/10/2008–4/23/2009
n Change Interval Test Hypothesis Test T2
HT11 HT12 HT13 HT2 P-value
Normal 1 45.595** 45.303** 12.828** 23.510** 1.24e-06
t 2 43.889** 39.115** 13.012** 22.984** 1.02e-05
Clayton 1 36.274** 35.918** 12.119** 17.333** 3.14e-05
Note: a ** denotes the significant levels of 1%.

www.ceep.cas.cn
Empirical Analysis
17
Interval Tests for Structural Breaks
06 07 08 09 10 11 12 13 14 15 16-0.2
-0.1
0
0.1
0.2
0.3
0.4
0.5
0.6
0.7
Dependent
Rela
tionship
Dynamic Changes in Dependence between Oil and Gold
time-varying
constant
• Change interval9/10/2008-4/23/2009
• Change point 4/27/2010
10/9/2013
• Various period Market boom
Financial crisis
Rapid recovery
Market reform

www.ceep.cas.cn
Conclusion
Theory study•Propose a new change interval test
Empirical study•Commodity properties are larger in economic boom period, and financial properties are larger in extreme risk period
•Exogenous economic shocks and the changes of internal mechanism may lead to structural changes
Other Application•Risk management
•Financial contagion
18
Interval Tests for Structural Breaks

www.ceep.cas.cn
BingYue Liu
Department of Statistics and FinanceUniversity of Science and Technology of ChinaEmail: [email protected]
Thank you for your attention.
Questions and comments are welcome.


![Solutions to deferred material Text and Tests 5 · The 95% confidence interval [CI] for is 2. The 95% confidence interval [CI] for is 3. ... n = 2176.91 people would be needed as](https://img.dokumen.tips/doc/110x75/5c37792209d3f2a60b8bc741/solutions-to-deferred-material-text-and-tests-5-the-95-confidence-interval.jpg)