Embed Size (px)
Citation preview

Bui/dins: Serv. Eng . Res . T~chnol. 9(1 ) 29-34 (1988) Printed in Great Britain
Technical Note
Summary Condensation is now one of the greatest building prl)blems of this decade. and it is csscnrjal that the mistakes of the past arc not repeated in the future. Accurate predictive cechniqucs for incerstitinl condensation are now being used widely, but cakulatioos arc only as accurace as the input vapour permeabiliry daca. Although a considcrabh: quantity of data arc available, much of these arc shown to be of limited i;se, only applying co tbe conditions under whic:h the material was originally tested. The vapour permcabiliry of plasterboard and plywood is lnvestigau:d and a new approach co the presentation of vapour pcrmeabiliry data is suggested.
Interstitial condensation: Applicability of conventional vapour permeability values
R C McLEAN BSc MCIBSE MASHRAE and G H GALBRAITH MSc CEng MCIBSE Division of Thermodynamics and Fluid Mechanics, University of Strathclyde, James Weir Building, 75 Moouose Street, Glasgow Gl lXJ, UK
Received 29 January 1987, in final form 8 July 1987
1 Introduction
The use of calculation techniques in the assessment of interstitial condensation risk is a familiar part of the building design process, and one which has become increasingly important in recent years with the introduction of modern methods of building. The conventional approach to the problem is that given in BS 52500l but attention has also turned to more sophisticated alternatives, such as those by Glasd2l and Keipd3l . Much commercially available computer software has been developed on the basis of these methods and is in widespread use. However, in this era of reliance on computer-aided design it must not be overlooked that the success of such predictive techniques is governed by the accuracy with which the vapour transmission characteristics of building materials are known to the designer. In fact , although much information on vapour permeability values is available, this can be confusing or even misleading in certain respects and its valid.icy for use as a database must be reconsidered.
2 Vapour permeability and related terms
Water vapour transport through a plane element of building material (Figure 1) is represented by a form of Fick's law:
dp m = -µ.
dx (1)
where m is the rate of transmission in the x direction per unit area (kg m- 2 s- 1), dp/dx is the gradient of vapour pressure (Nm- 2 m- 1 or Pam- 1) and ,u is the vapour permeability (kgmN- 1 s- 1).
The similarity of equation 1 to Fourier's law of conduction is clear; the coefficient ,u is analogous to thermal conductivity. Equation 1 is normally integrated(~> on the assumption that, like thermal conductivity , permeability is a fixed property of the material, independent of vapour pressure:
~t( P1 - P 2) m= L (2)
Equation 2 is the form most commonly applied in calcu-
. L
P,
Figure 1 Terms for analysis of m water vapour transport
lationsC5,6l , and the coefficient of permeability can be formally defined as the mass flow rate of vapour through a material of unit thickness and unit cross-sectional area when unit pressure difference exists between the two sides.
Besides permeability, several other terms are used to describe the moisture transmission performance of materials. These are defined below and expressed in SI units.
The vapour resistivity r v (N s kg- 1 m - 1) is the reciprocal of µ..
The permeance, P (kg N- 1 s- 1) is defined as the quantity of vapour flowing through unit area of a specific thickness of material in unit time when the pressure difference across the slab is unity. Thus:
Permeance is used when it is inconvenient or unnecessary to specify ,u and L separately, for instance when considering vapour barriers or non-homogeneous materials.
The vapour resistance Rv (Ns kg-t) is the reciprocal of P.
The diffusion resistance factor expresses the permeability of a
© 1988 The Chartered Institution of Building Services Engineers 29
-~----- .. . -·

R C McLean and G H Galbraith
Table l Common units of permeance and permeabiliry with conversion factors to SI
Quantity Origin of unit
SI British American Oth~r
Permeability Perm-m Perm-m Metric Perm-m lb ft h- 1 lbforce - 1
x 8.62 x 10- 6 (grains in ft -z h - 1 in Hg · 1) x 1.459 x 10- 12
(ng s · 1m ·1Pa·1) x 10- 12
(g 24 h - I m I mmHg- 1)
X 8.73J X 10 II
Permeance Perm Metric Perm lb h- 1 lbforce- 1
x Z.826 x 10- 5 (grains ft - 2 h- 1 inHg - 1)
x 5.745 x 10- 11
Perm (ngs - 1 m · 2 pa 1)
x 10- 12
(g 24 h- 1 m · 1 mmHg- 3)
x 8.731 x 10- 11
material in relation to the permeability of air:
Permeability of air ORF = b'li f . 1 Permea i ty o matena
where the permeability of air lS taken as 19.2 x 10- 11 kg m N- 1s- 1•
\
An aspect of the study of vapour flow through materials which is often confusing is the variety of unit systems employed in the specification of the above terms. Table 1 summarises the most commonly used units for permeability and permeance and gives conversion factors to SI units.
3 Permeability test techniques
The permeability of a material is determined by measuring the vapour flow rate through a sample across which a vapour pressure difference is maintained. Most authorities recommend a standard test technique which involves sealing the sample to be tested into the mouth of an impermeable 'dish' or 'cup' containing a vapour pressure regulator. The vapour pressure regulator generates a constant vapour pressure at the inside surface of the sample; it may be water (wet cup), desiccant (dry cup), or a salt solution. The cup is positioned in an environmental chamber with the outside of the sample exposed to a controlled atmosphere (Figure 2).
-t
i P1T
Vapour flow Air
Snn,,l•-1 s.n~~-[ E\ectraix: conditioning ... control - p\ani
Vapour _ . system pressure regulator
Balance
ENVIROMENTAL CHAMBER
-
t i
--Figure 2 Configurarion of t~sr apparatus
30
With this arrangement a constant vapour pressure difference is maintained across the material, and the vapour fl.ow rate can be calculated from the steady decrease (or increase) in cup weight. T he permeabilityµ is then found by application of equation 2.
Although the above approach , is almost universally employed, there are differences between the cup designs, the vapour pressure regulators used, and the chamber conditions recommended by different countries. The standards for vapour flow testing adopted by Britain, France and Germany are outlined in Table 2.
4 Applicability of design data
The standard procedures listed in Table 2 yield one, or at most two, values of permeability related to fi.."'i:ed conditions of humidity. A question naturally arises as to the valid.icy of defining material behaviour in this way. The answer of course lies in the nature of the variation of vapour permeability with vapour pressure for building materials. If this variation is small for a material then a single-value specification of permeability would be reasonably acceptable. However, if a material shows a large variation in permeability with vapour pressure, then values obtained from standard tests will be unique to the conditions of the test and will be of questionable accuracy at other conditions.
This aspect of the vapour transmission problem can be examined by considering two common components of modern building structures-plywood and plasterboard. A general indication of the two behaviour patterns can be obtained from Table 3, which is a summary of information available from some well-known sources, which might be expected to form the database for calculations. The highest quoted value for plywood is some forty times the smallest, whereas for plasterboard the corresponding factor is about 1. 7. What is also apparent from Table 3 is the absence of any specified test conditions and the resulting difficulty which a designer would face in placing any confidence in such information.
5 Differential and average permeabilities
If a given material does not sorb water co any great extent, there is no apparent reason to expect any substantial variation in the permeability of the material wi th changing conditions, as the transfer is predominantly one of pure gaseous diffusion . However , many building materials are highly hygroscopic and the transmission of moisture through them is a highly complex process involving various transport mechanisms(! 1 >. T he coefficient in equation 1, which must incorporate all the relevan t effec ts, is consequently unlikely
Building Services Engineering Research and Technology

Table 2 Comparison of several test standards
Nationality and name of standard
Test cup conditions
Test chamber conditions
Test cup design
Presentation of results
British 854370 Part 2 (1973)
Dry cup, 0% RH
using dessicant
(a) 38 :t 0.5°C 88 :t 2% RH
(b) 25 :t 0.5°C 75 :t 2% RH
Beaker, 250 cm3
<fl== 65 mm
Permeability in units µgN- 1 h- 1, with test\ conditions specified
French T56-131 (1 982)
Dry cup , 0% RH using dessicant
38 :t 0.5°C 88.5 :t 2% RH
Beaker, 250 cm3
qi== 65 mm
Index of permeability 1CPVE(38) in ,ugm- 2 s- 1•
NB No pressure term in this unit. Test conditions must be specified.
to be a constant and in practice may vary significantly along the flow path through the material in question. µ can therefore only be regarded as a 'spot' or 'differential' permeability02l .
One-dimensional steady-state vapour transmission through a plane slab of thickness L is represented in Figure 3. Analysis is simplified considerably if the isothermal condition is considered. Permeability can then be expressed as a function either of vapour pressure or relative humidity for any particular temperature.
Applying the differential equation (1) to an infinitesimal element of slab:
m dx = ·-µ dp (3)
Integrating from x = 0 to x = L:
mL = -r2 µdp Pt
Table 3 Quoted permeability values for plywood and plasterboard
Source of Quoted permeability information (kgm N - 1 s- 1 x 10¹²)
Plywood Plasterboard
Szokolay'7' 2.0-7 .0 20.0-28 .6
ASHRAErs> 0.7 27 .2
CIBSE<•1 0.3-1.0 17.0-29 .0 2.0
BRE(" 0.17-0.67 16.6-22.2
BurberryC91
Prangnen< 10'
0.17-0 .67 16.6-23.0 2.0-7 .0
Vol. 9 No. 1 (1988)
·------
Test conditions
Not stated
Unclear-stated only as neither wet cup nor dry cup
Not stated
Not stated
Not srated
German DIN52515 (1973)
(a) Dry cup, 0-3 :t 2% RH using dessicam
(b) Wet cup, 90-95 :t 2% RH
saturated NH.H 2P04 giving 93% RH
23 :t 0.5°C 47-53 :t 2% RH
Circular cup; four examples of design suggested
Diffusion resistance number; equivalent thickness of air to give same resistance divided by sample thickness
Interstitial candensation
and dividing both sides by the overall vapour pressure difference:
mL f Pz
~ µdp Pt (4) --- =----
P1 - Pi P1 - Pi
This leads to the definition of the average permeability µ over the range p1, Piyii
f Pz
µ = µ dpl(p1 - P2) Pt
which allows the rate of vapour flow to be expressed as:
iJ.(p1 - Pi) m=
L
(5)
(6)
From the form of equation 6, which is identical to that of equation 2, it is apparent that one of the central aspects in the study of moisture transmission is the prediction of numerical values of µ for any given set of boundary conditions. This requires the specification of the function µ(p) over the whole humidity range, which can be facilitated by the construction of a curve of differential permeability.
µ,
J.t.z _____....
E
l - -Figure 3 Vapour flow through a homogeneous plane sample
31

R C McLean and G H Galbraith
= ..0
2 E ,_
"' a.
.Q +' c "' ,_
"' ; 0
82} area 1
~area Z
RH 2
Relative Humidity(%)
Figure 4 Relacion between average and differential permeability .. u1 = Area lf(RH 2 - RH 1) ; .iJ.2 = (Area 1 + Area 2)/(RH, - RH 1) ; ii3 = (.iiz(RH 3 -
RH1) - ii1(RH2 - RH1)]/ (RH3 - RH1) =Area Z/(RH1 - RHz).
The differential permeability ,u cannot be measured directly, but it is possible to construct a curve from values of average permeability taken from a series of cup tests on a given material. These tests would involve using a variety of vapour pressure regulators and/or chamber conditions. From equation 5 it is seen that for each test the differential permeability curve must satisfy the condition that the area under the curve between the limits of vapour pressure (or relative humidity) should equal the area under the average permeability line, as determined from the test, between the same limits. This relation between ,u and ,u over a given range is illustrated in Figure 4. Note that the average permeabilities .u1 and iii will not generally be equal to the differential permeabilities at the mean pressures (p 1 + p2)/2 and (pz + p3)/2.
Having constructed a differential permeability curve it is then possible, by reversing the procedure, to evaluate the average permeability ii for any required limits of humidity, for isothermal conditions at the temperature for which the test data were obtained.
6 Tests of permeability of plywood and plasterboard
The information reported in the following paragraphs forms part of a research programme at the University of Strathclyde. The plywood tested was a S-ply, 12 mm thick Brazilian exterior quality plywood; the plasterboard was 9 mm thick 'Gyproc' gypsum.
Various recommendations on possible test cup arrangements are given in the publications listed in Table 2. For this work the cups used were the 250 cm 3 laboratory beakers suggested by the French and British standards. The samples were cut to fir tightly into the necks of the beakers and then sealed in position with plasticised petroleum wax in conjunction with a metal template (Figure 5).
From preliminary investigations it was concluded that an accurate differential permeability curve could be specified uniquely from five appropriately selected test results. To provide this information a test sequence was undertaken which involved four different internal pressure regulators
32
--\ _____ __.O _____ ~j-- Templateo
.,1,... ---------; ,
lllllllllf--P~roleum wax sealment
-.. r----.. Specimen shaped to fit tightly into beaker
Desiccant water or salt solution
Figure 5 British and French standard cup arrangement
Table 4 Internal vapour pressure regulators
Vapour pressure regulator; Cup RH(%)
Water (H 20) 100 Zinc sulphate (ZnSO ~) 90 Potassium nitrice (KN0 2) 45 Calcium chloride (CaCl1)
(desiccant) 0
and two chamber conditions. The regulators used are detailed in Table 4 and a summary of the test conditions is given in Table 5. For each test condition five nominally identical cups were used, and after an equilibrium had been attained the average permeability was determined from the steady-state rate of mass change.
As one of the most important applications of permeability values is the determination of building performance in winter, the test temperature of20°C may seem unreasonably high. However, tentative results obtained from several lowtemperature tests tend to suggest that there is no great variation with temperature of the vapour transmission characteristics of plywood and plasterboard. Testing is also inconvenient below 20°C, the main disadvantage being that long test periods are required before the samples reach equilibrium. Wax sealants may become less flexible and unable co accommodate sample movement.
7 Results
The values of ii for each test, taken as the mean of the five individual cup results, are given in Table 6, together with the corresponding standard deviations.
7.1 Plywood
The average permeability values were first modified to correspond to the consecutive humidity intervals 0-45, 45-60,
Table 5 Test conditions ut 20°C
Chamber RH (%)
60 80
Cup RH (%)
0, 45' 90, 100 100
Building Services Engineering Research and Technology
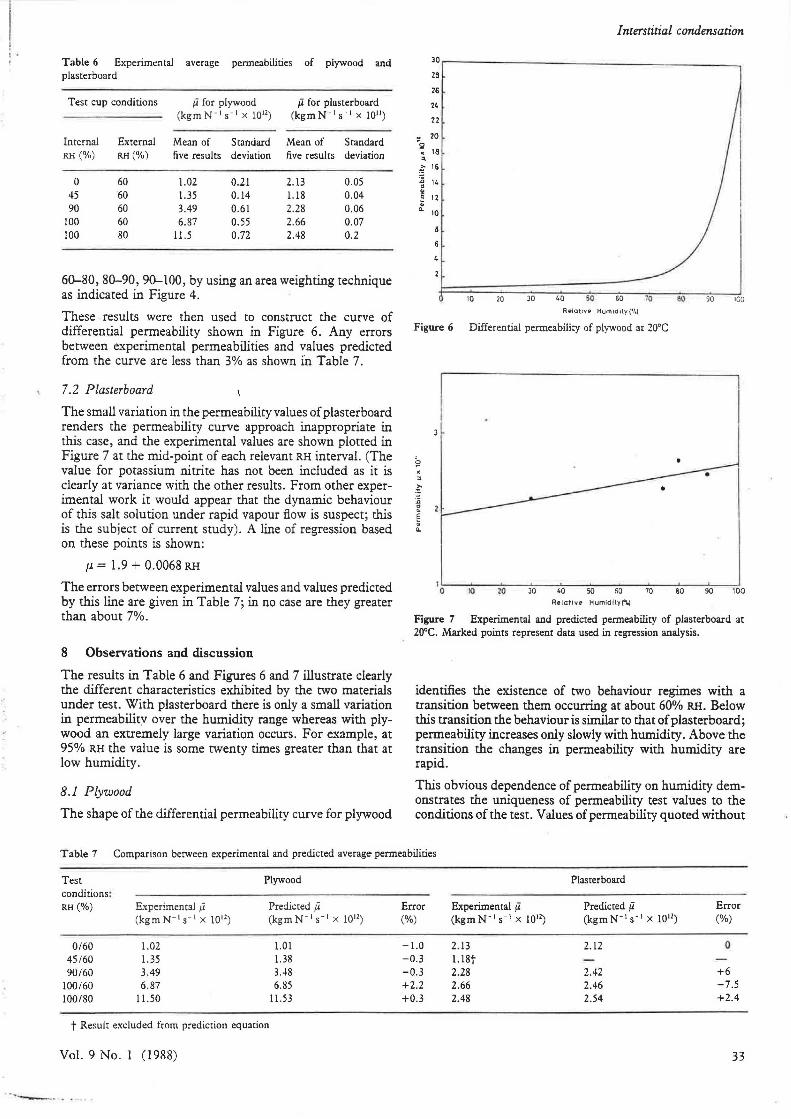
I • Table 6 Experim~n ta! average permeabilities of plywood and plasterboard
Test cup conditions Ji for plywood Ji for plasterboard (kgm N- 1 s- 1 x 10¹²) (kgm N- 1 s · 1 x 1011 )
Internal External Mean of Standard Mean of Standard RH(%) RH(%) five results deviation five results deviation
0 60 1.02 0.21 2.13 0.05 45 60 l.35 0.14 1.18 0.04 90 60 3.49 0.61 2.28 0.06
100 60 6.87 0.55 2.66 0.07 100 80 11.5 0.72 2.48 0.2
60-80, 80-90, 90-100, by using an area weighting technique as indicated in Figure 4.
These results were then used to construct the curve of differential permeability shown in Figure 6. Any errors between experimental permeabilities and values predicted from the curve are less than 3% as shown in Table 7.
7.2 Plasterboard
The small variation in the permeability values of plasterboard renders the permeability curve approach inappropriate in this case, and the experimental values are shown plotted in Figure 7 at the mid-point of each relevant RH interval. (The value for potassium nitrite has not been included as it is clearly at variance with the other results. From other experimental work it would appear that the dynamic behaviour of this salt solution under rapid vapour flow is suspect; this is the subject of current study). A line of regression based on these points is shown:
,u = 1.9 + 0.0068 RH
The errors between experimental values and values predicted by this line are given in Table 7; in no case are they greater than about 7%.
8 Observations and discussion
The results in Table 6 and Figures 6 and 7 illustrate clearly the different characteristics exhibited by the two materials under test. With plasterboard there is only a small variation in permeabilitv over the humidity range whereas with plywood an extremely large variation occurs. For example, at 95% RH the value is some twenty times greater than that at low humidity.
8.1 Plywood
The shape of the differential permeability curve for plywood
Interstitial condensation
JO r-~~~~~~~~~~~~~~~~~~~---.
-0
ze Z6
24
22
20
; 18
" £ 16
:g 14
~ 12 <; !l. 10
4
10 10 JO 40 so 60 70
Relat1""' Hum1d1ly('l•I
Figure 6 Differential permeability of plywood at 20°C
Si . " ;;- •
:;; a ~
~ !l.
Re lati11e Humidity{'\!
90 100
Figure 7 Experimental and predicted permeability of plasterboard at 20°C. Marked points represent data used in regression analysis.
identifies the existence of two behaviour regimes with a transition between them occurring at about 60% RH. Below this transition the behaviour is similar to that of plasterboard; permeability increases only slowly with humidity. Above the transition the changes in permeability with humidity are rapid.
This obvious dependence of permeability on humidity demonstrates the uniqueness of permeability test values to the conditions of the test. Values of permeability quoted without
Table 7 Comparison between experimental and predicted average permeabilities
Test Plywood Plasterboard conditions: RH(%) Experimental Ji Predicted ,ii Error Experimental ii Predicted Ji Error
(kgm N- 1 s- 1 x 10 12) (kgm N- 1 s- 1 x 10¹²) (%) (kgm N- 1 s- 1 x 10¹²) (kgm N- 1 s- 1 x 10¹²) (%)
0160 1.02 1.01 -1.0 2.13 2.12 0 45160 1.35 1.38 -0.3 l.18t 90160 3.49 HS -0.3 2.28 2.42 +6
100160 6.87 6.85 +2.2 2.66 2.46 -7.5 100180 11.50 I 1.53 +0.3 2.48 2.54 +2.4
t Result excluded from prediction equation
Vol. 9 No . I (1988) 33
· -...~ .... ..

RC McLean and G H Galbraith
Table 8
Nationality Regime RH(%) of standard
British Dry cup 7S 88
French Dry cup 88.S
German Dry cup so Wet cup so
Permeability (kgm N- 1 s- 1)
1.25 x 10⁻¹²
1.1 x 10- 12
1.1 x 10- 12
o.94 x 10- 12
3.5 x 10- 12
reference to test conditions, as shown in Table 3, are therefore of little value to a designer. However, even when test conditions are specified, the permeability values quoted may still bear little relation to the permeability associated with the conditions under which the material might be expected to operate in practice. For example, an internal relative humdity of 75% may not be unrealistic for a building likely to suffer condensation, and external conditions approaching 100% RH are common during ilie winter months. In this situation, for a range of 75-100% RH, the permeability for plywood predicted from the curve is about 10 x 10- 12 kgmN- 1 s-i.
This can be compared with the values corresponding to the humidity test conditions given in Table 2 (Table 8):
From Table 8 ir is clear that the average permeabilities for internal and external relative humidities of 75% and 100% respectively are substantially greater than the results obtained from standard test conditions, and are also greater than the greatest value quoted in Table 3.
8.2 Plasterboard
Although a regression line was drawn on the basis of the plasterboard results, it is clear that the vapour permeability of plasterboard would be specified adequately by a single test value, preferably one corresponding to the upper end of the humidity range.
9 Conclusion
For a building material of low hygroscopy such as plasterboard, the permeability does not depend to any great extent on the prevailing humidity conditions, and a constant value may be assumed in calculations with little error.
However, where the permeability of a material varies over a wide range, as is the case with plywood, large errors will be
34
incurred in calculations if this variation is not taken account of, however sophisticated the computation. Designers must
· therefore have access to accurate values of permeability which are appropriate for the conditions to which the material may be exposed. The currently available information on permeability, although voluminous, is often deficient in two ways:
(a) The conditions of test are often not quoted, thus rendering the values virtually unusable.
(b) Even where test conditions are quoted, many of the recommended test conditions are not realistic.
These conclusions clearly indicate that a reappraisal of existing vapour permeability values is needed. At Strathclyde University the behaviour of other building materials is being investigated, and it is hoped that this will lead to a more realistic approach to the specification of vapour transmission data.
Acknowledgement
The work being undertaken at the University of Strathclyde is funded by the Building Research Establishment Scottish Laboratory and is part of their programme of research on condensation in buildings.
References
BS5250:1975 Code of basic data for the design of buildings: the conxrol of condensation in dwellings (London: British Srandards Institution) (197S)
2 Silcock G W H and Shields T J Predicting condensation: an alternative approach Energy in Buildings 11-15 (Jan-Feb 1985)
3 Kieper G, Caemmerer Wand Wagner A A new diagram for technical assessment of moisture protection of building constructions Gesundheits-lngenieur 95(8) 214-219 (1974)
4 Billington N S Building Physics: Heat (Oxford: Pergamon) (1967) 5 American Society of Heating, Refrigerating and Air-Conditioning
Engineers Fundamentals Handbook (1985) 6 Chartered Institution of Building Services Engineers CIBS Guide
Section AlO (1971) 7 Szokolay S V Condensation and moisture movement: metric quanti
ties Architect J. S23-52S (1979) 8 Building Research Establishment Digest 110 (1972) 9 Burberry P Condensation Architect J. 723-739 (1979)
10 Prangnell R D The water resisitivity of building materials Exxrait de Materiaux et Constructions 4(24) 1-7 (1971)
11 Starov V M and Churaev N V Mechanisms of the phenomenon of vapour permeability of porous bodies Inzhenerno--Fizicheskii Zhumal 29(6) 1S06-1S 1 l (197S)
12 Galbraith G H and McLean RC Realistic vapour permeability values Building Research and Practice 14(2) 98-103 (1986)
Building Services Engineering Research and Technology