Embed Size (px)
Citation preview

AD-A266 426
INSTITUTE REPORT NO. 478
A MATHEMATICAL MODEL FOR THE STUDY OFHEMORRHAGIC SHOCK AND FLUID RESUSCITATION:
EXCHANGE OF FLUID AND SOLUTES BETWEEN VASCULAR,INTERSTITIAL, AND TISSUE CELL COMPARTMENTS
Tammy J. Doherty
Division of Military Trauma Research JUL 0 6 19931J
June 1993
93-15,206
FA - iF
LETTERMAN ARMY INSTITUTE OF RESEARCH PRESIDIO OF SAN FRANCISCO CALIFORNIA 94129

A MATHEMATICAL MODEL FOR THE STUDY OF HEMORRHAGICSHOCKAND FLUID RESUSCITATION: EXCHANGE OF FLUID ANDSOLUTES BETWEEN VASCULAR, INTERSTITIAL, AND TISSUECELL COMPARTMENTS -- T.J. Doherty
This document has been approved for public release and sale; itsdistribution is unlimited.
Destroy this report when it is no longer needed. Do not return to theoriginator.
Citation of trade names in this report does not constitute an officialendorsement or approval of the use of such items.
This material has been reviewed by Letterman ArmyInstitute of Research and there is no objection to itspresentation and'or publication. The opinions or assertionscontained herein are the private views of the author(s) andare not to be construed as official nor as reflecting theviews of the Department of the Army or the Department ofDefense. (AR 360-5)
/c7"
,J6hn R. Hess (date)/ COL, MC
7 Commander
REPORT DOCUMENTATION PAGE 1 OM8NO/0104-O,88
iaREPOR1T StCvmTe (,CASS~r.CAT.ON 1b PESTR(iUVi N'AkINGS
I. nclas'.ified__________________________________
2a SECURITY CLASSIFICATION AUTHORITY 3 DIST RiBUT QN, AVA.;A8i~TY Of REPORT
2b DECLASSIFICATiON IDOWVNGRADING SCHE"uLE
4, PERFORMING ORGANIZATION REPORT NuIVBER(S) 5 MONITORING ORGANIZATiON REPORT NUMBER(S)
Institute Report No. 478
6a. NAME OF PERFORMING ORGANIZATION 6o. OFFICE SYMBOL 7a. NAME Of MONITORiNG ORGANIZATION
Lettrma Arm Intitue (f .p~kaLE) U.S. Army Medical Research and Development Command
of Research SGRD-ULT-M _________ __________6C. ADDRESS (City, Slate, and ZIP Code) 7b. ADDRESS (City, State, and ZiP Code)Letterman Army Institute of ResearchDivision of Military Trauma Research Fort DetrickPresidio of San Francisco, CA 94129-6800 ________ Fredrick, MD 21701-5012
Ba. NAME OF FUNDING SPONSORýNG 8~b OFFICE SYMBOL 9. PROCUREMENT INSTRUMENT IDENTiFICATION NUMBERORGANIZATION (if applicable)
Div, Mil~itary Trauma Res. ISGRD-ULT-M
8c. tDDRESS (City, State, and4 ZIP Code) 10 SOURCE OF FUNDING NUMBERSPROGRAM IPROJECT ITASK WORK uNýTELEMENT NO NO, NO. jACCIESSON NO
I ______________________________ 61101A I BA I 2[11. TITLE (include Security Classification)
(U) A Mathematical Model for the Study' of Hemorrhagic Shock and Fluid Resuscitation: Exchaniz, of' Fluid and Solutes BetxkeenVascular. Interstitial, and Tissue Cell Compartments.!2- PERSONAL AUTHOR(S)Tammv J. Dohertv
13a. TYPE OF REPORT 113b. TIME COVERED 14. DATE OF REPORT (Year, Month, Day.) 1iS. PAGE COUT
final FROM 19)89 TO l9fl3 June 1)993, 19
16- SUPPLEMENTARY NOTATION
17. COSAT1 COOES 18. SUBJECT TERMS (Continue on reverse if necessary and identify by biock number)
FIELD GROU SUB-ROUP model. hemorrhage. fluid resuscitation. transcapillary exchange. body fluid shifts F
19. ABSTRACT (Continue on reverse if necessary and identify by block numb-er)The transfer of fluid from extravascular compartments into the vasculature is an important recovers mechanism for hemno-rrhage.This paper describes a three-compartment model (i.e.. %ascular. interstitial, and tissue cell) that predicts intra-extravascular fluidexchange followinga hemorrhage and fluid resuscitation. This three-compartment model assumes that capillary pressure is a linearfunction of blood voluine, that-interstitial pressure is a nonlinear function of extravascular volume, and that lymph flow is a functionof interstitial pressure. Starting with this simple three-compartment model, the effects of model assumptions on plasma volumepredictions were assessed. By varying model assumptions and comparing plasma volume predictions, we determined that separatetissue cell and interstitial comtrpartments were required for predicting the plasma volume response to infusions of resuscitativesolutions containing small, permeable solutes (e.g., NaCI). We also determnined that the interstitial space could be described by aconstant hydrostatic pressure, that considerations of interstitial exclusion volumes were not required . and that lymph flow could be 5
considered constant. Plasma volume predictions generated by the three-compartment model were also compared to observed plasmavolumes for validation. Data available for comparison included plasma volume responses to I ) rapid 33% loss of blood volume.2) slow (60-minute) 500% loss of blood volume followed by 4 mI/kg, administration of normnal saline. 7.5%o saline. 690 dextran-70.or 7.51%/ saline in 6% dextran-70, and 3) 4 ml/ke intravenous adm'inistration of 7.5% saline in 6% dextran-70 (no hemorrhageV.Overall, model predictions compared well with obser'ed plasma voluimes. However, the model often responded more slowly th -.nthe ohserved biological system. In addition, secondary dynamics, when present in the biologic system. Were frequentl', missýing inthe simulated system. Optimizing model parameter values, and incorporating cardiovascular dynamics and control, w~ould be
expected to remedy these problems.20DSRB~ON/VIAIIY FASRC 21. ABSTRACT SECURITY CLASSIFICATION
CM UNCLASSIFIEDUNLIMITEO 0 SAME AS RPT, 0 DTIC USERS unclassified22a. NAME OF RESPONSIBLE INDIVIDUAL j22b TELEPHONE (include Area Code) I22c. OFFICE SYMBOL
DO Form 147j, JUN 86 Previous editions are obsolete. SECURITY CLASSIFICTION OF THIS PAGE
UNCLASSIFIEl)

ABSTRACT
The transfer of fluid from extravascular compartments into the vasculature is animportant recovery mechanism for hemorrhage. [his paper describes a three-compartment model (i.e.. vascular, interstitial, and tissue cell) that prediclsintra-extravascular fluid exchange lollowing hemorrhage and fluid resuscitation.This three-compartment model assumes that capillary pressure is a linearfunction of blood volume, that interstitial pressure is a nonlinear function ofextravascular volume, and that lymph flowv is a tunction of interstitial pressure.Starting with this simple three-compartment model, the effects of modelassumptions on plasma \olume predictions were assessed. By' varying modelassumptions and comparing plasma volume predictions. \we determined thatseparate tissue cell and interstitial compartments- were required for predictingthe plasma volume response to infusions of resuscitative solutions containingsmall, permeable solutes ie.g.. NaCI). We also determined that the interstitialspace could be described by a constant hydrostatic pressure. that considerationsol interstitial exclusion vIlumes \were not required. and that lymph fllm couldbe considered constant. Plasma volume predictions generated by the three-compartment model wvere also compared to observed plasma volumes f'orvalidation. Data available fbr comparison included plasma \olume responses toS) rapid 33%o loss of blood volume. 2) slow (60-minute) 50% loss of blood
volume followed by 4 ml k, administration of normal saline. 7.59'0 saline. 6% ,dextran-70. or 7.5% saline in 60 dextran-70, and 3) 4 mli'kg intravenousadministration of' 7.590% saline in 6% dextran-70 (no hemorrhage). O\erall.model predictions compared well with observed plasma volumes. tlowever, themodel often responded more slowly than the observed biological system. Inaddition. secondary dynamics, when present in the biologic system, werefrequently missing in the simulated system. Optimizing model parametervalues, and incorporating cardiovascular dynamics and control, wvould beexpected to remedy these problems.
key words: model. hemorrhage. fluid resuscitation, transcapillary exchange.body fluid shifts.
locession For
D'TI(' TAP
I- 1
ii ... ..
I. it. I

A Mathematical Model for the Study of Hemorrhagic Shock and FluidResuscitation: Fluid and Solute Exchange Between Vascular, Interstitial,
and Tissue Cell Compartments -- Tammy .1. D)oherty
INTRODUCTION
Following a loss of blood volume, capillary hydrostatic pressure isreduced and fluid is transferred from extravascular compartments into thevasculature. An increase in blood volume has the opposite effect. a net transferof fluid out of the vasculature into the interstitium. Net fluid influx or effluxmay also occur when plasma osmolarit\ is altered as a result of plasma %olunmechanges or administration of resuscitative fluids. These results may bepredicted. qualitatively. using the Landis-Starling Equation". which relates therate of vascular fluid efliux iJ,) to hydrostatic (P) and osmotic (FI) pressuredifferences across the capillary wall:
J, = k, (Pc - PdY - (rIc - 111Y 0I
where capillary pressures are designated by the subscript C. and interstitialpressures by the subscript 1.
Although the Landis-Starling Equation provides a good approximationfor transcapiilary 1-uid shifts that occur at steady state or over a short period.this equation does not account fOr capillary wall permeability to solutes. whichplays an important role in the plasma volume response to changes in bloodvolume and plasma osmolality. In a previous paper' we reviewed andcompared various models of transcapillary fluid and solute flux and tound thatthe Kedem-Katchalsky equations- could be used to describe the efflux of fluid(J\) and solute (J.,) from the capillary to the interstitial space in response tochanges in blood volume and plasma osmolarity:
J,. k,. (PC - Prl,[ - (2)
( C 5 C )- (1 - G,) (3)
where (7, is the reflection coefficient for solute s at the capillary wall. C,.c andC,, are capillary and interstitial concentrations of solute s. and C is the averagesolute concentration for capillary and interstitial fluid. The present paperexplores other aspects of modeling intra-to-extravascular exchange. Startingwith a simple three-compartment (i.e., blood, interstitial, and tissue cell) model.the effects of model assumptions on plasma volume predictions are assessed.Specifically. the effects of interstitial-to-tissuc cell fluid exchange. interstitialcompliance, interstitial macromolecular exclusion volumes, and lymph flow areexamined. Fin.lvy. p!a1u v,,un prcdictioins. gcncwatod by the thrcc-

DOtERTY -- 2
compartment model, are compared to experimentally observed plasma volumesfbr validation.
THE BASIC 3-COMPARTMENT MODEL
The three-compartment model, initially selected to describe intra-to-extravascuiar fluid and solute tra, sport, is shown schematically in Figure 1.Rates of compartment volume change (dVidt) for plasma (subscript P).interstitial (subscript 1) and tissue cell (subscript T) compartments may beobtained by subtracting appropriate rates of fluid efflux from rates of fluidinflux:
dV -dt ", H, LJp
d Vf 5dt ,I IT (5
dtd VT
dt iIT (6)
where F, is the rate of resuscitative fluid administration. H, is the rate ofplasma volume loss in hemorrhaged blood. L, is the rate of lymph return, andJ,, is the rate of fluid efflux from compartment i to compartment j. Similarly.changes in plasma solute mass (dSdt) for the three compartments may beobtained by subtracting solute efflux from influx rates:
dt - S 4- sJPI (7)
dSI - s, PI Ls (8)dt
where F, is the rate of solute administration via resuscitative fluid, 1-, is the rateof solute loss in hemorrhaged blood. L is the rate of solute return to thevasculature via the lymphatics, and Jp is the rate of solute efflux from thevasculature to the interstitium. Solute transport between interstitial and tissuecell compartments is assumed to be zero.

D)II-RITY -- 3
The Kedem-Katchalsky' equations (Equations 2 and 3) are used todescribe the coupled flux of fluid (J.p,) and solute (J.pi) across the capillarywall:
L.P, = kv,, [(PC - P,) - (7sI(fl.P (9)
. , .c3,) (1 . . {(10)
Because the tissue cell wall is considered to be impermeable to solutes, theLandis-Starling equation (Equation 1), extended to a solution of multiplesolutes. may be used to describe fluid transport from the interstitial to the tissuecell compartment:
J<,IT= k,,.rr[(P, - PT) - E (1sf-IsT,)] (11)
A model for lymph flow tL,) as a function of interstitial hydrostatic pressurewas obtained from the fluid and solute transport model developed by Mazzoniand coworkers5:
0 when P,• -6mmHg
0.02 + 0.00333P, when -6•< P,<O 0Lv (12)
LV
0.02 + 0.105P, when 0• P,< 4
0.44 when 4!5P,
Transport of solutes in lymph is assumed to occur by bulk flow, i.e.:
L, -- C•,I Lv (13)
To obtain estimates for capillary pressure (Pc), it is assumed that a rapidchange in blood volume results in a 3 mm Hg change in arterial pressure foreach I ml/kg change in blood volume', and that changes in capillary pressureare proportional to changes in arterial pressure by a factor of approximately0.177. These assumptions yield the following relationship between capillarypressure and blood volume (V,3):
DOHERTY -- 4
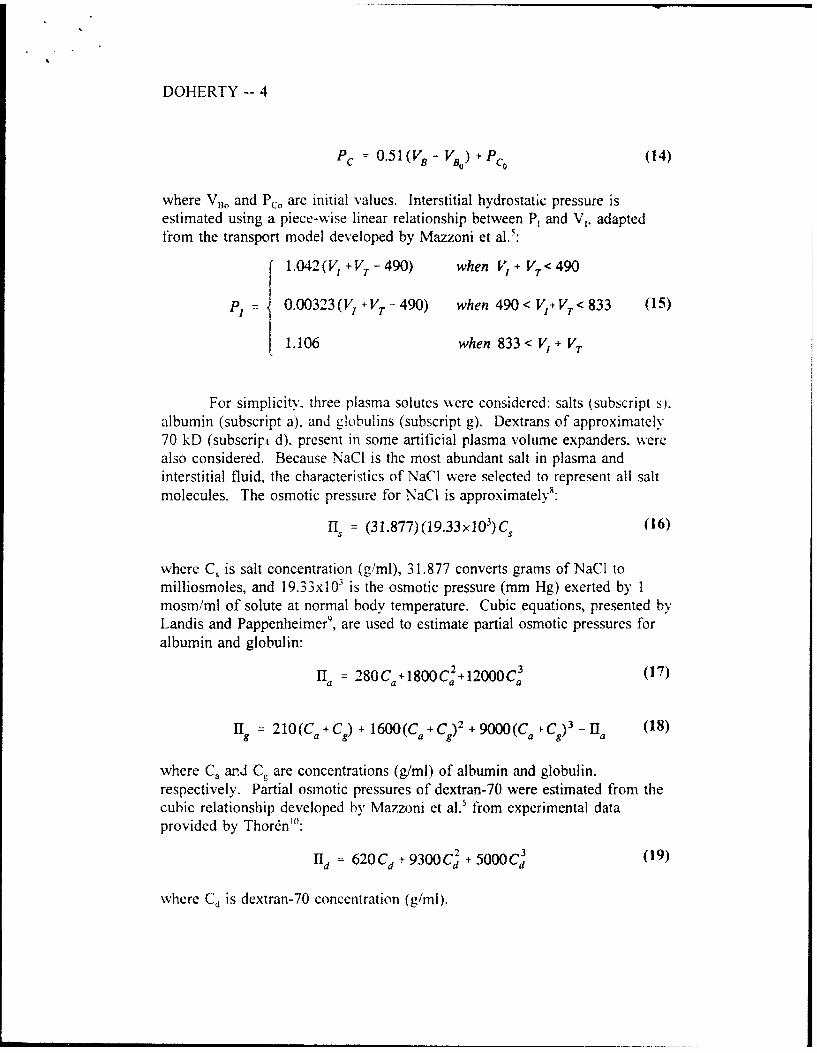
PC = o.5 1(VB - V"B) + PC. (14)
where VB, and Pc. are initial values. Interstitial hydrostatic pressure isestimated using a piece-wise linear relationship between P, and V,, adaptedfrom the transport model developed by Mazzoni et al.f:
1.042(V, + -VT-490) when V, + VT< 490
P1 = 0.00323(VI +V T-490) when 490 < VJ+VT< 833 (15)
1.106 when 8 3 3 < V, + VT
For simplicity, three plasma solutes were considered: salts (subscript s).albumin (subscript a). and globulins (subscript g). Dextrans of approximately70 kD (subscrirl. d). present in some artificial plasma volume expanders. werealso considered. Because NaCL is the most abundant salt in plasma andinterstitial fluid, the characteristics of NaCI were selected to represent all saltmolecules. The osmotic pressure for NaCI is approximately':
H, = (31.877)(19.33x10 3)C' (16)
where C, is salt concentration (g/ml), 31.877 converts grams of NaCI tomilliosmoles, and 19.33x10 3 is the osmotic pressure (mm Hg) exerted by Imosm/ml of solute at normal body temperature. Cubic equations, presented byLandis and Pappenheimer9, are used to estimate partial osmotic pressures foralbumin and globulin:
H = 280Ca+1800Ca+12000C 3 (17)
119 = 210(Ca+Cg) + 1600(Ca+Cg) 2 + 9000 (Ca '-C) 3 _ ][1 (18)
where Ca and Cg are concentrations (g/ml) of albumin and globulin.,respectively. Partial osmotic pressures of dextran-70 were estimated from thecubic relationship developed by Mazzoni et al.5 from experimental dataprovided by Thordn"':
Hd = 620Cd+ 9300C + 5000C (19)
where Cd is dextran-70 concentration (g/ml).

I)OIIIlRTY -- 5
TISSUE CELL AND INTERSTITIAL COMPARTMENTS
In the basic three-compartment model described above, both tissue celland interstitial compartments are considered. However, tissue cells cannotsupport a hydrostatic pressure gradient and osmotic pressure gradients acrossthe cell membrane are usually negligible. Thus, it may be possible to lump thetissue cell and interstitial compartments together into a single extravascularcompartment. On the other hand, the capillary wall is much more permeable tocertain solutes (e.g.. sodium) than arc tissue cell membranes. Consequently,intravascular administration of permeable hyperosmotic solutions, andsubsequent transport of the solutes to the interstitial space could produce largeosmotic gradients across the cell wall. Such gradients could alt, - the amountof fluid translocated from the extravascular to the vascular space. in which caseseparate tissue cell and interstitial compartments would be warranted.
To test whether two extravascular compartments are required, wegenerated a two-compartment model by eliminating the interstitial-cellular fluidtransport equation (Equation 11) from the three-compartment model. As Figure2 shows, predictions of plasma volume response to an instantaneous 25%increase or decrease in blood volume, or an instantaneous 50% increase ordecrease in plasma albumin were indistinguishable for the two-compartmentand basic three-compartment models (prediction curves overlap). However,predictions of plasma volume response to gross changes in plasma NaCIdiffered.
Because of high osmotic pressure gradients across the capillary wall,both the two- and three-compartment models initially predict a high influx offluid from the interstitium to the vasculature (Figures 3a and 4a) . Due to thehigh capillary permeability to NaCI. there is also an immediate increase ininterstitial NaC1 concentration (Figures 3b and 4b). In the three- compartmentmodel, this change in interstitial NaCI concentration results in a transfer offluid from the tissue cells to the interstitial space. Fluid moves from the tissuecell to interstitium, and from there to the vasculature, until the net driving forcefor fluid flow across the capillary wall favors net vascular fluid efflux.Eventually, plasma and interstitial volumes return to normal levels. In the two-compartment model, there is no tissue cell fluid reservoir for interstitial NaCIdilution. Thus, plasma and interstitial NaCI concentrations equilibrate morerapidly, and the driving force for fluid transfer across the capillary wall favorsnet vascular fluid efflux sooner. Although the steady-state result (i.e., normalplasma volume) is the same for the two models. the short-term effects of NaC1infusion are different: the two-compartment model predicts a smaller peakplasma volume response, and an earlier return of plasma volume to normallevels. Because the increase in plasma volume associated with hyperosmotic

DOHERTY -- 6
resuscitative fluid administration may be exploited therapeutically, we feel thatfor accuracy, separate tissue and interstitial compartments must be included inthe model.
CHARACTERISTICS OF TItE INTERSTITIAL COMPARTMENT
The interstitial matrix is made up of a network of hyaluronic acidmolecules, proteoglycans. an,' cross-linked collagen fibers". The mechanical-
elastic properties of the collagen molecules contribute to the developmcnt ofnonlinear interstitial pressure-volume relationships which differ from pressure-volume relationships of fluid-filled compartments. When the interstitium isdehydrated, the pressure-volume relationship is dominated by the mechanicalelastic properties of the collagen fibers. At normal interstitial volumes, thecontribution of mechanical forces declines. At higher interstitial volumes, thegelatin matrix begins to break up (collagen fibers do not tolerate expansionweIl) and the pressure-volume relationship assumes the characteristics of afluid-filled compartment. dominated by the elastic effects of the outerboundaries of the extravascular space'2 . The set of equations used to estimateinterstitial hydrostatic pressure E1t-quation 15) corresponds to this de-cription.consisting of a relatively steep pressure-volume relationship at below-normalvolumes and a more compliant region at above-normal volumes'-.
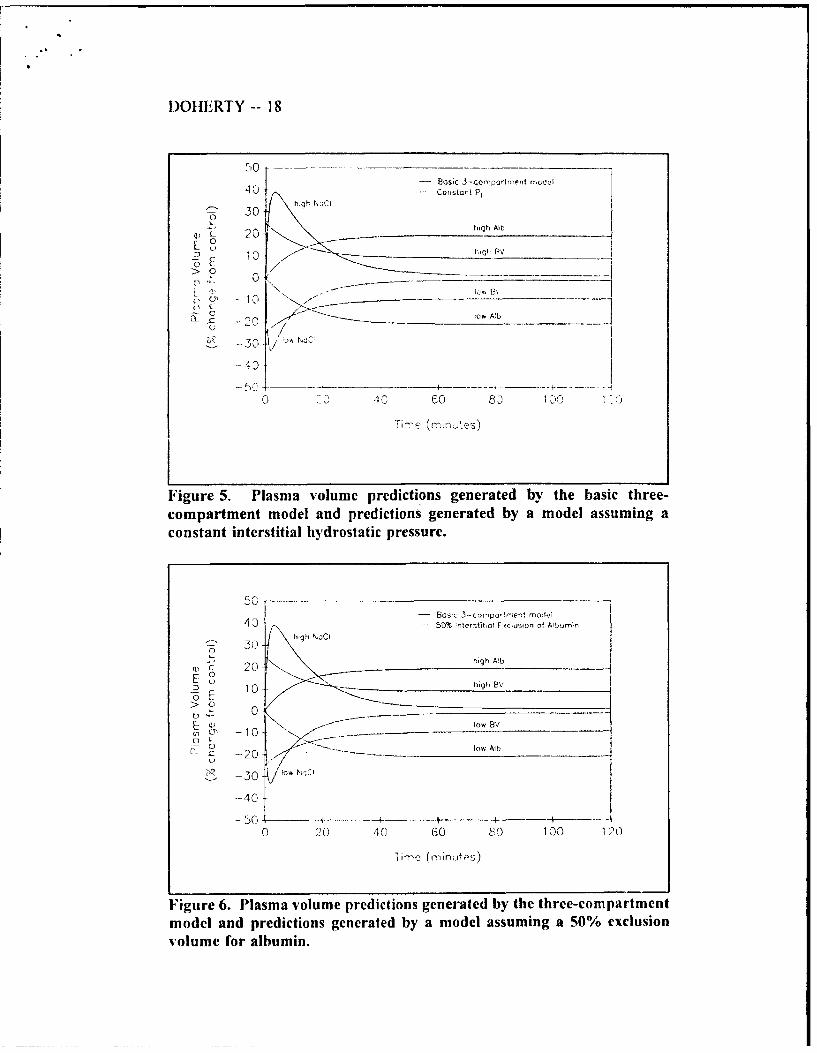
To test whether such detailed characterization of the extravascularpressure-volume relationship is required for accurate predictions of plasmavolume, we compared plasma volume predictions generated by the basic three-compartment model (in which the piece-wise linear interstitial press,":e-volumerelationship of Equation 15 is used) with plasma volume predictions generatedby a model in which interstitial pressure is fixel at 0 mm Hg. The results ofthe simulations are presented in Figure 5. The two models produce nearlyidentical predictions (i.e.. prediction curves overlap) for each of the simulatedchanges in blood volume and plasma solute concentration. These resultssuggest that the nonlinearity of interstitial compliance is unimportant inpredictions of whole-body plasma volume changes following hemorrhage and/orfluid resuscitation.
The hyaluronic acid molecules. proteoglycans, and cross-linked collagenfibers of the interstitial gel occupy a significant volume of the interstitial space.The effect of these molecules on surrounding fluid is to restrict the totalinterstitial fluid volume available to macromolecules. Interstitial exclusionvolumes for albumin are usually measured in the range of 40-50%" whichmight affect interstitial solute concentration changes. To test the effect of

)(II•ERTY -- 7
inacromolecular exclusion volumes on intra-to-extravascular fluid and soluteexchange, plasma volumes generated by the basic three-compartment modelwere compared to predictions generated by a model in which only 50% of theinterstitial compartment is available fbr the diffusion of macromolecules. AsFigure 6 demonstrates, there was no apparent difference in plasma volumepredictions generated by the two models. Thus, exclusion volumes may beneglected in studies of plasma volume response to changes in blood volume andplasma osmolaritv.
TRANSPORT OF SOLUTE AND SOLVENT IN LYMPH
Under normal circumstances, Starling forces favor net fluid efflux at thearteriolar end of the capillary and et fluid absorption at the venular end. Netfluid efilux which i, not returned to the circulation via transcapillary flux isnormall\ returned by the lymphatics. L.ymph vessels originate as thin-walled.capillary-like, close-ended channels and are present in all tissues. At the origin.sequential endothelial cells o crlap each other with fine collagen fibrilsanchoring the non-overlapping portions to large collagen bundles and groundsubstance in surrounding tissues-. Because the anchoring filaments are notattached to the overlapping portions. distension of the interstitial matrix causesthe endothelial cells to be pulled apart. lowering lymphatic pressure. A positiveinterstitial-lymph pressure gradient causes the overlapping portion of theendothelial cells (i.e.. the "flaps") to be pushed inward, admitting flow into thelymphatic capillary while prohibiting back flow. Further from the origin,lymphatic endothelial cells are closer together, forming a true vessel capable oftransporting both fluid and solute. Small lymph capillary vessels join togetherto form progressively larger lymph vessels. Lymph flow is achieved byrhythmic contraction of smooth muscle cells in large lymph vessels, whichtends to push flow fiom origin to circulation while valves present in prenatallymph vessels prohibit back-flow':. The level of smooth muscle activity maybe under sympathetic control". From this conceptual model, we may presumethat the rate of fluid transfer from the interstitium into the lymphatics. and fromthere to the vasculature depends on interstitial pressure. interstitial volume, andlymphatic smooth muscle activity.
In the basic three-compartment model, lymph flow rates were assumedto be dependent upon interstitial hydrostatic pressures (Equation 12). Figure 7shows that a model that assumes constant lymph flow rates (i.e., 0.02 ml'kgig'min") generates the same plasma volume predictions as the basic three-compartment model Ifr the simulated conditions included for testing (predictioncurves overlap). Pathological conditions normally associated with tissue edema.
DOtlEI(TY -- 8
such as increased capillary permeability to macromolecules, were not includedin this study.
MODEL VALIDATION
Results oi" the previous sections indicate the possibility of simpli•'ingthe basic three-compartm,.-nt model by ignoring interstitial hydrostatic pressurechangc's, interstitial tnacromolecular exclusion volumes, and lymph flow ratechenges. In this section, v,-c attempt to determine whether the basic three-compartment model is adequate liar predicting the plasma volume response tochanges in bloc•d volume and plasma osmolarity. Data available forcomparison incluJe p!asma x otume responses to l) rapid uncontrolledhemorrhage. 2) slov, fixed-volume hemorrhage followed by" small-volumeresuscitation, avd 3) hyperosmotic resuscitmtve fluid administration l nohe•norrhage)..Xlodet paranaeter values and initial values used hi thiscomparison study' are provided in Tables 1 and 2. These values were obtainedfrom the literature and ,,','ere not optimized "or this studv.
In the tirst validation cxperimem, predicted plasma volumes v•erecempared to experimental data from an uncontrolled, aortotomy hemorrhagemodel in sp',encctomized swine•-'. In this aortotomy model, a 5 mmlongitudinal slit is made in the abdominal aorta. Blood loss is rapid, but abatesalier 2-5 minutes by normal hemostatic mechanisms. The total blood loss isbet'`veen 31% and 35% of the normal blood volume for this species. Percentchanges in plasma volume were computed by assuming that percent increases inplasma volume equaled percent decreases in systemic hematoerit. Thesecalculated plasma volume changes are plotted using dotted lines in Figure 8.P, cdicted plasma volumes (solid line in Figure 8) approximated the response ofthe anesthetized animals. However. the model was unable to follow thedynamic changes in plasma volume that occurred during the recover3, period.This lack of agreement may be the result of changes in cardiovascularhcmodynamics and cardiovascular control •,hich are not accounted for in themodel. Cardiovascular control mechanisms affect the overall plasma volume, afact that is s',pporte, d by the apparent differences between plasma volumeresponses of anesthetized and conscious an;reals in this study. Disparitiesbetween observed and predicted plasma volumes may also be due to red bloodcell trapping or red blood cell skimming in the microvasculaturet•', factors
which affect systemic hematocrits and calculated plasma volumes. Finally. thelack of s;:,.:ondarv dynamics in the predicted plasma volume response could bethe result of inappropriate parameter value selection.

DOIJI-R! Y -- 9
In the second set of %alidation experiments, we compared predictedplasnma %.olumes %with the observed plasma volume response to a 50'6 fixed-volume hemorrhage in conscious, splenectomized sine7". In this hemorrhagemodel. 7.5 mlke of blood %,as withdrawn over successive intervals beginningat 0. 9. 19. 3115. and 44 minutes. I'he total hemorrhage volume of 37.5 ml ke,,was approximatci\ 50W. of the animal's initial blood volume. Obsenred plasmavolume changes \%erc computed from percent changes in systemic hematocrit.Plasma volume predictions overestimated observed responses by a relativelylarge margin i Viure 9). Better prcdictions \ýere achic\ cd bN adjusting thecapillary filtration coefficient (k, ,,) downward by 50% (Figure 9 dashed line).
At the end of the hemorrhage t60 minutes). the animals wereresuscitated , ith 4 ml ke ot normal saline (NS). hypertonic 7.5%, saline HS)I.hyperosmotic 6o dextran-7O D 7 . or hypertonic 7.5%o saline in 6% dextranHIIS). As Figure 10 shox s. when the capillary filtration coefficient wasadiusted by -50" (,. model predictions agreed with the response of plasmavolume to resuscitation with HS and IISD. The model was less successful inpredicting the response to lID. and \was unsuccessful at predicting the responseto normal saline (NS). The reason for the lack of agreement betw'een modelpredictions and observed plasma volume response to normal saline infusion ismost likely the phvsiologic state of thle animals in the NS group. Only 2 of 6animals survived the first 15 minutes after resuscitation, and all died after 60minutes. Survival was low in the HD group as well. with a gradual attrition insubject numbers to 33%o (2 of 6) at 60-minutes post-hemorrhage and 16.5% (1of 6) at 120-minutes...As in previous attempts to predict the plasma volumeresponse to aortotomy hemorrhage, the model appeared to miss some of thesecondary dynamics of the plasma volume response to hyperosmotic solutions..\ain, this could be due to a n' tber of factors including the lack of
cardiovascular hemodvnamics. the lack of cardiovascular control mechanisms.and the need to refine model parameter values.
In the final set of validations, model predictions were compared toplasma volume responses of anesthetized, euvolemic swine to infusion of 4ml'kg of H4SD". As Figure I I shows, predicted plasma volumes agreed withthe observed plasma volume response. However, the model responded moreslowly than the observed system. In addition, secondary dynamics (apparentbetween 5 and 20 minutes after infusion) were lacking. Perhaps thesediscrepancies. as in the previous validations, may be explained or reduced byconsiderations of cardiovascular heniodynamics and control, and byoptimization of" model parameter values.

D)OHERTY -- 10
SUMMARY AND CONCLUSIONS
In this paper, we present a simple three-compartment model to describetransvascular fluid exchange following hemorrhage and fluid resuscitation.This model includes equations for fluid and solute transport across the capillarywall, between interstitium and tissue cell, and in lymph. By varying modelassumptions and comparing resulting plasma volume predictions, we determinedthat separate tissue cell and interstitial compartments were required fi't"predicting the plasma volume response to infusions of resuscitative so,,Jtionscontaining small, permeable solutes (e.g., NaCI). We also determined that theinterstitial space could be described by a constant hydrostatic pressure. :hatconsiderations of interstitial exclusion volumes were not required, and thatlymph flow could be considered constant.
The model described in this paper can. with little or no adjustment ofmodel parameter values, predict the general response of plasma volume tosimulated hemorrhage insults and simulated infusions of isosmotic andhyperosmotic solutions. However. the model often responds more slowly thanthe observed biological systems, and secondary dynamics evident in theobserved biological systems are frequently lacking. The most apparentweakness in this model is its description of the vasculature as an elasticcompartment, represented by a linear relationship between capillary pressureand blood volume. This description w\as chosen to facilitate modelcomparisons and is not presumed to be accurate. By combining the flux modeldescribed here with a model of cardiovascular hemodynamics, and byoptimizing parameter values, prediction accuracy is expected to improve.
)01 IFtR -F' -- I I
REFERENCES
1. Landis E.M. IMicro-injection studies of capillary permeability 11. Therelation between capillary pressure and the rate at which fluid passes throughthe walls of single capillaries. Am J Physiol 1927, 82:217-238.
2. Starling Eli. On the absorption of fluids from the connective tissue spaces. JPhvsiol (London) 1896- 19:312-326.
3. Doherty TJ. A mathematical model fbr the study of hemorrhagic shock andfluid resuscitation: transcapillary flux. Institute Report #477, Letterman ArmyInstitute of Research, Presidio of San Francisco, CA, 1993.
4. Kedem 0. Katchalskv A. Thermodynamic analysis of the permeability ofbioloical membranes to non-electrolytes. Acta Biochem Biophys 1958- 27:229-246.
5. Mazzoni MC, Borgstrom P. Arfors KE. and Intaglietta NM. Dynamic fluidredistribution in hypcrosmotic resuscitation of hypovolemic hemorrhage. Am JPhvsiol 1988; 255:H629-H637.
6. BickelI WH, Bruttig SP, Wade CE. Hemodvnamic response to abdominalaortotomy in the anesthetized swine. Circ Shock 1989; 28: 321-332.
7. Bohlen HG. Gore RW. Comparison of microvascular pressures anddiameters in the innervated and denervated rat intestine. Microvasc Res 1977:14:251-264.
8. Harper HA. Review of Physiological Chemistry. Los Altos, CA: Lange MedPub. 1969.
9. Landis EM. Pappenheimer JR. Exchange of substances through capillarywalls. In: Handbook of Physiology. Bethesda: American Physiological Society,1963, sect. 2, vol. 2, pp. 961-1034.
10. Thorin L. Dextran as a plasma volume substitute. In: Jamieson GA,Greenwalt. eds. Blood Substitutes and Plasma Volume Expanders. New York:Liss, 1978: pp. 265-282.
11. Parker JC, Guyton AC. Taylor AE. Pulmonary transcapillary exchangeand pulmonary edema. In: Guyton AC, Young DB, eds. International Reviewof Physiology. Cardiovascular Physiology Ill; Vol. 18. Baltimore: UniversityPark Press, 1979, pp. 261-315.

L)O1LRT -- 12'
12. Guvton AC, Tav~lor AF, (lranger HII. Circulatory Physiloogy IL: Dynamicsand Control of the IBodN Fluids. New York: W.B. Saunders Co.- 1975.
13'. Guyton AC. Interstitial fluid pressure: 11. Presure-volume curves of theinterstitial space. Circ Res 1965;, 16: 452-460.
14. Dabnev INI. Buchn MIN. Dobbins DE. Constriction of lymphatics bycatecholarnines, carotid occ!usion. or hemorrhage. Am J Physiol 1988:,2255:1-5 14-11524.
15. Bickell WI I. Bruttig SP. WNade CE. 1-emod~ynamnic response to abdominalaorrotomv in the anesthetized swine. Circ Shock 1989: 28: 32 1-332.
16. IBickell %V11, O'Benar J. Bruttij-, SR. Wade CE. Hannon J11, Tillman F,Rodkev WV. Thle hemod-vnamic response to aortotomy in the conscious,chronically instrumented swine. Physiologist 1987: 30:28.
17. 'Wade CE. H-annon JR1 lBossonc CA, Ilunt MM. Loveday JIA, Coppes RI.Gildengorin VL. Resuscitation of conscious pigs follo-wing hemorrhage:comparative efficacy of small-volume resuscitation with normal saline. 7-5%'NaCI. 6% Dextran 70, and 7.5% NaCI in 6% dextran 70. Institute Report4'305, Letterm-an Arm\, Institute of Research, October. 1988.
1 8. Dubick MA. Pfeiffer J\V, Clifford CB, Runyon DE. Kramer GC.Comparison of intraosseous and intravenous delivery of hypertonicsaline/dextran in anesthetized. euvolemic pigs. Ann Emer Med 1992: 21: 408-503).

DOIRINTY -- 13
Table 1. Initial conditions and parameter values for the three-compartmentmodel.
blood compartment
Blood Volume (VN) 70 ml/kg
Plasma Volume (VP) 38.5 mlike
Plasma NaCI Concentration (C,.,) 0.0093 g/ml
Plasma Albumin Concentration (C.p) 0.045 g/ml
Plasma Globulin Concentration (C,,,) 0.025 giml
Capillary Hydrostatic Pressure (Pc) 18.5 mm Fig
interstitial compartment
Interstitial Volume (V,) 140 mlikg
Interstitial NaCl Concentration (C..) 0.0093 giml
Interstitial Albumin Concentration (Ca.i) 0.02 g/ml
Interstitial Globulin Concentration (Cg,) 0.0 g/ml
Interstitial Hydrostatic Pressure (P,) 0.0 mm Hg
tissue-cell compartment
Tissue Volume (VT) 350 ml/'kg

DOIIIRTY -- 14
Table 2. Parameter values for fluid and solute transport equations.
assumed values
CTs 0.109
CYG 0.904
G, 1.0
ks 35.71 mlhkg-min1
k, 0.013504 ml-kg•-min 1
kpt 0.0612 ml-kg-'.min -ram t-gI"
kIr 0.45501 ml-kkg'-min'-rn lg"i

lX)IILR I Y 15 I
Blood Oi b I tnersbajum~ Ttssue Cells
Figure 1. Three-compartment model for predicting intra-to-extravascularfluid and solute exchange.
Figure 2. Plasma volume predictions generated by the tivo- and three-compartment models.

DOHIERTY -- 16
Figure 3a. Compartment volumes predicted by the three-compartment
.odel following a simulated 50% increase in plasma NaCI concentration.
ýN E RST ITAJ
T L.. 30'
C, _-_____C__
.--?? : ...... . .
Figure 3b. NaCo concentrations predicted by the three-compartment model
following a simulated 50% increase in plasma NaC ! concentration.

)OHI[RTY -- 17
-A 0 -- Eioed Co•'pa,',m-ent)C 50-
0 40
1)°
E 20 .
-•00
Figure 4a. Compartment volunics predicted by the two-compartmentmodel following a simulated 50% increase in plasma NaCI concentration.
1 .1OT__ -_ __ _
----
•- r*N'÷• 'S;IAL
"5
"1- , I.t0 . e
()
.-- 1.00
(.
C) 0.95C)
Figure 4b. NaCI concentrations predicted by the two-compartment modelfollowing a simulated 50% increase in plasma NaCI concentration.
DOHERTY -- 18
50Bas- Oic 3--.oapar ment mJdei
4C0 . u.. stau t P,- ' 30 hQ .:c
h Cqh Al
0 3
0 0
(~C
- -}20
4---- - - -----
0 0 40 Go &
Time - "i n;ts
Figure 5. Plasma volume predictions generated by the basic three-compartment model and predictions generated by a model assuming aconstant interstitial hydrostatic pressure.
40 - Bose 3-compa-I-ent mod,!
S. 50% )rterstitcll EKo*usion of Albumi n
C 3;) g
S 20 high Alt
1 h~gh BV-6E/
-10 low BV
01oT 0 low Aib,z -20-
,2 30 low-40
- 50 --- +--÷ -A-------+------+- -----0 20 40 60 8F0 100 120
'i mc (minutos)
Figure 6. Plasma volume predictions generated by the three-compartmentmodel and predictions generated by a model assuming a 50% exclusionvolume for albumin.

DOIEI1 Y -- 19
404 t0 J-- 8asic 3-,comr',o•rt,1et ,o'1&
Constont Ly-ph Ffow Poje
C 20 h~gh A'to
E
> 0C ), -10 !°
-'0-20 - 10. A&
Time >rmnAes)
Figure 7. Plasma volume predictions generated by the three-compartmentmodel ;nd by a model assuming constant lymph flow rates.
20
E( 3 A A A
55. B , mALC )H...PRI DI)~t1 )
-'10 ,;- .4
0 6O 80 1 ,)1,
T[in'r:} (m-Hrljjts)
Figure 8. Observed and predicted plasma volume response to aninstantaneous 33% loss of blood volume.

DOHERTY -- 20
0 -1
PREDICTED
10 -1PREDCTED (K,= 50"
N -40
C)
-SO
0i 23 30 4" , •
Figure 9. Observed and predicted plasma volume response to anexponential 50% loss of blood volume.
50 ---- -- ---- ---- - ----------- - -0L2x 430~. .
0*--. .
UOA A
S 0 4
G C 8 2C) 90 100 1 1?.
Figure 10. Observed and predicted plasma volume response to -4mil/kgresuscitation following a 50% exponential hemorrhage.

iD)I11t1 Y -- 21
45 0 •osoodhr :) * S Ir~troOSS4")LP de'+•4y
A A In;2aenois dehp,,b • •\ --~h~z Px, .: % d~c',,
**A
SI * -..I It7O
"- -- +' , - , -+' - - _ :4
Figure 11. Observed and predicted plasma volume response to an irifusioni(4 m~lkg) of 7.5% NaC| in 6% dextran-70 (no hemorrhage).
22 -- DOHERTY'(IFFICIAl. IISTRIIBUTION LIST
Commander
US Army Medical Research Commander
& Development CommaTd US Army Medical Bioenginecring
ATTN: SGRD-RMS/Mrs. Madigan Research & Development Laboratory
Fort Detrick, 'ID 21701-5012 ATTN: LibraryFort Detrick, Bldg 568
Defense Technical Information Center Frederick, MD 21701-5010
ATTN: DTIC/DDAB (2 copies)
Cameron Station Commander
Alexandria, VA 22304-6145 US Army Research lnstittAeof Environmental Medicine
Office of Under Secretary of Defense ATTN: SGRD-UE-RSA
Research and Engineering Kansas Street
ATTN: R&AT (IE&ILS), Room 3D129 Natick, MA 01760-5007
The PentagonWashington. DC 20301-3080 Commander
US Army Research Institute of
DASG-AAFJNML Surgical Research
Army/Air Force Joint Medical Libr,.vy Fort Sam Houston, TX 78234-6200
Offices of the Surgeons Gen:-al
5il(! Leesburg Pike. Room 670 Commander
Fails Church, VA 22041-3258 US Army Research Institute of
Chemical Defense
IIQ DA (DASG-ZXAN) ATTN: SGRD-UV-AJ
WASH DC 20310-2300 Aberdeen Proving Ground, MD 21010-4425
Comrn,,ndant Commander
Academy of Ile.•,th Sciences US Army Aeromedical Research
US Army Laboratory
ATTN: IISIIA-CDM Fort Rucker. AL 36362-5000
l:ort Sam Houston, TX 78234-6100AIR FORCE Cffice of Scientific
Uniformed Services University of Research (NL)
llcalth Sciences Building 410, Room A217
Office of Grants Management Bolling Air Force Base, DC 20332-6448
4301 Jones Bridge Road
Bethesda, MD 20814-4799 Strughold Acromedical LibraryArmstrong Laboratory/DOKOD
US Army Research Office 2511 kt' nedy Dr.
ATTN: Chemical and Biological Br,..ks AFB TX 78235-Y "
Sciences Division
PO Box 12211 Head, Biological Sciences Divi-.on
Research Triangle Park. NC 27709-2211 OFFICE OF NAVAL RFSEARCII800 North Quincy Street
Director Arlington, VA 22217-5000
ATTN: SGRD-UW7-L
Walter Reed Army Institute of Research CommanderWashington, DC. 20307 5100 Naval 1.edical Command-02
Comman d er Departn.ent of the Navy
US Army Medical Research Institute Washington, DC 20372-5120
of Infectious Diseases
ATTN: SGRD-ULZ-A
I-ort Detrick, MD) 21701-5011
Commander
US Army Medical Bioenginceuing Research
and l)evelopment LahoratoryATTN: SGIRD-IUF3-MFort l)etrick. Il ldg 568
Frederick, Ni) 21701.5010
1 2:02