Embed Size (px)
Citation preview
Destination India Making India the solar capital of the World
1
Saibaba Vutukuri
Co-Chairman- FICCI Solar Task Force
& CEO, LANCO SOLAR

Content
� India – The Past and Future
� Indian Govt Infrastructure Focus
� Power Requirement of India� Power Requirement of India
� Renewable Energy in India
� Solar Energy in India
2
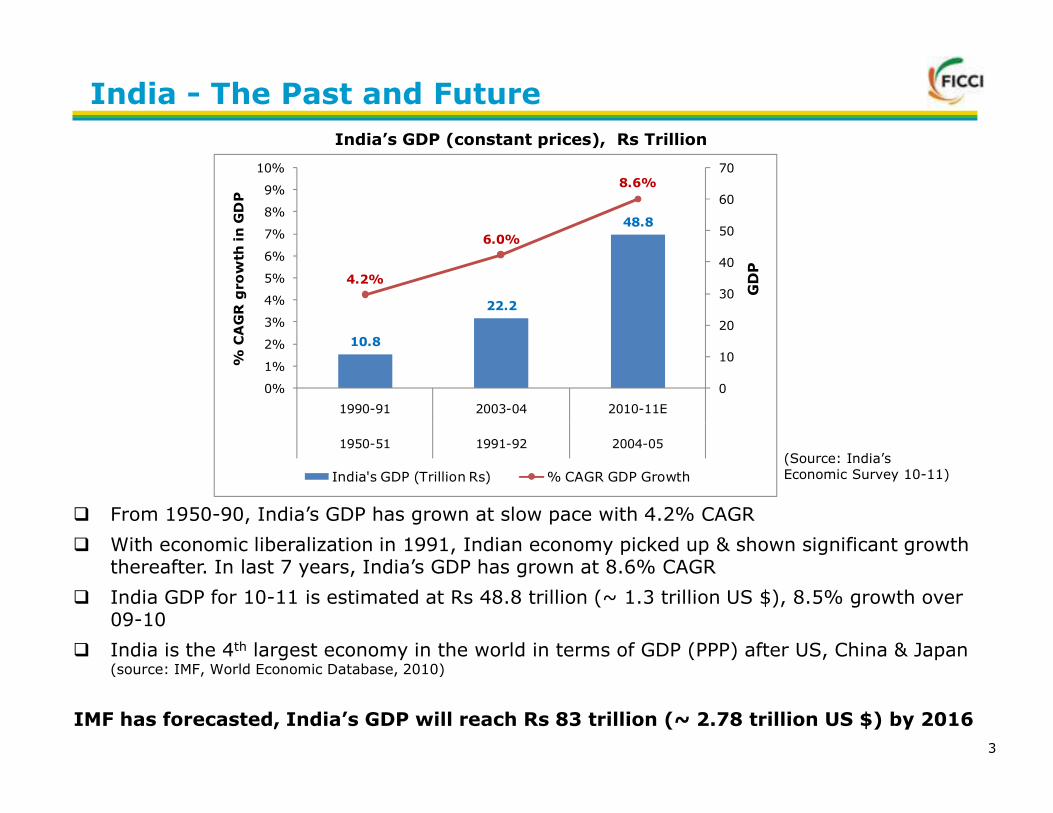
India - The Past and Future
India’s GDP (constant prices), Rs Trillion
10.8
22.2
48.8
4.2%
6.0%
8.6%
0
10
20
30
40
50
60
70
0%
1%
2%
3%
4%
5%
6%
7%
8%
9%
10%
1990-91 2003-04 2010-11E
GDP
% CAGR growth in GDP
� From 1950-90, India’s GDP has grown at slow pace with 4.2% CAGR
� With economic liberalization in 1991, Indian economy picked up & shown significant growth thereafter. In last 7 years, India’s GDP has grown at 8.6% CAGR
� India GDP for 10-11 is estimated at Rs 48.8 trillion (~ 1.3 trillion US $), 8.5% growth over 09-10
� India is the 4th largest economy in the world in terms of GDP (PPP) after US, China & Japan (source: IMF, World Economic Database, 2010)
IMF has forecasted, India’s GDP will reach Rs 83 trillion (~ 2.78 trillion US $) by 2016
(Source: India’s Economic Survey 10-11)
3
1990-91 2003-04 2010-11E
1950-51 1991-92 2004-05
India's GDP (Trillion Rs) % CAGR GDP Growth

Rising income of Indian Middle Class
9x
4
(Source: Mckinsey Global Institute: The ‘Bird of Gold’: The rise of India’s Consumer Market, May’2007)
� Indian economy has evolved as domestic consumption economy.
� Spending power of middle class has risen & income levels will increase by 3 to 4 times.
� said by 2015-16, India will be a country of 53.3 million middle class households, translating into 267 million people falling in the category (As per NCAER)
India will be world’s 5th largest consumer market by 2025
Middle Class

Content
� India – The Past and Future
� Indian Govt Infrastructure Focus
� Power Requirement of India�
� Renewable Energy in India
� Solar Energy in India
5

167
7965 65 63
3622
8 6 4
0
40
80
120
160
200
US $ bn
Strong focus to drive infrastructure growth
Infrastructure Investment (2007-12)� Current government is putting lot
of emphasis on infrastructureinvestment and growth
� Positive regulatory reforms remaina key driver of growth
� Power being the major thrust area
� Infrastructure investment maybe doubled (~1 trillion) in 12th
five year plan (2012-17)
~ US$ 500 bn
Source: Planning commission (XIth five year plan)Source: Planning commission (XIth five year plan)
6
State
82.5 GW
48%
Central
54.4 GW
31%
Private
36.8 GW
21%
(Source: Central Electricity Authority (“CEA”) & MNRE)
Generation mix (as on 31 Mar’11) Install Capacity (as on 31 Mar’11)
Current Power Scenario
173.6 GW
Hydro
22%
Nuclear
3%
RES
11%
Coal
54%
Gas
10%
Oil
0.7%
Thermal
65%

Content
� India – The Past and Future
� Indian Govt Infrastructure Focus
� Power Requirement of India�
� Renewable Energy in India
� Solar Energy in India
7

India’s power requirement would be fourfoldCurrent Per capita consumption of electricity
(Approx kWh)15000
11000
80007000
62005600
1800
700
2300
USA Australia Japan Germany UK Russia China India World
Avg
153
220
306
425
575
778
2006-07 2011-12 2016-17 2021-22 2026-27 2031-32
(Source: Integrated Energy Policy - Planning Commission Report 2006)
Power Requirement (GW)
Avg
8
� India uses less electricity as compared to the world’s average
� Indian Govt. plans to increase per capita consumption to 1000kWh by 2012
� Currently, Demand for power is far more than supply. Average deficit stands at 10-12%. Peak deficit is around 15%.
If India sustains 8% GDP growth year–on-year, it would require more than 750 GW of power by 2031-32.
(Source: Integrated Energy Policy - Planning Commission Report 2006)
Content
� India – The Past and Future
� Indian Govt Infrastructure Focus
� Power Requirement of India�
� Renewable Energy in India
� Solar Energy in India
9

India ranked 10th in Clean Energy investment
Clean Energy Investment ($ billion)RE Capacity Trend (GW)
3.5
10.3
22.5
Upto 9th Plan
(2002)
Upto 10th Plan
(2007)
Target upto 11th
plan (2012)
54.4
41.2
34
13.9 13.47.6 5.6 4.9 4 4
10
� Renewable Energy capacity in India has grown 6 times in last 10 years
� India attracted $4 billion in private investments for clean energy, ranked 10th among theG-20 countries.
� Indian RE sector also ranked 10th for five-year growth rates for RE capacity
� Ranked 7th worldwide in the amount of installed RE capacity.
(Source: MNRE, Annual report 2010-11) (Source: Pew Charitable Trusts research, 2010)

India has a large potential for RE
Installed capacity – 18.8 GW (as 31Mar’11)
Source Estimated Potential (GW)
Installed(GW)
as 31Mar’11
Wind Power 48.5 13.18
Biomass & Waste to Energy
23.7 2.67
Small Hydro 15.0 2.95
Solar Power 20-30 0.03
RE Potential in India
Wind Power70.0%
Small Hydro Power15.7%
Biomass & Waste to Power14.2%
(Source: MNRE, Annual report 2010-11)
Solar Power 20-30MW/sq.km
0.03
� Wind energy constitutes largest commercially exploited RE source in India.
� RE capacity is 10-11% of total grid installed capacity base
� Barely 20-22% of the total potential has been tapped excluding solar energy
Today, Solar power is merely 0.2% (32.4 MW) of Grid interactive RE power
But potential of Solar power in India is far more than other RE sources
11
(Source: MNRE, Annual report 2010-11)
14.2%
Solar Power0.2%

Content
� India – The Past and Future
� Indian Govt Infrastructure Focus
� Power Requirement of India�
� Renewable Energy in India
� Solar Energy in India
12

India’s Solar Advantage
Specific Avg Annual Solar Energy Yield (kWh/kWp)
900-1000
1000-1200
1200-1400
1500 -1600
1500-1600
1500-1600
1700-1900
1700-1900
Germany
Japan
China
Spain
Italy
Australia
USA
India
India emerged as the 3rd most attractive country
on overall renewables index and 2nd on solar index
Rank CountryAll
Renewables
Solar Index
Solar PV
Solar CSP
1 China 72 62 67 48
2 USA 67 74 73 77
3 India 63 65 70 53
4 Germany 62 48 66 0
5 Italy 60 58 64 65
(Source: E & Y, All renewables country attractiveness index, May11)
Source: DLR; Fraunhofer Institute; DOE; NREL; Sargent & Lundy; MckinseySolar energy potential is virtually infinite� Daily solar radiation 4-7
kWh/m2� 250-300 sunny days in
a year� 5000 trillion kWh solar
radiation incident in yr
Interesting Statistics� Rajasthan State has the
highest intensity of radiation (6.4 – 6.6 kWh/m2/day)
� 3500Km2 of area in Rajasthan sufficient to produce 750-2100 GW
13
900-1000Germany

Centre & State Govts policy support
Centre Govt even before & afterJNNSM formed various conducivepolicies and regulatory ecosystem
� The Electricity Act (2003)
� The National Tariff Policy (2006)
� The National Electricity Policy (2005)
� Integrated Energy Policy (2006)
� The Energy Conservation Act (2001)
State Govts are also supporting
� State Solar Policies
� Gujarat
� Rajasthan
� Maharashtra, etc.
� Manufacturing Policies and SEZ
Schemes
14
� The Energy Conservation Act (2001)
� Special Incentive Package Scheme
(2007)
Schemes
� Karnataka Semiconductor Policy
� Gujarat Solar SEZ Policy, etc
Assist Private Sector to invest in the solar power and equipment space in India
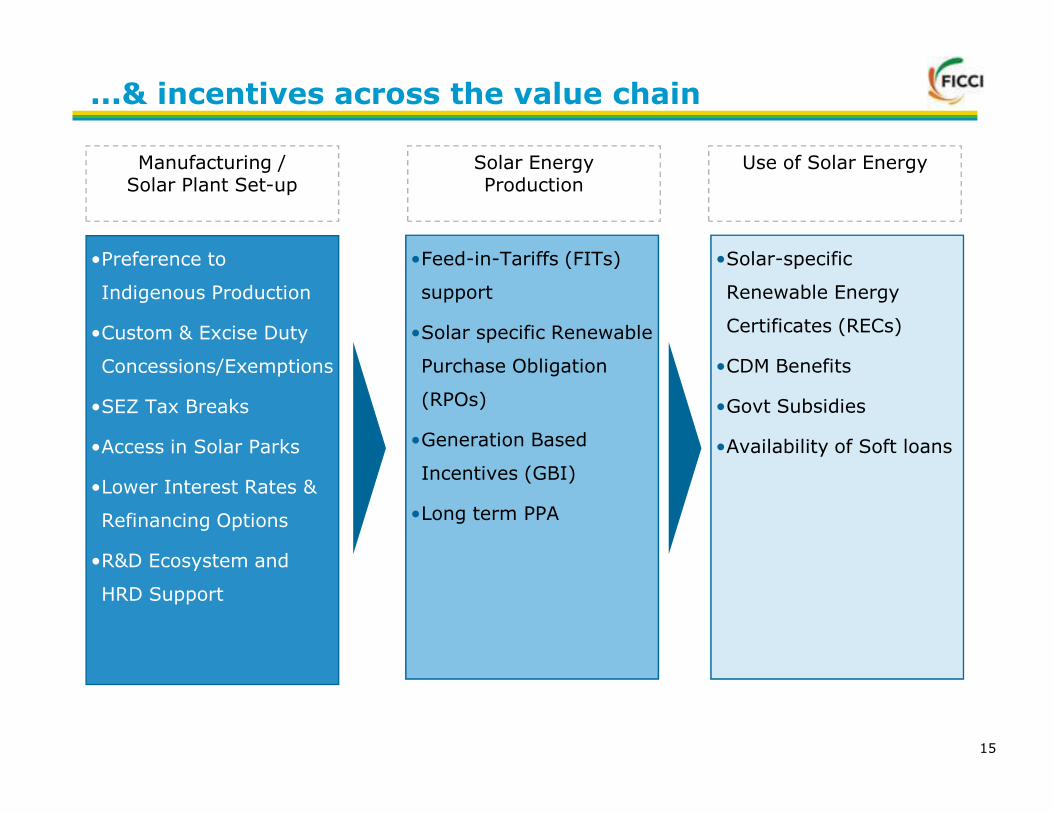
...& incentives across the value chain
•Preference to
Indigenous Production
•Custom & Excise Duty
Concessions/Exemptions
•SEZ Tax Breaks
•Solar-specific
Renewable Energy
Certificates (RECs)
•CDM Benefits
•Govt Subsidies
•Feed-in-Tariffs (FITs)
support
•Solar specific Renewable
Purchase Obligation
(RPOs)
Manufacturing /Solar Plant Set-up
Solar EnergyProduction
Use of Solar Energy
15
•SEZ Tax Breaks
•Access in Solar Parks
•Lower Interest Rates &
Refinancing Options
•R&D Ecosystem and
HRD Support
•Govt Subsidies
•Availability of Soft loans
(RPOs)
•Generation Based
Incentives (GBI)
•Long term PPA

Initiative by GOI to promote Solar Power
Jawaharlal Nehru National Solar Mission
Grid Connected
Rural Electrification
Current
Phase 1
Phase 2
Phase 3
Market S
ize
Cumulativ
e
Solar PV Farm large & small and rooftop
� More than 1860 MW of
capacity already allotted
under various Centre &
State Policy
� These capacity likely to
come up by FY 11-12
� More than Rs. 27000 Cr
(~6 billion US $) of
investments required
Currently….
3.3 GW
1.3 GW
0.3 GW
0.13 GW
2022
2017
2013
2009
*
**
Rural Electrification
Current
Phase 1
Phase 2
Phase 3
Size
Cumulativ
e
Other Off Grid Solutions
* : Remote village electrification program of about 10,000 villages** : 20 Million solar lighting systems for rural areas
16
investments required
� More than 700 MW
capacity to be allotted in
current financial year
� Likely commissioning of
projects by FY 12-13
� About Rs 12000 Cr
(~2.6 billion US $) of
investments required
Next….

India will be the next solar capital of the World
2.0
2.7
15.6
23.2
0.7
5.2
13.1
44.8
68.0
0
10
20
30
40
50
60
70
80
0
5
10
15
20
25
30
35
Cumulative Solar Capacity (GW)
Annual Solar Market (GW)
(Source: KPMG’s Solar Market Potential Model)
17
Till date growth was in Europe
� CAGR of ~ 60% for both CSP & Solar PV technology in the last 5 years in the world
Source: REN21
Next growth will be in India.By 2021-22, cumulative Solar capacity will be 68 GW
Key Drivers� Strong Government support� Decreasing cost of Solar power� Huge Off grid requirement of
Agriculture/Rural segment
00
2011-12 2014-15 2017-18 2020-21 2021-22
Annual Solar Market Cumulative Solar Capacity

Tremendous growth projected in Off-Grid segment
Annual Solar Market Off-take (MW) 17-18 18-19 19-20 20-21 21-22
Grid-connected Solar Potential
Residential Rooftop 1024 1356 3600 5341 7677
Utility Scale Solar Power (CSP and PV) 1043 2229 3570 5084 8146
Off-grid Solar Application Potential
Solar-powered Agriculture Pumpsets 268 563 3969 4639 6730
Solar-powered Telecom Towers 318 380 414 562 612
Total Annual Solar Market 2653 4528 11553 15626 23165
(Source: KPMG in India’s The Rising Sun, May 2011)
18
� With decrease in cost of solar power, the residential rooftop and agriculture will be fastestgrowing segment
� Solar power, with its ability to provide day time power, can meet the agriculture powerdemand from the farmers without being connected to grid
� Solar power is already competitive with the effective price of diesel based power for Telecomtowers. It has potential to replace ~30% of diesel consumption.

Grid parity in next 10 years
Levelized Cost Comparison of Utility-scale PV and Conventional Power at Grid
19
(Source: KPMG’s Solar Grid Parity Model*Note that the CDM benefit of INR 0.60 / KWH has been factored in the Solar Costs)
In India grid parity to happen in 2019-20 when the levelized tariffs from solar power are comparable with the levelized tariffs of grid power

Significant investment opportunity exists
2012-17 2017-22
USB Bn USB Bn
Small Scale Solar Market (Rooftops, Agriculture Pumpsets, Telecom, Solar Lighting)
5 64
Utility-scale Solar Farms (CSP & PV) 15 28
Cumulative Investments in 5 year periods 20 92
Supporting IndustriesSolar Specific Vendor Market
Solar Investments in India
20
2012-17 2017-22
USB Bn USB Bn
Solar PV Segment
Inverter Market 1.8 12.3
Solar CSP Segment
Parabolic Troughts 0.6 1.8
Mirrors 0.4 1.2
Subtotal 1 3
Total 2.8 15.3
2012-17 2017-22
USB Bn USB Bn
Solar PV Segment
EPC Services Market 1.5 7.5
Solar CSP Segment
EPC Service Market 0.5 1.6
Civil Works 0.2 0.6
Subtotal 0.7 2.2
Total 2.2 9.7
Supporting IndustriesSolar Specific Vendor Market
(Source: KPMG’s Solar Market Size Model)

India will be next Manufacturing Hub
Polysilicon Wafering Cells Modules
Capacity(MW)
None Negligible ~ 500-600 ~1000-1200
Moser Baer, Tata BP, Indo Solar, Solar
21
Current Manufacturers
Lanco is setting-up a plant
Maharishi Solar,Lanco are setting up plants
Indo Solar, Solar Semiconductor, Jupiter, Webel, BHEL, BEL, CEL
Thin Films: Moser Baer
More than 40 manufacturers
Investment Opportunity
Very High Very High High Medium

Different financing opportunities as sector evolves
Commercial Banks
NSM
States
RPO
Near Term Medium Term Long Term
FY 11- 13 FY 14-17 FY 18-22
Phase-1 Phase-2 Phase-3
Gujarat Policy Other State Policies
Launch RPO /REC Increasing RPO% 3% Solar RPO by 2022
22
FI such as IREDA
International Development banks/agencies
Govt Lending/Subsidies
Private Equity/VC
Public Markets
Very high Medium Low Very low High
Source: EY Analysis, presented at Global Solar Investment Summit, Apr11, Mumbai
Above is a qualitative view on the level of different types of financing as the solar sector evolves in India

Concluding Remarks
� India’s solar potential among highest in the World and barely a fraction of
it has been exploited.
� Sufficient demand generated through Govt support - JNNSM & States
policies.
� Tremendous growth opportunity exists in Off-Grid segment.
� Plethora of opportunities along the entire manufacturing value chain and
ecosystem as current capacities are insufficient to meet the growing
demand.
23
demand.
� Cost reduction through economies of scale in manufacturing/projects is
possible
Solar Power is the solution to India’s growing needs

24


![Untitled-2 [ficci.in]ficci.in/events/23926/Add_docs/Brochure-HR-Summit-2018.pdf · force organizations to re-tool their operating philosophy and their organization design. Parallelly,](https://img.dokumen.tips/doc/110x75/602bcd8dbae0f7469c6bb4c0/untitled-2-ficciinficciinevents23926adddocsbrochure-hr-summit-2018pdf.jpg)