Embed Size (px)
Citation preview


1

32
2
54
4
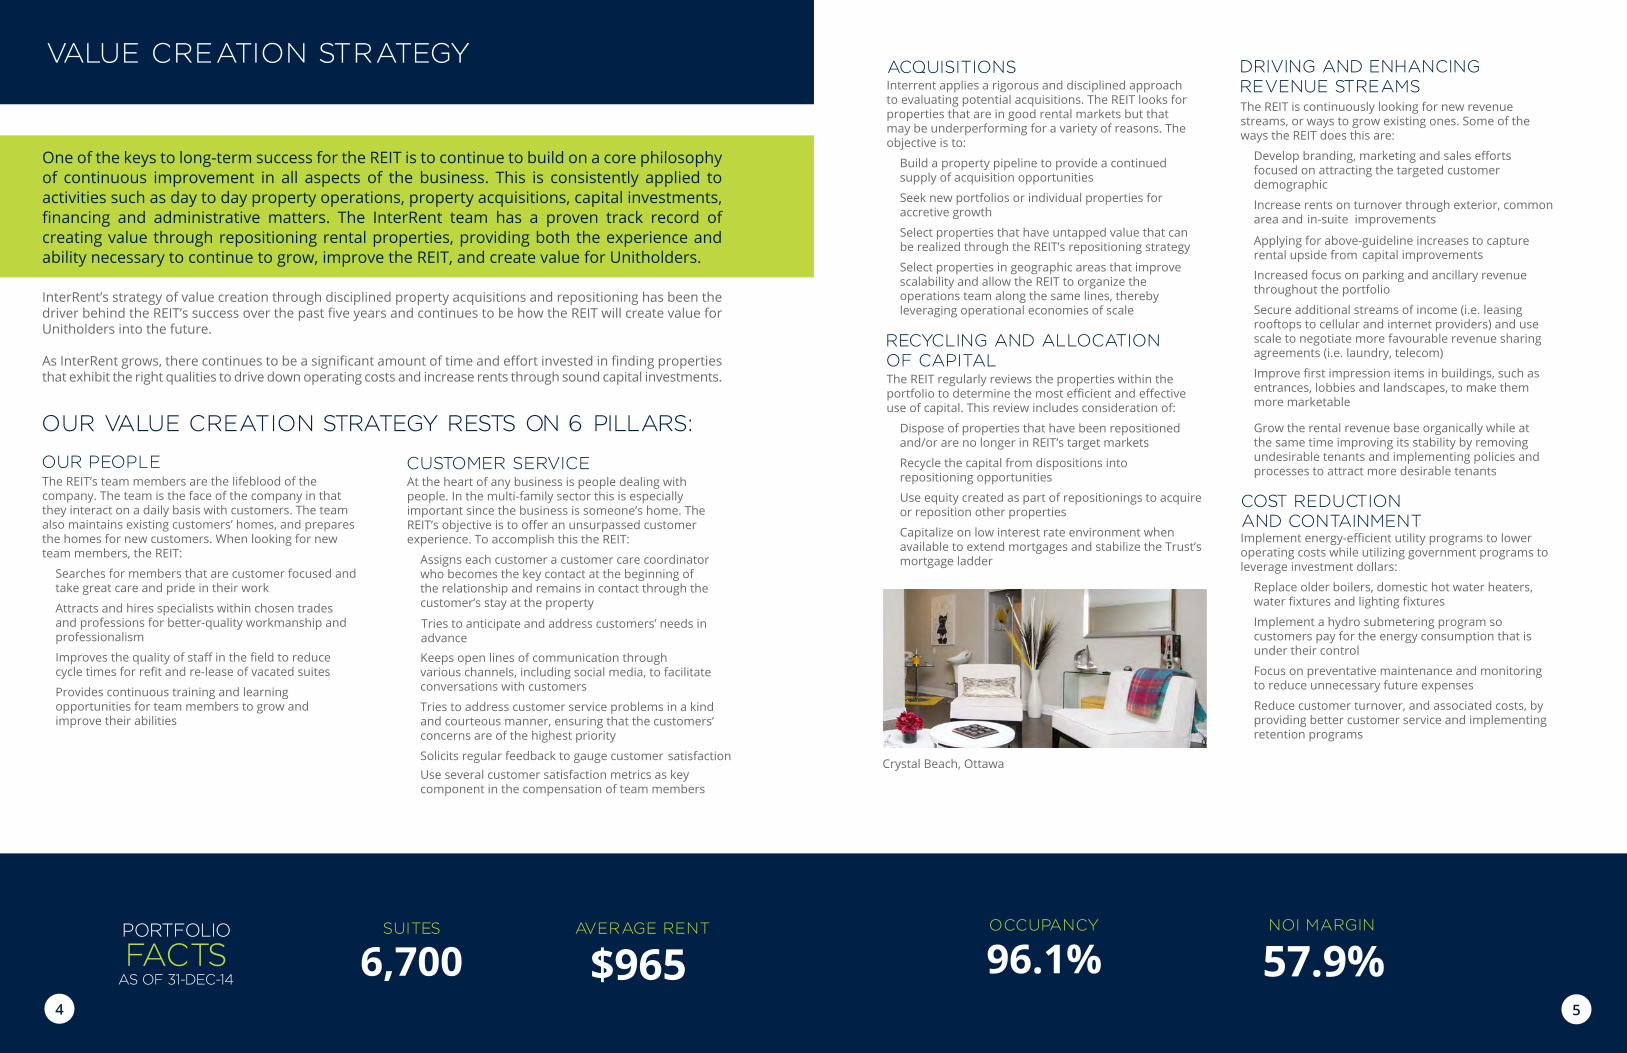
Interrent applies a rigorous and disciplined approach to evaluating potential acquisitions. The REIT looks for properties that are in good rental markets but that may be underperforming for a variety of reasons. The objective is to:
Build a property pipeline to provide a continued supply of acquisition opportunities
Seek new portfolios or individual properties for accretive growth
Select properties that have untapped value that can be realized through the REIT’s repositioning strategy
Select properties in geographic areas that improve scalability and allow the REIT to organize the operations team along the same lines, thereby leveraging operational economies of scale
ACQUISIT IONS
The REIT’s team members are the lifeblood of the company. The team is the face of the company in that they interact on a daily basis with customers. The team also maintains existing customers’ homes, and prepares the homes for new customers. When looking for new team members, the REIT:
Searches for members that are customer focused and take great care and pride in their work
Attracts and hires specialists within chosen trades and professions for better-quality workmanship and professionalism
Improves the quality of staff in the field to reduce cycle times for refit and re-lease of vacated suites
Provides continuous training and learning opportunities for team members to grow and improve their abilities
OUR PEOPLE
Implement energy-efficient utility programs to lower operating costs while utilizing government programs to leverage investment dollars:
Replace older boilers, domestic hot water heaters, water fixtures and lighting fixtures
Implement a hydro submetering program so customers pay for the energy consumption that is under their control
Focus on preventative maintenance and monitoring to reduce unnecessary future expenses
Reduce customer turnover, and associated costs, by providing better customer service and implementing retention programs
COST REDUCTION AND CONTAINMENT
The REIT regularly reviews the properties within the portfolio to determine the most efficient and effective use of capital. This review includes consideration of:
Dispose of properties that have been repositioned and/or are no longer in REIT’s target markets
Recycle the capital from dispositions into repositioning opportunities
Use equity created as part of repositionings to acquire or reposition other properties
Capitalize on low interest rate environment when available to extend mortgages and stabilize the Trust’s mortgage ladder
RECYCLING AND ALLOCATIONOF CAPITAL
$965AVERAGE RENT
4
Grow the rental revenue base organically while at the same time improving its stability by removing undesirable tenants and implementing policies and processes to attract more desirable tenants
Crystal Beach, Ottawa

66 7
NOI per Suite - Stabilized
6,57
7
4,22
0
5,47
7
6,22
6 6,41
6
2012 201320112010 2014
Average Monthly Rent
2012 2013201120102009
$ 76
9
$ 80
5
$ 84
3 $ 88
7
$ 93
1
All Suites Stabilized
$ 78
7
$ 81
6
$ 84
7 $ 88
7 $ 91
02014
$ 96
5
$ 95
3
Average Monthly Vacancy
2012 2013201120102009
7.6%
3.7%
3.4%
2.2%
3.6%
All Suites Stabilized
6.7%
3.3%
3.3%
3.4%
2.2%
2014
3.9%
3.5%
2.4xI NTEREST
COVERAGE RAT IO
6
88 9

1110
10
NIAGARAFALLS (1)
69
ST. CATHARINES
(2)
259
MISSISSAUGA (4)
524
1,343WESTERN ONTARIO
517EASTERN ONTARIO
NATIONAL CAPITAL REGION
1,787HAMILTON/ NIAGARA
1,005
NORTHERN ONTARIO
349
1312
12
`
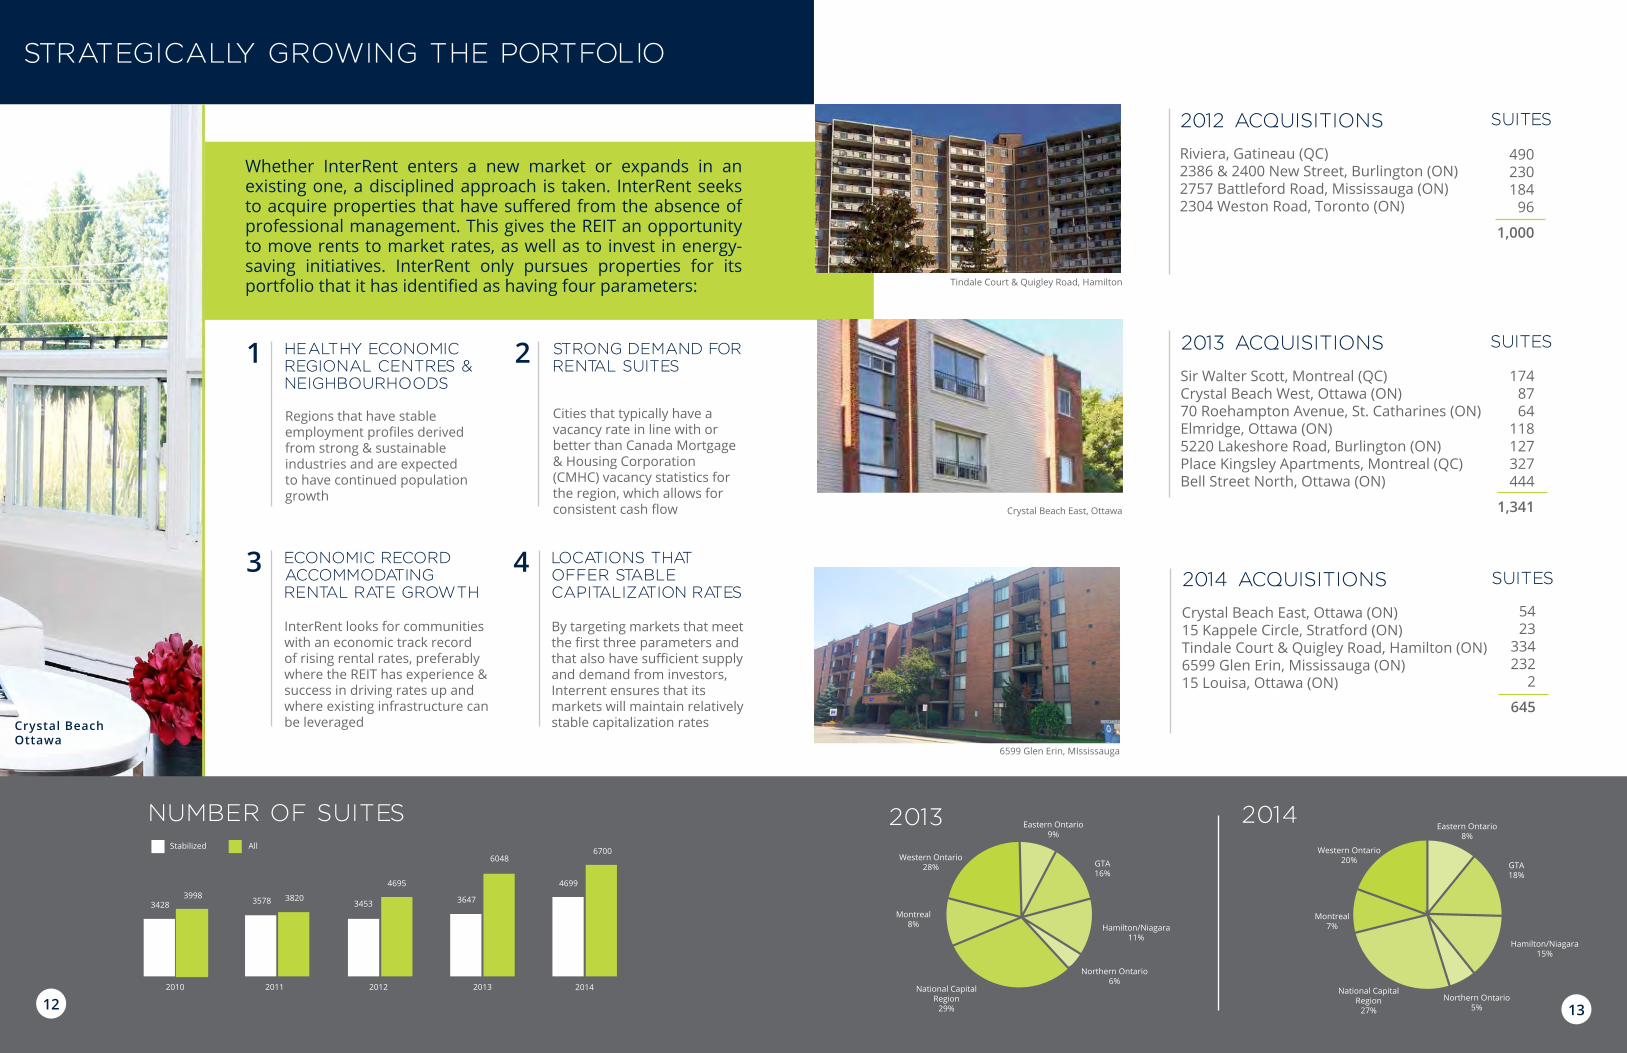
Crystal Beach East, Ottawa (ON)15 Kappele Circle, Stratford (ON)Tindale Court & Quigley Road, Hamilton (ON)6599 Glen Erin, Mississauga (ON)15 Louisa, Ottawa (ON)
2014 ACQUISIT IONS
5423
334232
2
645
SUITES
12

1414 15

1716
16
COMMON AREA UPGRADES
2
• Energy-efficient lighting
• Designer finishes
• Added functionality
• Inviting first impressions
• Enhanced security

1918
GREEN IN IT IATIVES

2120
20
Before After
Before After
Before After

2322
22
InterRent and CLV Group have participated in the Ottawa Dragonboat Festival for the past four years. All proceeds go to various local charities around Ottawa.
OTTAWA DRAGONBOAT FESTIVAL
In 2013, InterRent introduced a Scholarship Program to help the children of employees pursue post-secondary studies.
INTERRENT SCHOLARSHIP PROGRAM
SUMMER FRIDAY BBQS
Every Friday, the staff of InterRent and CLV Group gather outside for a staff BBQ (or inside for a pizza day if it is raining). 100% of the profits raised goes to local charities.
For the last two years, InterRent REIT and CLV Group have participated in fitness classes during the month of October to raise funds in support of Breast Cancer Action.
BREAST CANCER ACTION
THE BOYS & G IRLS CLUBS OF CANADA
25

2626 27
2928
28
2
FORWARD-LOOKING STATEMENTS Caution Regarding Forward-Looking Statements
This Management's Discussion and Analysis (“MD&A”) of InterRent Real Estate Investment Trust (“InterRent REIT” or the “Trust”) contains “forward-looking statements” within the meaning of applicable securities legislation. This document should be read in conjunction with material contained in the Trust’s audited consolidated financial statements for the year ended December 31, 2014 along with InterRent REIT’s other publicly filed documents. Forward-looking statements appear in this MD&A under the heading “Outlook” and generally include, but are not limited to, statements with respect to management’s beliefs, plans, estimates and intentions, and similar statements concerning anticipated future events, results circumstances, performance or expectations, including but not limited to financial performance and equity or debt offerings, new markets for growth, financial position, comparable multi-residential REITs and proposed acquisitions. Generally, these forward-looking statements can be identified by the use of forward-looking terminology such as “plans”, “expects” or “does not expect”, “is expected”, “budget”, “scheduled”, “estimates”, “forecasts”, “intends”, “anticipates” or “does not anticipate”, or “believes”, or variations of such words and phrases or statements that certain actions, events or results “may”, “could”, “would”, “might” or “will be taken”, “occur” or “be achieved”.
Forward-looking statements are subject to known and unknown risks, uncertainties and other factors that may cause the actual results, level of activity, performance or achievements of InterRent REIT to be materially different from those expressed or implied by such forward-looking statements, including but not limited to: the risks related to the market for InterRent REIT’s securities, the general risks associated with real property ownership and acquisition, that future accretive acquisition opportunities will be identified and/or completed by InterRent REIT, risk management, liquidity, debt financing, credit risk, competition, general uninsured losses, interest rate fluctuations, environmental matters, restrictions on redemptions of outstanding InterRent REIT securities, lack of availability of growth opportunities, diversification, potential unitholder liability, potential conflicts of interest, the availability of sufficient cash flow, fluctuations in cash distributions, the market price of InterRent REIT’s trust units, the failure to obtain additional financing, dilution, reliance on key personnel, changes in legislation, failure to obtain or maintain mutual fund trust status and delays in obtaining governmental approvals or financing as well as those additional factors discussed in the section entitled “Risks and Uncertainties” and in other sections of this Management’s Discussion and Analysis.
In addition, certain material assumptions are applied by the Trust in making forward looking statements including, without limitation, factors and assumptions regarding;
Overall national economic activity Regional economic factors, such as employment rates Inflationary/deflationary factors Long, medium and short term interest rates Availability of financing Housing starts
Although the forward-looking information contained herein is based upon what management believes are reasonable assumptions, there can be no assurance that actual results will be consistent with these forward-looking statements. InterRent REIT has attempted to identify important factors that could cause actual results to differ materially from those contained in forward-looking statements, however there may be other factors that cause results not to be as anticipated, estimated or intended. There can be no assurance that such statements will prove to be accurate, as actual results and future events could differ materially from those anticipated in such statements. Accordingly, readers should not place undue reliance on forward-looking statements. InterRent REIT does not undertake to update any forward-looking statements that are incorporated by reference herein, except in accordance with applicable securities laws.
Certain statements included herein may be considered “financial outlook” for purposes of applicable securities laws, and such financial outlook may not be appropriate for purposes other than this MD&A.

3030 31
3
INTERRENT REAL ESTATE INVESTMENT TRUST InterRent Real Estate Investment Trust (“InterRent REIT” or the “Trust”) is an unincorporated, open-ended real estate investment trust created pursuant to a Declaration of Trust, dated October 10, 2006, and as amended and restated on June 29, 2007, September 30, 2009 and December 29, 2010 (the “Declaration of Trust” or “DOT”), under the laws of the Province of Ontario. InterRent REIT was created to invest in income producing multi-family residential properties within Canada initially through the acquisition of InterRent International Properties Inc. (the “Corporation”) and of the Silverstone Group by the way of a plan of arrangement (the “Arrangement”) under the Business Corporations Act (Ontario), which was completed on December 7, 2006.
InterRent REIT’s principal objectives are to provide its unitholders (“Unitholders”) with stable and growing monthly cash distributions, partially on a Canadian income tax-deferred basis, and to increase the value of its trust units (the “Units”) through the effective management of its residential multi-family revenue producing properties and the acquisition of additional, accretive properties.
DECLARATION OF TRUST The investment policies of the Trust are outlined in the Trust’s Amended and Restated Declaration of Trust (the “DOT”) dated as of December 29, 2010 and a copy of this document is available on SEDAR (www.sedar.com). Some of the principal investment guidelines and operating policies set out in the DOT are as follows:
INVESTMENT GUIDELINES Focus its activities on acquiring, maintaining, improving and managing multi-unit residential revenue producing
properties.
No single asset shall be acquired if the cost of such acquisition (net of the amount of debt secured by the asset) will exceed 15% of the Trust’s “Gross Book Value” (as such term is defined in the DOT).
Investments in joint ventures are permitted as long as the Trust’s interest is not less than 25%.
No investment will be made that would result in the Trust not qualifying as a “mutual fund trust” as defined in the Income Tax Act (Canada).
OPERATING POLICIES Overall indebtedness not to exceed 75% of Gross Book Value, as defined by the DOT.
For individual properties, the maximum debt capacity not to exceed 75% of its market value, on or after the date which is 12 months from the acquisition date.
No guaranteeing of third party debt except for subsidiaries or wholly-owned entities of the Trust or potential joint venture partner structures.
Third party surveys of structural and environmental conditions are required prior to the acquisition of a revenue producing property.
At December 31, 2014 the Trust was in material compliance with all investment guidelines and operating policies stipulated in the DOT.
4
ACCOUNTING POLICIES InterRent REIT’s accounting policies are described in note 3 of the audited consolidated financial statements for the years ended December 31, 2014 and 2013.
In applying these policies, in certain cases it is necessary to use estimates, which management determines using information available to the Trust at the time. Management reviews key estimates on a quarterly basis to determine their appropriateness and any change to these estimates is applied prospectively in compliance with IFRS. Significant estimates are made with respect to the fair values of investment properties and the fair values of financial instruments.
NON-GAAP MEASURES Funds from Operations, Adjusted Funds from Operations, Net Operating Income and EBITDA (or, in each case, substantially similar terms) are measures sometimes used by Canadian real estate investment trusts as indicators of financial performance, however they do not have standardized meanings prescribed by IFRS (GAAP). These measures may differ from similar computations as reported by other real estate investment trusts and, accordingly, may not be comparable to similarly termed measures reported by other such issuers.
Funds from Operations (“FFO”) is a financial measure which should not be considered as an alternative to net income, cash flow from operations, or any other operating or liquidity measure prescribed under GAAP. The Trust presents FFO in accordance with the Real Property Association of Canada (REALpac) White Paper on Funds from Operations revised April 2014.
Adjusted Funds from Operations (“AFFO”) is presented in this MD&A because management considers this non-GAAP measure to be an important performance indicator in determining the sustainability of future distributions to Unitholders. AFFO begins with FFO and removes the effect of certain non-cash income and expense items and adds a provision for maintenance capital expenditures. AFFO should not be interpreted as an indicator of cash generated from operating activities as it does not consider changes in working capital. A reconciliation of cash flows provided by operating activities to AFFO is presented under “Performance Measures”. Net Operating Income (“NOI”) is a key measure of operating performance used in the real estate industry and includes all rental revenues generated at the property level, less related direct costs such as utilities, realty taxes, insurance and on-site maintenance wages and salaries. As one of the factors that may be considered relevant by readers, management believes that NOI is a useful supplemental measure that may assist prospective investors in assessing the Trust.
Earnings Before Interest, Taxes, Depreciation and Amortization (“EBITDA”) is calculated as earnings before interest, taxes, depreciation, amortization and other adjustments including gain/loss on sale and fair value adjustments.
Readers are cautioned that FFO, AFFO, NOI and EBITDA are not alternatives to measures under GAAP and should not, on their own, be construed as indicators of the Trust's performance or cash flows, measures of liquidity or as measures of actual return on Units of the Trust. These non-GAAP measures, as presented, should only be used in conjunction with the consolidated financial statements of the Trust. As a result of the redeemable feature of the Trust Units, the Trust’s Units are defined as a financial liability and not considered an equity instrument. Therefore no denominator exists to calculate per unit calculations. Consequently, all per unit calculations are considered non-GAAP measures. Management feels that certain per unit calculations are an important method of measuring results from period to period and as such has determined basic and diluted weighted average number of units. Per unit calculations as computed by the Trust may differ from similar computations as reported by other real estate investment trusts and, accordingly, may not be comparable to other such issuers.
3232 33
5
OVERVIEW BUSINESS OVERVIEW AND STRATEGY InterRent REIT is a growth-oriented real estate investment trust engaged in increasing Unitholder value and creating a growing and sustainable distribution through the acquisition and ownership of multi-residential properties. The REIT generates revenues, cash flows and earnings from rental operations and from the sale of revenue producing properties. InterRent REIT’s largest and most consistent source of income is its rental operations, which involves leasing individual suites to tenants for lease terms generally ranging from month-to-month to twelve-months.
InterRent's strategy is to expand its portfolio primarily within markets that have exhibited stable market vacancies, sufficient suites available to attain the critical mass necessary to implement an efficient portfolio management structure and, offer opportunities for accretive acquisitions.
InterRent's primary objective is to use the proven industry experience of the Trustees, management and operational team to: (i) provide Unitholders with stable and growing cash distributions from investments in a diversified portfolio of multi-residential properties; (ii) enhance the value of the assets and maximize long-term Unit value through the active management of such assets; and (iii) expand the asset base and increase Distributable Income through accretive acquisitions.
The REIT spent 2010 and 2011 focused on repositioning its portfolio of properties, hiring the right resources, training its team and ensuring the core beliefs of customer service and creation of value were firmly entrenched within the organization. With the repositioning well in-hand by the beginning of 2012, the focus shifted to finding good quality properties where the REIT could drive down operating costs while increasing rents through sound capital investment, good management and exceptional customer service. As a result of the focus on accretive, sustainable growth, the REIT was able to acquire 1,000 suites in 2012, 1,341 in 2013, 645 in 2014 and looks to continue to add to the portfolio. The team we have assembled has a proven track record and we believe we have both the experience and ability necessary to execute on our growth strategy in the years to come.
OUTLOOK Management is focused on growing InterRent REIT in a strategic and structured manner. In addition to the acquisitions
completed to date, management is working on numerous opportunities and believes it can continue to find similar accretive acquisitions. In line with this, the Trust has purchased:
o A 393 suite complex consisting of 1 high-rise, 2 low-rises, 130 townhomes and almost 3 acres of vacant land, situated in Ottawa, Ontario. This transaction is scheduled to close in April 2015.
o A 286 suite complex consisting of 8 low-rises, 27 townhomes, 20 duplexes and 1 home, situated in Ottawa, Ontario. This transaction is scheduled to close in April 2015.
o A 280 suite high-rise situated in Cote Saint-Luc on the Island of Montreal. This transaction is scheduled to close in March 2015.
The Bell Street property is a major project and one of the key components of this project has been to completely vacate the building. With the building vacant, the REIT is able to more effectively and systematically implement our redevelopment program which includes addressing all aspects of the building systems as well as the building envelope. Also, the lease-up phase of the redevelopment will allow the REIT to capture market rents and roll out the hydro submetering program more quickly. The REIT expects to be in a position to have tenants move into the building in the second quarter of 2015.
At December 31, 2014, there were 4,346 suites within the REIT’s portfolio that had the infrastructure in place to track hydro consumption at a suite level in order to be able to pass on these charges to tenants. The 4,346 suites consists of: a) 1,520 suites where hydro is paid by the tenant directly to the local utility; b) 1,485 suite where hydro is paid by the tenant to the REIT (submeters); and, c) 1,341 suites that are equipped with sub-meters and will be moved onto hydro
6
extra leases when the suites turnover. Furthermore, the REIT intends to roll-out the hydro submeter infrastructure to an additional 938 suites within the existing portfolio in 2015.
There are two ways to capture the upside from the capital invested in the REIT’s repositioning programs. The first way is through achieving market rent on suite turnover and the second way is through above guideline increases (AGIs) for existing tenants. The REIT has $0.7 million in annualized rental increases remaining to be rolled out based on previously filed applications. Of the $0.7 million in AGIs planned, approximately $0.4 million should will rolled out in 2015, $0.2 million in 2016 and $0.1 million in 2017.
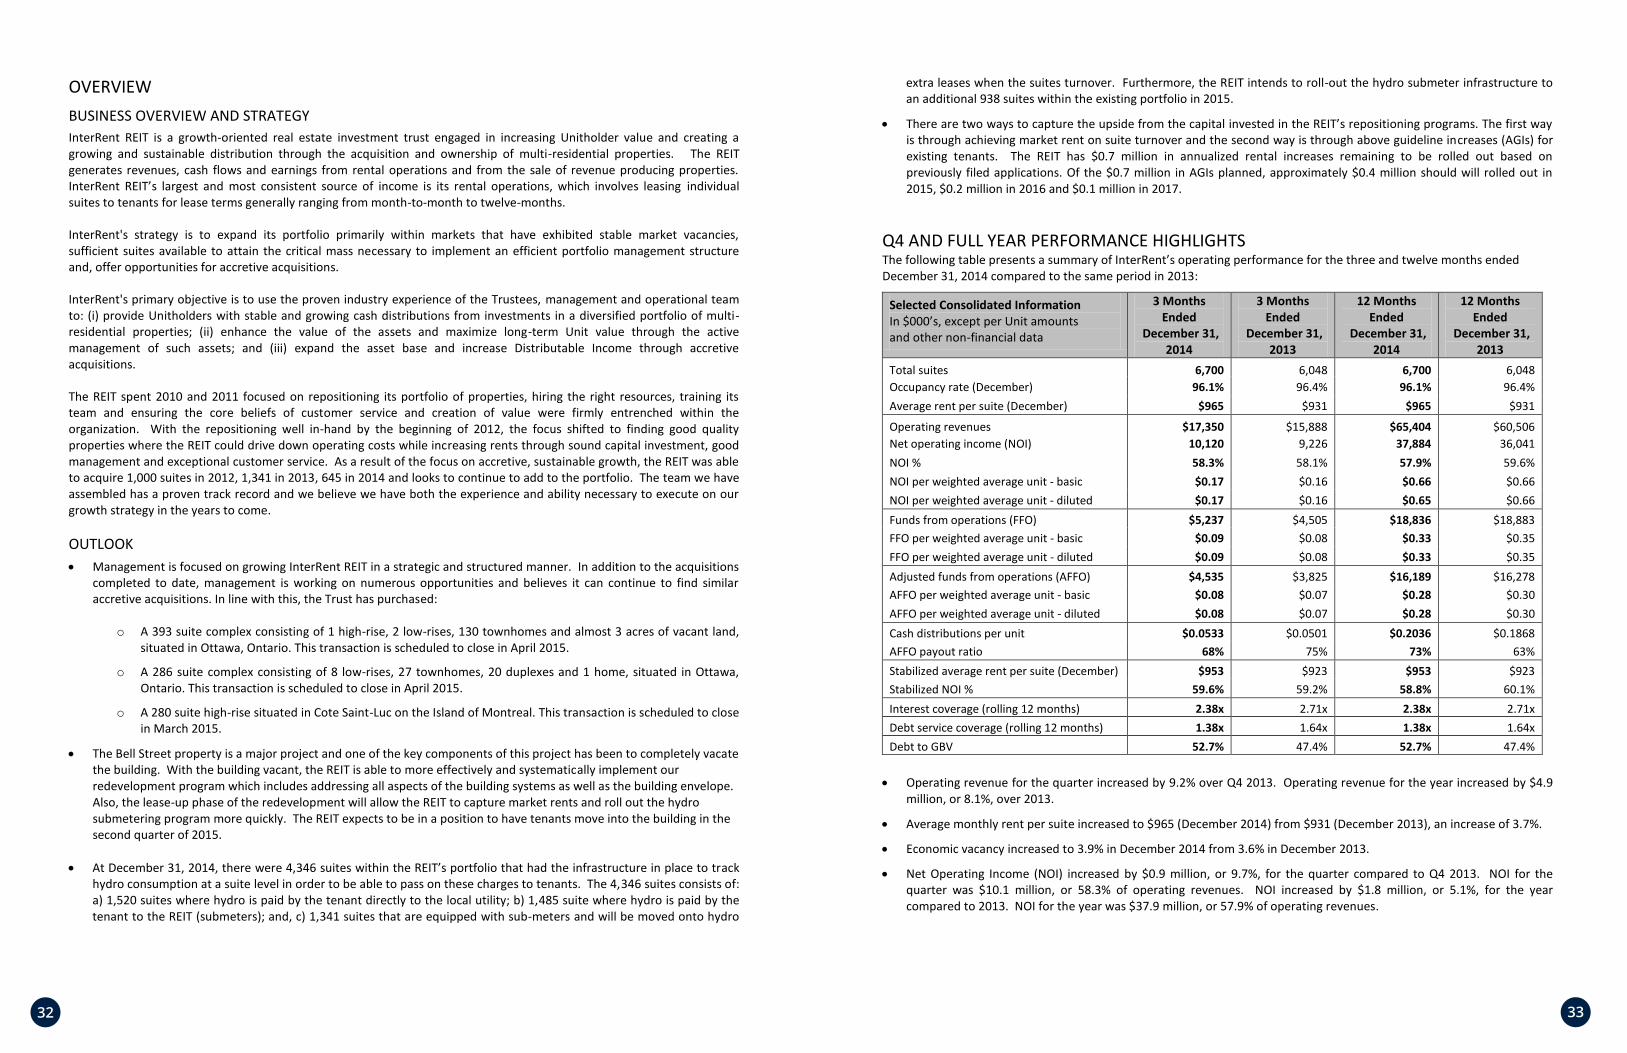
Q4 AND FULL YEAR PERFORMANCE HIGHLIGHTS The following table presents a summary of InterRent’s operating performance for the three and twelve months ended December 31, 2014 compared to the same period in 2013:
Selected Consolidated Information In $000’s, except per Unit amounts and other non-financial data
3 Months Ended
December 31, 2014
3 Months Ended
December 31, 2013
12 Months Ended
December 31, 2014
12 Months Ended
December 31, 2013
Total suites 6,700 6,048 6,700 6,048 Occupancy rate (December) 96.1% 96.4% 96.1% 96.4% Average rent per suite (December) $965 $931 $965 $931
Operating revenues $17,350 $15,888 $65,404 $60,506 Net operating income (NOI) 10,120 9,226 37,884 36,041 NOI % 58.3% 58.1% 57.9% 59.6% NOI per weighted average unit - basic $0.17 $0.16 $0.66 $0.66 NOI per weighted average unit - diluted $0.17 $0.16 $0.65 $0.66 Funds from operations (FFO) $5,237 $4,505 $18,836 $18,883 FFO per weighted average unit - basic $0.09 $0.08 $0.33 $0.35 FFO per weighted average unit - diluted $0.09 $0.08 $0.33 $0.35 Adjusted funds from operations (AFFO) $4,535 $3,825 $16,189 $16,278 AFFO per weighted average unit - basic $0.08 $0.07 $0.28 $0.30 AFFO per weighted average unit - diluted $0.08 $0.07 $0.28 $0.30 Cash distributions per unit $0.0533 $0.0501 $0.2036 $0.1868 AFFO payout ratio 68% 75% 73% 63% Stabilized average rent per suite (December) $953 $923 $953 $923 Stabilized NOI % 59.6% 59.2% 58.8% 60.1% Interest coverage (rolling 12 months) 2.38x 2.71x 2.38x 2.71x Debt service coverage (rolling 12 months) 1.38x 1.64x 1.38x 1.64x Debt to GBV 52.7% 47.4% 52.7% 47.4%
Operating revenue for the quarter increased by 9.2% over Q4 2013. Operating revenue for the year increased by $4.9 million, or 8.1%, over 2013.
Average monthly rent per suite increased to $965 (December 2014) from $931 (December 2013), an increase of 3.7%.
Economic vacancy increased to 3.9% in December 2014 from 3.6% in December 2013.
Net Operating Income (NOI) increased by $0.9 million, or 9.7%, for the quarter compared to Q4 2013. NOI for the quarter was $10.1 million, or 58.3% of operating revenues. NOI increased by $1.8 million, or 5.1%, for the year compared to 2013. NOI for the year was $37.9 million, or 57.9% of operating revenues.
3434 35
7
Stabilized NOI increased by 4.6% to $8.0 million for the quarter, or 59.6% of operating revenues, compared to $7.6 million, or 59.2%, for Q4 2013. For the year, Stabilized NOI increased by 0.4% to $30.9 million or 58.8% of operating revenues, compared to $30.8 million, or 60.1%, for 2013.
Funds From Operations (FFO) for the quarter increased by $0.7 million, or 16.3%, to $5.2 million compared to $4.5 million for Q4 2013. For the year, FFO decreased by $0.1 million, or 0.2%, to $18.8 million compared to $18.9 million for 2013.
Adjusted Funds From Operations (AFFO) for the quarter increased by $0.7 million, or 18.6%, to $4.5 million compared to $3.8 million for Q4 2013. For the year, AFFO decreased by $0.1 million, or 0.5%, to $16.2 million compared to $16.3 million for 2013.
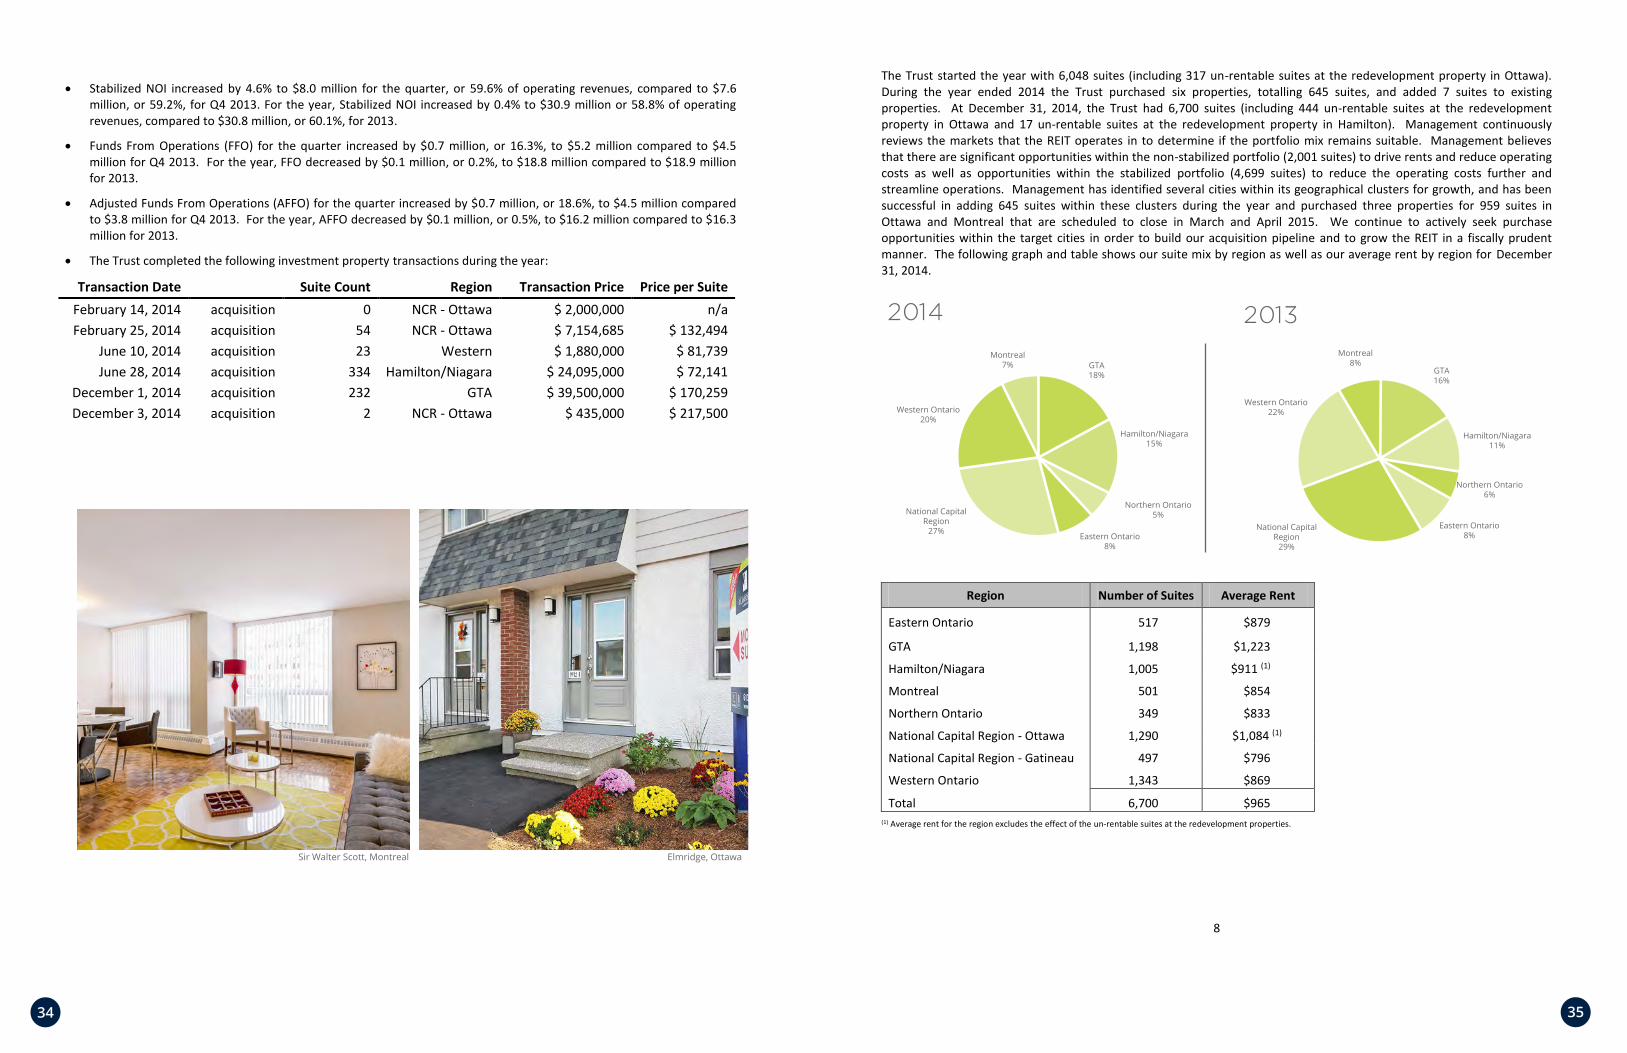
The Trust completed the following investment property transactions during the year:
Transaction Date Suite Count Region Transaction Price Price per Suite
February 14, 2014 acquisition 0 NCR - Ottawa $ 2,000,000 n/a February 25, 2014 acquisition 54 NCR - Ottawa $ 7,154,685 $ 132,494
June 10, 2014 acquisition 23 Western $ 1,880,000 $ 81,739 June 28, 2014 acquisition 334 Hamilton/Niagara $ 24,095,000 $ 72,141
December 1, 2014 acquisition 232 GTA $ 39,500,000 $ 170,259 December 3, 2014 acquisition 2 NCR - Ottawa $ 435,000 $ 217,500
The Trust completed the build out of 7 additional suites during the year.
8
PORTFOLIO SUMMARY The Trust started the year with 6,048 suites (including 317 un-rentable suites at the redevelopment property in Ottawa). During the year ended 2014 the Trust purchased six properties, totalling 645 suites, and added 7 suites to existing properties. At December 31, 2014, the Trust had 6,700 suites (including 444 un-rentable suites at the redevelopment property in Ottawa and 17 un-rentable suites at the redevelopment property in Hamilton). Management continuously reviews the markets that the REIT operates in to determine if the portfolio mix remains suitable. Management believes that there are significant opportunities within the non-stabilized portfolio (2,001 suites) to drive rents and reduce operating costs as well as opportunities within the stabilized portfolio (4,699 suites) to reduce the operating costs further and streamline operations. Management has identified several cities within its geographical clusters for growth, and has been successful in adding 645 suites within these clusters during the year and purchased three properties for 959 suites in Ottawa and Montreal that are scheduled to close in March and April 2015. We continue to actively seek purchase opportunities within the target cities in order to build our acquisition pipeline and to grow the REIT in a fiscally prudent manner. The following graph and table shows our suite mix by region as well as our average rent by region for December 31, 2014.
(1) Average rent for the region excludes the effect of the un-rentable suites at the redevelopment properties.
Region Number of Suites Average Rent
Eastern Ontario 517 $879
GTA 1,198 $1,223
Hamilton/Niagara 1,005 $911 (1)
Montreal 501 $854
Northern Ontario 349 $833
National Capital Region - Ottawa 1,290 $1,084 (1) National Capital Region - Gatineau 497 $796
Western Ontario 1,343 $869
Total 6,700 $965
3636 37
9
ANALYSIS OF OPERATING RESULTS The current and prior period consolidated income statement, and analysis of operating results, does not separately disclose the results from assets held for sale as discontinued operations. Management’s position is that the disposal of a property or the classification of a property as held for sale does not constitute a discontinued operation.
In $ OOO's
3 Months Ended December 31,
2014
3 Months Ended December 31,
2013
12 Months Ended December 31,
2014
12 Months Ended December 31,
2013 Gross rental revenue $17,461 $16,020 $66,088 $60,344 Less: vacancy & rebates (949) (831) (3,946) (2,722) Other revenue 838 699 3,262 2,884
Operating revenues $17,350 $15,888 $65,404 $60,506 Expenses Property operating costs 2,937 16.9% 2,692 16.9% 11,518 17.6% 10,169 16.8%
Property taxes 2,301 13.3% 2,072 13.1% 8,867 13.6% 7,978 13.2%
Utilities 1,992 11.5% 1,898 11.9% 7,135 10.9% 6,318 10.4%
Operating expenses $7,230 41.7% $6,662 41.9% $27,520 42.1% $24,465 40.4%
Net operating income $10,120 $9,226 $37,884 $36,041 Net operating margin 58.3% 58.1% 57.9% 59.6%
REVENUE Gross rental revenue for the year ended December 31, 2014 increased 9.5% to $66.1 million compared to $60.3 million for the year ended December 31, 2013. Operating revenue for the year was up $4.9 million to $65.4 million, or 8.1% compared to the prior year. The Trust had 6,700 suites at the end of 2014 as compared to 6,048 at the end of 2013, a net increase of 652 suites (both numbers include the 444 un-rentable suites at the redevelopment property Ottawa and 17 un-rentable suites at the redevelopment property in Hamilton). The redevelopment property acquired in May 2013 contributed $0.1 million in operating revenue for the year ended December 31, 2014 compared to $1.5 million in 2013.
The average monthly rent for December 2014 increased to $965 per suite from $931 (December 2013), an increase of 3.7%. On a stabilized basis, average rent is up $30 per suite (or 3.3%) over December 2013. The overall increase in average rent is a result of changes to the stabilized properties as well as the change in property mix over the same period in 2013. Management expects to continue to grow rent organically in both the stabilized and non-stabilized properties through moving to market rent on suite turnovers, continued roll-out of guideline increases and AGIs, as well as continuing to drive other ancillary revenue streams such as parking, laundry, locker rentals and cable and telecom. The REIT has submitted applications to the Landlord and Tenant Board which should result in an increase in rental income of $0.4 million, on an annualized basis, being rolled out by the end of 2015.
InterRent REIT has been successful in maintaining rent levels while at the same time passing on hydro sub-metering charges to new tenants. The program began in 2011 for select locations and is in the process of being extended to most of the remaining portfolio. Currently, 64% of the portfolio has submetering capabilities in place with a further 15% of the current portfolio planned for 2015.
December 2014 September 2014 June 2014 March 2014 December 2013 Average monthly rents all properties $965 $948 $947 $938 $931 Average monthly rents stabilized properties $953 $947 $936 $927 $923
10
Portfolio Occupancy Overall economic vacancy was 3.9% for December 2014 compared to 3.6% over the same period last year. As part of the ongoing effort to drive rents throughout the portfolio, the vacancy rate on an annual basis is expected to be in the range of 3% to 4%. Going forward, management believes that minor variations in economic vacancy will continue to occur from one quarter to another given the seasonal nature of rental activity. The rental growth objectives are being achieved as a direct result of:
1. marketing geared to the right tenant profile; 2. ensuring that properties are well maintained, landscaped and decorated so as to be visually appealing (“curb
appeal”); 3. ensuring suites are properly repaired and maintained before being rented to new tenants; 4. more selective of the tenants it rents to (part of a more stringent screening criteria and credit review process);
and, 5. ensuring that operations are running as efficiently and cost effectively as possible to ensure the well-being and
enjoyment of the tenants.
This is part of the Trust’s repositioning strategy to maximize rental revenues, lower operating costs and create value for Unitholders. Management intends to continue to pursue this strategy both within the existing portfolio and as it looks to add new properties within targeted regions.
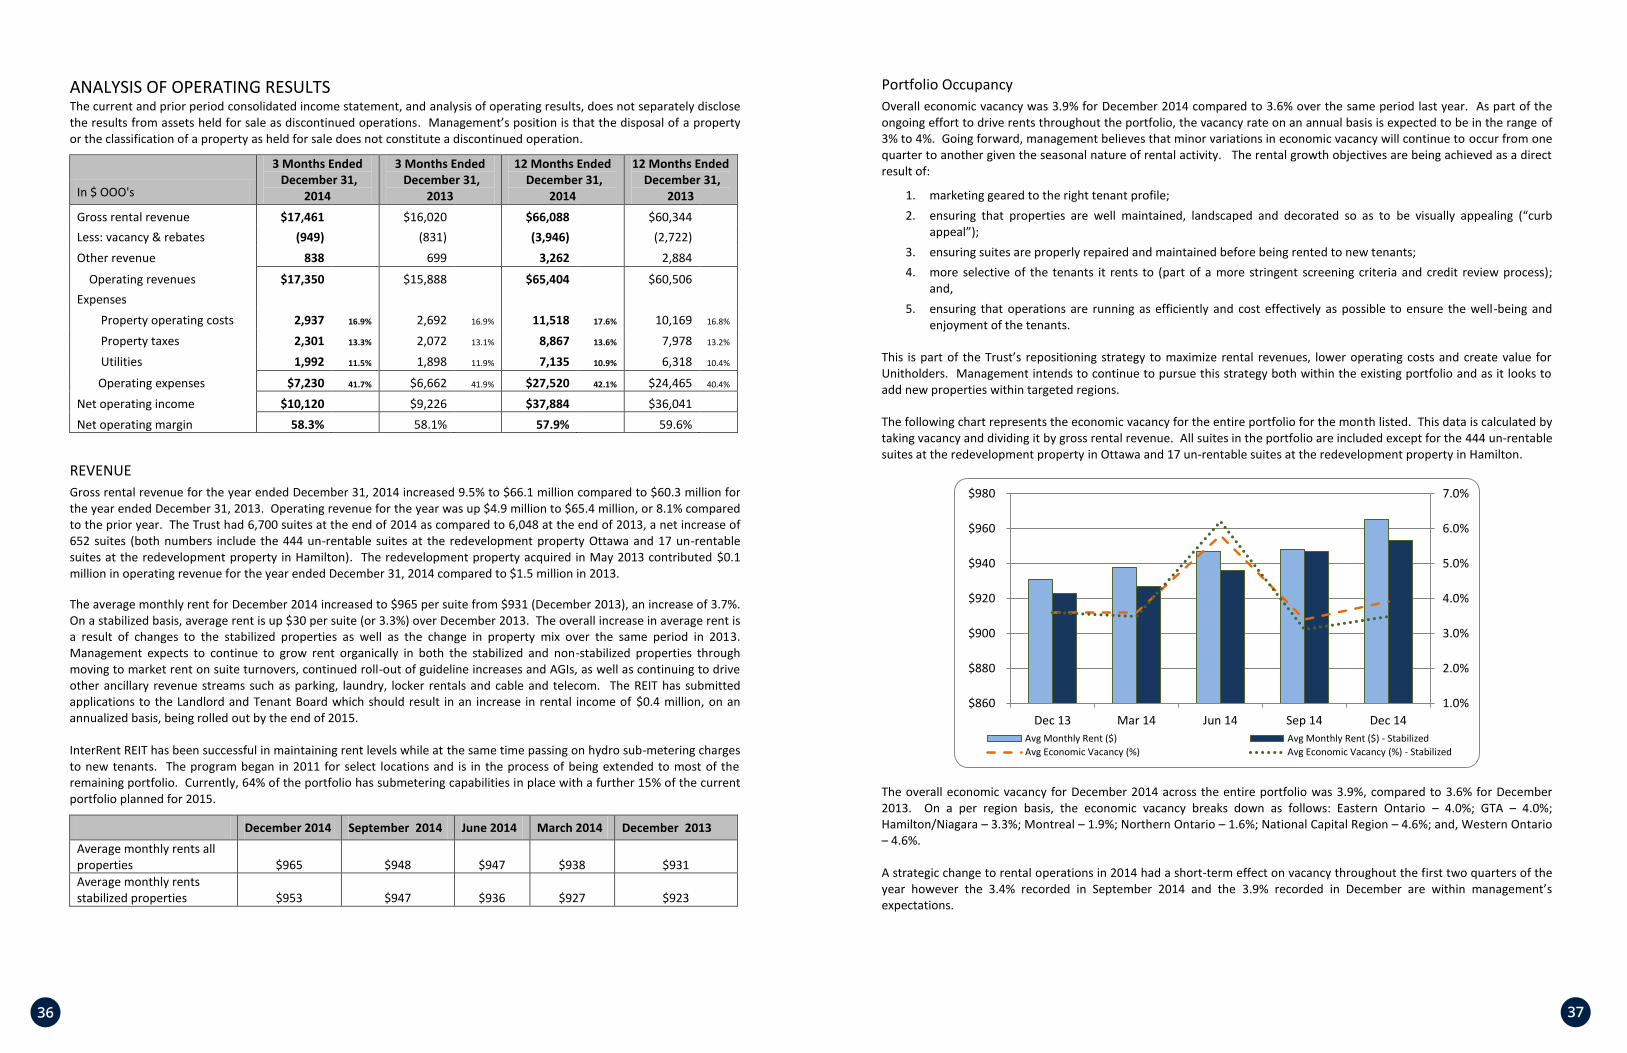
The following chart represents the economic vacancy for the entire portfolio for the month listed. This data is calculated by taking vacancy and dividing it by gross rental revenue. All suites in the portfolio are included except for the 444 un-rentable suites at the redevelopment property in Ottawa and 17 un-rentable suites at the redevelopment property in Hamilton.
The overall economic vacancy for December 2014 across the entire portfolio was 3.9%, compared to 3.6% for December 2013. On a per region basis, the economic vacancy breaks down as follows: Eastern Ontario – 4.0%; GTA – 4.0%; Hamilton/Niagara – 3.3%; Montreal – 1.9%; Northern Ontario – 1.6%; National Capital Region – 4.6%; and, Western Ontario – 4.6%.
A strategic change to rental operations in 2014 had a short-term effect on vacancy throughout the first two quarters of the year however the 3.4% recorded in September 2014 and the 3.9% recorded in December are within management’s expectations.
1.0%
2.0%
3.0%
4.0%
5.0%
6.0%
7.0%
$860
$880
$900
$920
$940
$960
$980
Dec 13 Mar 14 Jun 14 Sep 14 Dec 14Avg Monthly Rent ($) Avg Monthly Rent ($) - StabilizedAvg Economic Vacancy (%) Avg Economic Vacancy (%) - Stabilized
3838 39
11
Other Revenue Other rental revenue for the twelve months ended December 31, 2014 increased 13.1% to $3.3 million compared to $2.9 million for the twelve months ended December 31, 2013. The increased revenues from ancillary sources such as parking, laundry, locker rentals and cable and telecom continues to be a focus as it provides organic revenue growth.
PROPERTY OPERATING COSTS Property operating costs for the investment properties include repairs and maintenance, insurance, caretaking, superintendents’ wages and benefits, property management fees, uncollectible accounts and eviction costs, marketing, advertising and leasing costs.
Property operating costs for the year ended December 31, 2014 amounted to $11.5 million or 17.6% of revenue compared to $10.2 million or 16.8% of revenue for the year ended December 31, 2013. As a percentage of revenue, operating costs increased by 1.2% as compared to 2013. The increase in operating costs are primarily a result of the increased costs of snow removal and associated repairs and maintenance required due to the abnormally cold winter and abundance of snow at the start of 2014 as well as the costs associated with transitioning to a new rental operations model.
PROPERTY TAXES Property taxes for the year ended December 31, 2014 amounted to $8.9 million or 13.6% of revenue compared to $8.0 million or 13.2% of revenue for the year ended December 31, 2013. The $0.9 million increase is mainly attributable to the increases in assessed property values as well as the increase in the number of suites.
The Trust is constantly reviewing property tax assessments for its properties and this active approach shall continue to help drive down costs. Where appropriate, the Trust will appeal individual property assessments.
UTILITY COSTS Utility costs for the year ended December 31, 2014 amounted to $7.1 million or 10.9% of revenue compared to $6.3 million or 10.4% of revenue for the year ended December 31, 2013. As a percentage of operating revenues and on a per suite basis, utility costs have increased over last year due to the cold winter in the first quarter of 2014 in the Trust’s operating regions.
Across the entire portfolio, our hydro sub-metering initiative reduced our utility costs by 8.6%, or $0.7 million for the year.
NET OPERATING INCOME (NOI) NOI for the twelve months ended December 31, 2014 amounted to $37.9 million or 57.9% of operating revenue compared to $36.0 million or 59.6% of operating revenue for the twelve months ended December 31, 2013. The $1.8 million increase in the year is as a result of growing the portfolio and increasing net revenue. On a weighted average per suite basis (excluding the un-rentable suites at the redevelopment properties), NOI increased 3.8% from $6,263 per suite in 2013 to $6,500 per suite in 2014. The NOI for the redevelopment property acquired in May 2013 was ($0.1) million the year ended December 31, 2014 compared to $0.8 million in 2013.
NOI from stabilized properties was $30.9 million, or 58.8% of revenue, and NOI from non-stabilized properties was $7.0 million, or 54.2% of revenue. Management continues to focus on top line revenue growth through acquisitions, suite additions, achieving best in market rents and ancillary revenue as well as operating cost reductions (efficiencies of scale, investment in energy saving initiatives, investments to reduce ongoing operating costs, etc.).
12
STABILIZED PORTFOLIO PERFORMANCE Stabilized properties for the three and twelve months ended December 31, 2014 are defined as all properties owned by the Trust continuously for 24 months, and therefore do not take into account the impact on performance of acquisitions or dispositions completed during the period from January 1, 2013 to December 31, 2014. As at December 31, 2014, the Trust has 4,699 stabilized suites, which represents 70.1% of the overall portfolio.
In $ OOO's
3 Months Ended December 31,
2014
3 Months Ended December 31,
2013
12 Months Ended December 31,
2014
12 Months Ended December 31,
2013 Gross rental revenue $13,403 $12,961 $52,854 $50,845 Less: vacancy & rebates (664) (661) (3,062) (2,164) Other revenue 683 603 2,732 2,501
Operating revenues $13,422 $12,903 $52,524 $51,182 Expenses Property operating costs 2,201 16.4% 2,170 16.8% 9,075 17.3% 8,493 16.6%
Property taxes 1,752 13.0% 1,697 13.2% 7,071 13.5% 6,830 13.4%
Utilities 1,475 11.0% 1,392 10.8% 5,472 10.4% 5,075 9.9%
Operating expenses $5,428 40.4% $5,259 40.8% $21,618 41.2% $20,398 39.9%
Net operating income $7,994 $7,644 $30,906 $30,784 Net operating margin 59.6% 59.2% 58.8% 60.1%
For the three months ended December 31, 2014, operating revenues for stabilized properties increased by 4.0% and operating expenses increased by 3.2% as compared to the same period last year. As a result, stabilized NOI has increased by 0.5% to 59.6% as compared to the same period last year. For the twelve months ended December 31, 2014, operating revenues from stabilized properties increased by 2.6% and operating expenses increased by 6.0% as compared to the same period last year. As a result, stabilized NOI has decreased by 2.2% to 58.8% as compared to last year. The average monthly rent for December 2014 for stabilized properties increased to $953 per suite from $923 (December 2013), an increase of 3.3%. Economic vacancy for December 2014 for stabilized properties was 3.5%, compared to 3.6% for December 2013.
December 2014 September 2014 June 2014 March 2014 December 2013
Average monthly rents stabilized properties $953 $947 $936 $927 $923
For the twelve months ended December 31, 2014, property operating costs for stabilized properties increased by $0.6 million compared to 2013. Property taxes increased $0.2 million and utility costs increased $0.4 million compared to 2013. The increase in operating costs are primarily a result of the increased costs of snow removal and associated repairs and maintenance required due to the abnormally cold winter and abundance of snow at the start of 2014 as well as the costs associated with transitioning to a new rental operations model. Utility costs have increased over last year due to the abnormally cold winter in the first quarter of 2014 in the Trust’s operating regions
4040 41
13
FINANCING AND ADMINISTRATIVE COSTS
In $ OOO's
3 Months Ended
December 31, 2014
3 Months Ended
December 31, 2013
12 Months Ended
December 31, 2014
12 Months Ended
December 31, 2013
Net operating income $10,120 $9,226 $37,884 $36,041
Expenses Financing costs 3,208 3,368 12,759 11,589 Administrative costs 1,579 1,284 5,935 5,323 Income before other income and expenses $5,333 $4,574 $19,190 $19,129
FINANCING COSTS Financing costs amounted to $3.2 million or 18.5% of revenue for the three months ended December 31, 2014 compared to $3.4 million or 21.2% of revenue for the three months ended December 31, 2013.
In $000’s
3 Months Ended December 31, 2014 3 Months Ended December 31, 2013
Amount % of Revenue Amount % of Revenue
Cash based: Mortgage interest $3,107 17.9% $2,850 17.9% Credit facilities 320 1.9% 224 1.4% Interest income (49) (0.3%) (46) (0.3%) Non Cash based: Amortization of deferred finance cost
and premiums on assumed debt
(170)
(1.0%)
340
2.2%
Total $3,208 18.5% $3,368 21.2% Financing costs amounted to $12.8 million or 19.5% of revenue for the twelve months ended December 31, 2014 compared to $11.6 million or 19.2% of revenue for the twelve months ended December 31, 2013.
In $000’s
12 Months Ended December 31, 2014
12 Months Ended December 31, 2013
Amount % of Revenue Amount % of Revenue
Cash based: Mortgage interest $12,103 18.5% $10,590 17.5% Credit facilities 820 1.2% 795 1.3% Interest income (201) (0.3%) (191) (0.3%) Non Cash based: Amortization of deferred finance cost
and premiums on assumed debt
37
0.1%
395
0.7%
Total $12,759 19.5% $11,589 19.2%
14
Mortgage Interest Mortgage interest (including interest on vendor take-back loans) is one of the single largest expense line items for InterRent REIT. Given the current rates in the market for both CMHC insured and conventional mortgages, it is management’s expectation that it will be able to continue to refinance existing mortgages as they come due at rates that are in line or lower than those that mature in 2015 through 2017. Management has been able to decrease the weighted average rate of mortgage debt from 3.31% at December 31, 2013 to 3.13% at December 31, 2014. Despite the decrease in interest rate, mortgage debt has increased on an overall basis, mainly attributable to upfinancing for property acquisitions and repositioning. ADMINISTRATIVE COSTS Administrative costs include such items as director pay, salaries and incentive payments, employee benefits, investor relations, transfer agent listing and filing fees, legal, tax, audit, asset management, other professional fees and amortization on corporate assets.
Administrative costs for the twelve months ended December 31, 2014 amounted to $5.9 million or 9.1% of revenue compared to $5.3 million or 8.8% of revenue for the twelve months ended December 31, 2013.
SALE OF ASSETS, FAIR VALUE ADJUSTMENTS ON INVESTMENT PROPERTIES AND GAIN/LOSS ON FINANCIAL LIABILITIES
In $ OOO's
3 Months Ended
December 31, 2014
3 Months Ended
December 31, 2013
12 Months Ended
December 31, 2014
12 Months Ended
December 31, 2013
Income before other income and expenses $5,333 $4,574 $19,190 $19,129
Loss on sale of assets - (21) - (21) Fair value adjustments of investment
properties 1,393 421 6,679 11,854
Unrealized gain/(loss) on financial liabilities (1,155) 229 (1,495) (422) Distributions expense on units classified as
financial liabilities (106) (79) (392) (281)
Net income $5,465 $5,124 $23,982 $30,259
SALE OF ASSETS There were no dispositions of assets in 2014 and 2013. A loss was recognized in 2013 relating to trailing costs associated with a property disposal in 2012.
FAIR VALUE ADJUSTMENTS OF INVESTMENT PROPERTIES The fair value of the portfolio at December 31, 2014 and 2013 was determined internally by the Trust. In order to substantiate management’s valuation, approximately 44% of the portfolio was appraised by external valuation professionals throughout 2014 (approximately 46% in 2013). For the twelve month period ended December 31, 2014, a fair value gain of $6.7 million was recorded on the financial statements as a result of changes in the fair value of investment properties. The increase in the fair value of the properties over last year has been driven by actual improvements in operating results as a result of the repositioning of the properties and the capital invested over the last four years as well as minor changes to the capitalization rate. The weighted average capitalization rate used across the portfolio at the end of Q4 2014 was 5.40% as compared to 5.50% for Q4 2013.
4242 43
15
The redevelopment property acquired May 14, 2013 is valued at acquisition cost plus redevelopment costs. The direct capitalization income approach method of valuation is not a reliable measure as the property is undergoing a significant amount of work which will affect multiple components of the estimated NOI as well as the Cap Rate. When the work is substantially completed, the estimated NOI and Cap Rate will be reliable and the property will be included in the portfolio to be fair valued. Redevelopment costs include direct development costs, realty taxes and borrowing costs directly attributable to the redevelopment.
UNREALIZED FAIR VALUE GAIN/LOSS ON FINANCIAL LIABILITIES The Trust used a closing price of $5.99 based on the closing price of the TSX listed InterRent REIT Trust Units to determine the fair value of the deferred unit compensation liability. The total fair value of the deferred units recorded on the consolidated balance sheet at December 31, 2014 was $9.4 million and a corresponding fair value loss of $1.3 million was recorded on the consolidated statement of income for the twelve months ended December 31, 2014. The Trust determined the fair value of the option plan (unit-based compensation liability) at December 31, 2014 at $2.0 million and a corresponding fair value loss of $37 thousand was recorded on the consolidated statement of income for the twelve months ended December 31, 2014. The intrinsic value of the vested options is $1.4 million. The Trust used a closing price of $5.99 based on the closing price of the TSX listed InterRent REIT Trust Units to determine the fair value of the LP Class B unit liability. The total fair value of these Units recorded on the consolidated balance sheet at December 31, 2014 was $1.1 million and a corresponding fair value loss of $0.1 million was recorded on the consolidated statement of income for the twelve months ended December 31, 2014.
In $ OOO's
3 Months Ended
December 31, 2014
3 Months Ended
December 31, 2013
12 Months Ended
December 31, 2014
12 Months Ended
December 31, 2013
Fair value gain(loss) on financial liabilities:
Deferred unit compensation plan $(819) $35 $(1,338) $(542) Option plan (241) 177 (37) 142 LP Class B unit liability (95) 17 (120) (22)
Fair value gain (loss) on financial liabilities $(1,155) $229 $(1,495) $(422)
DISTRIBUTION EXPENSE The distribution expense is comprised of distributions to holders of the LP Class B units and distributions earned on the deferred unit plan, as both are classified as a liability.
16
INVESTMENT PROPERTIES The following chart shows the changes in investment properties from December 31, 2013 to December 31, 2014.
In $ OOO's December 31, 2014
Balance, December 31, 2013 $766,820
Acquisitions (non redevelopment properties) 76,008
Property capital investments 35,624
Fair value gains 6,679 Transfer to redevelopment properties (1,150) $883,981
Acquisition – redevelopment property 2,035
Transfer from income properties 1,150
Redevelopment costs 22,264
Total investment properties $909,430
The Trust acquired five properties (645 suites) and a parcel of land which is temporarily being used as a parking lot for the property that is now being redeveloped for a combined acquisition total of $78.0 million during the year ended December 31, 2014.
The Trust has decided to redevelop the property damaged by fire in February 2014 and has reclassified the fair value of the property from income properties to redevelopment properties.
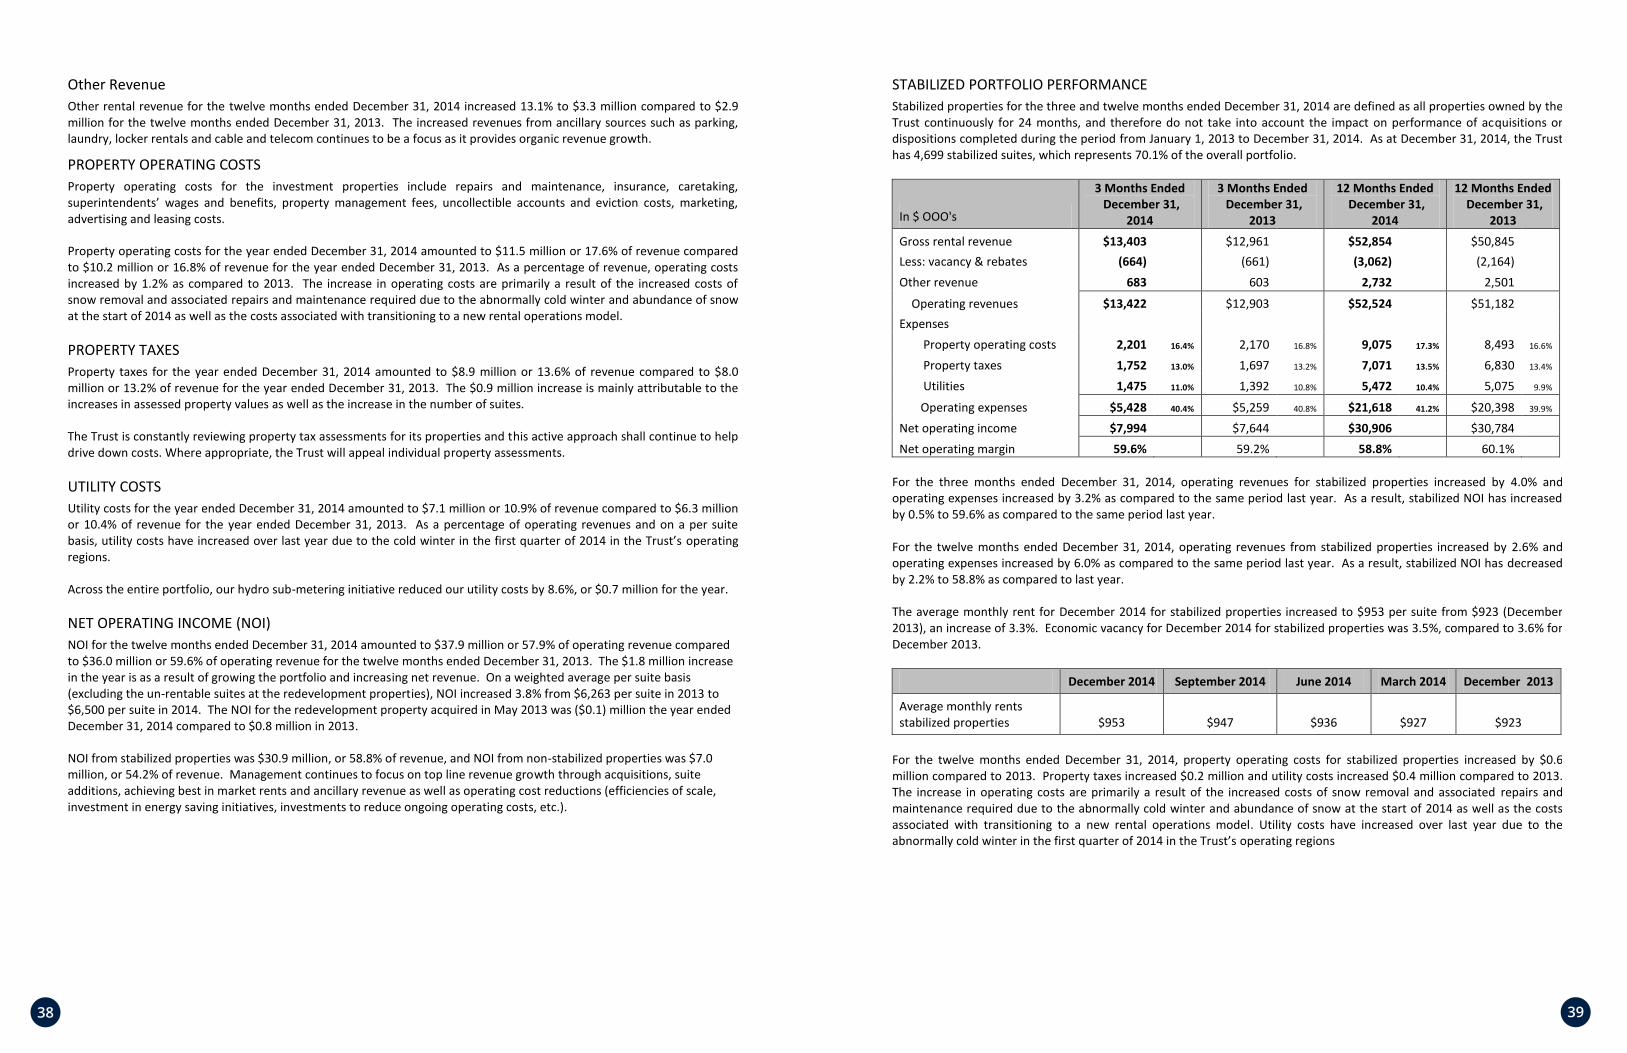
The fair value of the portfolio (excluding the redevelopment property acquired May 14, 2013) at December 31, 2014 was determined internally by the Trust. In order to substantiate management’s valuation, approximately 44% of the portfolio was appraised by external valuation professionals throughout 2014. For the twelve month period ended December 31, 2014, a fair value gain of $6.7 million was recorded on the financial statements as a result of changes in the fair value of investment properties. For the twelve month period ended December 31, 2014, the Trust invested $35.6 million (2013 – $40.9 million) in its investment properties (excluding the redevelopment properties), including $12.7 million spent on non-stabilized properties acquired in the past 24 months. The breakdown of expenditures for the year are itemized in the following graph.
Mechanical10%
Appliances2%
Building Improvements
69%
Suite Improvements
19%
Capital Expenditures
4444 45
17
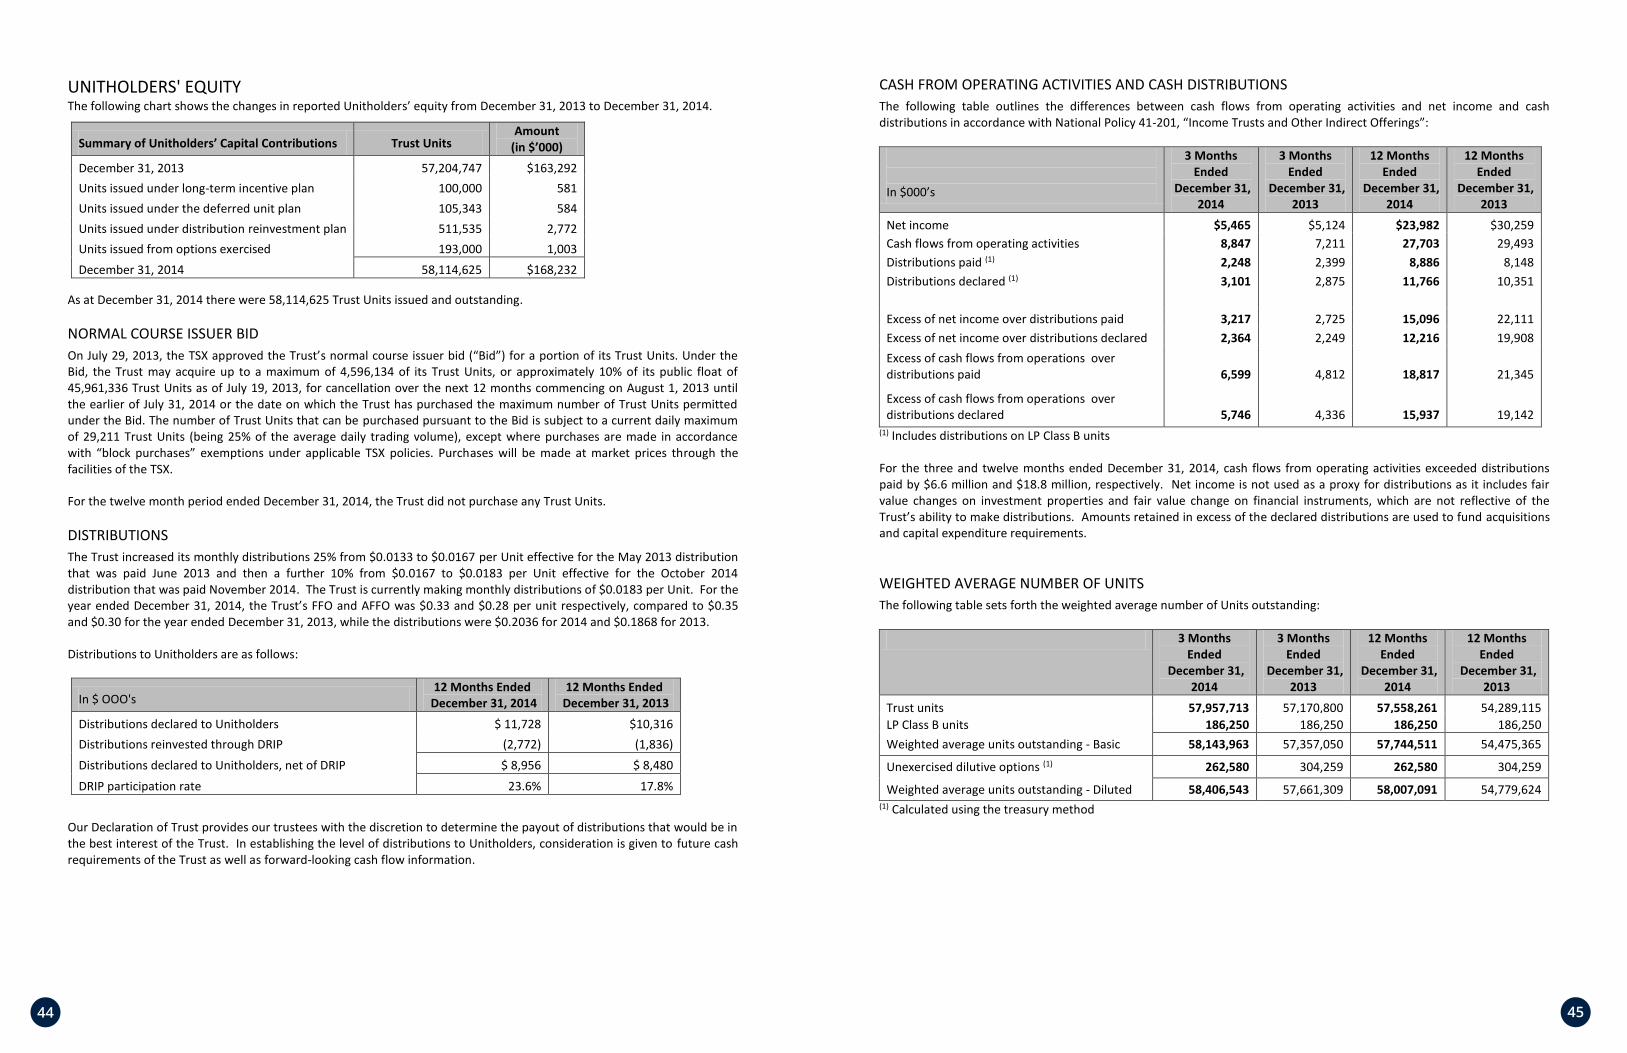
UNITHOLDERS' EQUITY The following chart shows the changes in reported Unitholders’ equity from December 31, 2013 to December 31, 2014.
Summary of Unitholders’ Capital Contributions Trust Units Amount
(in $’000) December 31, 2013 57,204,747 $163,292 Units issued under long-term incentive plan 100,000 581 Units issued under the deferred unit plan 105,343 584 Units issued under distribution reinvestment plan 511,535 2,772 Units issued from options exercised 193,000 1,003 December 31, 2014 58,114,625 $168,232
As at December 31, 2014 there were 58,114,625 Trust Units issued and outstanding.
NORMAL COURSE ISSUER BID On July 29, 2013, the TSX approved the Trust’s normal course issuer bid (“Bid”) for a portion of its Trust Units. Under the Bid, the Trust may acquire up to a maximum of 4,596,134 of its Trust Units, or approximately 10% of its public float of 45,961,336 Trust Units as of July 19, 2013, for cancellation over the next 12 months commencing on August 1, 2013 until the earlier of July 31, 2014 or the date on which the Trust has purchased the maximum number of Trust Units permitted under the Bid. The number of Trust Units that can be purchased pursuant to the Bid is subject to a current daily maximum of 29,211 Trust Units (being 25% of the average daily trading volume), except where purchases are made in accordance with “block purchases” exemptions under applicable TSX policies. Purchases will be made at market prices through the facilities of the TSX.
For the twelve month period ended December 31, 2014, the Trust did not purchase any Trust Units.
DISTRIBUTIONS The Trust increased its monthly distributions 25% from $0.0133 to $0.0167 per Unit effective for the May 2013 distribution that was paid June 2013 and then a further 10% from $0.0167 to $0.0183 per Unit effective for the October 2014 distribution that was paid November 2014. The Trust is currently making monthly distributions of $0.0183 per Unit. For the year ended December 31, 2014, the Trust’s FFO and AFFO was $0.33 and $0.28 per unit respectively, compared to $0.35 and $0.30 for the year ended December 31, 2013, while the distributions were $0.2036 for 2014 and $0.1868 for 2013.
Distributions to Unitholders are as follows:
In $ OOO's 12 Months Ended
December 31, 2014 12 Months Ended
December 31, 2013 Distributions declared to Unitholders $ 11,728 $10,316 Distributions reinvested through DRIP (2,772) (1,836) Distributions declared to Unitholders, net of DRIP $ 8,956 $ 8,480 DRIP participation rate 23.6% 17.8%
Our Declaration of Trust provides our trustees with the discretion to determine the payout of distributions that would be in the best interest of the Trust. In establishing the level of distributions to Unitholders, consideration is given to future cash requirements of the Trust as well as forward-looking cash flow information.
18
CASH FROM OPERATING ACTIVITIES AND CASH DISTRIBUTIONS The following table outlines the differences between cash flows from operating activities and net income and cash distributions in accordance with National Policy 41-201, “Income Trusts and Other Indirect Offerings”:
In $000’s
3 Months Ended
December 31, 2014
3 Months Ended
December 31, 2013
12 Months Ended
December 31, 2014
12 Months Ended
December 31, 2013
Net income $5,465 $5,124 $23,982 $30,259 Cash flows from operating activities 8,847 7,211 27,703 29,493 Distributions paid (1) 2,248 2,399 8,886 8,148 Distributions declared (1) 3,101 2,875 11,766 10,351 Excess of net income over distributions paid 3,217 2,725 15,096 22,111 Excess of net income over distributions declared 2,364 2,249 12,216 19,908 Excess of cash flows from operations over distributions paid 6,599 4,812 18,817 21,345
Excess of cash flows from operations over distributions declared 5,746 4,336 15,937 19,142
(1) Includes distributions on LP Class B units For the three and twelve months ended December 31, 2014, cash flows from operating activities exceeded distributions paid by $6.6 million and $18.8 million, respectively. Net income is not used as a proxy for distributions as it includes fair value changes on investment properties and fair value change on financial instruments, which are not reflective of the Trust’s ability to make distributions. Amounts retained in excess of the declared distributions are used to fund acquisitions and capital expenditure requirements.
WEIGHTED AVERAGE NUMBER OF UNITS The following table sets forth the weighted average number of Units outstanding:
3 Months Ended
December 31, 2014
3 Months Ended
December 31, 2013
12 Months Ended
December 31, 2014
12 Months Ended
December 31, 2013
Trust units 57,957,713 57,170,800 57,558,261 54,289,115 LP Class B units 186,250 186,250 186,250 186,250 Weighted average units outstanding - Basic 58,143,963 57,357,050 57,744,511 54,475,365
Unexercised dilutive options (1) 262,580 304,259 262,580 304,259
Weighted average units outstanding - Diluted 58,406,543 57,661,309 58,007,091 54,779,624 (1) Calculated using the treasury method
4646 47
19
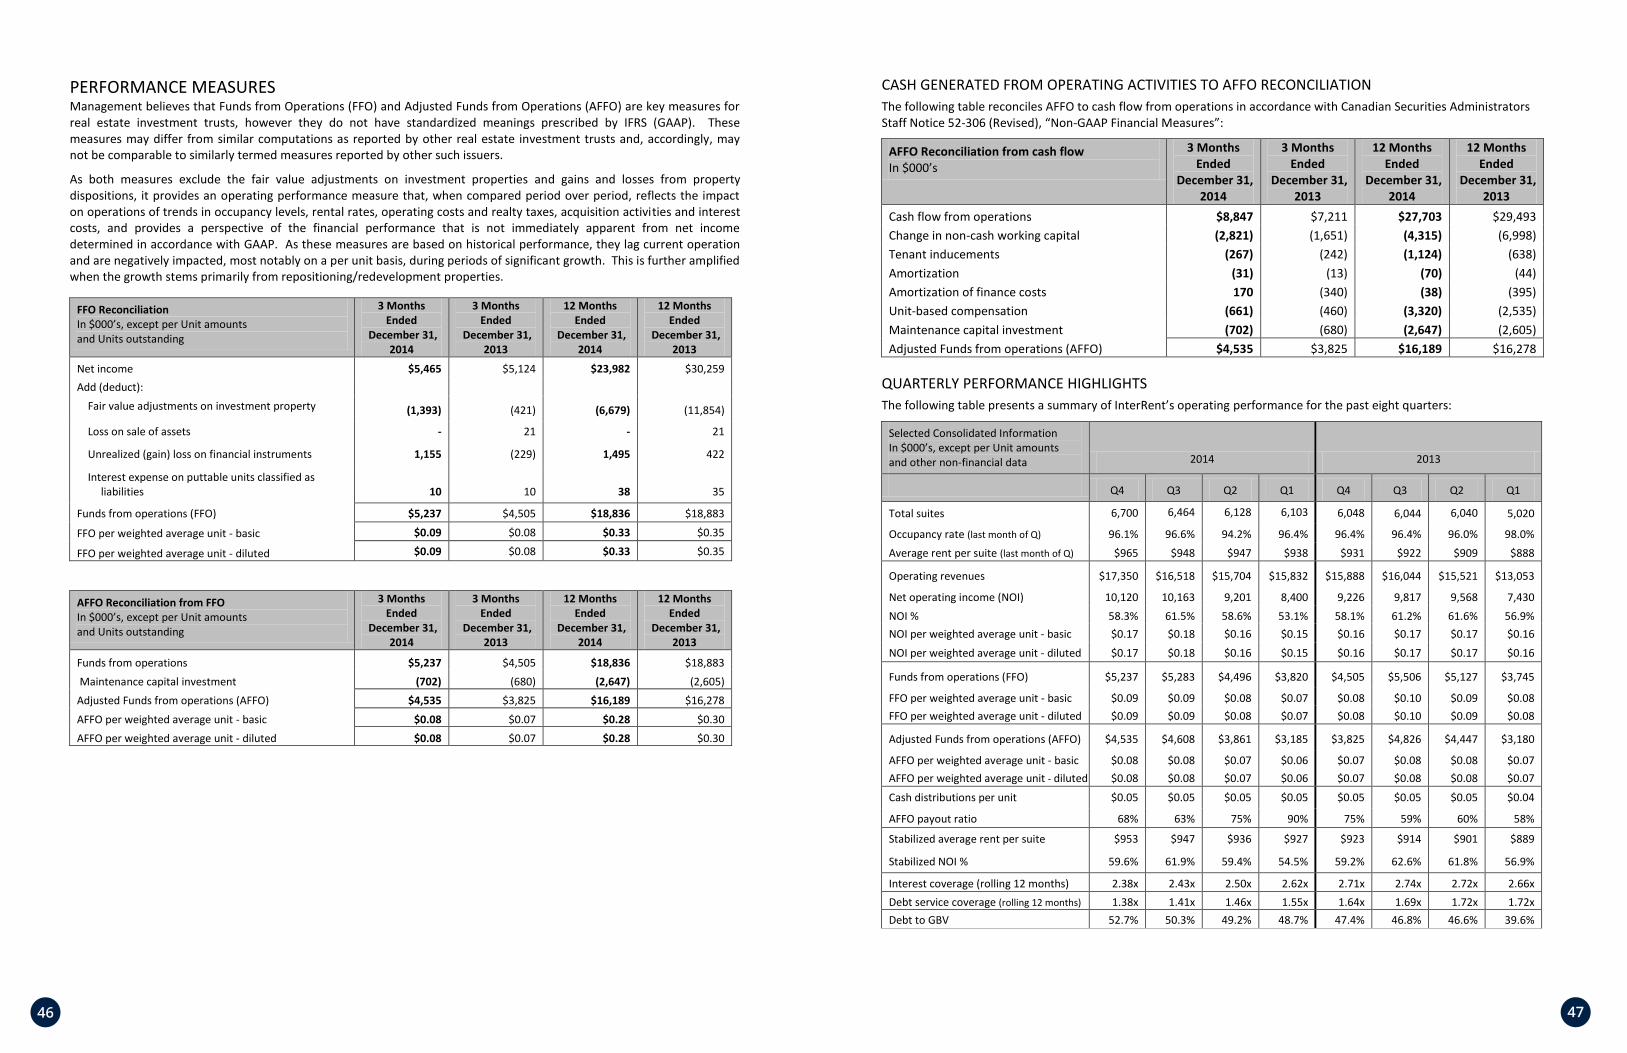
PERFORMANCE MEASURES Management believes that Funds from Operations (FFO) and Adjusted Funds from Operations (AFFO) are key measures for real estate investment trusts, however they do not have standardized meanings prescribed by IFRS (GAAP). These measures may differ from similar computations as reported by other real estate investment trusts and, accordingly, may not be comparable to similarly termed measures reported by other such issuers.
As both measures exclude the fair value adjustments on investment properties and gains and losses from property dispositions, it provides an operating performance measure that, when compared period over period, reflects the impact on operations of trends in occupancy levels, rental rates, operating costs and realty taxes, acquisition activities and interest costs, and provides a perspective of the financial performance that is not immediately apparent from net income determined in accordance with GAAP. As these measures are based on historical performance, they lag current operation and are negatively impacted, most notably on a per unit basis, during periods of significant growth. This is further amplified when the growth stems primarily from repositioning/redevelopment properties.
FFO Reconciliation In $000’s, except per Unit amounts and Units outstanding
3 Months Ended
December 31, 2014
3 Months Ended
December 31, 2013
12 Months Ended
December 31, 2014
12 Months Ended
December 31, 2013
Net income $5,465 $5,124 $23,982 $30,259 Add (deduct): Fair value adjustments on investment property
(1,393) (421) (6,679) (11,854)
Loss on sale of assets
- 21 - 21
Unrealized (gain) loss on financial instruments 1,155 (229) 1,495 422
Interest expense on puttable units classified as liabilities 10 10 38 35
Funds from operations (FFO) $5,237 $4,505 $18,836 $18,883
FFO per weighted average unit - basic $0.09 $0.08 $0.33 $0.35
FFO per weighted average unit - diluted $0.09 $0.08 $0.33 $0.35
AFFO Reconciliation from FFO In $000’s, except per Unit amounts and Units outstanding
3 Months Ended
December 31, 2014
3 Months Ended
December 31, 2013
12 Months Ended
December 31, 2014
12 Months Ended
December 31, 2013
Funds from operations $5,237 $4,505 $18,836 $18,883 Maintenance capital investment (702) (680) (2,647) (2,605) Adjusted Funds from operations (AFFO) $4,535 $3,825 $16,189 $16,278 AFFO per weighted average unit - basic $0.08 $0.07 $0.28 $0.30 AFFO per weighted average unit - diluted $0.08 $0.07 $0.28 $0.30
20
CASH GENERATED FROM OPERATING ACTIVITIES TO AFFO RECONCILIATION The following table reconciles AFFO to cash flow from operations in accordance with Canadian Securities Administrators Staff Notice 52-306 (Revised), “Non-GAAP Financial Measures”:
AFFO Reconciliation from cash flow In $000’s
3 Months Ended
December 31, 2014
3 Months Ended
December 31, 2013
12 Months Ended
December 31, 2014
12 Months Ended
December 31, 2013
Cash flow from operations $8,847 $7,211 $27,703 $29,493 Change in non-cash working capital (2,821) (1,651) (4,315) (6,998) Tenant inducements (267) (242) (1,124) (638) Amortization (31) (13) (70) (44) Amortization of finance costs 170 (340) (38) (395) Unit-based compensation (661) (460) (3,320) (2,535) Maintenance capital investment (702) (680) (2,647) (2,605) Adjusted Funds from operations (AFFO) $4,535 $3,825 $16,189 $16,278
QUARTERLY PERFORMANCE HIGHLIGHTS The following table presents a summary of InterRent’s operating performance for the past eight quarters:
Selected Consolidated Information In $000’s, except per Unit amounts and other non-financial data 2014 2013
Q4 Q3 Q2 Q1 Q4 Q3 Q2 Q1
Total suites 6,700 6,464
6,128
6,103
6,048 6,044 6,040 5,020
Occupancy rate (last month of Q) 96.1% 96.6% 94.2% 96.4% 96.4% 96.4% 96.0% 98.0% Average rent per suite (last month of Q) $965 $948 $947 $938 $931 $922 $909 $888
Operating revenues $17,350 $16,518 $15,704 $15,832 $15,888 $16,044 $15,521 $13,053
Net operating income (NOI) 10,120 10,163 9,201 8,400 9,226 9,817 9,568 7,430 NOI % 58.3% 61.5% 58.6% 53.1% 58.1% 61.2% 61.6% 56.9% NOI per weighted average unit - basic $0.17 $0.18 $0.16 $0.15 $0.16 $0.17 $0.17 $0.16 NOI per weighted average unit - diluted $0.17 $0.18 $0.16 $0.15 $0.16 $0.17 $0.17 $0.16
Funds from operations (FFO) $5,237 $5,283 $4,496 $3,820 $4,505 $5,506 $5,127 $3,745
FFO per weighted average unit - basic $0.09 $0.09 $0.08 $0.07 $0.08 $0.10 $0.09 $0.08 FFO per weighted average unit - diluted $0.09 $0.09 $0.08 $0.07 $0.08 $0.10 $0.09 $0.08
Adjusted Funds from operations (AFFO) $4,535 $4,608 $3,861 $3,185 $3,825 $4,826 $4,447 $3,180
AFFO per weighted average unit - basic $0.08 $0.08 $0.07 $0.06 $0.07 $0.08 $0.08 $0.07 AFFO per weighted average unit - diluted $0.08 $0.08 $0.07 $0.06 $0.07 $0.08 $0.08 $0.07
Cash distributions per unit $0.05 $0.05 $0.05 $0.05 $0.05 $0.05 $0.05 $0.04
AFFO payout ratio 68% 63% 75% 90% 75% 59% 60% 58%
Stabilized average rent per suite $953 $947 $936 $927 $923 $914 $901 $889
Stabilized NOI % 59.6% 61.9% 59.4% 54.5% 59.2% 62.6% 61.8% 56.9%
Interest coverage (rolling 12 months) 2.38x 2.43x 2.50x 2.62x 2.71x 2.74x 2.72x 2.66x Debt service coverage (rolling 12 months) 1.38x 1.41x 1.46x 1.55x 1.64x 1.69x 1.72x 1.72x Debt to GBV 52.7% 50.3% 49.2% 48.7% 47.4% 46.8% 46.6% 39.6%

4848 49
21
LIQUIDITY AND CAPITAL RESOURCES InterRent REIT’s overall debt level was at 52.7% of Gross Book Value (“GBV”) at December 31, 2014. GBV is a non-GAAP term that is defined in the DOT and includes all operations. The following chart sets out the Trust's computed debt to GBV:
In $ OOO's December 31, 2014 December 31, 2013
Total assets per Balance Sheet $920,648 $777,062
Mortgages payable and vendor take-back loans $433,924 $368,670
Lines of credit 51,126 -
Total debt $485,050 $368,670
Debt to GBV 52.7% 47.4%
With a DOT limit of 75% of Debt-to-Gross Book Value, InterRent REIT has the ability to further leverage the existing portfolio to assist with future investments in new assets. The Trust is conscious of the current credit environment and how this affects the ability of the Trust to grow. Management believes that although the bulk of the repositioning and dispositions are complete, there remains opportunities within the portfolio to reduce the operating costs further and streamline operations while growing the REIT in a fiscally prudent manner.
INTEREST AND DEBT SERVICE COVERAGE The following schedule summarizes the interest and debt service coverage ratios for InterRent for the comparable rolling 12 month periods ending December 31st:
In $000’s 12 Months Ended
December 31, 2014 12 Months Ended
December 31, 2013 NOI $37,884 $36,041 Less: Administrative costs 5,935 5,323 EBITDA $31,949 $30,718 Interest expense (1) 13,450 11,316 Interest coverage ratio 2.38x 2.71x
Contractual principal repayments 9,624 7,409 Total debt service payments $23,074 $18,725 Debt service coverage ratio 1.38x 1.64x
(1) Interest expense includes interest on mortgages and credit facilities, including interest capitalized to the redevelopment property and interest income, and excludes interest (distributions) on units classified as financial liabilities.
22
MORTGAGE AND DEBT SCHEDULE The following schedule summarizes the aggregate future minimum principal payments and debt maturities for the mortgages and vendor take-back loans of InterRent REIT.
Year Maturing
Mortgage Balances At December 31, 2014 (in $ 000’s)
Weighted Average by Maturity
Weighted Average Interest Rate
2015 $237,093 53.9% 2.75%
2016 $12,960 2.9% 5.33%
2017 $30,524 6.9% 4.75%
2018 $5,671 1.3% 2.63%
2019 $12,649 2.9% 2.66%
Thereafter $141,122 32.1% 3.38%
Total $440,019 100% 3.13% At December 31, 2014, the average term to maturity of the mortgage debt was approximately 3.9 years and the weighted average cost of mortgage debt was 3.13%. At December 31, 2014, approximately 51% of InterRent REIT’s mortgage debt was backed by CMHC insurance.
During the year the Trust added four mortgages to properties acquired in the year for $54.4 million, re-financed five properties which increased mortgage debt by $29.1 million, paid down $7.0 million in mortgage debt and paid down $9.6 million in mortgage principal. The net result at December 31, 2014 compared to December 31, 2013 was:
A decrease in average term to maturity of the mortgage debt to 3.9 years from 4.7 years;
A decrease in the weighted average cost of mortgage debt to 3.13% from 3.31% ; and,
A decrease in the mortgage debt backed by CMHC insurance to approximately 51% from 68%.
As at December 31, 2014, the Trust had the following credit facilities:
A $0.5 million demand credit facility with a Canadian chartered bank secured by a general security agreement and a second collateral mortgage on one of the Trust’s properties. Interest is charged at a floating rate plus a pre-defined spread. As at December 31, 2014, the Trust had no balance outstanding under this facility.
A $17.5 million term credit facility, maturing in 2016, with a Canadian chartered bank secured by a general security agreement and second collateral mortgages on ten of the Trust’s properties. Interest is charged at a floating rate plus a pre-defined spread. As at December 31, 2014, the Trust had utilized $9.2 million of this facility.
A $15.0 million term credit facility, maturing in 2015, with a Canadian chartered bank secured by a general security agreement, a first mortgage on one of the Trust’s properties and second collateral mortgages on seven of the Trust’s properties. Interest is charged at a floating rate plus a pre-defined spread. As at December 31, 2014, the Trust had utilized $15.0 million of this facility.
A $27.0 million term credit facility, maturing in 2016, with a Canadian chartered bank secured by a general security agreement, first mortgages on three of the Trust’s properties and second collateral mortgages on eight of the Trust’s properties. Interest is charged at a floating rate plus a pre-defined spread for prime advances and banker’s acceptances. As at December 31, 2014, the Trust had utilized $27.0 million of this facility.
5050 51
23
ACCOUNTING NEW INTERPRETATION ADOPTED IFRS Interpretation Committee (“IFRIC”) 21Levies
IFRIC 21 was issued by the IASB in May 2013 and provides guidance on accounting for levies in accordance with the requirements of IAS 37, Provisions, Contingent Liabilities and Contingent Assets. IFRIC 21 is effective for annual periods commencing on or after January 1, 2014 and is applied retrospectively. IFRIC 21 clarifies that an entity recognizes a levy liability when the activity that triggers payment occurs, as identified by the relevant legislation. It also clarifies that a levy liability is accrued ratably over a reporting period only if the activity that triggers payment occurs over such period, in accordance with the relevant legislation. For a levy that is triggered upon reaching a minimum threshold, the interpretation clarifies that no liability should be recognized before the specified minimum threshold is reached.
The adoption of IFRIC 21 has no impact to the Trust's current and prior period consolidated balance sheets and statements of earnings as at and for the years ended December 31, 2014 and 2013.
FUTURE ACCOUNTING CHANGES IFRS 9 Financial Instruments
In July 2014, the IASB issued the final version of IFRS 9, which reflects all phases of the financial instruments project and replaces IAS 39, Financial Instruments: Recognition and Measurement and all previous versions of IFRS 9. The effective date for IFRS 9 is for periods beginning on or after January 1, 2018.
IFRS 9 uses a single approach to determine whether a financial asset is measured at amortized cost or fair value, replacing the multiple rules in IAS 39. The approach in IFRS 9 is based on how an entity manages its financial instruments in the context of its business model and the contractual cash flow characteristics of the financial assets. The new standard also requires a single impairment method to be used, replacing the multiple impairment methods in IAS 39. The standard also adds guidance on the classification and measurement of financial liabilities. Management is currently evaluating the potential impact that the adoption of IFRS 9 will have on the Trust’s consolidated financial statements.
IFRS 15 Revenue from Contracts with Customers
IFRS 15 was issued in May 2014 and establishes a new five-step model that will apply to revenue arising from contracts with customers. Under IFRS 15, revenue is recognized at an amount that reflects the consideration to which an entity expects to be entitled in exchange for transferring goods or services to a customer. The principles in IFRS 15 provide a more structured approach to measuring and recording revenue. The new revenue standard is applicable to all entities and will supersede all current revenue recognition requirements under IFRS. Either a full or modified retrospective application is required for annual periods beginning on or after January 1, 2017, with early adoption permitted. Management is currently assessing the impact of IFRS 15 and intends to adopt the new standard on the required effective date.
RISKS AND UNCERTAINTIES The Trust, its business and the transactions contemplated in this MD&A are subject to material risks, both known and unknown, including, but not limited to the following:
The Trust is exposed to a variety of risks, general and specific. General risks are the risks associated with general conditions in the real estate sector, and consist largely of commonly exposed risks affecting the real estate industry as a whole. Specific risks are the risks specific to the Trust and its operations, such as credit, market, liquidity and operational risks.
Current Economic Risks InterRent REIT must raise mortgage funds for mortgages as they mature and for acquisitions. Given the interconnectivity of the global economy and the current global economic environment, there is no guarantee that the Trust will be able to secure such funds on a commercially beneficial basis, or at all, and the failure to raise sufficient funds could have a material adverse effect on the business of the Trust and the market value of its securities.
24
Real Estate Industry Risk Real estate investments are generally subject to varying degrees of risk depending on the nature of the property. These risks include changes in general economic conditions (such as the availability and cost of mortgage funds), local conditions (such as an oversupply of space or a reduction in demand for real estate in the area), government regulations (such as new or revised residential tenant legislation), the attractiveness of the properties to tenants, competition from others with available space and the ability of the owner to provide adequate maintenance at an economic cost. The performance of the economy in each of the areas in which the Trust’s properties are located, including the financial results and labour decisions of major local employers, can have an impact on revenues from the properties and their underlying values.
Additional factors which may further adversely affect revenues from the Trust’s properties and their underlying values include the general economic climate, local conditions in the areas in which properties are located, such as an abundance of supply or a reduction in demand, the attractiveness of the properties, competition from other properties, the Trust’s ability to provide adequate facilities maintenance, services and amenities, the ability of residents to pay rent and the ability of the Trust to rent vacant units on favourable terms.
Certain significant expenditures, including property taxes, maintenance costs, mortgage payments, insurance costs and related charges, must be made regardless of whether or not a property is producing sufficient income to service these expenses. The Trust’s properties are subject to mortgages, which require significant debt service payments. If the Trust were unable or unwilling to meet mortgage payments on any property, losses could be sustained as a result of the mortgagee’s exercise of its rights of foreclosure or of sale. Real estate is relatively illiquid. Such illiquidity will tend to limit the Trust’s ability to vary its portfolio promptly in response to changing economic or investment conditions. In addition, financial difficulties of other property owners resulting in distress sales may depress real estate values in the markets in which the Trust operates. The majority of the Trust’s properties were constructed in the 1960’s and 1970’s and require ongoing capital expenditures, the amount and timing of which is difficult to predict. These expenditures could exceed the Trust’s existing reserve estimates which could have a material adverse effect upon Distributable Income.
The nature of the Trust’s business is such that refurbishment and structural repairs are required periodically, in addition to regular on-going maintenance.
Multi-Unit Residential Sector Risk Income producing properties generate income through rent payments made by tenants of the properties. Upon the expiry of any lease, there can be no assurance that the lease will be renewed or the tenant replaced. The terms of any subsequent lease may be less favourable to the Trust than the existing lease. The Trust is dependent on leasing markets to ensure vacant residential space is leased, expiring leases are renewed and new tenants are found to fill vacancies. A disruption in the economy could have a significant impact on how much space tenants will lease and the rental rates paid by tenants. This would affect the income produced by the Trust’s properties as a result of downward pressure on rents.
Environmental Risks As an owner and manager of real property, the Trust is subject to various Canadian federal, provincial, and municipal laws relating to environmental matters. These laws could encumber the Trust with liability for the costs of removal and remediation of certain hazardous substances or wastes released or deposited on or in its properties or disposed of at other locations. The failure to remove or remediate such substances, if any, could adversely affect the Trust’s ability to sell its real estate, or to borrow using real estate as collateral, and could potentially also result in claims or other proceedings against the Trust. Although the Trust is not aware of any material non-compliance with environmental laws at any of its properties nor is it aware of any pending or threatened investigations or actions by environmental regulatory authorities in connection with any of its properties or any material pending or threatened claims relating to environmental conditions at its properties, no assurance can be given that environmental laws will not result in significant liability to the Trust in the future or otherwise adversely affect the Trust’s business, financial condition or results of operations. The Trust has formal polic ies and procedures to review and monitor environmental exposure. The Trust has made, and will continue to make, the necessary capital expenditures for compliance with environmental laws and regulations. Environmental laws and regulations can change rapidly and the Trust may become subject to more stringent environmental laws and regulations in
5252 53
25
the future. Compliance with more stringent environmental laws and regulations could have a material adverse effect on the Trust’s business, financial condition or results of operation.
Competition Risk Each segment of the real estate business is competitive. Numerous other residential developers and apartment owners compete in seeking tenants. Although the Trust’s strategy is to own multi-residential properties in desirable locations in each market in which it operates, some of the properties of the Trust’s competitors may be newer, better located or better capitalized. The existence of alternative housing could have a material adverse effect on the Trust’s ability to lease space in its properties and on the rents charged or concessions granted, and could adversely affect the Trust’s revenues and its ability to meet its obligations.
General Uninsured Losses The Trust carries comprehensive general liability, fire, flood, extended coverage and rental loss insurance with policy specifications, limits and deductibles customarily carried for similar properties. There are, however, certain types of risks (generally of a catastrophic nature such as war or environmental contamination), which are either uninsurable or not economically insurable. The Trust will continue to procure insurance for such risks, subject to certain standard policy limits and deductibles and will continue to carry such insurance if it is economical to do so. Should an uninsured or underinsured loss occur, the Trust could lose its investment in, and anticipated profits and cash flows from, one or more of its properties, and would continue to be obligated to repay any recourse mortgage indebtedness on such properties. There is a risk that any significant increase in insurance costs will impact negatively upon the profitability of the Trust.
Credit Risk - Leases The key credit risk to the Trust is the possibility that its tenants will be unable or unwilling to fulfill their lease term commitments. Key drivers of demand include employment levels, population growth, demographic trends and consumer confidence. The failure by tenants to fulfill their lease commitments could have a material adverse effect upon Distributable Income.
Local Real Estate Market Risk and Asset Concentration There is a risk that the Trust would be negatively affected by the new supply of, and demand for, multi-unit residential suites in its local market areas. Any significant amount of new construction will typically result in an imbalance in supply and cause downward price pressure on rents.
Rent Control Legislation Risk Rent control legislation risk is the risk of the implementation or amendment of new or existing legislative rent controls in the markets where the Trust operates, which may have an adverse impact on the Trust’s operations.
Certain provinces of Canada have enacted residential tenancy legislation which imposes, among other things, rent control guidelines that limit the Trust’s ability to raise rental rates at its properties. Limits on the Trust’s ability to raise rental rates at its properties may adversely affect the Trust’s ability to increase income from its properties. In addition to limiting the Trust’s ability to raise rental rates, residential tenancy legislation in such provinces provide certain rights to tenants, wh ile imposing obligations upon the landlord. Residential tenancy legislation in the Provinces of Ontario and Québec prescribe certain procedures which must be followed by a landlord in order to terminate a residential tenancy. As certain proceedings may need to be brought before the respective administrative body governing residential tenancies as appointed under a province’s residential tenancy legislation, it may take several months to terminate a residential lease, even where the tenant’s rent is in arrears. Further, residential tenancy legislation in certain provinces provide the tenant with the right to bring certain claims to the respective administrative body seeking an order to, among other things, compel the landlord to comply with health, safety, housing and maintenance standards. As a result, the Trust may, in the future, incur capital expenditures which may not be fully recoverable from tenants. The inability to fully recover substantial capital expenditures from tenants may have an
26
adverse impact on the Trust’s financial conditions and results of operations and decrease the amount of cash available for distributions. Residential tenancy legislation may be subject to further regulations or may be amended, repealed or enforced, or new legislation may be enacted, in a manner which will materially adversely affect the ability of the Trust to maintain the historical level of earnings of its properties.
Utility and Property Tax Risk Utility and property tax risk relates to the potential loss the Trust may experience as a result of higher resource prices as well as its exposure to significant increases in property taxes. Over the past few years, property taxes have increased as a result of re-valuations of municipal properties and their adherent tax rates. For the Trust, these re-valuations have resulted in significant increases in some property assessments due to enhancements. Utility expenses, mainly consisting of natural gas and electricity service charges, have been subject to considerable price fluctuations over the past several years. Any significant increase in these resource costs that the Trust cannot pass on to the tenant may have a negative material impact on the Trust.
Operational Risk Operational risk is the risk that a direct or indirect loss may result from an inadequate or failed technology, from a human process or from external events. The impact of this loss may be financial loss, loss of reputation or legal and regulatory proceedings.
Renovation Risks The Trust is subject to the financial risk of having unoccupied units during extended periods of renovations. During renovations, these properties are unavailable for occupancy and do not generate income. Certain significant expenditures, including property taxes, maintenance costs, interest payments, insurance costs and related charges must be made throughout the period of ownership of real property regardless of whether the property is producing revenue. Delays in the renovation of a building or individual apartment could delay the renting of such building or units resulting in an increased period of time where the building is not producing revenue, or produces less revenue than a fully tenanted building. The Trust intends to address these risks by acquiring financing to fund renovations, staggering renovations and by carrying out a detailed capital expenditures budget to monitor its cash position on a monthly basis.
Fluctuations and Availability of Cash Distributions Although the Trust intends to continue distributing its Distributable Income, the actual amount of Distributable Income distributed in respect of the Units will depend upon numerous factors, some of which may be beyond the control of the Trust. The distribution policy of the Trust is established by the Trustees and is subject to change at the discretion of the Trustees. The recourse of Unitholders who disagree with any change in policy is limited and could require such Unitholders to seek to replace the Trustees. Distributable Income may exceed actual cash available to the Trust from time to time because of items such as principal repayments, tenant allowances, leasing commissions and capital expenditures and redemption of Units, if any. The Trust may be required to use part of its debt capacity or to reduce distributions in order to accommodate such items.
Market Price of Units One of the factors that may influence the market price of the Units is the annual yield thereon. Accordingly, an increase in market interest rates may lead purchasers of Units to expect a higher annual yield which could adversely affect the market price of the Units. In addition, the market price for the Units may fluctuate significantly and may be affected by changes in general market conditions, fluctuations in the markets for equity securities, short-term supply and demand factors for real estate investment trusts and numerous other factors beyond the control of the Trust. The Trust has no obligation to distribute to Unitholders any fixed amount, and reductions in, or suspensions of, cash distributions may occur that would reduce yield. There is no assurance that there will exist a liquid market for trading in the Units which may have an adverse effect on the market price of the Units. Trading prices of the Units may not correspond to the underlying value of the Trust’s assets.

5454 55
27
Legal Rights Normally Associated with the Ownership of Shares of a Corporation As holders of Units, Unitholders do not have all of the statutory rights normally associated with ownership of shares of a company including, for example, the right to bring “oppression” or “derivative” actions against the Trust. The Units are not “deposits” within the meaning of the Canada Deposit Insurance Corporation Act (Canada) and are not insured under the provisions of that Act or any other legislation. Furthermore, the Trust is not a trust company and, accordingly, is not registered under any trust and loan company legislation as it does not carry on or intend to carry on the business of a trust company.
Ability of Unitholders to Redeem Units It is anticipated that the redemption right attached to the Units will not be the primary mechanism by which holders of such Units liquidate their investments. The entitlement of holders of Units to receive cash upon the redemption of their Units is subject to the limitations that: (i) the total amount payable by the Trust in respect of such Units and all other Units tendered for redemption in the same calendar month shall not exceed $50,000 (provided that such limitation may be waived at the discretion of the Trustees); (ii) at the time such Units are tendered for redemption, the outstanding Units shall be listed for trading on a stock exchange or traded or quoted on another market which the Trustees consider, in their sole discretion provides representative fair market value prices for such Units; and (iii) the normal trading of the Units is not suspended or halted on any stock exchange on which the Units are listed for trading or, if not so listed, on any market on which the Units are quoted for trading, on the redemption date or for more than five trading days during the ten trading day period ending on the redemption date.
Regulatory Approvals Risk Upon a redemption of Units or termination of the Trust, the Trustees may distribute securities directly to the Unitholders, subject to obtaining any required regulatory approvals. No established market may exist for the securities so distributed at the time of the distribution and no market may ever develop. In addition, the securities so distributed may not be qualified investments for Mutual Fund Plans (Plans), depending upon the circumstances at the time.
Changes in Legislation There can be no assurance that the Canadian federal income tax laws (or the judicial interpretation thereof), the administrative and/or assessing practices of the Canadian Revenue Agency (CRA) and/or the treatment of mutual fund trusts (including real estate investment trusts) and/or SIFTs will not be changed in a manner which adversely affects the Trust or Unitholders.
Investment Eligibility The Trust will endeavour to ensure that the Units, continue to be qualified investments for Plans. However, there can be no assurance that this will be so. The Tax Act imposes penalties for the acquisition or holding by Plans of non-qualified investments. Any Notes distributed to, and received by, a Unitholder on an in specie redemption of Units will not be a qualified investment for Plans.
The Units will continue to be qualified investments for Plans, provided that the Trust qualifies as a “mutual fund trust” under the Tax Actor the Units are listed on a designated stock exchange (which includes the TSX). Even though the Units are qualified investments, a holder of a tax-free savings account (“TFSA”) or an annuitant under a registered retirement savings plan (“RRSP”) or registered retirement income fund (“RRIF”) will be liable to a penalty tax if the Units are “prohibited investments” for such TFSA, RRSP or RRIF. Units will generally not be “prohibited investments” unless the holder of the TFSA, or annuitant of the RRSP or RRIF, does not deal at arm’s length with the Trust for purposes of the Tax Act; or has a “significant interest” (within the meaning of the Tax Act) in the Trust. The Units will also generally not be prohibited investments if they are “excluded property” (as defined in the Tax Act). Individuals who hold Units in a TFSA, RRSP or RRIF should consult their own tax advisors regarding the potential application of the prohibited investment rules in their particular circumstances.
28
SIFT Rules Certain rules in the Tax Act (the “SIFT Rules”) affect the tax treatment of “specified investment flow-through trusts (“SIFT trusts”), and their unitholders. A trust resident in Canada will generally be a SIFT trust for a particular taxation year for purposes of the Tax Act if, at any time during the taxation year, investments in the trust are listed or traded on a stock exchange or other public market and the trust holds one or more “non-portfolio properties” as defined in the Tax Act. Non-portfolio properties generally include certain investments in real properties situated in Canada and certain investments in corporations and trusts resident in Canada and in partnerships with specified connections to Canada. However, a trust will not be considered to be a SIFT trust for a taxation year if it qualifies as a “real estate investment trust” (as defined in the Tax Act) for that year (the REIT Exception”).
SIFT Taxation Regime Pursuant to the SIFT Rules, distributions of a SIFT trust’s “non-portfolio earnings” are not deductible to the SIFT trust in computing its income. Non-portfolio earnings are generally defined as income attributable to a business carried on by the SIFT trust in Canada or to income (other than dividends) from, and taxable capital gains from the disposition of, non-portfolio properties. The SIFT trust is itself liable to pay income tax on an amount equal to the amount of such non-deductible distributions at a rate that is substantially equivalent to the combined federal and provincial general tax rate applicable to taxable Canadian corporations. Such non-deductible distributions paid to a holder of units of the SIFT trust are generally deemed to be taxable dividends received by the holder of such units from a taxable Canadian corporation. Such deemed dividends will qualify as “eligible dividends” for purposes of the enhanced gross-up and dividend tax credit if paid to any individual resident in Canada. Distributions that are paid as returns of capital will not attract this tax.
The REIT Exception A trust that satisfies the REIT Exception is excluded from the definition of a SIFT trust in the Tax Act and is therefore not subject to the SIFT Rules. In addition to the trust being resident in Canada throughout the year, the following five criteria must be met in order for the Trust to qualify for the REIT Exception:
1. at each time in the Taxation Year, the total fair market value at that time of all “non-portfolio properties” that are “qualified REIT properties” held by the Trust must be at least 90% of the total fair market value at that time of all non-portfolio properties held by the Trust;
2. not less than 90% of the Trust’s “gross REIT revenue” for the taxation year is from one or more of the following: “rent from real or immovable properties”, interest, capital gains from dispositions of “real or immovable properties” that are capital properties, dividends, royalties and dispositions of “eligible resale properties”;
3. not less than 75% of the Trust’s gross REIT revenue for the taxation year is derived from one or more of the following: rent from real or immovable properties, interest from mortgages, or hypothecs, on real or immovable properties, from dispositions of real or immovable properties that are capital properties;
4. at no time in the Taxation Year can the total fair market value of properties comprised of real or immovable property that is capital property, an “eligible resale property”, cash, deposits (within the meaning of the Canada Deposit Insurance Corporation Act or with a branch in Canada of a bank or a credit union), indebtedness of Canadian corporations represented by banker’s acceptances, and debt issued or guaranteed by the Canadian government or issued by a province, municipal government or certain other qualifying public institutions be less than 75% of the “equity value” (in each case, as defined in the Tax Act) of the Trust at that time; and
5. investments in the Trust must be, at any time in the taxation year, listed or traded on a stock exchange or other public market.
The SIFT Rules contain a “look-through rule” under which a trust could qualify for the REIT Exception where it holds properties indirectly through intermediate entities, provided that each such entity, assuming it were a trust, would satisfy paragraphs (1) through (4) of the REIT Exception above.
5656 57
29
The REIT Exception does not fully accommodate the current business structures used by many Canadian REITs, and contains a number of technical tests that many Canadian REITs, including the Trust, may find difficult to satisfy.
The Trust will endeavour to ensure that the Trust will qualify for the REIT Exception at all times during each Taxation Year, and each direct and indirect subsidiary of the Trust will qualify as an “excluded subsidiary entity” (as defined in the Tax Act) such that the Trust will not be a SIFT Trust within the meaning of the SIFT Rules at any time. However, there can be no assurance that this will be so. There can also be no assurance that the investments or activities undertaken by the Trust in a Taxation Year will not result in the Trust failing to qualify for the REIT Exception for that Taxation Year.
If the Trust does not qualify for the REIT Exception for a Taxation Year, the SIFT Rules will apply to the Trust for that year. Application of the SIFT Rules may, depending on the nature of distributions from the REIT, including what portion of its distributions are income and what portion are returns of capital, have a material adverse effect on the after-tax returns of certain Unitholders. Such adverse tax consequences may impact the future level of cash distributions made by the Trust, the ability of the Trust to undertake future financings and acquisitions and could also adversely affect the marketability of the Trust’s securities.
The Trust believes that it will qualify for the REIT Exception throughout 2015 and therefore the SIFT Rules will have no application and the Trust and its Unitholders will not, directly or indirectly, be subject to tax imposed by the SIFT Rules. In the unlikely event that the Trust does not qualify for the REIT Exception, distributions of income may be treated by the Trust as distributions of capital are not taxed and instead reduce the adjusted cost base of the Unitholder’s Units.
The REIT Exception is applied on an annual basis. Accordingly, if the Trust did not qualify for the REIT Exception in a particular Taxation Year, it may be possible to restructure the Trust such that it may qualify in a subsequent Taxation Year. There can be no assurances, however, that the Trust will be able to restructure such that it will not be subject to the tax imposed by the SIFT Rules, or that any such restructuring, if implemented, would not result in material costs or other adverse consequences to the Trust and Unitholders. The Trust intends to take such steps as are necessary to ensure that, to the extent possible, it qualifies for the REIT Exception and any negative effects of the SIFT Rules on the Trust and Unitholders are minimized.
Other Canadian Tax Matters Although the Trust is of the view that all expenses to be claimed by the Trust and/or its subsidiary entities will be reasonable and deductible and that the cost amount and capital cost allowance claims of such entities will have been correctly determined, there can be no assurance that the Tax Act or the interpretation of the Tax Act will not change, or that the CRA will agree. If the CRA successfully challenges the deductibility of such expenses, the taxable income of the Trust and/or its subsidiary entities and indirectly the Unitholders may increase or change. The extent to which distributions will be non-taxable in the future will depend in part on the extent to which the Trust and/or its subsidiary entities is able to deduct capital cost allowance relating to its Properties.
In structuring its affairs, the Trust consults with its tax and legal advisors and receives advice as to the optimal method in which to complete its business objectives while at the same time minimizing or deferring taxes, where possible. There is no guarantee that the relevant taxing authorities will not take a different view as to the ability of the Trust to utilize these strategies. It is possible that one or more taxing authorities may review these strategies and determine that tax should have been paid, in which case the Trust may be liable for such taxes. Such increased tax liability could have a material adverse effect upon the Trust’s ability to make distributions to Unitholders.
Risks Associated with Disclosure Controls and Procedures on Internal Control over Financial Reporting The Trust could be adversely affected if there are deficiencies in disclosure controls and procedures or internal control over financial reporting.
The design and effectiveness of disclosure controls and procedures and internal control over financial reporting may not prevent all errors, misstatements or misrepresentations. Deficiencies, including material weaknesses, in internal control over financial reporting which may occur could result in misstatements of the Trust’s results of operations, restatements of
30
financial statements, a decline in the Unit price, or otherwise materially adversely affect the Trust’s business, reputation, results of operations, financial condition or liquidity.
Unitholders Limited Liability Recourse for any liability of the Trust is intended to be limited to the assets of the Trust. The Amended and Restated Declaration of Trust provides that no Unitholder or annuitant under a plan of which a Unitholder acts as trustee or carrier (an “annuitant”) will be held to have any personal liability as such, and that no resort shall be had to the private property of any Unitholder or annuitant for satisfaction of any obligation or claim arising out of or in connection with any contract or obligation of the Trust or of the Trustees. Because of uncertainties in the law relating to investment trusts, there is a risk (which is considered by counsel to be remote in the circumstances) that a Unitholder or annuitant could be held personally liable for obligations of the Trust (to the extent that claims are not satisfied by the Trust) in respect of contracts which the Trust enters into and for certain liabilities arising other than out of contract including claims in tort, claims for taxes and possibly certain other statutory liabilities. The Trust will seek to limit recourse under all of its material contracts to the assets of the Trust. However, in conducting its affairs, the Trust will be indirectly acquiring real property investments, subject to existing contractual obligations, including obligations under mortgages and leases. Trustees will use all reasonable efforts to have any such obligations under mortgages on such properties and material contracts, other than leases, modified so as not to have such obligations binding upon any of the Unitholders or annuitants personally. However, the Trust may not be able to obtain such modification in all cases. To the extent that claims are not satisfied by the Trust, there is a risk that a Unitholder or annuitant will be held personally liable for obligations of the Trust where the liability is not disavowed as described above. Ontario has enacted legislation intended to remove uncertainty about the liability of Unitholders of publicly traded trusts. The Trust Beneficiaries’ Liability Act, 2004, implemented on January 1, 2005, is a clear legislative statement that the Unitholders of a trust that is a reporting issuer and governed by the laws of Ontario will not be personally liable for the obligations and liabilities of the trust or any of its trustees that arise after The Trust Beneficiaries’ Liability Act, 2004, came into force, which The Trust Beneficiaries’ Liability Act, 2004, states was December 16, 2004.
Structural Subordination of Debt Liabilities of a parent entity with assets held by various subsidiaries may result in the structural subordination of the lenders to the parent entity. The parent entity is entitled only to the residual equity of its subsidiaries after all debt obligations of its subsidiaries are discharged. In the event of a bankruptcy, liquidation or reorganization of the Trust, holders of indebtedness of the Trust (including holders of Notes) may become subordinate to lenders to the subsidiaries of the Trust.
Statutory Remedies The Trust is not a legally recognized entity within the relevant definitions of the Bankruptcy and Insolvency Act, the Companies’ Creditors Arrangement Act and in some cases, the Winding Up and Restructuring Act. As a result, in the event a restructuring of the Trust were necessary, the Trust would not be able to access the remedies available thereunder. In the event of a restructuring, a holder of debentures may be in a different position than a holder of secured indebtedness of a corporation.
Outstanding Indebtedness The ability of the Trust to make cash distributions to Unitholders or to make other payments are subject to applicable law and contractual restrictions contained in instruments governing the Trust’s indebtedness. Although the Trust is currently not in default under any existing loan agreements or guarantee agreements, any future default could have significant consequences for Unitholders. Further, the amount of the Trust’s indebtedness could have significant consequences to holders of Units, including the ability of the Trust to obtain additional financing for working capital, capital expenditures or future acquisitions may be limited; and that a significant portion of the Trust’s cash flow from operations may be dedicated to the payment of principal and interest on its indebtedness thereby reducing funds available for future operations and distributions. Additionally, some of The Trust’s debt may be at variable rates of interest or may be renewed at higher rates of interest, which may affect cash flow from operations available for distributions. Also, in the event of a significant economic downtown, there can be no assurance that the Trust will generate sufficient cash flow from operations to meet required interest and principal payments. The Trust is subject to the risk that it may not be able to refinance existing indebtedness upon maturity or that the terms of such refinancing may be onerous. These factors may adversely affect the Trust’s cash distributions.
5858 59
31
Dependence on Key Personnel The management of the Trust depends on the services of certain key personnel. The termination of employment by any of these key personnel could have a material adverse effect on the Trust.
Potential Conflicts of Interest The Trust may be subject to various conflicts of interest because of the fact that Trustees and officers of the Trust are engaged in other real estate-related business activities. The Trust may become involved in transactions which conflict with the interests of the foregoing. Further, the Chief Executive Officer of the Trust is also the principal of the Trust’s property management company. Trustees may from time to time deal with persons, firms, institutions or corporations with which the Trust may be dealing, or which may be seeking investments similar to those desired by the Trust. The interests of these persons could conflict with those of the Trust. In addition, from time to time, these persons may be competing with the Trust for available investment opportunities. The Amended and Restated Declaration of Trust contains “conflicts of interest” provisions requiring Trustees to disclose material interests in material contracts and transactions and to refrain from voting thereon.
Dilution The number of Units the Trust is authorized to issue is unlimited. The Trustees have the discretion to issue additional Units in other circumstances, including pursuant to the Unit Option Plan, the Deferred Unit Plan and the Long Term Incentive Plan and upon conversion or exercise of other convertible securities. Any issuance of additional Units may have a dilutive effect on the existing holders of the Units. Future acquisitions and combinations with other entities could result in significant dilution.
Restrictions on Potential Growth and Reliance on Credit Facilities The payout by the Trust of a substantial part of its operating cash flow could adversely affect the Trust’s ability to grow unless it can obtain additional financing. Such financing may not be available, or renewable, on attractive terms or at all. In addition, if current credit facilities were to be cancelled or could not be renewed at maturity on similar terms, the Trust could be materially and adversely affected.
Acquisition Risks An important factor in the success of the Trust is the ability of the management of the combined entities to coexist and, if appropriate, integrating all or part of the holdings, systems and personnel of such entities. The integration of businesses can result in unanticipated operational problems and interruptions, expenses and liabilities, the diversion of management attention and the loss of key employees, tenants or suppliers. There can be no assurance that the business integration will be successful or that future acquisitions will not adversely affect the business, financial condition or operating results of the combined entities. There can be no assurance that the combined entities will not incur additional material charges in subsequent quarters to reflect additional costs associated with the Trust or that that the benefits expected from the Trust will be realized. The Trust’s planned growth will require increasingly sophisticated financial and operational controls to be implemented. In the event that financial and operational controls do not keep pace with the Trust’s expansion, the potential for unintended accounting and operational errors may increase.
Proposed Acquisitions There can be no assurance that the Trust will complete any proposed acquisitions described herein on the basis described or on expected closing dates, if at all. In the event the Trust does not complete proposed acquisitions, the Trust’s financia l performance may be negatively impacted until suitable acquisitions with appropriate investment returns can be made. There is no assurance that such suitable investments will be available to the Trust in the near future or at all.
Interest Risk Interest risk is the combined risk that the Trust would experience a loss as a result of its exposure to a higher interest rate environment (interest rate risk) and the possibility that at the term end of a mortgage the Trust would be unable to renew the maturing debt either with the existing or an additional lender (renewal risk). The Trust attempts to manage its interest rate risk by maintaining a balanced, maturing portfolio with mortgage debt being financed for varying lengths of time
32
through the implementation of a structured mortgage debt ladder. There can however, be no assurance that the renewal of debt will be on as favourable of terms as the Trust’s existing debt.
Appraisals of Properties An appraisal is an estimate of market value and caution should be used in evaluating data with respect to appraisals. It is a measure of value based on information gathered in the investigation, appraisal techniques employed and reasoning both quantitative and qualitative, leading to an opinion of value. The analysis, opinions, and conclusions in an appraisal are typically developed based on, and in conformity with, or interpretation of the guidelines and recommendations set forth in the Canadian Uniform Standards of Appraisal Practice. Appraisals are based on various assumptions of future expectations of property performance and while the appraiser’s internal forecast of net income for the properties appraised are considered to be reasonable at that time, some of the assumptions may not materialize or may differ materially from actual experience in the future.
Debt and Distributable Income Distributable Income available for distribution to Unitholders is based, directly and indirectly, on the ability of the Trust to pay distributions on its Units, such ability, in each case, is dependent upon the performance of the business of the Trust and its ability to maintain certain debt levels. The Trust will be required to refinance certain debt as it expires. The Trust may be unable to refinance such debt on terms as favourable as existing debt, or at all. In addition, the Trust’s ability to borrow is subject to certain restrictive covenants contained in the Declaration of Trust and certain credit agreements. The Trust’s ability to make distributions may be materially affected should any of the foregoing conditions arise.
Legal Proceedings In the normal course of operations, the Trust may become subject to a variety of legal and other claims. Management and legal counsel evaluate all claims on their apparent merits, and accrue management's best estimate of the estimated costs to satisfy such claims.
On September 8, 2009, NorthWest Value Partners Inc. (“NWVP”) issued a Notice of Application in the Superior Court of Justice of Ontario against the former trustees of the Trust and others (but not against the Trust itself) seeking a declaration, among other things, that the trustees of the Trust did not have authority to complete the private placement that closed on September 3, 2009. On September 28, 2009, the Superior Court of Justice of Ontario directed a trial on certain matters but denied most of the requests by NWVP. Specifically, the Court denied the NWVP request for a declaration that the trustees of the Trust did not have the authority to close the private placement. Further, the court denied the NWVP request that the investors in the private placement not be permitted to vote at the annual and special meeting of unitholders of the Trust held on September 30, 2009. The Superior Court of Justice of Ontario awarded the Trust costs in excess of $100,000. NWVP has paid to the Trust the awarded costs.
On October 15, 2009, NWVP filed a notice of appeal with the Court of Appeal for Ontario appealing the decision of the Superior Court of Justice. On June 7, 2010, the appeal by NWVP was dismissed with costs of $25,000 ordered payable by NWVP to the Trust. NWVP has paid to the Trust the awarded costs.
Future legal costs may be incurred if NWVP proceeds to trial on the other outstanding issues which remain from the September 8, 2009 Notice of Application relating to the private placement. While the Trust maintains that the merits of NWVP’s claims for damages are low, there is the possibility of an award of damages, in the event that NWVP was able to prove damages at trial. In such event, it is expected that the former trustees of the Trust would seek indemnity from the Trust to the extent that any such damages are not fully covered by policies of insurance held by the Trust for the benefit of the former trustees. The foregoing litigation costs, if incurred without successfully recovering the costs, and an award of damages against the former trustees that is not fully covered by policies of insurance held by the Trust for the benefit of the former trustees could to the extent of the Trust's indemnification obligations, if any, have an adverse impact on the financial condition of the Trust.
Financial Risk Management and Financial Instruments a) Overview
6060 61
33
The Trust is exposed to credit risk, liquidity risk and market risk. The Trust’s primary risk management objective is to protect earnings and cash flow and, ultimately, unitholders value. Risk management strategies, as discussed below, are designed and implemented to ensure the Trust’s risks and the related exposures are consistent with its business objectives and risk tolerance.
b) Credit Risk
Credit risk represents the financial loss that the Trust would experience if a tenant failed to meet its obligations in accordance with the terms and conditions of the lease. The Trust’s credit risk is attributable to its rents and other receivables, loan receivable long-term incentive plan, mortgage holdbacks and mortgages receivable.
The amounts disclosed as rents and other receivables and loan receivable long-term incentive plan in the consolidated balance sheet are net of allowances for doubtful accounts, estimated by the Trust’s management based on prior experience and their assessment of the current economic environment. The Trust establishes an allowance for doubtful accounts that represents its estimate of incurred losses in respect of rents and other receivables. The main components of this allowance are a specific loss component that relates to individually significant exposures and an overall loss component established based on historical trends. At December 31, 2014, the Trust had past due rents and other receivables of $2.3 million net of an allowance for doubtful accounts of $1.0 million which adequately reflects the Trust's credit risk.
The Trust believes that the concentration of credit risk of accounts receivable is limited due to its broad tenant base, dispersed across varying geographic locations.
The Trust has established various internal controls, such as credit checks and security deposits, designed to mitigate credit risk. While the Trust's credit controls and processes have been effective in mitigating credit risk, these controls cannot eliminate credit risk and there can be no assurance that these controls will continue to be effective or that the Trust's current credit loss experience will improve.
The amounts shown in the audited consolidated balance sheet as mortgage holdbacks relate primarily to amounts that will be released upon the completion of repairs to certain buildings. Mortgages receivable represent vendor take back loans on the sale of buildings and are secured by the building. Management believes there is minimal credit risk due to the nature of these amounts receivable and the underlying collateral.
c) Liquidity Risk
Liquidity risk is the risk that the Trust will not be able to meet its financial obligations as they fall due. The Trust manages liquidity risk through the management of its capital structure and financial leverage, as outlined in note 19 in the December 31, 2014 audited consolidated financial statements. It also manages liquidity risk by continuously monitoring actual and projected cash flows to ensure that it will always have sufficient liquidity to meet its liabilities when due, under both normal and stressed conditions, without incurring unacceptable losses or risking damage to the Trust's reputation.
As at December 31, 2014, the Trust had credit facilities as described in note 9 in the December 31, 2014 audited consolidated financial statements.
Note 8 in the December 31, 2014 audited consolidated financial statements reflects the contractual maturities for mortgage and loans payable of the Trust at December 31, 2014, excluding interest payments. The Trust continues to refinance the outstanding debts as they mature. Given the Trust's available credit and its available liquid resources from both financial assets and on-going operations, management assesses the Trust's liquidity risk to be low.
d) Fair Value
Financial instruments are defined as a contractual right to receive or deliver cash or another financial asset. The fair values of the Trust’s financial instruments, except for mortgages payable and loans payable, approximate their recorded values due to their short-term nature and or the credit terms of those instruments.
34
The fair value of the mortgages and loans payable has been determined by discounting the cash flows using current market rates of similar instruments. These estimates are subjective in nature and therefore cannot be determined with precision. The fair value of mortgages and loans payable and credit facilities is approximately $490 million as at December 31, 2014.
Fair value estimates are made at a specific point in time, based on relevant market information and information about the financial instrument. These estimates are subjective in nature and involve uncertainties and matters of significant judgment and therefore cannot be determined with precision. Changes in assumptions could significantly affect estimates.
e) Market Risk
Market risk includes the risk that changes in interest rates will affect the Trust's cash flows or the fair value of its financial instruments.
At December 31, 2014, the Trust's had no mortgage debt at variable interest rates. The Trust's credit facilities bear interest at variable rates. If there was a 100 basis point change in the interest rate, cash flows would have changed by approximately $0.2 million for the year ended December 31, 2014.
OFF-BALANCE SHEET ARRANGEMENTS As of December 31, 2014 the Trust did not have any off-balance sheet arrangements in place.
RELATED PARTY TRANSACTIONS The transactions with related parties are incurred in the normal course of business and are measured at the exchange amounts, believed to represent fair value. Related party transactions have been listed below, unless they have been disclosed elsewhere in the audited financial statements.
(i) Accounts Payable (net of amounts receivable) As at December 31, 2014, $1.0 million (December 31, 2013 - $0.6 million) was included in accounts payable and accrued liabilities, net of amounts receivable, which are due to companies controlled by an officer of the Trust. The amounts were non-interest bearing and due on demand.
(ii) Services During the year ended December 31, 2014 the Trust incurred $7.4 million (December 31, 2013 - $6.7 million) in services from companies controlled by an officer of the Trust. Of the services received approximately $3.7 million (December 31, 2013 - $3.3 million) has been capitalized to the investment properties and the remaining amounts are included in operating and administrative costs.
DISCLOSURE CONTROLS AND PROCEDURES AND INTERNAL CONTROL OVER FINANCIAL REPORTING Disclosure controls and procedures are designed to provide reasonable assurance that all material information is gathered and reported to senior management, including the Chief Executive Officer and the Chief Financial Officer, on a timely basis so that appropriate decisions can be made regarding public disclosure. The preparation of this information is supported by a set of disclosure controls and procedures implemented by management.
The Trust’s Chief Executive Officer and the Chief Financial Officer have evaluated the effectiveness of the Trust’s disclosure controls and procedures as of December 31, 2014 and concluded that such controls and procedures are adequate and effective to ensure that the information required to be disclosed by the Trust in its annual filings, interim filings or other reports that it files or submits pursuant to Canadian securities laws is (a) recorded, processed, summarized and reported within the time periods specified by applicable Canadian securities laws; and (b) accumulated and communicated to the management of the Trust, including its Chief Executive Officer and Chief Financial Officer, to allow timely decisions regarding required disclosure as specified in Canadian securities laws. The evaluation was performed in accordance with the
6262 63
35
Committee of Sponsoring Organizations of the Treadway Commission (“COSO”) control framework adopted by the Trust and the requirements of National Instrument 52-109 - Certification of Disclosure in Issuers’ Annual and Interim Filings of the Canadian Securities Administrators.
Internal controls over financial reporting are designed to provide reasonable assurance regarding the reliability of financial reporting and the preparation of financial statements for external purposes. The Trust’s Chief Executive Officer and the Chief Financial Officer have evaluated the effectiveness of the Trust’s internal controls over financial reporting as of December 31, 2014, and concluded that such controls are adequate and effective.
There were no changes in the internal controls over financial reporting during the financial year-end December 31, 2014, which have materially affected, or are reasonably likely to materially affect, the Trust’s internal controls over financial reporting.
SUBSEQUENT EVENT On February 19, 2015 the Trust completed a bought deal prospectus whereby it issued 11,719,000 Trust Units for cash proceeds of $75.0 million and expects to incur approximately $3.6 million in issue costs.
OUTSTANDING SECURITIES DATA As of March 3, 2015, the Trust had issued and outstanding: (i) 69,997,079 units; (ii) LP Class B Units that are exchangeable for 186,250 units of the Trust; (iii) options exercisable to acquire 1,503,080 units of the Trust; and (iv) deferred units that are redeemable for 1,867,200 units of the Trust.
ADDITIONAL INFORMATION Additional information concerning InterRent REIT, including InterRent REIT’s annual information form, is available on SEDAR at www.sedar.com.

6464
1
Collins Barrow Toronto LLP Collins Barrow Place 11 King Street West Suite 700, Box 27 Toronto, Ontario M5H 4C7 Canada T. 416.480.0160 F. 416.480.2646 www.collinsbarrow.com
This office is independently owned and operated by Collins Barrow Toronto LLP The Collins Barrow trademarks are used under License.
INDEPENDENT AUDITORS' REPORT To the Unitholders of InterRent Real Estate Investment Trust
We have audited the accompanying consolidated financial statements of InterRent Real Estate Investment Trust and its subsidiaries, which comprise the consolidated balance sheets as at December 31, 2014 and December 31, 2013 and the consolidated statements of income, unitholders’ equity and cash flows for the years ended December 31, 2014 and December 31, 2013 and a summary of significant accounting policies and other explanatory information.
Management’s Responsibility for the Consolidated Financial Statements
Management is responsible for the preparation and fair presentation of these consolidated financial statements in accordance with International Financial Reporting Standards, and for such internal control as management determines is necessary to enable the preparation of consolidated financial statements that are free from material misstatement, whether due to fraud or error.
Auditor’s Responsibility
Our responsibility is to express an opinion on these consolidated financial statements based on our audits. We conducted our audits in accordance with Canadian generally accepted auditing standards. Those standards require that we comply with ethical requirements and plan and perform the audit to obtain reasonable assurance about whether the consolidated financial statements are free from material misstatement.
An audit involves performing procedures to obtain audit evidence about the amounts and disclosures in the consolidated financial statements. The procedures selected depend on the auditor’s judgment, including the assessment of the risks of material misstatement of the consolidated financial statements, whether due to fraud or error. In making those risk assessments, the auditor considers internal control relevant to the entity’s preparation and fair presentation of the consolidated financial statements in order to design audit procedures that are appropriate in the circumstances, but not for the purpose of expressing an opinion on the effectiveness of the entity’s internal control. An audit also includes evaluating the appropriateness of accounting policies used and the reasonableness of accounting estimates made by management, as well as evaluating the overall presentation of the consolidated financial statements.
We believe that the audit evidence we have obtained in our audits is sufficient and appropriate to provide a basis for our audit opinion.
Opinion
In our opinion, the consolidated financial statements present fairly, in all material respects, the financial position of InterRent Real Estate Investment Trust and its subsidiaries as at December 31, 2014 and December 31, 2013 and its financial performance and its cash flows for the years ended December 31, 2014 and December 31, 2013, in accordance with International Financial Reporting Standards.
Licensed Public Accountants Chartered Accountants March 3, 2015 Toronto, Ontario
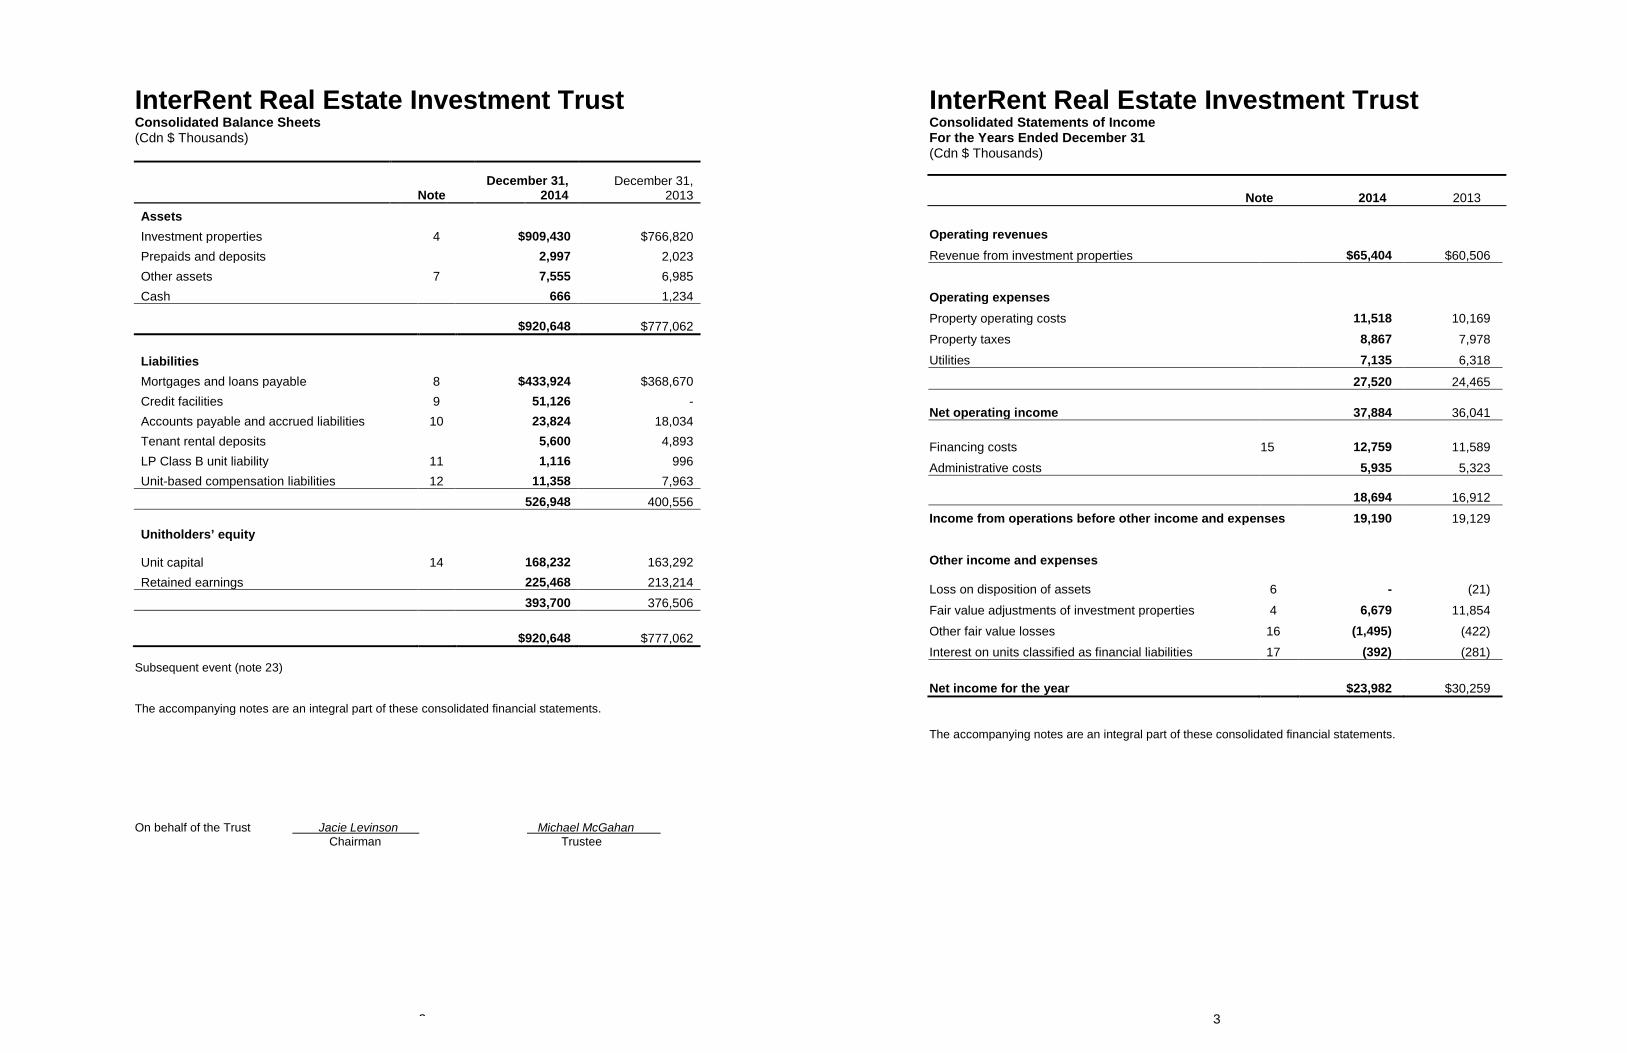
InterRent Real Estate Investment Trust
2
Consolidated Balance Sheets (Cdn $ Thousands)
Note December 31,
2014 December 31,
2013
Assets Investment properties 4 $909,430 $766,820
Prepaids and deposits
2,997 2,023 Other assets 7 7,555 6,985 Cash
666 1,234
$920,648 $777,062
Liabilities Mortgages and loans payable 8 $433,924 $368,670
Credit facilities 9 51,126 - Accounts payable and accrued liabilities 10 23,824 18,034 Tenant rental deposits
5,600 4,893
LP Class B unit liability 11 1,116 996 Unit-based compensation liabilities 12 11,358 7,963
526,948 400,556
Unitholders’ equity
Unit capital 14 168,232 163,292 Retained earnings
225,468 213,214
393,700 376,506
$920,648 $777,062
Subsequent event (note 23)
The accompanying notes are an integral part of these consolidated financial statements.
On behalf of the Trust Jacie Levinson Michael McGahan Chairman Trustee
InterRent Real Estate Investment Trust
3
Consolidated Statements of Income For the Years Ended December 31 (Cdn $ Thousands)
Note 2014 2013 Operating revenues
Revenue from investment properties $65,404 $60,506
Operating expenses Property operating costs
11,518 10,169 Property taxes
8,867 7,978
Utilities
7,135 6,318
27,520 24,465
Net operating income 37,884 36,041
Financing costs 15 12,759 11,589
Administrative costs
5,935 5,323
18,694 16,912 Income from operations before other income and expenses
19,190 19,129
Other income and expenses
Loss on disposition of assets 6 - (21)
Fair value adjustments of investment properties 4 6,679 11,854 Other fair value losses 16 (1,495) (422) Interest on units classified as financial liabilities 17 (392) (281)
Net income for the year $23,982 $30,259 The accompanying notes are an integral part of these consolidated financial statements.
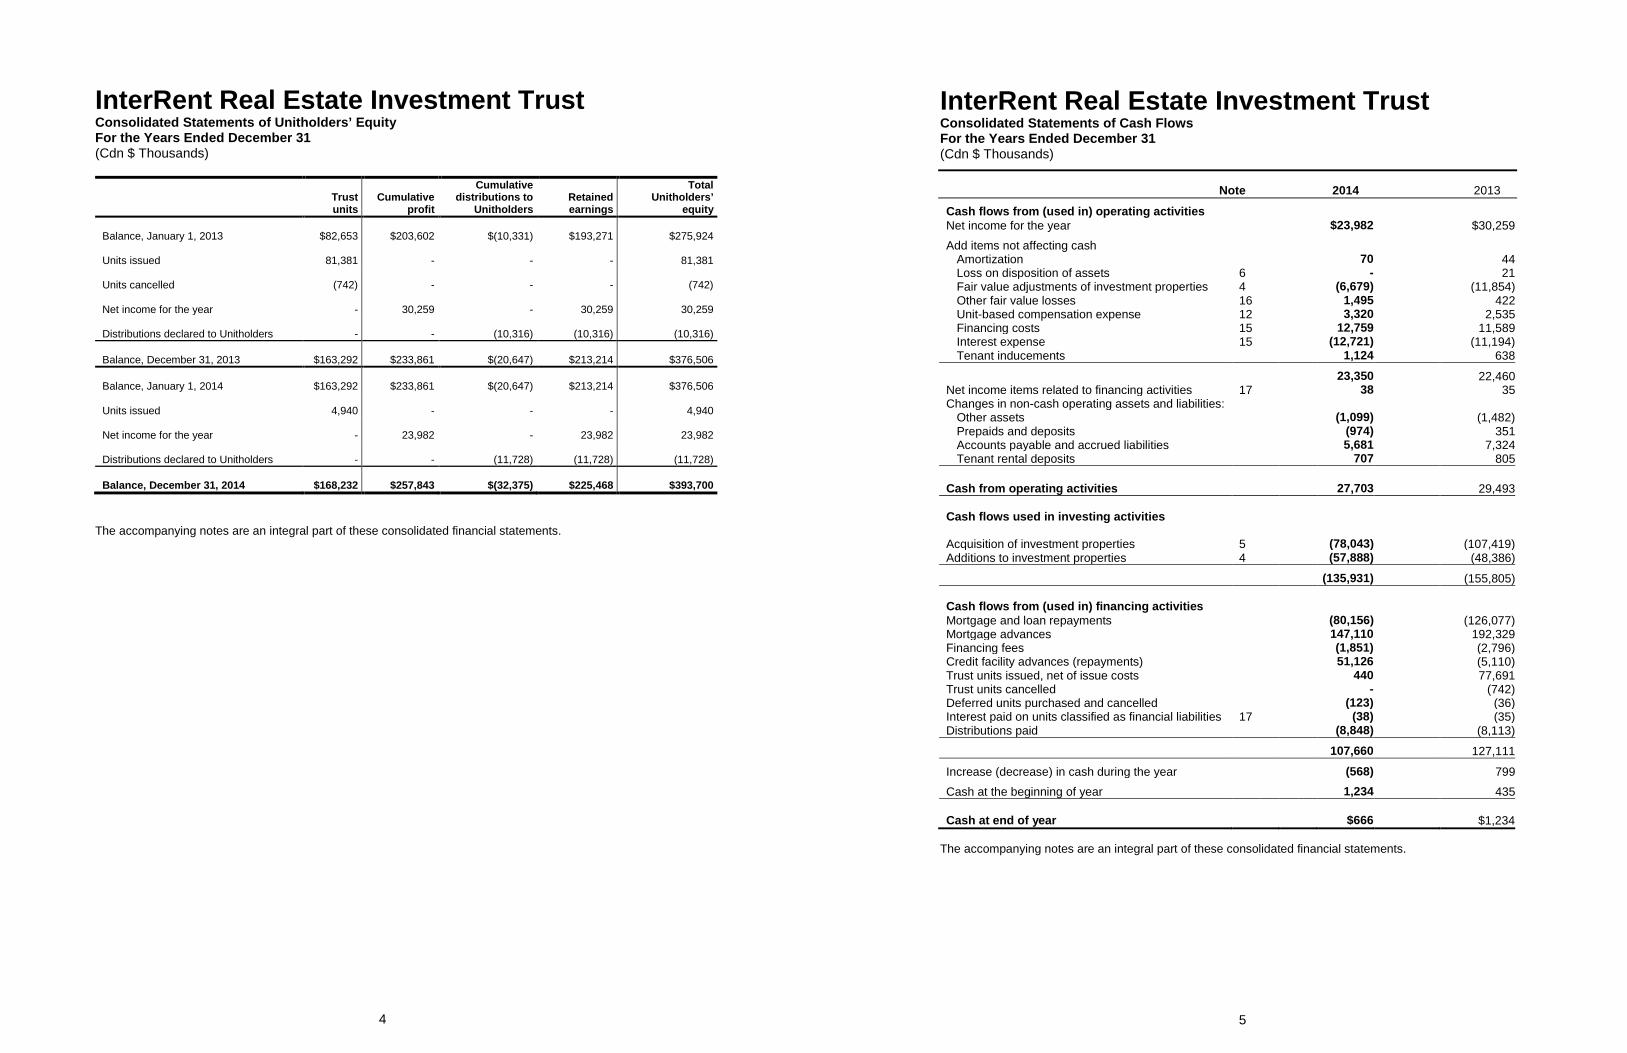
InterRent Real Estate Investment Trust
4
Consolidated Statements of Unitholders’ Equity For the Years Ended December 31 (Cdn $ Thousands)
Trust units
Cumulative profit
Cumulative distributions to
Unitholders Retained earnings
Total Unitholders’
equity Balance, January 1, 2013 $82,653 $203,602 $(10,331) $193,271 $275,924 Units issued 81,381 - - - 81,381 Units cancelled (742) - - - (742) Net income for the year - 30,259 - 30,259 30,259 Distributions declared to Unitholders - - (10,316) (10,316) (10,316) Balance, December 31, 2013 $163,292 $233,861 $(20,647) $213,214 $376,506 Balance, January 1, 2014 $163,292 $233,861 $(20,647) $213,214 $376,506 Units issued 4,940 - - - 4,940 Net income for the year - 23,982 - 23,982 23,982 Distributions declared to Unitholders - - (11,728) (11,728) (11,728) Balance, December 31, 2014 $168,232 $257,843 $(32,375) $225,468 $393,700
The accompanying notes are an integral part of these consolidated financial statements.
InterRent Real Estate Investment Trust
5
Consolidated Statements of Cash Flows For the Years Ended December 31 (Cdn $ Thousands)
Note 2014 2013
Cash flows from (used in) operating activities
Net income for the year
$23,982 $30,259
Add items not affecting cash
Amortization
70 44
Loss on disposition of assets 6
- 21 Fair value adjustments of investment properties 4
(6,679) (11,854)
Other fair value losses 16
1,495 422 Unit-based compensation expense 12
3,320 2,535
Financing costs 15
12,759 11,589 Interest expense 15
(12,721) (11,194)
Tenant inducements
1,124 638
23,350 22,460
Net income items related to financing activities 17
38 35 Changes in non-cash operating assets and liabilities:
Other assets
(1,099) (1,482) Prepaids and deposits
(974) 351
Accounts payable and accrued liabilities
5,681 7,324 Tenant rental deposits
707 805
Cash from operating activities
27,703 29,493
Cash flows used in investing activities
Acquisition of investment properties 5
(78,043) (107,419) Additions to investment properties 4
(57,888) (48,386)
(135,931) (155,805)
Cash flows from (used in) financing activities
Mortgage and loan repayments
(80,156) (126,077)
Mortgage advances
147,110 192,329 Financing fees
(1,851) (2,796)
Credit facility advances (repayments)
51,126 (5,110) Trust units issued, net of issue costs
440 77,691
Trust units cancelled
- (742) Deferred units purchased and cancelled
(123) (36)
Interest paid on units classified as financial liabilities 17
(38) (35) Distributions paid
(8,848) (8,113)
107,660 127,111
Increase (decrease) in cash during the year
(568) 799
Cash at the beginning of year
1,234 435
Cash at end of year
$666 $1,234 The accompanying notes are an integral part of these consolidated financial statements.
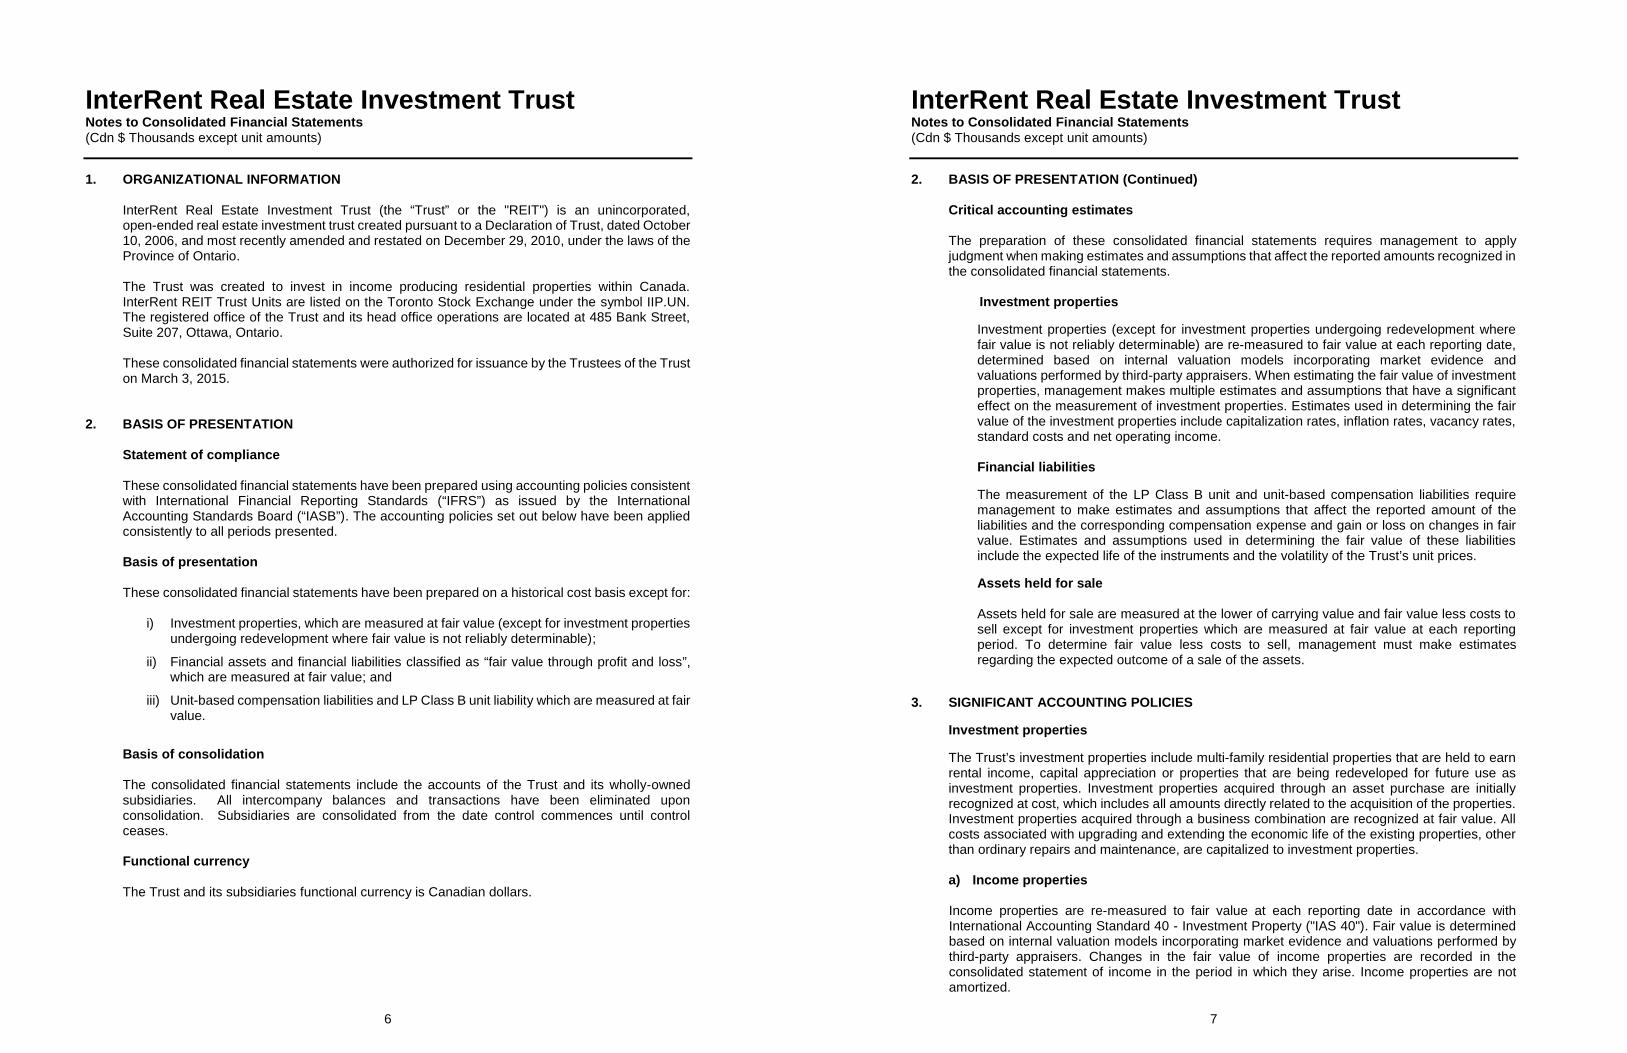
InterRent Real Estate Investment Trust Notes to Consolidated Financial Statements (Cdn $ Thousands except unit amounts)
6
1. ORGANIZATIONAL INFORMATION
InterRent Real Estate Investment Trust (the “Trust” or the "REIT") is an unincorporated, open-ended real estate investment trust created pursuant to a Declaration of Trust, dated October 10, 2006, and most recently amended and restated on December 29, 2010, under the laws of the Province of Ontario. The Trust was created to invest in income producing residential properties within Canada. InterRent REIT Trust Units are listed on the Toronto Stock Exchange under the symbol IIP.UN. The registered office of the Trust and its head office operations are located at 485 Bank Street, Suite 207, Ottawa, Ontario. These consolidated financial statements were authorized for issuance by the Trustees of the Trust on March 3, 2015.
2. BASIS OF PRESENTATION
Statement of compliance These consolidated financial statements have been prepared using accounting policies consistent with International Financial Reporting Standards (“IFRS”) as issued by the International Accounting Standards Board (“IASB”). The accounting policies set out below have been applied consistently to all periods presented. Basis of presentation These consolidated financial statements have been prepared on a historical cost basis except for:
i) Investment properties, which are measured at fair value (except for investment properties undergoing redevelopment where fair value is not reliably determinable);
ii) Financial assets and financial liabilities classified as “fair value through profit and loss”, which are measured at fair value; and
iii) Unit-based compensation liabilities and LP Class B unit liability which are measured at fair value.
Basis of consolidation The consolidated financial statements include the accounts of the Trust and its wholly-owned subsidiaries. All intercompany balances and transactions have been eliminated upon consolidation. Subsidiaries are consolidated from the date control commences until control ceases.
Functional currency The Trust and its subsidiaries functional currency is Canadian dollars.
InterRent Real Estate Investment Trust Notes to Consolidated Financial Statements (Cdn $ Thousands except unit amounts)
7
2. BASIS OF PRESENTATION (Continued) Critical accounting estimates The preparation of these consolidated financial statements requires management to apply judgment when making estimates and assumptions that affect the reported amounts recognized in the consolidated financial statements.
Investment properties Investment properties (except for investment properties undergoing redevelopment where fair value is not reliably determinable) are re-measured to fair value at each reporting date, determined based on internal valuation models incorporating market evidence and valuations performed by third-party appraisers. When estimating the fair value of investment properties, management makes multiple estimates and assumptions that have a significant effect on the measurement of investment properties. Estimates used in determining the fair value of the investment properties include capitalization rates, inflation rates, vacancy rates, standard costs and net operating income. Financial liabilities The measurement of the LP Class B unit and unit-based compensation liabilities require management to make estimates and assumptions that affect the reported amount of the liabilities and the corresponding compensation expense and gain or loss on changes in fair value. Estimates and assumptions used in determining the fair value of these liabilities include the expected life of the instruments and the volatility of the Trust’s unit prices. Assets held for sale Assets held for sale are measured at the lower of carrying value and fair value less costs to sell except for investment properties which are measured at fair value at each reporting period. To determine fair value less costs to sell, management must make estimates regarding the expected outcome of a sale of the assets.
3. SIGNIFICANT ACCOUNTING POLICIES
Investment properties The Trust’s investment properties include multi-family residential properties that are held to earn rental income, capital appreciation or properties that are being redeveloped for future use as investment properties. Investment properties acquired through an asset purchase are initially recognized at cost, which includes all amounts directly related to the acquisition of the properties. Investment properties acquired through a business combination are recognized at fair value. All costs associated with upgrading and extending the economic life of the existing properties, other than ordinary repairs and maintenance, are capitalized to investment properties. a) Income properties Income properties are re-measured to fair value at each reporting date in accordance with International Accounting Standard 40 - Investment Property ("IAS 40"). Fair value is determined based on internal valuation models incorporating market evidence and valuations performed by third-party appraisers. Changes in the fair value of income properties are recorded in the consolidated statement of income in the period in which they arise. Income properties are not amortized.
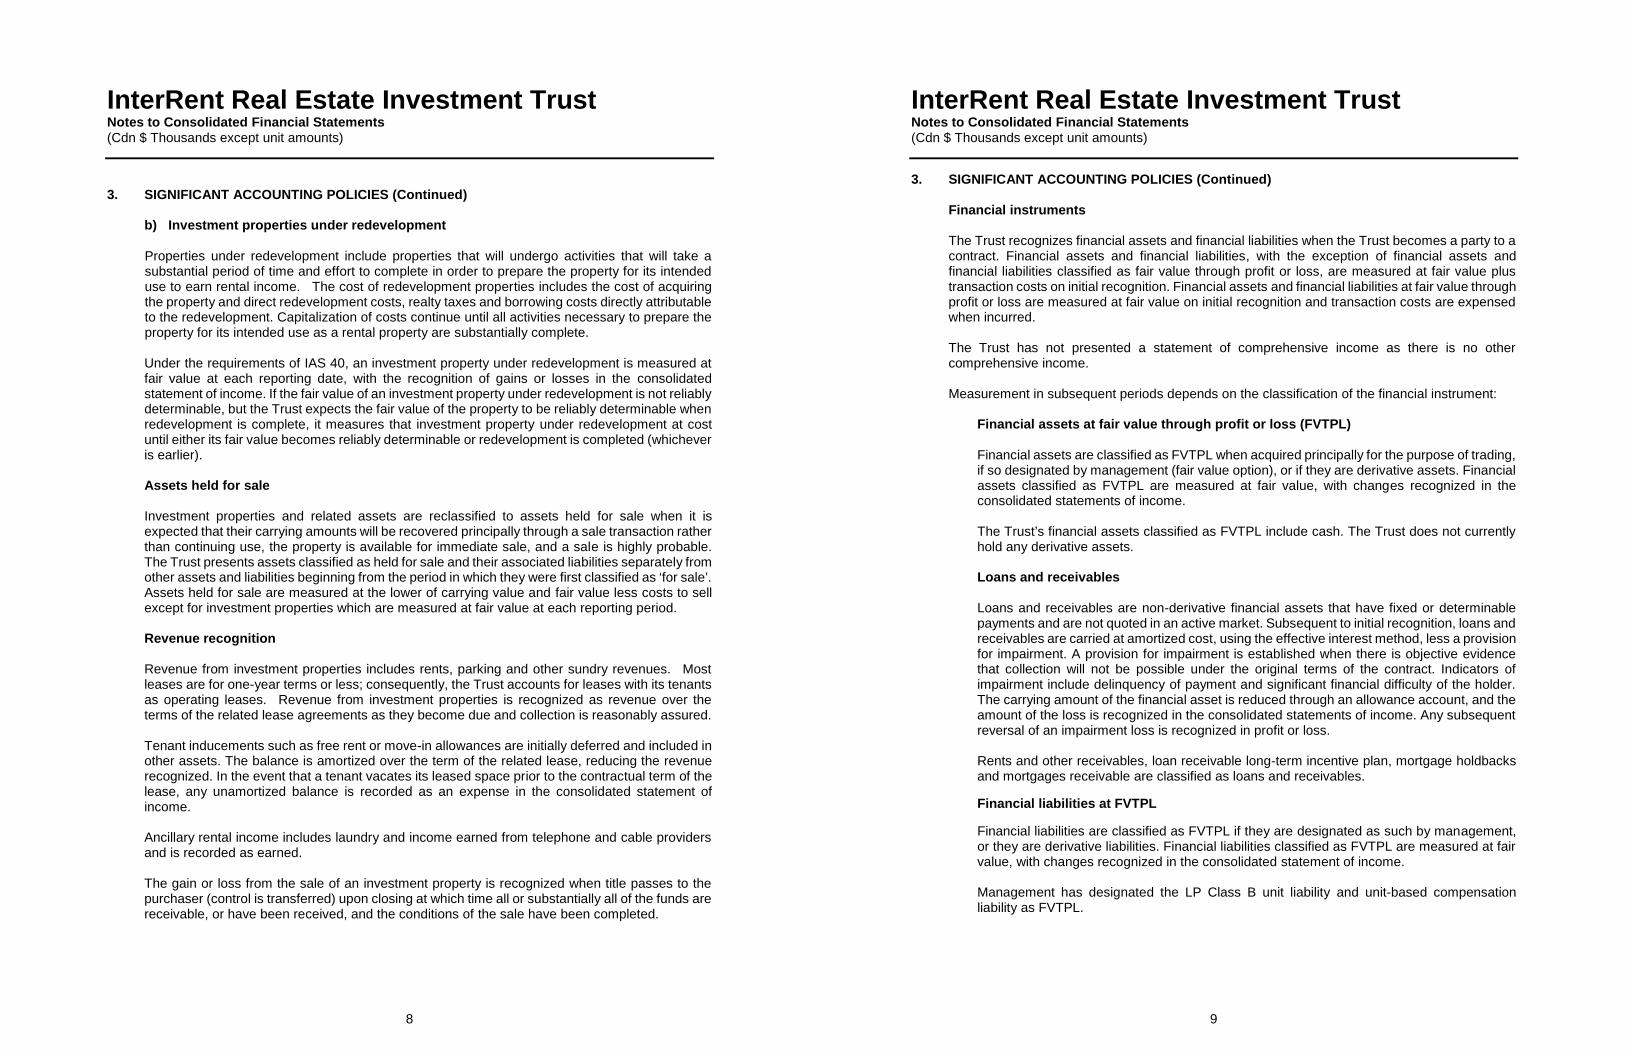
InterRent Real Estate Investment Trust Notes to Consolidated Financial Statements (Cdn $ Thousands except unit amounts)
8
3. SIGNIFICANT ACCOUNTING POLICIES (Continued)
b) Investment properties under redevelopment Properties under redevelopment include properties that will undergo activities that will take a substantial period of time and effort to complete in order to prepare the property for its intended use to earn rental income. The cost of redevelopment properties includes the cost of acquiring the property and direct redevelopment costs, realty taxes and borrowing costs directly attributable to the redevelopment. Capitalization of costs continue until all activities necessary to prepare the property for its intended use as a rental property are substantially complete. Under the requirements of IAS 40, an investment property under redevelopment is measured at fair value at each reporting date, with the recognition of gains or losses in the consolidated statement of income. If the fair value of an investment property under redevelopment is not reliably determinable, but the Trust expects the fair value of the property to be reliably determinable when redevelopment is complete, it measures that investment property under redevelopment at cost until either its fair value becomes reliably determinable or redevelopment is completed (whichever is earlier). Assets held for sale Investment properties and related assets are reclassified to assets held for sale when it is expected that their carrying amounts will be recovered principally through a sale transaction rather than continuing use, the property is available for immediate sale, and a sale is highly probable. The Trust presents assets classified as held for sale and their associated liabilities separately from other assets and liabilities beginning from the period in which they were first classified as ‘for sale’. Assets held for sale are measured at the lower of carrying value and fair value less costs to sell except for investment properties which are measured at fair value at each reporting period. Revenue recognition Revenue from investment properties includes rents, parking and other sundry revenues. Most leases are for one-year terms or less; consequently, the Trust accounts for leases with its tenants as operating leases. Revenue from investment properties is recognized as revenue over the terms of the related lease agreements as they become due and collection is reasonably assured. Tenant inducements such as free rent or move-in allowances are initially deferred and included in other assets. The balance is amortized over the term of the related lease, reducing the revenue recognized. In the event that a tenant vacates its leased space prior to the contractual term of the lease, any unamortized balance is recorded as an expense in the consolidated statement of income. Ancillary rental income includes laundry and income earned from telephone and cable providers and is recorded as earned. The gain or loss from the sale of an investment property is recognized when title passes to the purchaser (control is transferred) upon closing at which time all or substantially all of the funds are receivable, or have been received, and the conditions of the sale have been completed.
InterRent Real Estate Investment Trust Notes to Consolidated Financial Statements (Cdn $ Thousands except unit amounts)
9
3. SIGNIFICANT ACCOUNTING POLICIES (Continued) Financial instruments
The Trust recognizes financial assets and financial liabilities when the Trust becomes a party to a contract. Financial assets and financial liabilities, with the exception of financial assets and financial liabilities classified as fair value through profit or loss, are measured at fair value plus transaction costs on initial recognition. Financial assets and financial liabilities at fair value through profit or loss are measured at fair value on initial recognition and transaction costs are expensed when incurred. The Trust has not presented a statement of comprehensive income as there is no other comprehensive income. Measurement in subsequent periods depends on the classification of the financial instrument:
Financial assets at fair value through profit or loss (FVTPL) Financial assets are classified as FVTPL when acquired principally for the purpose of trading, if so designated by management (fair value option), or if they are derivative assets. Financial assets classified as FVTPL are measured at fair value, with changes recognized in the consolidated statements of income.
The Trust’s financial assets classified as FVTPL include cash. The Trust does not currently hold any derivative assets. Loans and receivables
Loans and receivables are non-derivative financial assets that have fixed or determinable payments and are not quoted in an active market. Subsequent to initial recognition, loans and receivables are carried at amortized cost, using the effective interest method, less a provision for impairment. A provision for impairment is established when there is objective evidence that collection will not be possible under the original terms of the contract. Indicators of impairment include delinquency of payment and significant financial difficulty of the holder. The carrying amount of the financial asset is reduced through an allowance account, and the amount of the loss is recognized in the consolidated statements of income. Any subsequent reversal of an impairment loss is recognized in profit or loss. Rents and other receivables, loan receivable long-term incentive plan, mortgage holdbacks and mortgages receivable are classified as loans and receivables. Financial liabilities at FVTPL Financial liabilities are classified as FVTPL if they are designated as such by management, or they are derivative liabilities. Financial liabilities classified as FVTPL are measured at fair value, with changes recognized in the consolidated statement of income. Management has designated the LP Class B unit liability and unit-based compensation liability as FVTPL.
InterRent Real Estate Investment Trust Notes to Consolidated Financial Statements (Cdn $ Thousands except unit amounts)
10
3. SIGNIFICANT ACCOUNTING POLICIES (Continued) Other financial liabilities Other financial liabilities are financial liabilities that are not classified as FVTPL. Subsequent to initial recognition, other financial liabilities are measured at amortized cost using the effective interest method. The Trust’s other financial liabilities include credit facilities, accounts payable and accrued liabilities, tenant rental deposits and mortgages and loans payable. The effective interest method is a method of calculating the amortized cost of an instrument and of allocating interest income over the relevant period. The effective interest rate is the rate that exactly discounts estimated future cash receipts (including all transaction costs and other premiums or discounts) through the expected life of the debt instrument to the net carrying amount on initial recognition.
Fair value measurement The Trust measures certain financial instruments and non-financial assets, such as investment properties, at fair value at each balance sheet date. Fair value is the price that would be received to sell an asset or paid to transfer a liability in an orderly transaction between market participants at the measurement date. The fair value of an asset or liability is measured using the assumptions that market participants would use when pricing the asset or liability assuming that market participants act in their economic best interests. A fair value measurement on a non-financial asset takes into account a market participant’s ability to generate economic benefits by using the asset in its highest and best use or by selling it to another market participant that would use the asset in its highest and best use. The Trust uses valuation techniques that are appropriate in the circumstances and for which sufficient data are available to measure value, maximizing the use of relevant observable inputs and minimizing the use of unobservable inputs. All assets and liabilities for which fair value is measured or disclosed in the consolidated financial statements are categorized within the fair value hierarchy, described as follows, based on the lowest level input that is significant to the fair value measurement as a whole:
- Level 1: Quoted prices in active markets for identical assets or liabilities - Level 2: Quoted prices in active markets for similar assets or liabilities or valuation
techniques where significant inputs are based on observable market data - Level 3: Valuation techniques for which any significant input is not based on observable
market data Trust units Effective December 29, 2010, changes were made to the Declaration of Trust so that distributions are made at the discretion of the Trustees. Subsequent to this change the trust units, while still defined as a liability, meet the conditions that permit classification as equity. At this time, the trust units were reclassified from liabilities to unitholders’ equity. The carrying value of the trust units reflects their fair value on the date of the reclassification to unitholders’ equity. As a result of the redemption feature of the trust units, these units are not considered equity for the purposes of calculating net income on a per unit basis under IAS 33. Accordingly, the Trust has elected not to present an earnings per unit calculation, as is permitted under IFRS.
InterRent Real Estate Investment Trust Notes to Consolidated Financial Statements (Cdn $ Thousands except unit amounts)
11
3. SIGNIFICANT ACCOUNTING POLICIES (Continued) LP Class B unit liability The LP Class B units are exchangeable on demand for trust units, which in turn are redeemable into cash at the option of the holder. As such, the LP Class B units are classified as a liability. Management has designated the trust unit liability as FVTPL, and the LP Class B unit liability is re-measured to fair value at each reporting date with changes recorded in the consolidated statement of income. Unit-based compensation The Trust maintains compensation plans which include the granting of unit options and deferred units to Trustees and employees. The Trust records the expense associated with these awards over the vesting period. Unit options and deferred units are settled with the issuance of Trust Units. However, due to the fact that Trust Units are redeemable, awards of unit options and deferred units are considered to be cash-settled. As such, the fair value of unit options and deferred units are recognized as a liability and re-measured at each reporting date, with changes recognized in the consolidated statement of income. Provisions Provisions are recognized when the REIT has a present legal or constructive obligation as a result of past events, it is more likely than not that an outflow of resources will be required to settle the obligation, and the amount can be reliably estimated. Provisions are measured at management’s best estimate of the expenditure required to settle the obligation at the end of the reporting period, and are discounted to present value when the effect is material. Income taxes The Trust is taxed as a Mutual Fund Trust for income tax purposes and intends to distribute its income for income tax purposes each year to Unitholders to such an extent that it would not be liable for income tax under Part I of the Income Tax Act (Canada) (“Tax Act”). Accordingly, no provision for income taxes is included in the consolidated financial statements. Throughout 2013 and 2014, the Trust and its wholly owned subsidiaries satisfied certain conditions available to REITs (the “REIT Exception”) under amendments to the Tax Act, intended to permit a corporate income tax rate of nil as long as the specified conditions continue to be met. Without satisfying these conditions, the Trust would have been liable for income taxes.

InterRent Real Estate Investment Trust Notes to Consolidated Financial Statements (Cdn $ Thousands except unit amounts)
12
3. SIGNIFICANT ACCOUNTING POLICIES (Continued) Critical judgments in applying accounting policies
In the preparation of these consolidated financial statements management has made judgments, aside from those that involve estimates, in the process of applying the accounting policies. These judgments can have an effect on the amounts recognized in the consolidated financial statements.
Investment properties Management makes judgments in determining the extent and frequency of independent appraisals and establishing an internal valuation model to measure fair value of investment properties. With respect to properties under redevelopment, management makes judgments to determine the reliability of fair value of investment properties undergoing redevelopment and the related costs included in the property value as well as identifying the point at which substantial completion of the property occurs.
Leases Management makes judgments in determining whether leases in which the Trust is the lessor are operating or finance leases, and determined that all of its leases are operating leases. The accounting treatment of leases as finance leases would have a significant effect on the measurement of transactions and balances in the consolidated financial statements. Property acquisitions When investment properties are acquired, management is required to apply judgment as to whether or not the transaction should be accounted for as an asset acquisition or business combination. All of the Trust’s property acquisitions have been accounted for as asset acquisitions. Accounting treatment of property acquisitions as business combinations could result in significant differences in the measurement of balances and transactions.
Income tax Deferred income taxes are not recognized in the consolidated financial statements on the basis that the Trust can deduct distributions paid such that its liability for income taxes is substantially reduced or eliminated for the year. In applying this accounting policy, management has made the judgment that Trust intends to continue to distribute its taxable income and continue to qualify as a real estate investment trust for the foreseeable future. Assets held for sale Investment properties are reclassified to assets held for sale when it is expected that their carrying amounts will be recovered principally through a sale transaction rather than continuing use, the property is available for immediate sale, and a sale is highly probable. Application of this accounting policy requires management to make judgments regarding the likelihood assets will be sold.
InterRent Real Estate Investment Trust Notes to Consolidated Financial Statements (Cdn $ Thousands except unit amounts)
13
3. SIGNIFICANT ACCOUNTING POLICIES (Continued)
New Interpretation Adopted IFRS Interpretation Committee (“IFRIC”) 21Levies IFRIC 21 was issued by the IASB in May 2013 and provides guidance on accounting for levies in accordance with the requirements of IAS 37, Provisions, Contingent Liabilities and Contingent Assets. IFRIC 21 is effective for annual periods commencing on or after January 1, 2014 and is applied retrospectively. IFRIC 21 clarifies that an entity recognizes a levy liability when the activity that triggers payment occurs, as identified by the relevant legislation. It also clarifies that a levy liability is accrued ratably over a reporting period only if the activity that triggers payment occurs over such period, in accordance with the relevant legislation. For a levy that is triggered upon reaching a minimum threshold, the interpretation clarifies that no liability should be recognized before the specified minimum threshold is reached. The adoption of IFRIC 21 has no impact to the Trust's current and prior period consolidated balance sheets and statements of earnings as at and for the years ended December 31, 2014 and 2013. Future accounting changes
IFRS 9 Financial Instruments In July 2014, the IASB issued the final version of IFRS 9, which reflects all phases of the financial instruments project and replaces IAS 39, Financial Instruments: Recognition and Measurement and all previous versions of IFRS 9. The effective date for IFRS 9 is for periods beginning on or after January 1, 2018. IFRS 9 uses a single approach to determine whether a financial asset is measured at amortized cost or fair value, replacing the multiple rules in IAS 39. The approach in IFRS 9 is based on how an entity manages its financial instruments in the context of its business model and the contractual cash flow characteristics of the financial assets. The new standard also requires a single impairment method to be used, replacing the multiple impairment methods in IAS 39. The standard also adds guidance on the classification and measurement of financial liabilities. Management is currently evaluating the potential impact that the adoption of IFRS 9 will have on the Trust’s consolidated financial statements. IFRS 15 Revenue from Contracts with Customers IFRS 15 was issued in May 2014 and establishes a new five-step model that will apply to revenue arising from contracts with customers. Under IFRS 15, revenue is recognized at an amount that reflects the consideration to which an entity expects to be entitled in exchange for transferring goods or services to a customer. The principles in IFRS 15 provide a more structured approach to measuring and recording revenue. The new revenue standard is applicable to all entities and will supersede all current revenue recognition requirements under IFRS. Either a full or modified retrospective application is required for annual periods beginning on or after January 1, 2017, with early adoption permitted. Management is currently assessing the impact of IFRS 15 and intends to adopt the new standard on the required effective date.
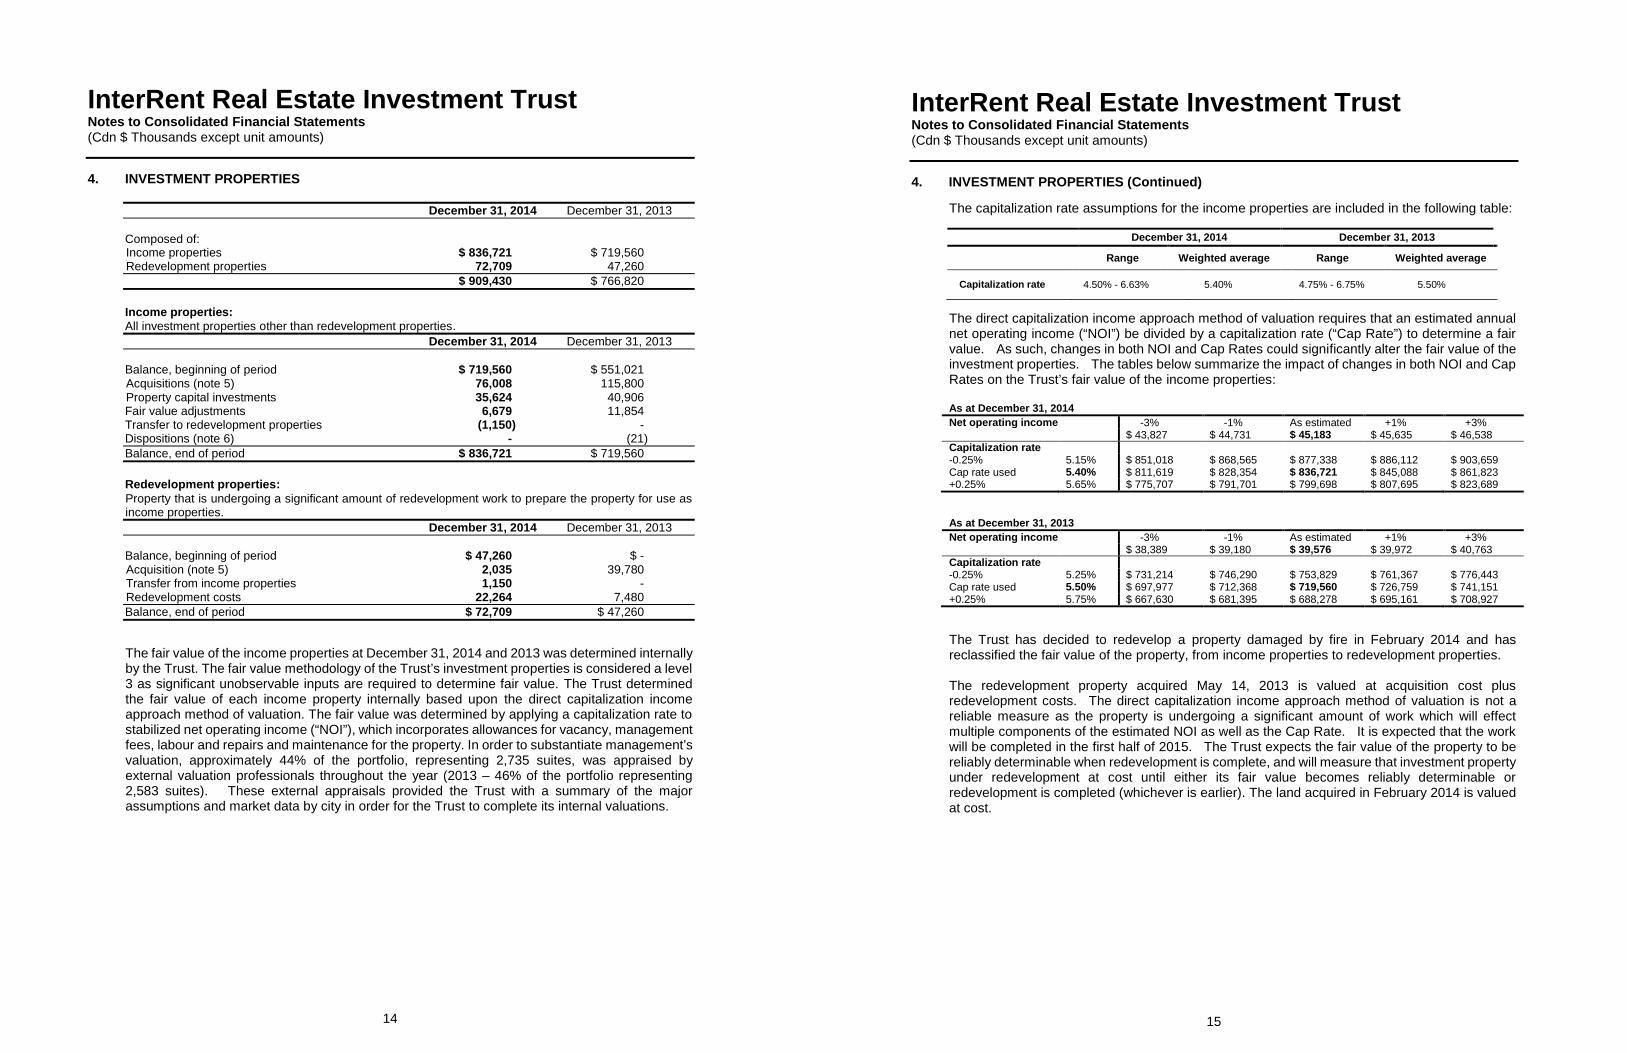
InterRent Real Estate Investment Trust Notes to Consolidated Financial Statements (Cdn $ Thousands except unit amounts)
14
4. INVESTMENT PROPERTIES
December 31, 2014 December 31, 2013
Composed of: Income properties $ 836,721 $ 719,560 Redevelopment properties 72,709 47,260 $ 909,430 $ 766,820
Income properties: All investment properties other than redevelopment properties.
December 31, 2014 December 31, 2013
Balance, beginning of period $ 719,560 $ 551,021 Acquisitions (note 5) 76,008 115,800 Property capital investments 35,624 40,906 Fair value adjustments 6,679 11,854 Transfer to redevelopment properties (1,150) - Dispositions (note 6) - (21) Balance, end of period $ 836,721 $ 719,560
Redevelopment properties:
Property that is undergoing a significant amount of redevelopment work to prepare the property for use as income properties. December 31, 2014 December 31, 2013
Balance, beginning of period $ 47,260 $ - Acquisition (note 5) 2,035 39,780 Transfer from income properties 1,150 - Redevelopment costs 22,264 7,480 Balance, end of period $ 72,709 $ 47,260
The fair value of the income properties at December 31, 2014 and 2013 was determined internally by the Trust. The fair value methodology of the Trust’s investment properties is considered a level 3 as significant unobservable inputs are required to determine fair value. The Trust determined the fair value of each income property internally based upon the direct capitalization income approach method of valuation. The fair value was determined by applying a capitalization rate to stabilized net operating income (“NOI”), which incorporates allowances for vacancy, management fees, labour and repairs and maintenance for the property. In order to substantiate management’s valuation, approximately 44% of the portfolio, representing 2,735 suites, was appraised by external valuation professionals throughout the year (2013 – 46% of the portfolio representing 2,583 suites). These external appraisals provided the Trust with a summary of the major assumptions and market data by city in order for the Trust to complete its internal valuations.
InterRent Real Estate Investment Trust Notes to Consolidated Financial Statements (Cdn $ Thousands except unit amounts)
15
4. INVESTMENT PROPERTIES (Continued) The capitalization rate assumptions for the income properties are included in the following table:
December 31, 2014 December 31, 2013
Range Weighted average Range Weighted average
Capitalization rate 4.50% - 6.63% 5.40% 4.75% - 6.75% 5.50%
The direct capitalization income approach method of valuation requires that an estimated annual net operating income (“NOI”) be divided by a capitalization rate (“Cap Rate”) to determine a fair value. As such, changes in both NOI and Cap Rates could significantly alter the fair value of the investment properties. The tables below summarize the impact of changes in both NOI and Cap Rates on the Trust’s fair value of the income properties: As at December 31, 2014 Net operating income -3% -1% As estimated +1% +3% $ 43,827 $ 44,731 $ 45,183 $ 45,635 $ 46,538 Capitalization rate -0.25% 5.15% $ 851,018 $ 868,565 $ 877,338 $ 886,112 $ 903,659 Cap rate used 5.40% $ 811,619 $ 828,354 $ 836,721 $ 845,088 $ 861,823 +0.25% 5.65% $ 775,707 $ 791,701 $ 799,698 $ 807,695 $ 823,689 As at December 31, 2013 Net operating income -3% -1% As estimated +1% +3% $ 38,389 $ 39,180 $ 39,576 $ 39,972 $ 40,763 Capitalization rate -0.25% 5.25% $ 731,214 $ 746,290 $ 753,829 $ 761,367 $ 776,443 Cap rate used 5.50% $ 697,977 $ 712,368 $ 719,560 $ 726,759 $ 741,151 +0.25% 5.75% $ 667,630 $ 681,395 $ 688,278 $ 695,161 $ 708,927 The Trust has decided to redevelop a property damaged by fire in February 2014 and has reclassified the fair value of the property, from income properties to redevelopment properties. The redevelopment property acquired May 14, 2013 is valued at acquisition cost plus redevelopment costs. The direct capitalization income approach method of valuation is not a reliable measure as the property is undergoing a significant amount of work which will effect multiple components of the estimated NOI as well as the Cap Rate. It is expected that the work will be completed in the first half of 2015. The Trust expects the fair value of the property to be reliably determinable when redevelopment is complete, and will measure that investment property under redevelopment at cost until either its fair value becomes reliably determinable or redevelopment is completed (whichever is earlier). The land acquired in February 2014 is valued at cost.

InterRent Real Estate Investment Trust Notes to Consolidated Financial Statements (Cdn $ Thousands except unit amounts)
16
5. INVESTMENT PROPERTY ACQUISITIONS During the year ended December 31, 2014, the Trust completed the following investment property acquisitions, which have contributed to the operating results effective from the acquisition date:
Acquisition Date Suite Count
Total Acquisition Costs
Mortgage Funding
Interest Rate
Maturity Date February 14, 2014 - $ 2,035 $ - -% n/a February 25, 2014 54 7,435 5,000 2.57% March 15, 2015 June 10, 2014 23 1,978 1,410 2.79% July 1, 2015 July 28, 2014 334 25,115 17,000 2.75% August 15, 2015 December 1, 2014 232 41,023 31,000 2.65% December 1, 2015 December 3, 2014 2 457 - -% n/a 645 $ 78,043 $ 54,410
The acquisition on February 14, 2014 was a parcel of land which was used as a parking lot for one of the properties that are now being redeveloped. During the year ended December 31, 2013, the Trust completed the following income property acquisitions:
Acquisition Date Suite Count
Total Acquisition Costs
Mortgage Funding
Interest Rate
Maturity Date January 28, 2013 174 $ 20,501 $ 14,323 4.04% and 0% June 1, 2021 and January 28, 2017
March 20, 2013 87 11,812 7,462 2.96% September 1, 2023 March 25, 2013 64 6,198 4,068 2.52% May 15, 2014 April 4, 2013 118 16,136 11,737 2.65% May 1, 2014 April 15, 2013 127 24,798 17,944 2.65% June 1, 2014 April 18, 2013 327 36,355 13,453 5.09% February 1, 2015 897 $ 115,800 $ 68,987
During the year ended December 31, 2013, the Trust completed the following redevelopment property acquisition:
Acquisition Date Suite Count
Total Acquisition Costs
Mortgage Funding
Interest Rate
Maturity Date May 14, 2013 444 $ 39,780 $ 19,452 1.93% December 15, 2013
Cash outflow used for investment property acquisitions: 2014 2013
Total acquisition costs $ (78,043) $ (155,580) Fair value adjustment of assumed debt - 1,634 Assumed debt - 46,527 $ (78,043) $ (107,419)
InterRent Real Estate Investment Trust Notes to Consolidated Financial Statements (Cdn $ Thousands except unit amounts)
17
6. INVESTMENT PROPERTY DISPOSITIONS
No investment properties were disposed of during the years ended December 31, 2014 and 2013.
7. OTHER ASSETS
December 31, December 31, 2014 2013
Mortgage holdbacks $ 2 $ 12 Rents and other receivables, net of allowance for uncollectable
amounts 1,271 1,171 Automobiles, software, equipment and furniture and fixtures, net
of accumulated amortization of $280 (2013 - $210) 269 139 Deferred finance fees on lines of credit, net of accumulated
amortization of $465 (2013 - $241) 291 178 Mortgages receivable (1) 1,927 1,995 Tenant inducements (2) 524 671 Loan receivable long-term incentive plan (note 13) 3,271 2,819 $ 7,555 $ 6,985
(1) At December 31, 2014, the balance is comprised of three mortgages with maturity dates ranging from 7 to 31 months at
interest rates from 2% to 3.5%. All mortgages are secured by the related property and a general security agreement. At December 31, 2013 the balance is comprised of four mortgages with maturity dates ranging from 1 to 43 months at interest rates from 2% to 8%.
(2) Comprised of straight-line rent. This amount is excluded from the determination of the fair value of the investment properties.
8. MORTGAGES AND LOANS PAYABLE
Mortgages and vendor take-back loans are secured by the investment properties and bear interest at a weighted average interest rate of 3.13% (December 31, 2013 – 3.31%). The mortgages and vendor take-back loans mature at various dates between the years 2015 and 2024. The aggregate future minimum principal payments, including maturities, are as follows: 2015 $ 237,093 2016 12,960 2017 30,524 2018 5,671 2019 12,649 Thereafter 141,122
440,019 Less: Deferred finance costs and mortgage premiums 6,095 $ 433,924
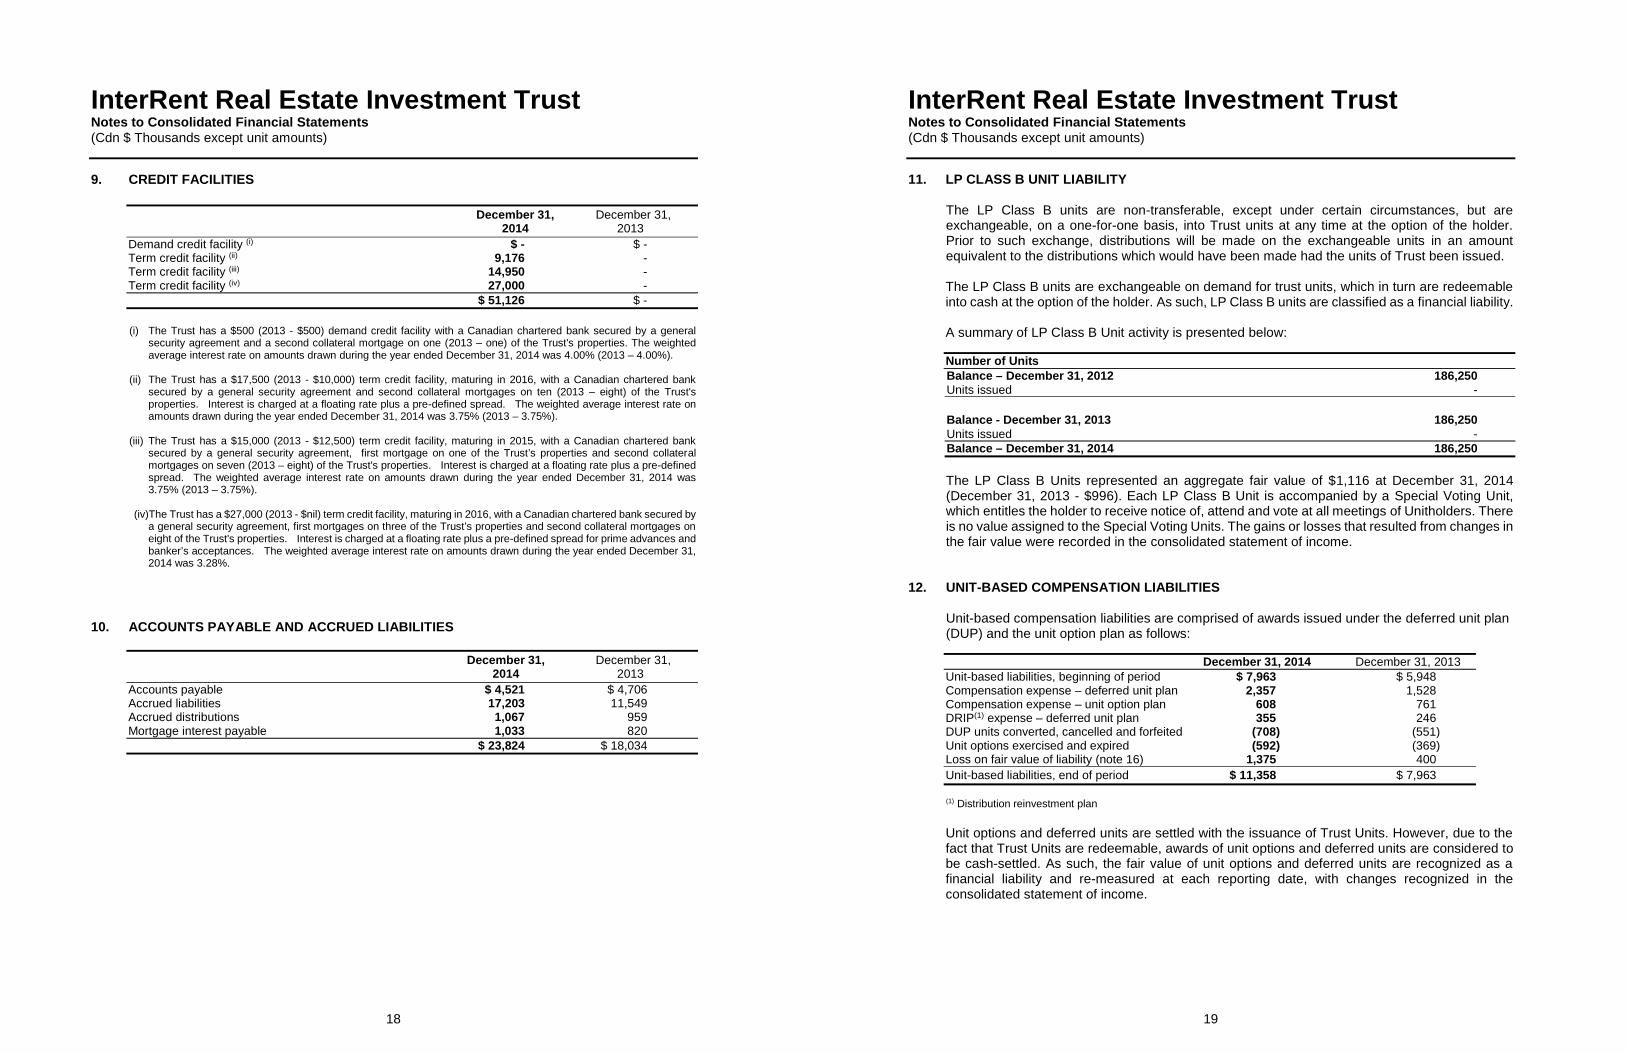
InterRent Real Estate Investment Trust Notes to Consolidated Financial Statements (Cdn $ Thousands except unit amounts)
18
9. CREDIT FACILITIES
December 31, December 31, 2014 2013 Demand credit facility (i) $ - $ - Term credit facility (ii) 9,176 - Term credit facility (iii) 14,950 - Term credit facility (iv) 27,000 - $ 51,126 $ - (i) The Trust has a $500 (2013 - $500) demand credit facility with a Canadian chartered bank secured by a general
security agreement and a second collateral mortgage on one (2013 – one) of the Trust's properties. The weighted average interest rate on amounts drawn during the year ended December 31, 2014 was 4.00% (2013 – 4.00%).
(ii) The Trust has a $17,500 (2013 - $10,000) term credit facility, maturing in 2016, with a Canadian chartered bank
secured by a general security agreement and second collateral mortgages on ten (2013 – eight) of the Trust's properties. Interest is charged at a floating rate plus a pre-defined spread. The weighted average interest rate on amounts drawn during the year ended December 31, 2014 was 3.75% (2013 – 3.75%).
(iii) The Trust has a $15,000 (2013 - $12,500) term credit facility, maturing in 2015, with a Canadian chartered bank
secured by a general security agreement, first mortgage on one of the Trust’s properties and second collateral mortgages on seven (2013 – eight) of the Trust's properties. Interest is charged at a floating rate plus a pre-defined spread. The weighted average interest rate on amounts drawn during the year ended December 31, 2014 was 3.75% (2013 – 3.75%).
(iv)The Trust has a $27,000 (2013 - $nil) term credit facility, maturing in 2016, with a Canadian chartered bank secured by
a general security agreement, first mortgages on three of the Trust’s properties and second collateral mortgages on eight of the Trust's properties. Interest is charged at a floating rate plus a pre-defined spread for prime advances and banker’s acceptances. The weighted average interest rate on amounts drawn during the year ended December 31, 2014 was 3.28%.
10. ACCOUNTS PAYABLE AND ACCRUED LIABILITIES
December 31, December 31, 2014 2013 Accounts payable $ 4,521 $ 4,706 Accrued liabilities 17,203 11,549 Accrued distributions 1,067 959 Mortgage interest payable 1,033 820 $ 23,824 $ 18,034
InterRent Real Estate Investment Trust Notes to Consolidated Financial Statements (Cdn $ Thousands except unit amounts)
19
11. LP CLASS B UNIT LIABILITY
The LP Class B units are non-transferable, except under certain circumstances, but are exchangeable, on a one-for-one basis, into Trust units at any time at the option of the holder. Prior to such exchange, distributions will be made on the exchangeable units in an amount equivalent to the distributions which would have been made had the units of Trust been issued. The LP Class B units are exchangeable on demand for trust units, which in turn are redeemable into cash at the option of the holder. As such, LP Class B units are classified as a financial liability. A summary of LP Class B Unit activity is presented below: Number of Units Balance – December 31, 2012 186,250 Units issued -
Balance - December 31, 2013 186,250 Units issued - Balance – December 31, 2014 186,250 The LP Class B Units represented an aggregate fair value of $1,116 at December 31, 2014 (December 31, 2013 - $996). Each LP Class B Unit is accompanied by a Special Voting Unit, which entitles the holder to receive notice of, attend and vote at all meetings of Unitholders. There is no value assigned to the Special Voting Units. The gains or losses that resulted from changes in the fair value were recorded in the consolidated statement of income.
12. UNIT-BASED COMPENSATION LIABILITIES
Unit-based compensation liabilities are comprised of awards issued under the deferred unit plan (DUP) and the unit option plan as follows: December 31, 2014 December 31, 2013 Unit-based liabilities, beginning of period $ 7,963 $ 5,948 Compensation expense – deferred unit plan 2,357 1,528 Compensation expense – unit option plan 608 761 DRIP(1) expense – deferred unit plan 355 246 DUP units converted, cancelled and forfeited (708) (551) Unit options exercised and expired (592) (369) Loss on fair value of liability (note 16) 1,375 400 Unit-based liabilities, end of period $ 11,358 $ 7,963
(1) Distribution reinvestment plan Unit options and deferred units are settled with the issuance of Trust Units. However, due to the fact that Trust Units are redeemable, awards of unit options and deferred units are considered to be cash-settled. As such, the fair value of unit options and deferred units are recognized as a financial liability and re-measured at each reporting date, with changes recognized in the consolidated statement of income.
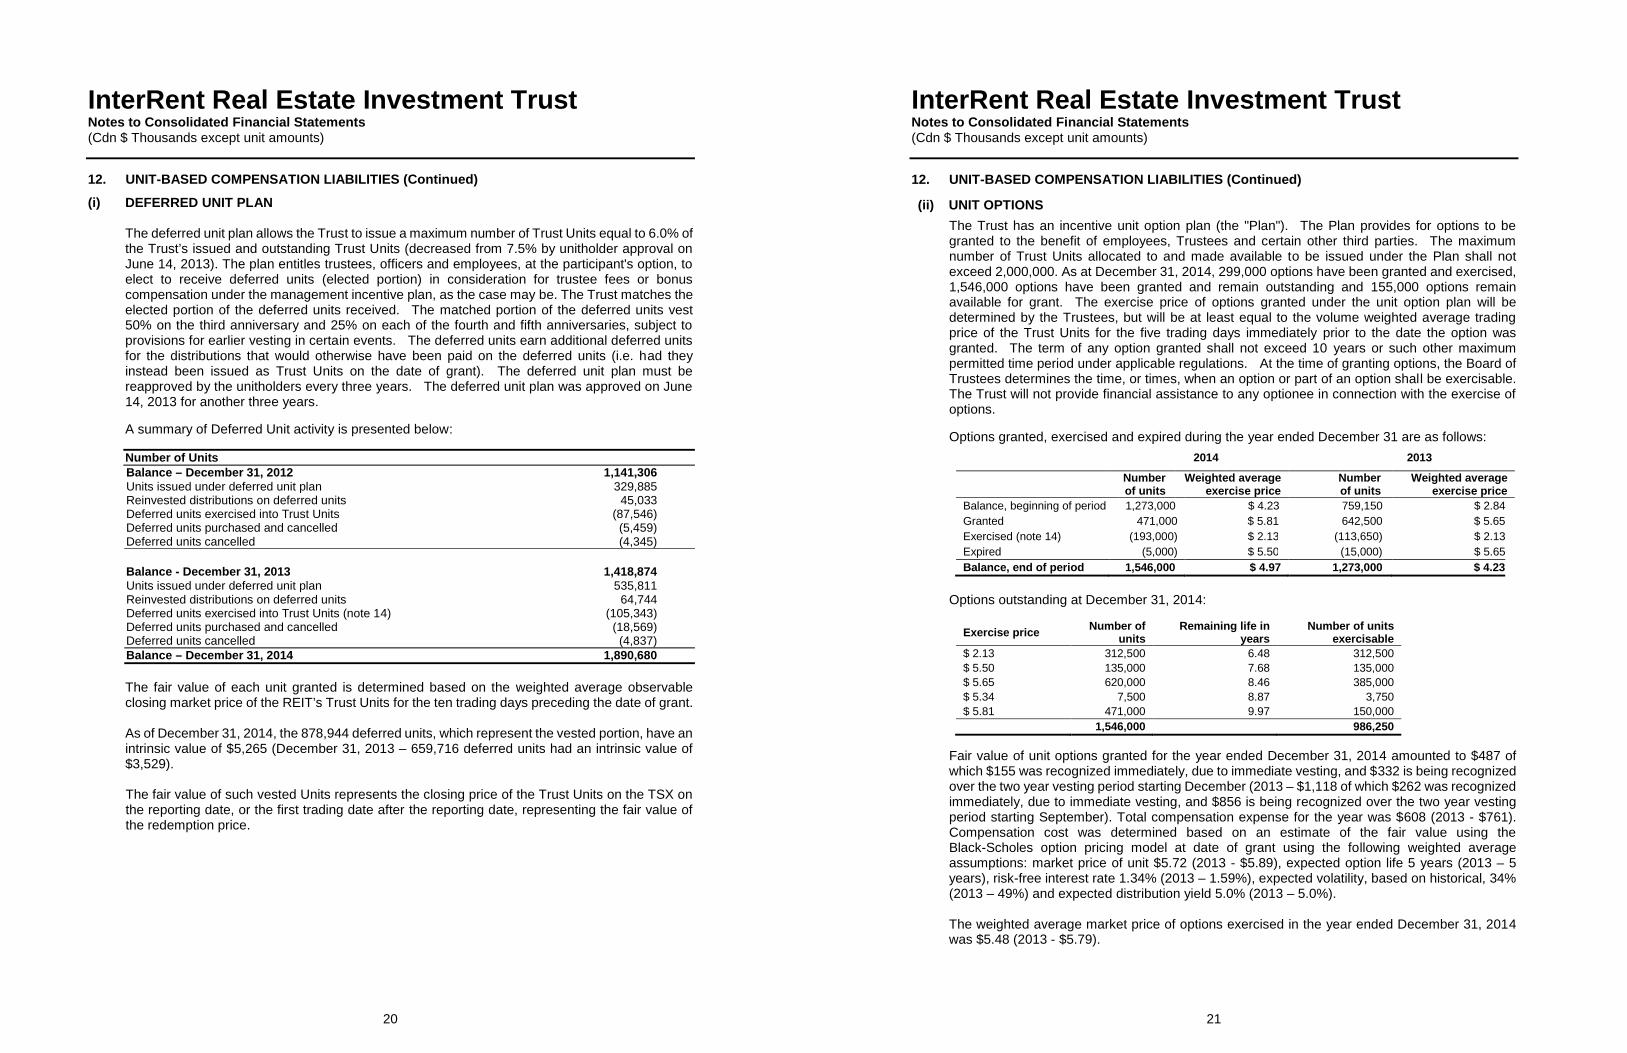
InterRent Real Estate Investment Trust Notes to Consolidated Financial Statements (Cdn $ Thousands except unit amounts)
20
12. UNIT-BASED COMPENSATION LIABILITIES (Continued)
(i) DEFERRED UNIT PLAN The deferred unit plan allows the Trust to issue a maximum number of Trust Units equal to 6.0% of the Trust’s issued and outstanding Trust Units (decreased from 7.5% by unitholder approval on June 14, 2013). The plan entitles trustees, officers and employees, at the participant's option, to elect to receive deferred units (elected portion) in consideration for trustee fees or bonus compensation under the management incentive plan, as the case may be. The Trust matches the elected portion of the deferred units received. The matched portion of the deferred units vest 50% on the third anniversary and 25% on each of the fourth and fifth anniversaries, subject to provisions for earlier vesting in certain events. The deferred units earn additional deferred units for the distributions that would otherwise have been paid on the deferred units (i.e. had they instead been issued as Trust Units on the date of grant). The deferred unit plan must be reapproved by the unitholders every three years. The deferred unit plan was approved on June 14, 2013 for another three years. A summary of Deferred Unit activity is presented below: Number of Units Balance – December 31, 2012 1,141,306 Units issued under deferred unit plan 329,885 Reinvested distributions on deferred units 45,033 Deferred units exercised into Trust Units (87,546) Deferred units purchased and cancelled (5,459) Deferred units cancelled (4,345)
Balance - December 31, 2013 1,418,874 Units issued under deferred unit plan 535,811 Reinvested distributions on deferred units 64,744 Deferred units exercised into Trust Units (note 14) (105,343) Deferred units purchased and cancelled (18,569) Deferred units cancelled (4,837) Balance – December 31, 2014 1,890,680 The fair value of each unit granted is determined based on the weighted average observable closing market price of the REIT’s Trust Units for the ten trading days preceding the date of grant. As of December 31, 2014, the 878,944 deferred units, which represent the vested portion, have an intrinsic value of $5,265 (December 31, 2013 – 659,716 deferred units had an intrinsic value of $3,529). The fair value of such vested Units represents the closing price of the Trust Units on the TSX on the reporting date, or the first trading date after the reporting date, representing the fair value of the redemption price.
InterRent Real Estate Investment Trust Notes to Consolidated Financial Statements (Cdn $ Thousands except unit amounts)
21
12. UNIT-BASED COMPENSATION LIABILITIES (Continued)
(ii) UNIT OPTIONS The Trust has an incentive unit option plan (the "Plan"). The Plan provides for options to be granted to the benefit of employees, Trustees and certain other third parties. The maximum number of Trust Units allocated to and made available to be issued under the Plan shall not exceed 2,000,000. As at December 31, 2014, 299,000 options have been granted and exercised, 1,546,000 options have been granted and remain outstanding and 155,000 options remain available for grant. The exercise price of options granted under the unit option plan will be determined by the Trustees, but will be at least equal to the volume weighted average trading price of the Trust Units for the five trading days immediately prior to the date the option was granted. The term of any option granted shall not exceed 10 years or such other maximum permitted time period under applicable regulations. At the time of granting options, the Board of Trustees determines the time, or times, when an option or part of an option shall be exercisable. The Trust will not provide financial assistance to any optionee in connection with the exercise of options. Options granted, exercised and expired during the year ended December 31 are as follows:
2014 2013
Number of units
Weighted average exercise price
Number of units
Weighted average exercise price
Balance, beginning of period 1,273,000 $ 4.23 759,150 $ 2.84 Granted 471,000 $ 5.81 642,500 $ 5.65 Exercised (note 14) (193,000) $ 2.13 (113,650) $ 2.13 Expired (5,000) $ 5.50 (15,000) $ 5.65 Balance, end of period 1,546,000 $ 4.97 1,273,000 $ 4.23
Options outstanding at December 31, 2014:
Exercise price Number of units
Remaining life in years
Number of units exercisable
$ 2.13 312,500 6.48 312,500 $ 5.50 135,000 7.68 135,000 $ 5.65 620,000 8.46 385,000 $ 5.34 7,500 8.87 3,750 $ 5.81 471,000 9.97 150,000
1,546,000 986,250 Fair value of unit options granted for the year ended December 31, 2014 amounted to $487 of which $155 was recognized immediately, due to immediate vesting, and $332 is being recognized over the two year vesting period starting December (2013 – $1,118 of which $262 was recognized immediately, due to immediate vesting, and $856 is being recognized over the two year vesting period starting September). Total compensation expense for the year was $608 (2013 - $761). Compensation cost was determined based on an estimate of the fair value using the Black-Scholes option pricing model at date of grant using the following weighted average assumptions: market price of unit $5.72 (2013 - $5.89), expected option life 5 years (2013 – 5 years), risk-free interest rate 1.34% (2013 – 1.59%), expected volatility, based on historical, 34% (2013 – 49%) and expected distribution yield 5.0% (2013 – 5.0%). The weighted average market price of options exercised in the year ended December 31, 2014 was $5.48 (2013 - $5.79).
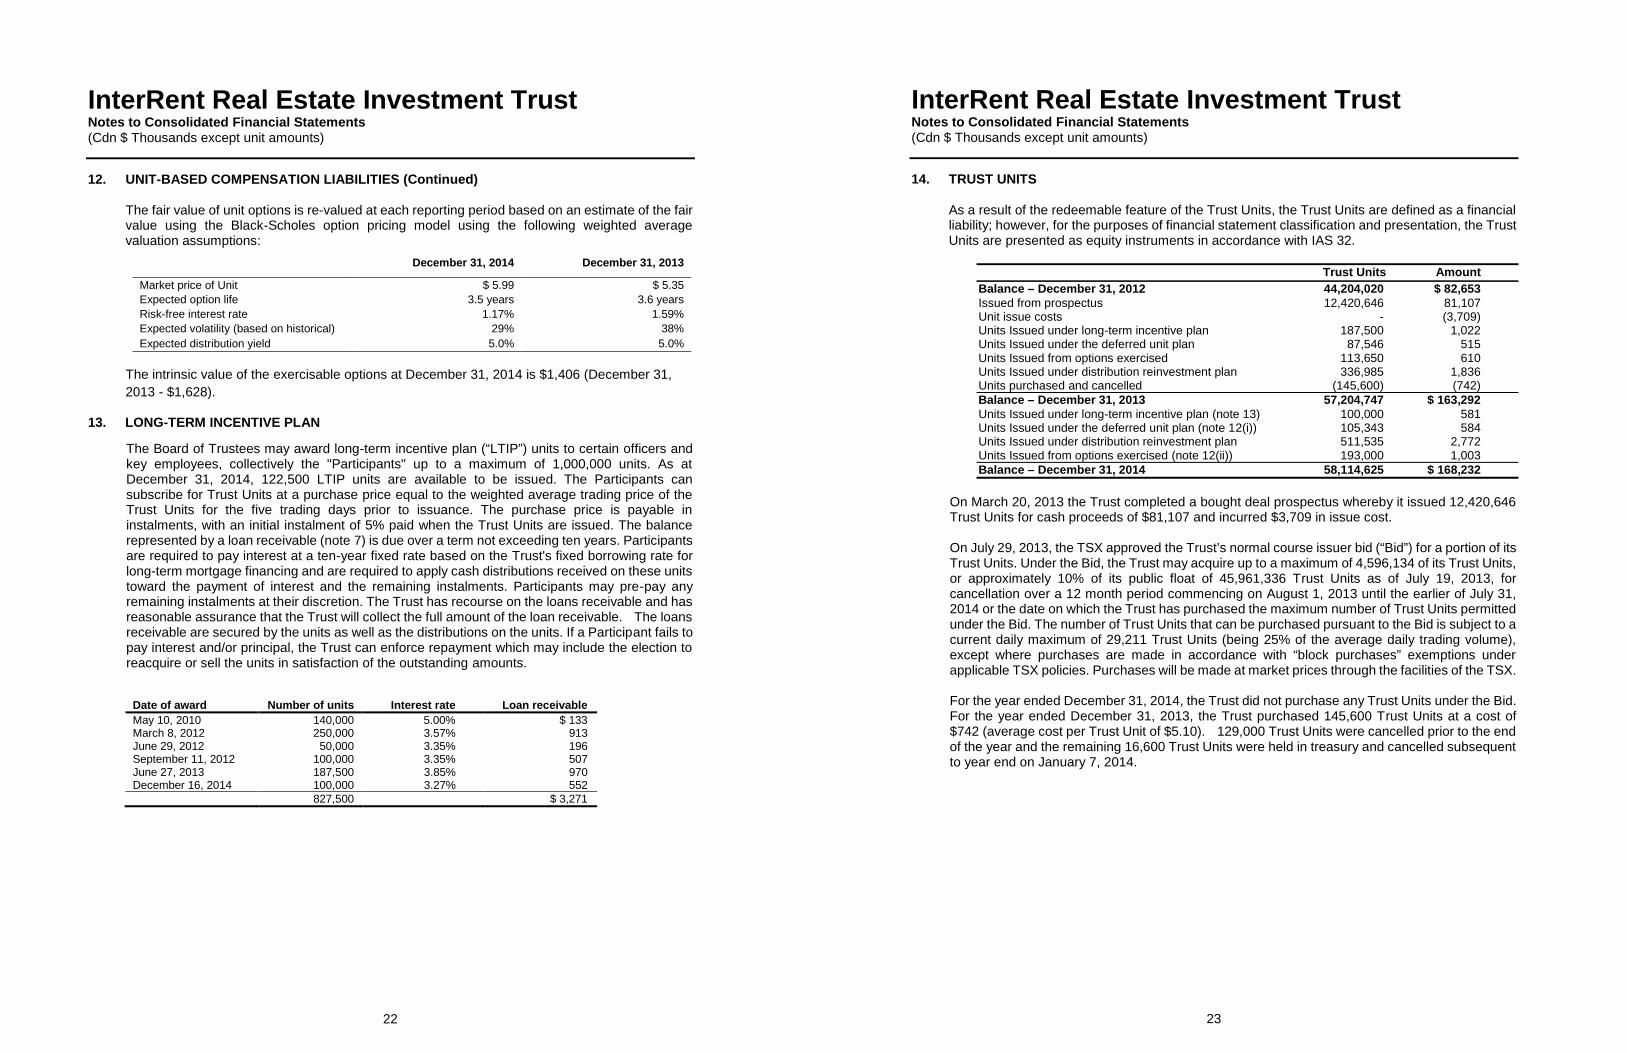
InterRent Real Estate Investment Trust Notes to Consolidated Financial Statements (Cdn $ Thousands except unit amounts)
22
12. UNIT-BASED COMPENSATION LIABILITIES (Continued) The fair value of unit options is re-valued at each reporting period based on an estimate of the fair value using the Black-Scholes option pricing model using the following weighted average valuation assumptions:
December 31, 2014 December 31, 2013
Market price of Unit $ 5.99 $ 5.35 Expected option life 3.5 years 3.6 years Risk-free interest rate 1.17% 1.59% Expected volatility (based on historical) 29% 38% Expected distribution yield 5.0% 5.0%
The intrinsic value of the exercisable options at December 31, 2014 is $1,406 (December 31, 2013 - $1,628).
13. LONG-TERM INCENTIVE PLAN
The Board of Trustees may award long-term incentive plan (“LTIP”) units to certain officers and key employees, collectively the "Participants" up to a maximum of 1,000,000 units. As at December 31, 2014, 122,500 LTIP units are available to be issued. The Participants can subscribe for Trust Units at a purchase price equal to the weighted average trading price of the Trust Units for the five trading days prior to issuance. The purchase price is payable in instalments, with an initial instalment of 5% paid when the Trust Units are issued. The balance represented by a loan receivable (note 7) is due over a term not exceeding ten years. Participants are required to pay interest at a ten-year fixed rate based on the Trust's fixed borrowing rate for long-term mortgage financing and are required to apply cash distributions received on these units toward the payment of interest and the remaining instalments. Participants may pre-pay any remaining instalments at their discretion. The Trust has recourse on the loans receivable and has reasonable assurance that the Trust will collect the full amount of the loan receivable. The loans receivable are secured by the units as well as the distributions on the units. If a Participant fails to pay interest and/or principal, the Trust can enforce repayment which may include the election to reacquire or sell the units in satisfaction of the outstanding amounts.
Date of award Number of units Interest rate Loan receivable May 10, 2010 140,000 5.00% $ 133 March 8, 2012 250,000 3.57% 913 June 29, 2012 50,000 3.35% 196 September 11, 2012 100,000 3.35% 507 June 27, 2013 187,500 3.85% 970 December 16, 2014 100,000 3.27% 552 827,500 $ 3,271
InterRent Real Estate Investment Trust Notes to Consolidated Financial Statements (Cdn $ Thousands except unit amounts)
23
14. TRUST UNITS
As a result of the redeemable feature of the Trust Units, the Trust Units are defined as a financial liability; however, for the purposes of financial statement classification and presentation, the Trust Units are presented as equity instruments in accordance with IAS 32.
Trust Units Amount Balance – December 31, 2012 44,204,020 $ 82,653 Issued from prospectus 12,420,646 81,107 Unit issue costs - (3,709) Units Issued under long-term incentive plan 187,500 1,022 Units Issued under the deferred unit plan 87,546 515 Units Issued from options exercised 113,650 610 Units Issued under distribution reinvestment plan 336,985 1,836 Units purchased and cancelled (145,600) (742) Balance – December 31, 2013 57,204,747 $ 163,292 Units Issued under long-term incentive plan (note 13) 100,000 581 Units Issued under the deferred unit plan (note 12(i)) 105,343 584 Units Issued under distribution reinvestment plan 511,535 2,772 Units Issued from options exercised (note 12(ii)) 193,000 1,003 Balance – December 31, 2014 58,114,625 $ 168,232
On March 20, 2013 the Trust completed a bought deal prospectus whereby it issued 12,420,646 Trust Units for cash proceeds of $81,107 and incurred $3,709 in issue cost. On July 29, 2013, the TSX approved the Trust’s normal course issuer bid (“Bid”) for a portion of its Trust Units. Under the Bid, the Trust may acquire up to a maximum of 4,596,134 of its Trust Units, or approximately 10% of its public float of 45,961,336 Trust Units as of July 19, 2013, for cancellation over a 12 month period commencing on August 1, 2013 until the earlier of July 31, 2014 or the date on which the Trust has purchased the maximum number of Trust Units permitted under the Bid. The number of Trust Units that can be purchased pursuant to the Bid is subject to a current daily maximum of 29,211 Trust Units (being 25% of the average daily trading volume), except where purchases are made in accordance with “block purchases” exemptions under applicable TSX policies. Purchases will be made at market prices through the facilities of the TSX. For the year ended December 31, 2014, the Trust did not purchase any Trust Units under the Bid. For the year ended December 31, 2013, the Trust purchased 145,600 Trust Units at a cost of $742 (average cost per Trust Unit of $5.10). 129,000 Trust Units were cancelled prior to the end of the year and the remaining 16,600 Trust Units were held in treasury and cancelled subsequent to year end on January 7, 2014.
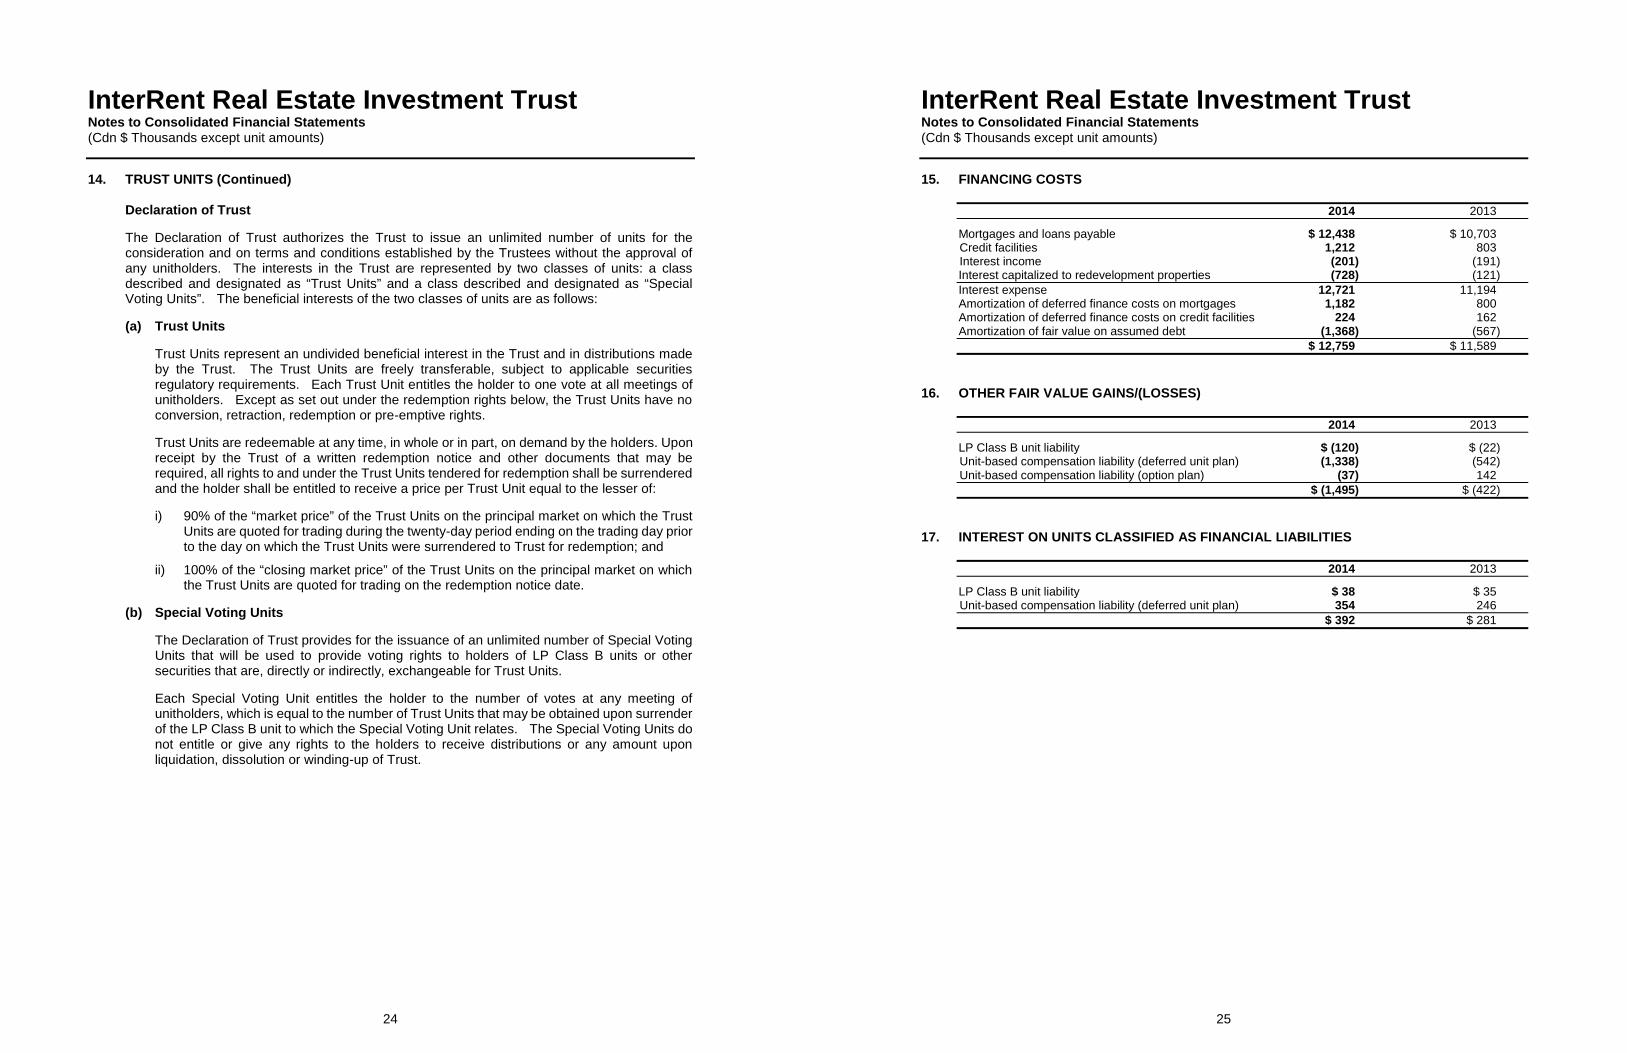
InterRent Real Estate Investment Trust Notes to Consolidated Financial Statements (Cdn $ Thousands except unit amounts)
24
14. TRUST UNITS (Continued) Declaration of Trust The Declaration of Trust authorizes the Trust to issue an unlimited number of units for the consideration and on terms and conditions established by the Trustees without the approval of any unitholders. The interests in the Trust are represented by two classes of units: a class described and designated as “Trust Units” and a class described and designated as “Special Voting Units”. The beneficial interests of the two classes of units are as follows: (a) Trust Units
Trust Units represent an undivided beneficial interest in the Trust and in distributions made by the Trust. The Trust Units are freely transferable, subject to applicable securities regulatory requirements. Each Trust Unit entitles the holder to one vote at all meetings of unitholders. Except as set out under the redemption rights below, the Trust Units have no conversion, retraction, redemption or pre-emptive rights. Trust Units are redeemable at any time, in whole or in part, on demand by the holders. Upon receipt by the Trust of a written redemption notice and other documents that may be required, all rights to and under the Trust Units tendered for redemption shall be surrendered and the holder shall be entitled to receive a price per Trust Unit equal to the lesser of:
i) 90% of the “market price” of the Trust Units on the principal market on which the Trust
Units are quoted for trading during the twenty-day period ending on the trading day prior to the day on which the Trust Units were surrendered to Trust for redemption; and
ii) 100% of the “closing market price” of the Trust Units on the principal market on which the Trust Units are quoted for trading on the redemption notice date.
(b) Special Voting Units
The Declaration of Trust provides for the issuance of an unlimited number of Special Voting Units that will be used to provide voting rights to holders of LP Class B units or other securities that are, directly or indirectly, exchangeable for Trust Units. Each Special Voting Unit entitles the holder to the number of votes at any meeting of unitholders, which is equal to the number of Trust Units that may be obtained upon surrender of the LP Class B unit to which the Special Voting Unit relates. The Special Voting Units do not entitle or give any rights to the holders to receive distributions or any amount upon liquidation, dissolution or winding-up of Trust.
InterRent Real Estate Investment Trust Notes to Consolidated Financial Statements (Cdn $ Thousands except unit amounts)
25
15. FINANCING COSTS
2014 2013
Mortgages and loans payable $ 12,438 $ 10,703 Credit facilities 1,212 803 Interest income (201) (191) Interest capitalized to redevelopment properties (728) (121) Interest expense 12,721 11,194 Amortization of deferred finance costs on mortgages 1,182 800 Amortization of deferred finance costs on credit facilities 224 162 Amortization of fair value on assumed debt (1,368) (567) $ 12,759 $ 11,589
16. OTHER FAIR VALUE GAINS/(LOSSES)
2014 2013
LP Class B unit liability $ (120) $ (22) Unit-based compensation liability (deferred unit plan) (1,338) (542) Unit-based compensation liability (option plan) (37) 142 $ (1,495) $ (422)
17. INTEREST ON UNITS CLASSIFIED AS FINANCIAL LIABILITIES
2014 2013
LP Class B unit liability $ 38 $ 35 Unit-based compensation liability (deferred unit plan) 354 246 $ 392 $ 281
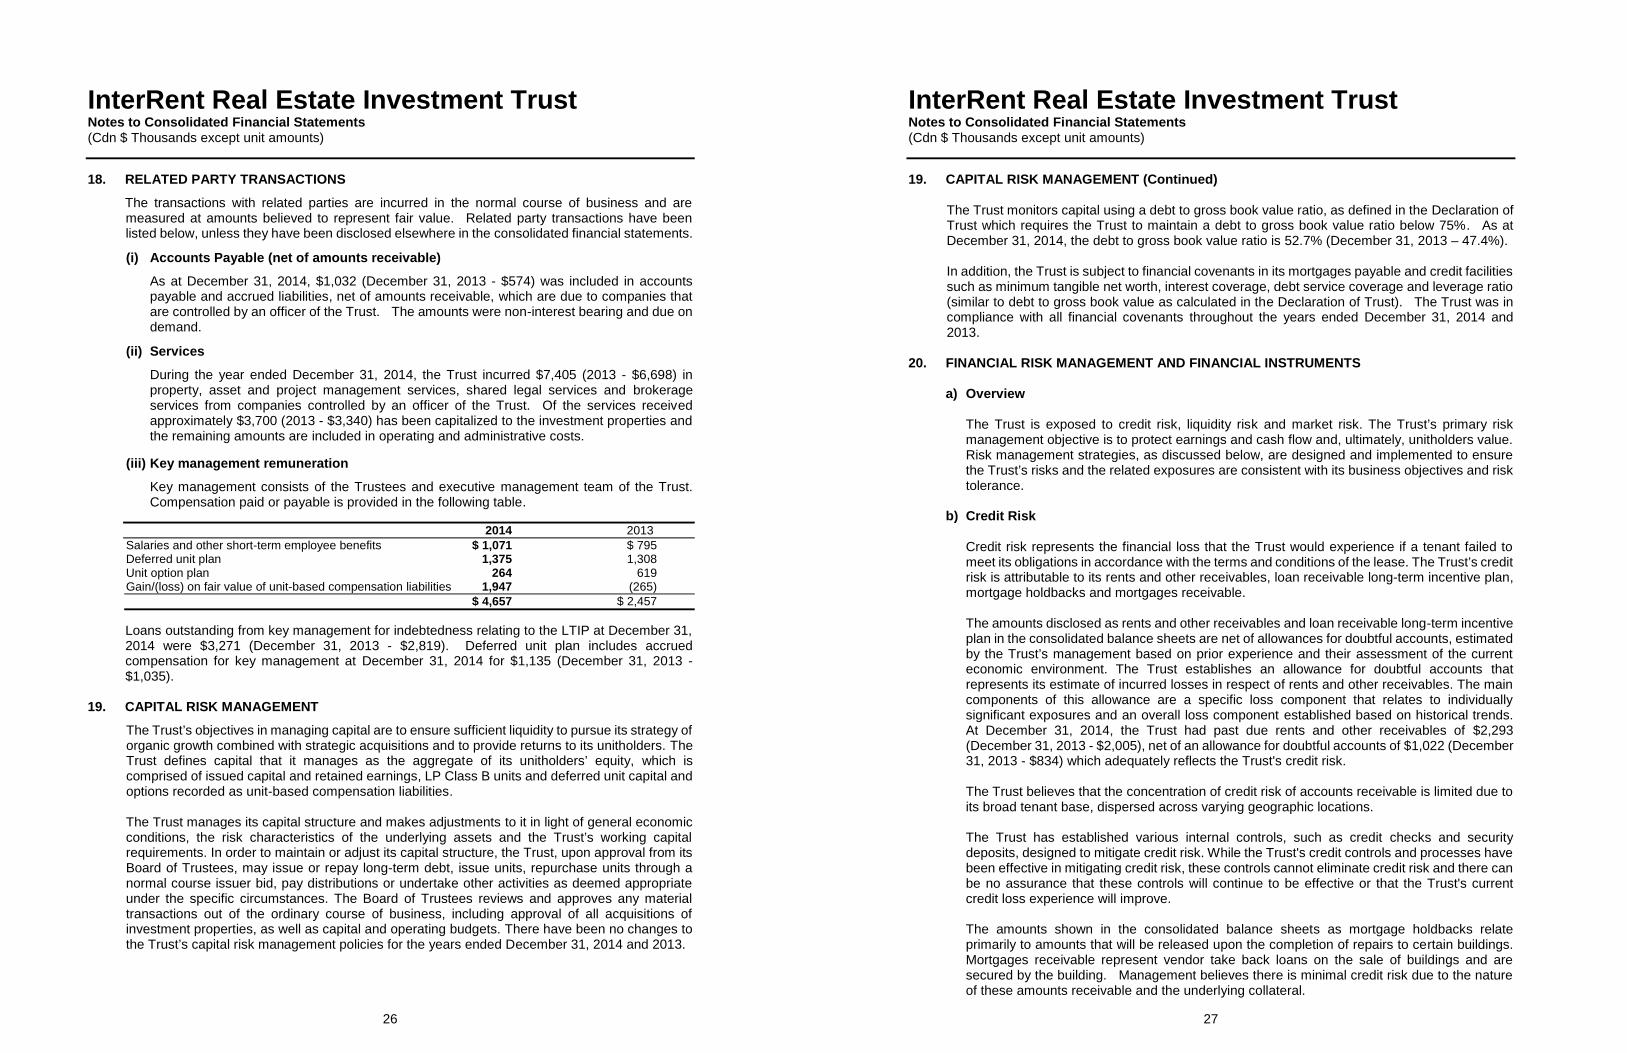
InterRent Real Estate Investment Trust Notes to Consolidated Financial Statements (Cdn $ Thousands except unit amounts)
26
18. RELATED PARTY TRANSACTIONS
The transactions with related parties are incurred in the normal course of business and are measured at amounts believed to represent fair value. Related party transactions have been listed below, unless they have been disclosed elsewhere in the consolidated financial statements.
(i) Accounts Payable (net of amounts receivable)
As at December 31, 2014, $1,032 (December 31, 2013 - $574) was included in accounts payable and accrued liabilities, net of amounts receivable, which are due to companies that are controlled by an officer of the Trust. The amounts were non-interest bearing and due on demand.
(ii) Services
During the year ended December 31, 2014, the Trust incurred $7,405 (2013 - $6,698) in property, asset and project management services, shared legal services and brokerage services from companies controlled by an officer of the Trust. Of the services received approximately $3,700 (2013 - $3,340) has been capitalized to the investment properties and the remaining amounts are included in operating and administrative costs.
(iii) Key management remuneration
Key management consists of the Trustees and executive management team of the Trust. Compensation paid or payable is provided in the following table.
2014 2013 Salaries and other short-term employee benefits $ 1,071 $ 795 Deferred unit plan 1,375 1,308 Unit option plan 264 619 Gain/(loss) on fair value of unit-based compensation liabilities 1,947 (265) $ 4,657 $ 2,457
Loans outstanding from key management for indebtedness relating to the LTIP at December 31, 2014 were $3,271 (December 31, 2013 - $2,819). Deferred unit plan includes accrued compensation for key management at December 31, 2014 for $1,135 (December 31, 2013 - $1,035).
19. CAPITAL RISK MANAGEMENT
The Trust’s objectives in managing capital are to ensure sufficient liquidity to pursue its strategy of organic growth combined with strategic acquisitions and to provide returns to its unitholders. The Trust defines capital that it manages as the aggregate of its unitholders’ equity, which is comprised of issued capital and retained earnings, LP Class B units and deferred unit capital and options recorded as unit-based compensation liabilities. The Trust manages its capital structure and makes adjustments to it in light of general economic conditions, the risk characteristics of the underlying assets and the Trust’s working capital requirements. In order to maintain or adjust its capital structure, the Trust, upon approval from its Board of Trustees, may issue or repay long-term debt, issue units, repurchase units through a normal course issuer bid, pay distributions or undertake other activities as deemed appropriate under the specific circumstances. The Board of Trustees reviews and approves any material transactions out of the ordinary course of business, including approval of all acquisitions of investment properties, as well as capital and operating budgets. There have been no changes to the Trust’s capital risk management policies for the years ended December 31, 2014 and 2013.
InterRent Real Estate Investment Trust Notes to Consolidated Financial Statements (Cdn $ Thousands except unit amounts)
27
19. CAPITAL RISK MANAGEMENT (Continued) The Trust monitors capital using a debt to gross book value ratio, as defined in the Declaration of Trust which requires the Trust to maintain a debt to gross book value ratio below 75%. As at December 31, 2014, the debt to gross book value ratio is 52.7% (December 31, 2013 – 47.4%). In addition, the Trust is subject to financial covenants in its mortgages payable and credit facilities such as minimum tangible net worth, interest coverage, debt service coverage and leverage ratio (similar to debt to gross book value as calculated in the Declaration of Trust). The Trust was in compliance with all financial covenants throughout the years ended December 31, 2014 and 2013.
20. FINANCIAL RISK MANAGEMENT AND FINANCIAL INSTRUMENTS a) Overview
The Trust is exposed to credit risk, liquidity risk and market risk. The Trust’s primary risk management objective is to protect earnings and cash flow and, ultimately, unitholders value. Risk management strategies, as discussed below, are designed and implemented to ensure the Trust’s risks and the related exposures are consistent with its business objectives and risk tolerance.
b) Credit Risk
Credit risk represents the financial loss that the Trust would experience if a tenant failed to meet its obligations in accordance with the terms and conditions of the lease. The Trust’s credit risk is attributable to its rents and other receivables, loan receivable long-term incentive plan, mortgage holdbacks and mortgages receivable. The amounts disclosed as rents and other receivables and loan receivable long-term incentive plan in the consolidated balance sheets are net of allowances for doubtful accounts, estimated by the Trust’s management based on prior experience and their assessment of the current economic environment. The Trust establishes an allowance for doubtful accounts that represents its estimate of incurred losses in respect of rents and other receivables. The main components of this allowance are a specific loss component that relates to individually significant exposures and an overall loss component established based on historical trends. At December 31, 2014, the Trust had past due rents and other receivables of $2,293 (December 31, 2013 - $2,005), net of an allowance for doubtful accounts of $1,022 (December 31, 2013 - $834) which adequately reflects the Trust's credit risk.
The Trust believes that the concentration of credit risk of accounts receivable is limited due to its broad tenant base, dispersed across varying geographic locations. The Trust has established various internal controls, such as credit checks and security deposits, designed to mitigate credit risk. While the Trust's credit controls and processes have been effective in mitigating credit risk, these controls cannot eliminate credit risk and there can be no assurance that these controls will continue to be effective or that the Trust's current credit loss experience will improve. The amounts shown in the consolidated balance sheets as mortgage holdbacks relate primarily to amounts that will be released upon the completion of repairs to certain buildings. Mortgages receivable represent vendor take back loans on the sale of buildings and are secured by the building. Management believes there is minimal credit risk due to the nature of these amounts receivable and the underlying collateral.
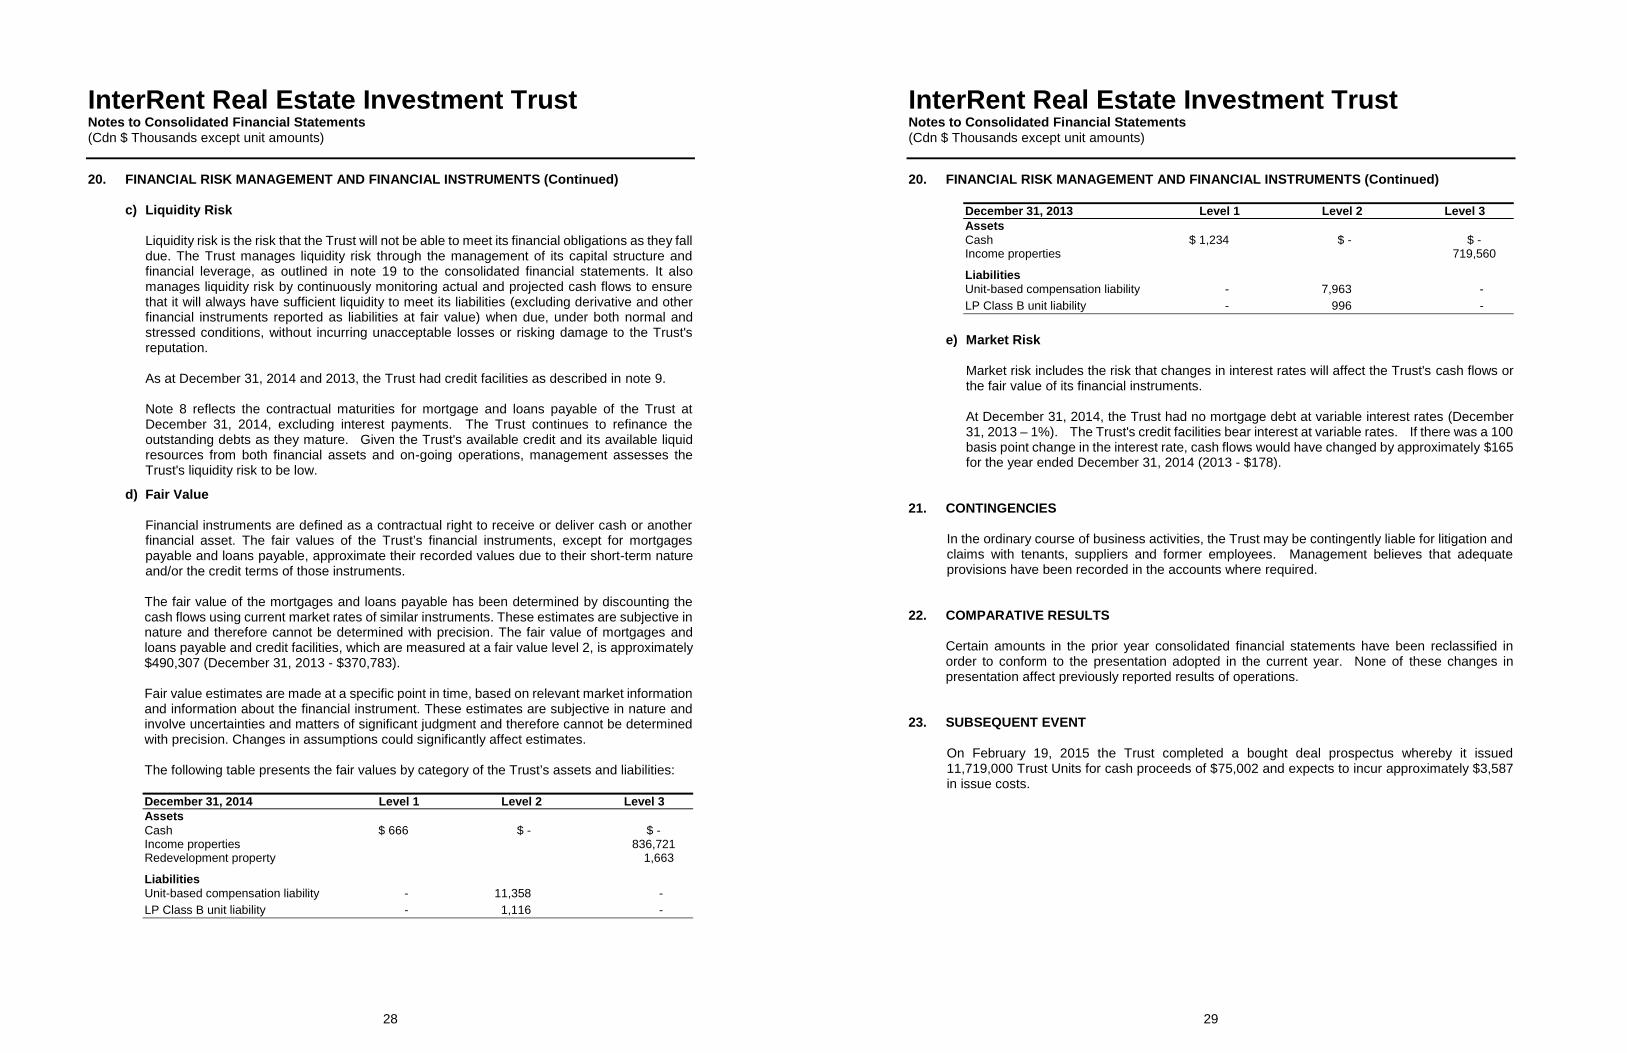
InterRent Real Estate Investment Trust Notes to Consolidated Financial Statements (Cdn $ Thousands except unit amounts)
28
20. FINANCIAL RISK MANAGEMENT AND FINANCIAL INSTRUMENTS (Continued) c) Liquidity Risk
Liquidity risk is the risk that the Trust will not be able to meet its financial obligations as they fall due. The Trust manages liquidity risk through the management of its capital structure and financial leverage, as outlined in note 19 to the consolidated financial statements. It also manages liquidity risk by continuously monitoring actual and projected cash flows to ensure that it will always have sufficient liquidity to meet its liabilities (excluding derivative and other financial instruments reported as liabilities at fair value) when due, under both normal and stressed conditions, without incurring unacceptable losses or risking damage to the Trust's reputation. As at December 31, 2014 and 2013, the Trust had credit facilities as described in note 9. Note 8 reflects the contractual maturities for mortgage and loans payable of the Trust at December 31, 2014, excluding interest payments. The Trust continues to refinance the outstanding debts as they mature. Given the Trust's available credit and its available liquid resources from both financial assets and on-going operations, management assesses the Trust's liquidity risk to be low.
d) Fair Value
Financial instruments are defined as a contractual right to receive or deliver cash or another financial asset. The fair values of the Trust’s financial instruments, except for mortgages payable and loans payable, approximate their recorded values due to their short-term nature and/or the credit terms of those instruments. The fair value of the mortgages and loans payable has been determined by discounting the cash flows using current market rates of similar instruments. These estimates are subjective in nature and therefore cannot be determined with precision. The fair value of mortgages and loans payable and credit facilities, which are measured at a fair value level 2, is approximately $490,307 (December 31, 2013 - $370,783).
Fair value estimates are made at a specific point in time, based on relevant market information and information about the financial instrument. These estimates are subjective in nature and involve uncertainties and matters of significant judgment and therefore cannot be determined with precision. Changes in assumptions could significantly affect estimates. The following table presents the fair values by category of the Trust’s assets and liabilities: December 31, 2014 Level 1 Level 2 Level 3 Assets Cash $ 666 $ - $ - Income properties 836,721 Redevelopment property 1,663
Liabilities Unit-based compensation liability - 11,358 - LP Class B unit liability - 1,116 -
InterRent Real Estate Investment Trust Notes to Consolidated Financial Statements (Cdn $ Thousands except unit amounts)
29
20. FINANCIAL RISK MANAGEMENT AND FINANCIAL INSTRUMENTS (Continued) December 31, 2013 Level 1 Level 2 Level 3 Assets Cash $ 1,234 $ - $ - Income properties 719,560
Liabilities Unit-based compensation liability - 7,963 - LP Class B unit liability - 996 -
e) Market Risk
Market risk includes the risk that changes in interest rates will affect the Trust's cash flows or the fair value of its financial instruments. At December 31, 2014, the Trust had no mortgage debt at variable interest rates (December 31, 2013 – 1%). The Trust's credit facilities bear interest at variable rates. If there was a 100 basis point change in the interest rate, cash flows would have changed by approximately $165 for the year ended December 31, 2014 (2013 - $178).
21. CONTINGENCIES
In the ordinary course of business activities, the Trust may be contingently liable for litigation and claims with tenants, suppliers and former employees. Management believes that adequate provisions have been recorded in the accounts where required.
22. COMPARATIVE RESULTS
Certain amounts in the prior year consolidated financial statements have been reclassified in order to conform to the presentation adopted in the current year. None of these changes in presentation affect previously reported results of operations.
23. SUBSEQUENT EVENT On February 19, 2015 the Trust completed a bought deal prospectus whereby it issued 11,719,000 Trust Units for cash proceeds of $75,002 and expects to incur approximately $3,587 in issue costs.