Embed Size (px)
Citation preview

Interpreting Neighborhood Change in Chicago April 4, 2003 Nathalie P. Voorhees Center for Neighborhood and Community Improvement
College of Urban Planning and Public Affairs Great Cities Institute University of Illinois at Chicago

UIC Nathalie P. Voorhees Center for Neighborhood and Community Improvement April 4,2003
1
GENTRIFICATION AND DECLINE IN CHICAGO: DEFINING NEIGHBORHOOD CHANGE WITH CENSUS DATA REMARKS: Interpreting Neighborhood Change Conference (4-4-03) Please note: The following is a DRAFT taken from a work in progress. Please contact the author for an updated, current version of the paper before quoting. Nancy Hudspeth Nathalie P. Voorhees Center, University of Illinois at Chicago
(312)996-6671 email: [email protected] While the causes of, consequences, and community resistance to neighborhood change are a fascinating story, the purpose of this paper is to present an index of neighborhood change that we developed at the Voorhees Center at the University of Illinois at Chicago, where we work with community organizations on a variety of neighborhood and housing issues. We have found this index to be a useful research tool both to identify neighborhood change and to communicate a large amount of data in a way that is easy to understand, easy to use, and helps us identify areas for further analysis. DEFINITION Before using a term such as “gentrification” it is a good idea to give a definition. According to Neil Smith, “Gentrification is the process by which poor working class neighborhoods in the inner city are refurbished via an influx of private capital and middle-class housekeepers and realtors.” (Smith, 1996) What is implied in the definition is that low-income people are displaced in the process, which is a major concern when looking at this issue. It is also important to put gentrification in context. While the dramatic redevelopment of some Chicago neighborhoods has received a great deal of attention by the public and in the media, we want to stress that gentrification is only part of the story. The vast majority of Chicago’s neighborhoods have not experienced gentrification or massive new development at any time during the past 30 years. In fact, 65 of Chicago’s 77 Community Areas have experienced stability, stagnation and high poverty, or decline since 1970. In order to see Chicago’s disparity and uneven development, it is necessary to look at the city as a whole. BACKGROUND: WEST TOWN STUDY1 This project originated several years ago in our work with the Bickerdike Redevelopment Corporation, a local non-profit community-based organization. Bickerdike builds affordable rental housing in a neighborhood called West Town, which is located just northwest of the downtown area and just west of wealthy lakefront neighborhoods such as the Gold Coast and Lincoln Park. What has happened in West Town is almost a “textbook case” of the gentrification process as described in the literature. West Town was a low-income Latino neighborhood in the 1960s and 70s. In the late 1970s, the neighborhood began to attract artists, middle and upper income professionals, and people interested in historic preservation. Most of these people were white, non-Latino. By the mid-1980s, real 1 See Gentrification in West Town: Contested Ground. UIC Nathalie P. Voorhees Center, http://www.uic.edu/cuppa/voorheesctr/Gentrification.pdf

UIC Nathalie P. Voorhees Center for Neighborhood and Community Improvement April 4,2003
2
estate brokers and developers were actively speculating in West Town, showing the area to clients that couldn’t afford the higher prices of nearby Lincoln Park. With the economic boom of the 1990s came massive real estate development including demolition and new construction, sharply escalating property values and rents, and conflict with Latino residents who were determined not to be pushed out. The Bickerdike CDC found itself in a “land war” with developers, who did not want affordable housing located anywhere near their luxury condominium projects. Around this time, Bickerdike contacted the Voorhees Center to do a study of West Town. One of our tasks was to give them some useful and meaningful demographic data that would describe and help predict what was happening in their neighborhood. Unfortunately, one of our main sources of data, the U.S. Census, was 9 years out of date. In our efforts to make the 1990 data meaningful, we found that by combining data from a variety of demographic categories for each census tract, we could represent what we were seeing in the neighborhood thru windshield surveys and building permit data, nine years later. When the 2000 Census data became available, we decided to use our index method to examine the entire city from the perspective of gentrification, for the period from 1970 to 2000. WHY AN INDEX? As noted previously, we found that an index method could portray a large amount of data in a simple way, one that is easier to understand and to deconstruct, than a regression model. In working with our index, we found that it was a useful tool to identify changes, which is important because we want to be able to identify “at risk” neighborhoods in need of intervention before it is too late to do something about them. The index also highlights significant areas for further study and its simplicity allows us to easily deconstruct it and use specific indicators for in-depth analysis of different areas. It also enables us to see which factors are most strongly linked to either gentrification or decline, by looking at differences between neighborhoods. For instance, some of the key indicators we found after working with the index were race / ethnicity, percent of the population that is represented by children, education, and poverty rate. Some others, such as owner occupied housing and occupation, were not as clearly linked to either process. INDEX DEVELOPMENT We developed our index first by conducting a review of the literature on gentrification, and assembled variables based on citations by multiple authors (see references). Using data that was in the census, the variables in the index include: Median family income, % Families below poverty, Median house value, % Owner-occupied housing, Race / Ethnicity (White, African American, Latino), % Children age 5-19 (school age children), % Elderly (age 65+)2, % Managers and professionals (of all workers), % Adults with college education, % Children enrolled in private schools, % Female-headed households with dependent children under age 183. At this time, we did not have available for 2000 the official median contract rent by community area, but will add this when it is calculated. 2 In the West Town study, we looked at % population under 14 years of age. We initially looked at % population
over 65 years of age, but did not see significant change in this group in West Town. However, this age group would also be included in the current study.
3 In the West Town study, we saw a significant decrease in % Female headed households in gentrified areas,
which corresponds to the fact that these households are in general much more likely to be poor than Male headed households. This may not be the case for all gentrified neighborhoods, however. Since “gentrifier” households are often composed of singles and households with 2 wage earners, it is possible that relatively

UIC Nathalie P. Voorhees Center for Neighborhood and Community Improvement April 4,2003
3
METHOD FOR SCORING Using the 1970, 1980, 1990 and 2000 Census data, we compared the data for these 13 factors in each community area to the same factors for the city as a whole. We used a simple “score card” approach. If a factor was positively associated with gentrification, and a community area had a higher value for this factor than the city as a whole, it received a score of +1. For instance, if there were a higher percentage of college-educated adults in the community area than in the city as a whole, the community area would have a score of +1 for that factor. If a factor were negatively associated with gentrification and the community area had a lower percentage for this factor than the city as a whole, the area would also receive a score of +1 for that factor; for instance, if the poverty rate were lower in this community area than the city as a whole. The maximum value a community area could receive would be +13 and the minimum value a community area could receive would be –13. There are some limitations to this method. It does not tell us how far above or below the city as a whole, a particular community area is for that factor. However, it does reveal patterns that are useful in comparing community areas to each other and to see trends over time. The results of our scoring system can best be summarized by the series of maps in which the number of factors (out of a possible 13) were totaled for each community area for the years 1970, 1980, 1990 and 2000 [SEE MAPS: FACTORS 1970 THRU 2000]. The first point that these maps illustrate is that, given the fact that the lightest colors represent the areas with the highest number of factors, there are a lot more dark areas than light ones in 2000 as opposed to 1970. These maps also portray several trends. As we noted, they delineate the redevelopment of the Loop and surrounding neighborhoods, and the north side lakefront. However, the maps also call attention to significant economic decline on the south and southwest side of the city, the redevelopment of public housing and relocation of poor families, increasing polarization between the north and south sides, and significant shifts in race and ethnicity. ANALYSIS: COMMUNITY AREA TYPOLOGY Based on the maps and scores for the community areas, we constructed a neighborhood “typology.” The first division was to separate community areas that had changed from those that had not changed, because by definition, gentrification and decline are processes of change. We did not want to label as “gentrified” or “gentrifying” those stable upper income areas that had always been significantly above the city as a whole. We also did not want to identify as “declining,” those lower-income areas that had always been significantly below the city as a whole. In our analysis we defined significant change as a change in + / – 4 points in the total “score” for a community area, over a period of 10 years. This is a fairly sensitive measure to compensate for the fact that the community area is a large area for analysis and changes in part, but not all, of the community area will tend to be “averaged out” over the whole area. A change of + or – 4 points during the 1990s corresponds to the changes we have observed in north-side lakefront communities which have experienced significant real estate development in that period. In addition, we wanted to compensate for the fact that census data is only available once every 10 years.
affluent Female headed households could displace poorer ones, and there would be no significant change in the percentage of Female headed households even though these neighborhoods would be gentrified according to other criteria.

UIC Nathalie P. Voorhees Center for Neighborhood and Community Improvement April 4,2003
4
Identifying relatively small changes between 1990 and 2000 enables us to target communities in need of intervention before the changes have already occurred and, essentially, policy-level intervention is too late. Finally, a change in 4 factors is large enough that a change in race and ethnicity only, does not indicate gentrification or decline. Using the definition of change as a change in the score of + or –4 in a period of 10 years, we identified 42 Community Areas as “change communities” and 35 Community Areas as “no change communities.” CHANGE TYPOLOGY We identified 4 types of community areas that did not change significantly in 30 years. Type 1 (“Stable Upper”) communities were those that have always been (since 1970) upper or upper middle-income areas and have been significantly above the city as a whole, with respect to the gentrification factors. 4There are 9 community areas in this group. These areas are located on the far edges of the city, and with the exception of Edgewater, tend to be lower density areas of predominantly single-family homes with a “suburban” appearance. All but one of these areas were ranked in the top 11 out of 77 community areas for median family income in 1970, and the most affluent of the Type 1 communities—Forest Glen, Beverly, Edison Park, Norwood Park, and Mount Greenwood—were consistently ranked in the top 10 to 15 areas out of 77 for median family income. Six of the nine Type 1 areas (again, the most affluent) have been consistently 80% White (non-Latino) or more, throughout the 30 year period. The others have experienced some significant racial and ethnic change during this period; basically, the population has changed from 94-99% White in 1970, to 48-63% White in 2000. The community areas on the north side have a mix of Latinos and Asians making up the balance of the population, while African Americans represented 32% of the population in Beverly in 2000. However, despite significant racial and ethnic change, these areas have remained near the top of the city with respect to median house value, income, and other indicators of wealth. Type 2 (“Stable Middle”) communities were those that showed stability but were less wealthy areas than Type 1. There are 13 community areas in this group, and most of these areas were originally “white ethnic,” working class neighborhoods. These areas have high homeownership rates of 70-80% and have seen a big increase in the Latino population and a decline in White population between 1970 and 2000. All but two Type 2 areas were 89% White or more in 19705. However, in 2000, only two were close to this level. Irving Park and Archer Heights are now 43% Latino, Mont Clare is 39% and McKinley Park is 62%. As with Type 1 community areas, significant racial and ethnic change was not accompanied by equally significant economic decline as indicated by changes in house value, median income, or poverty rate. Middle class white homeowners moved away or died and were replaced by middle class Latino and African American homeowners. The third basic group of “no change” communities is those that were low-income or poverty areas in 1970 and have changed little in 30 years. We further divided these communities into areas of Poverty (Type 3A) and Extreme Poverty (Type 3B). These areas are located on the west and south sides, and are primarily African American neighborhoods with a high poverty rate. Historically these areas have been the location of
4 “Stable” refers simply to a relatively small amount of change over time in the index and/or variables
comprising the score. 5 The 2 that were not were south side Calumet Heights (45%) and southwest side Morgan Park (51%). Today
Calumet Heights is 93% African American, and Morgan Park is 67% African American and 30% White.

UIC Nathalie P. Voorhees Center for Neighborhood and Community Improvement April 4,2003
5
concentrated public housing projects. Of the extreme poverty community areas, all but one (West Englewood) have been 95% (or more) African American since 1970 and all were 94% to 98% African American in 2000. Some of these communities have experienced and continue to experience, massive redevelopment, as large public housing projects such as Robert Taylor Homes have been demolished and residents are being relocated. In other areas, such as Riverdale, public housing is home to nearly all the residents and there is no redevelopment occurring. The extreme poverty areas have the highest rates of families living below poverty, the lowest median family incomes, and the highest proportion of children age 5-19 of the population. Over 90% of the children in these community areas attend public schools and less than 10% of the adults have a college education. “CHANGE” COMMUNITY AREAS Gentrification areas: Using the above criteria for change, we identified 12 community areas that showed significant, positive change with respect to gentrification. This group includes the Loop, Near South Side and Near West Side (just south and west of the Loop), 4 community areas on the north side lakefront (Near North Side, Lincoln Park, Lakeview, Uptown), and 5 community areas adjacent to the gentrifying north-side lakefront communities and Loop (Lincoln Square, North Center, Logan Square, West Town, Near West Side), and Kenwood on the south lakefront. The method also identified 2 outliers, Bridgeport and Armour Square, which both experienced change of +4 points between 1970 and 1980, but have been consistently at or below the overall level of the city for nearly all of the 13 factors since that time. We have called these “Positive Change, Not Gentrification” community areas. A key point to note is that the identification of change in itself, does not tell us how far along in the gentrification process these community areas are. Five of the 12 gentrification Community Areas have achieved a level of +11 or higher, in 2000. They may and probably will continue to increase in terms of wealth; however, the socioeconomic change they experience at this point will probably be relatively subtle. In general, the north lakefront community areas of Lakeview, Lincoln Square, and North Center might be considered more subtle cases of socioeconomic change than gentrification, since they have never been high-poverty areas and have always been majority white, non-Latino neighborhoods. However, the number of poor families in these community areas has decreased significantly during the past 10 years, which is an important criteria in the literature.
Five of the gentrification community areas—West Town, Logan Square, Uptown, Near South Side, Near West Side—are experiencing redevelopment and displacement as we write/speak. Although they have experienced drastic change, particularly during the 1990s, their overall scores for 2000 are still within the range of poverty or only slightly above the city as a whole: -5 for Logan Square, -3 for Near West Side, 0 for Near South Side, +3 for West Town and Uptown. This is partly because these areas have significant disparity within the community area that “averages out” to a mid or low level, and partly because these community areas would have been considered mild to extreme poverty areas only 10 years ago. For example, West Town’s score changed from –9 in 1990 to +3 in 2000, an increase of 12 points. The Near South Side increased from a –7 in 1990 to 0 in 2000. Changes this noticeable are likely to continue the upward trend. One example, the community area of Uptown (which experienced a change of +4 points in the 1990s) is currently the site of real estate speculation and development similar to what occurred in West Town. Median house values in Uptown have jumped from $137,800 in 1990 to $270,300 in 2000. “Gentrifier” community groups have actively

UIC Nathalie P. Voorhees Center for Neighborhood and Community Improvement April 4,2003
6
marketed the Uptown neighborhood to developers and large corporations; in fact, at this time, construction is underway for a massive luxury condo development and a Borders bookstore at Montrose and Broadway.
Decline areas: Using our definition of change as a change in 4 points in 10 years, we identified 28 community areas that declined at some point in the 30-year period of our analysis. We divided the decline communities into 3 basic types: Type 5 Mild Decline (10 areas), Type 6 Moderate Decline (5 areas), and Type 7 Serious Decline (13 areas.) We defined mild decline as a change in –4 points during 10 years, with changes in other decades of less than 4 points. Moderate decline was defined as a decrease in 5 to 6 points during one decade, with other decades changing less than 4 points. Serious decline was defined as 2 or more decades with declines of 4 points or more, during the 30-year period; or a decrease in one decade of more than 6 points.
When we consider the decline areas, several points are significant: (1) Most of the decline occurred between 1990 and 2000. Three of the five moderate decline areas decreased more than 4 points between 1990 and 2000. All but three of the serious decline areas (10 of 13) declined 4 points or more between 1990 and 2000. Seven out of 10 areas that showed mild decline, those that only had one “negative” decade, had their decline of 4 points during the decade 1990 to 2000. (2) Most of the decline has occurred in areas that, prior to 1990, would have been considered Type 1 or Type 2 areas, Stable upper or middle. A total of 15 community areas fit this description. A majority of these, 8 out of 15, had generally positive scores in the range of +1 to +5, but between 1990 and 2000 declined to scores of –1 to –9. A decrease from +1 to –3 during the 1990s was common, with 4 community areas (Hermosa, Washington Heights, East Side, and Brighton Park all showing this pattern. Examining the data for these 4 community areas, there are no spectacular changes, however three of them (Hermosa, East Side and Brighton Park) have all seen a significant increase in the Latino population of families with children; median house values and incomes have stagnated with respect to the city as a whole. College educated adults and professionals have increased slightly, but not as much as in the city as a whole. The fourth of these community areas, Washington Heights, is 98% African American and the only area of exceptional decline that stands out in this community area, appears to be an increase in the elderly population. It is important to note that we do not consider racial and ethnic change in itself, to be negative change. Many of the upper stable and middle stable community areas have experienced significant “white flight” and still remain at the top of the city with respect to other indicators of wealth. However, racial and ethnic minorities have historically been associated with disinvestment, so increased minority populations might still be considered an early warning assuming investors might react negatively despite efforts to reduce discrimination.
Also of interest are six community areas that showed significant decline, even though they remained in the upper or mid range, or declined from upper to middle. Southwest side communities Ashburn and West Lawn both declined from +7 to +1 during the 1990s. Both of them experienced a significant drop in the White non-Latino population during this time (from 83 and 88% in 1990 to 37 and 43% in 2000) in which White people were replaced by African Americans and Latinos. In 2000, West Lawn was roughly 43% White and 52% Latino; Ashburn was 37% White, 43% Black, and 17% Latino. Interestingly, both

UIC Nathalie P. Voorhees Center for Neighborhood and Community Improvement April 4,2003
7
had median house values that were slightly above the city’s total of $78,000 in 1990 ($78,200 in West Lawn and $81,100 in Ashburn); however, median house value in both was significantly below the city’s total of $132,400 in 2000 ($119,816 in West Lawn and $116,625 in Ashburn). Homeownership in both neighborhoods was quite high throughout the decade, 82-3% in West Lawn and 91.1% in Ashburn. Is it a coincidence that Ashburn’s median house values dropped more than West Lawn’s, at the same time the population of African Americans in this area increased significantly?
A final point to note regarding the decline communities is that the vast majority of these areas (19 out of 28) are located on the south and southwest sides of the city, generally adjacent to the Type 3 Extreme Poverty areas. The two main explanations for the decline in these areas are the loss of manufacturing jobs in this area since the 1970s, and the ongoing redevelopment of public housing and relocation of residents. Most of the decline community areas on the north side are located just west of the gentrifying areas. It is impossible to prove but not too far -fetched to surmise that the low-income residents who are moving out of areas such as West Town and Uptown, are moving into neighborhoods such as Rogers Park, Albany Park, Avondale, Hermosa, Belmont Cragin, Austin, and Humboldt Park. It is also not too difficult to imagine that if the north side real estate development process were more equitably distributed, the disparity between the north side and south side would be less evident.
DECONSTRUCTING THE INDEX As noted previously, one of the strengths of the index is that it enables us to identify areas of further study and calls attention to particular factors that we may want to study in more depth. Several key variables of interest to us are changes in race / ethnicity, location and distribution of poor families, location and distribution of college-educated adults, and the demographic profile of age (% of population that consists of school age children and % of population that consists of elderly). These individual factors have been analyzed to show the spatial distribution and correlation with the gentrification index/factors (see maps). A key point in any discussion of gentrification is the displacement of low-income families. Some critics argue that this is a key requirement to differentiate gentrification per se from other types of urban redevelopment (for example see Bourne, 1993) These authors insist that conversion of abandoned manufacturing districts into luxury residential lofts is not gentrification because no low-income families are displaced in the process. For this reason we wanted to analyze the poverty rate and distribution of low income families in more detail. Between 1990 and 2000, the overall percentage of families below poverty declined by 9.3% for the city as a whole. Reviewing the percent change between 1990 and 2000 for all community areas and noting any that declined by more than 9.3% is revealing, because it either identifies those community areas that we labeled “gentrification community areas” or those that have been experiencing redevelopment of public housing and relocation of poor families. For this reason we can’t call decline in families below poverty necessarily an indicator of gentrification, but it is significant in areas that are not public housing sites. Another way to look at this is to compare the change in total number of families, versus the change in number of families below poverty, by community area. For the period 1990 to 2000, 8 of the 12 gentrification community areas showed a decline in the number of poor families that was either greater than the total number of families lost, or occurred at the same time that the total number of families
UIC Nathalie P. Voorhees Center for Neighborhood and Community Improvement April 4,2003
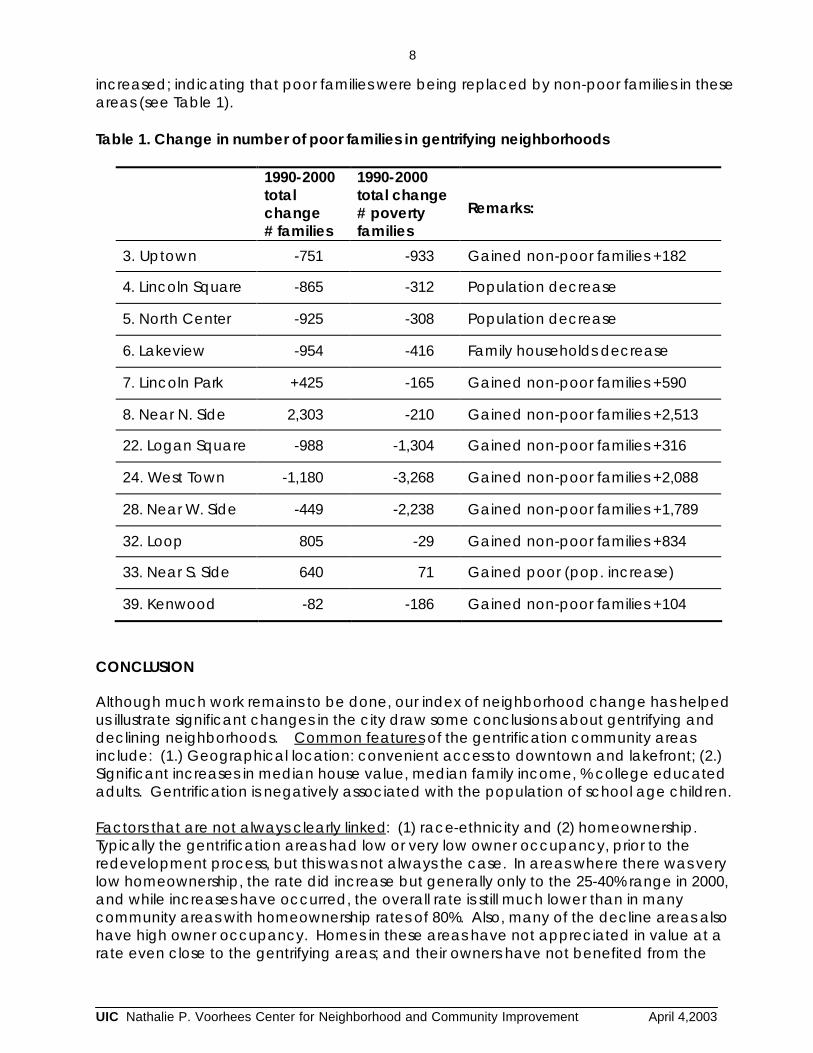
8
increased; indicating that poor families were being replaced by non-poor families in these areas (see Table 1). Table 1. Change in number of poor families in gentrifying neighborhoods
1990-2000 total change # families
1990-2000 total change # poverty families
Remarks:
3. Uptown -751 -933 Gained non-poor families +182
4. Lincoln Square -865 -312 Population decrease
5. North Center -925 -308 Population decrease
6. Lakeview -954 -416 Family households decrease
7. Lincoln Park +425 -165 Gained non-poor families +590
8. Near N. Side 2,303 -210 Gained non-poor families +2,513
22. Logan Square -988 -1,304 Gained non-poor families +316
24. West Town -1,180 -3,268 Gained non-poor families +2,088
28. Near W. Side -449 -2,238 Gained non-poor families +1,789
32. Loop 805 -29 Gained non-poor families +834
33. Near S. Side 640 71 Gained poor (pop. increase)
39. Kenwood -82 -186 Gained non-poor families +104
CONCLUSION Although much work remains to be done, our index of neighborhood change has helped us illustrate significant changes in the city draw some conclusions about gentrifying and declining neighborhoods. Common features of the gentrification community areas include: (1.) Geographical location: convenient access to downtown and lakefront; (2.) Significant increases in median house value, median family income, % college educated adults. Gentrification is negatively associated with the population of school age children.
Factors that are not always clearly linked: (1) race-ethnicity and (2) homeownership. Typically the gentrification areas had low or very low owner occupancy, prior to the redevelopment process, but this was not always the case. In areas where there was very low homeownership, the rate did increase but generally only to the 25-40% range in 2000, and while increases have occurred, the overall rate is still much lower than in many community areas with homeownership rates of 80%. Also, many of the decline areas also have high owner occupancy. Homes in these areas have not appreciated in value at a rate even close to the gentrifying areas; and their owners have not benefited from the

UIC Nathalie P. Voorhees Center for Neighborhood and Community Improvement April 4,2003
9
economic boom. Owner occupancy appears to be linked to the original housing stock of the neighborhood; and is not clearly linked to socioeconomic change. Our index has shown potential for future analysis and study. The next step is to look at the data at the census tract level, and to overlay the index values with other data including real estate prices, building permit data, mortgage data. When the PUMS data becomes available later this year, it will enable us to analyze the distribution and origins of recent wealthy homebuyers in community areas. The index also highlights some areas for case studies. REFERENCES / BIBLIOGRAPHY Badcock, Blair (1993) “Notwithstanding the Exaggerated Claims, Residential Revitalization Really is Changing the Form of Some Western Cities: A Response to Bourne,” Urban Studies, Vol. 30, No. 1, pp.191-195. Beauregard, Robert A. (1986) “The Chaos and Complexity of Gentrification,” in N. Smith and P. Williams (eds.) Gentrification of the City. Boston, Massachusetts: Allen & Dunwin, pp. 35-55. Bourne, L.S. (1993) “The Demise of Gentrification? A Commentary and Prospective View,” Urban Geography, Vol. 14, no. 1, pp.95-107 Clay, Philip L. (1979) Neighborhood Renewal . Lexington, Massachusetts: Lexington Books, pp.11-33. Hammel, Daniel J. and Elvin K. Wyly (1996) “A Model For Identifying Gentrified Areas With Census Data,” Urban Geography, Vol. 17, no.3, pp.248-268. Hammel, Daniel J. (1999) “Re-establishing the Rent Gap: An Alternative View of Capitalised Land Rent,” Urban Studies, Vol. 36, No. 8, pp.1283-1293. Kennedy, Maureen and Paul Leonard (2001) “Dealing With Neighborhood Change: A Primer on Gentrification and Policy Choices,” A Discussion Paper Prepared for The Brookings Institution Center on Urban and Metropolitan Policy www.brookings.edu/urban London, Bruce, Barrett A. Lee, and S. Gregory Lipton (1986) “The Determinants of Gentrification in the United States: A City-Level Analysis,” Urban Affairs Quarterly, Vol. 21 No.3, March 1986, 369-87. Marcuse, Peter. (1999) “Comment of Elvin K. Wyly and Daniel J. Hammel’s ‘Islands of Decay in Seas of Renewal: Housing Policy and the Resurgence of Gentrification,” Housing Policy Debate, Vol.10, Issue 4. Smith, Neil and Peter Williams, eds. Gentrification of the City (1986) Boston, MA: Allen and Dunwin. Smith, Neil (1996) The New Urban Frontier: Gentrification and the Revanchist City. London, New York: Routledge.

UIC Nathalie P. Voorhees Center for Neighborhood and Community Improvement April 4,2003
10
Wyly, Elvin K. and Daniel J. Hammel (1998) “Modeling the Context and Contingency of Gentrification,” Journal of Urban Affairs, Vol. 20 No.3, 303-326. Wyly, Elvin K. and Daniel J. Hammel (1999) “Islands of Decay in Seas of Renewal: Housing Policy and the Resurgence of Gentrification,” Housing Policy Debate, Vol. 10, Issue 4. pp 711-771. Zukin, Sharon. (1987) “Gentrification: Culture and Capital in the Urban Core,” Annual Review of Sociology, Vol. 13, pp. 129-147.

UIC Nathalie P. Voorhees Center for Neighborhood and Community Improvement April 4,2003
11
Number of
77 Chicago Community Areas
ggeennttrriiffiiccaattiioonn ddeecclliinnee,, nnoo ggeennttrriiffiiccaattiioonn
Evidence of Gentrification by Community Area, 2000
11 to 13 7 to 10 1 to 6 0 -1 to - 6 -7 to -10 -11 to -13

UIC Nathalie P. Voorhees Center for Neighborhood and Community Improvement April 4,2003
12
Neighborhood Types Based on Change in Index Score 1970-
Index components: Median family income (+) % families below poverty (-) Median house value (+) % owner-occupied housing (+)
% White (+) % African American (-) % Latino Population (-) % children age 5-19 (-) % 65 years or older (-)
% professionals & managers (+) % adults w/college degree (+) % children in private schools (+) % female-headed households
w/children (-)
+ / – indicates relationship to gentrification (e.g., a decrease (-) in children is associated with gentrification)

UIC Nathalie P. Voorhees Center for Neighborhood and Community Improvement April 4,2003
13
Neighborhood Types Based on Change in Index Score 1970-2000
77 Chicago Community Areas