Embed Size (px)
Citation preview

The most common preconditioning of seismic data improves the signal-to-noise (S/N) ratio of the seismic
data by removing spatial noise or enhancing the coherency and alignment of the reflection events, without unnecessary smoothing or smearing of the discontinuities. Although we usually think of removing unwanted features, we can also improve the S/N by predicting unmeasured signal, such as dead traces and lower-fold areas corresponding to unrecorded offsets and azimuths in the gathers. Missing offsets and azimuths almost always negatively impact prestack inversion and AVAz analysis. While missing offsets and azimuths may not result in sufficiently reduced S/N of stacked data to impair conventional time-structure interpretation, they usually give rise to attribute artifacts. If the inconsistencies in fold follow a regular pattern, we refer to the corresponding attribute pattern as “acquisition footprint.” Acquisition footprint is an undesirable artifact that masks the geologic features or amplitude variations seen on time slices from the seismic data, especially at shallow times. We begin our article by correlating missing data and areas of low fold to artifacts seen in seismic attributes. We then show how 5D interpolation of missing data prior to prestack migration results in more complete gathers resulting in a better balanced stack and the reduction of footprint and other attribute artifacts.
IntroductionIdeally, one designs a 3D seismic data to properly sample the subsurface geometry in all spatial dimensions: x, y, offset, and azimuth, required by our processing algorithms. In real-ity, missing shots, platforms and other obstacles, as well as tides and currents that give rise to feathering result in irregu-lar acquisition of marine data. Since the days of the single streamers, the inlines are usually well sampled, while the sampling in the crosslines is usually more coarse. Land acquisition encounters a dif-ferent suite of obstacles, that coupled with limited recording capacity and greater cost results in small or large “holes” in seismic data coverage. Recording equipment malfunctions and noise bursts during acquisition may add more missing traces to the usable recorded data.
Sparse or missing data create problems for the processing algo-rithms; early poststack migration volumes often exhibited aliasing artifacts for poorly sampled data. Prestack migration also suffers from aliasing, but the desire to apply
Preconditioning seismic data with 5D interpolation for computing geometric attributes
INTERPRETER’S CORNER Coordinated by EzEquiEl GonzalEz
SatindEr Chopra, Arcis Seismic Solutions, TGS, Calgary, Canada Kurt J. Marfurt, University of Oklahoma, Norman, USA
prestack inversion, AVO, and AVAz demands regularity in the offset and azimuth dimensions for optimum perfor-mance. Geometric attributes such as coherence and curvature computed from suboptimally sampled seismic data give rise to acquisition footprint and other artifacts. We show below how 5D interpolation can aid in many of these instances.
5D interpolationObviously, the ideal way to fill in the missing data gaps would be to reshoot the data in those areas. Such infill acquisition would be extremely expensive per data point, if the equip-ment could be made available for such a small time in the field. Such problems have been addressed at the processing stage since the advent of digital processing, whereby adjacent traces are used to populate the missing values. Initial trace replication was superseded by first 2D and later 3D triangu-lar trace interpolation algorithms. These methods, referred to as local methods of interpolation as they need localized information for their operation, are fast and easy to imple-ment, but cannot handle large gaps in the data. During the last decade or so, global methods for data interpolation have evolved that use further well-sampled data to populate the missing data. These methods are multidimensional rather than one-dimensional, operating simultaneously in as many as five different spatial dimensions, and are able to predict the missing data with more accurate amplitude and phase variations. As expected, these methods are compute intensive and have longer run-times than the local methods.
Various multidimensional interpolation methods have been proposed by different developers, namely Duijndam et al., (1999); minimum weighted norm interpolation (MWNI) method by Liu and Sacchi (2004), the anti-leakage Fourier
1456 The Leading Edge December 2013
Figure 1. Vertical slices through the seismic amplitude volume (a) before, and (b) after 5D interpolation.
December 2013 The Leading Edge 1457
INTERPRETER’S CORNER INTERPRETER’S CORNER Coordinated by EzEquiEl GonzalEz
transform (ALTF) method by Xu et al. (2005), the projection onto con-vex sets (POSC) method by Abma and Kabir (2006), and others by Stein et al. (2010) and Wojslaw et al. (2012).
We discuss below the application of the minimum weighted norm method by Liu and Sacchi (2004). In this method, the interpolation is formulated as an inverse problem where the actual data set is the re-sult of a sampling matrix operation on an unknown fully sampled data-set. The constraint introduced in the problem is that the multidimension-al spectrum of the unknown data is the same as that of the original data. This is enforced by a multidi-mensional Fourier transform. A cost function is defined and is minimized using standard optimization tech-niques. Trad (2008) demonstrated the first commercial implementation of this method.
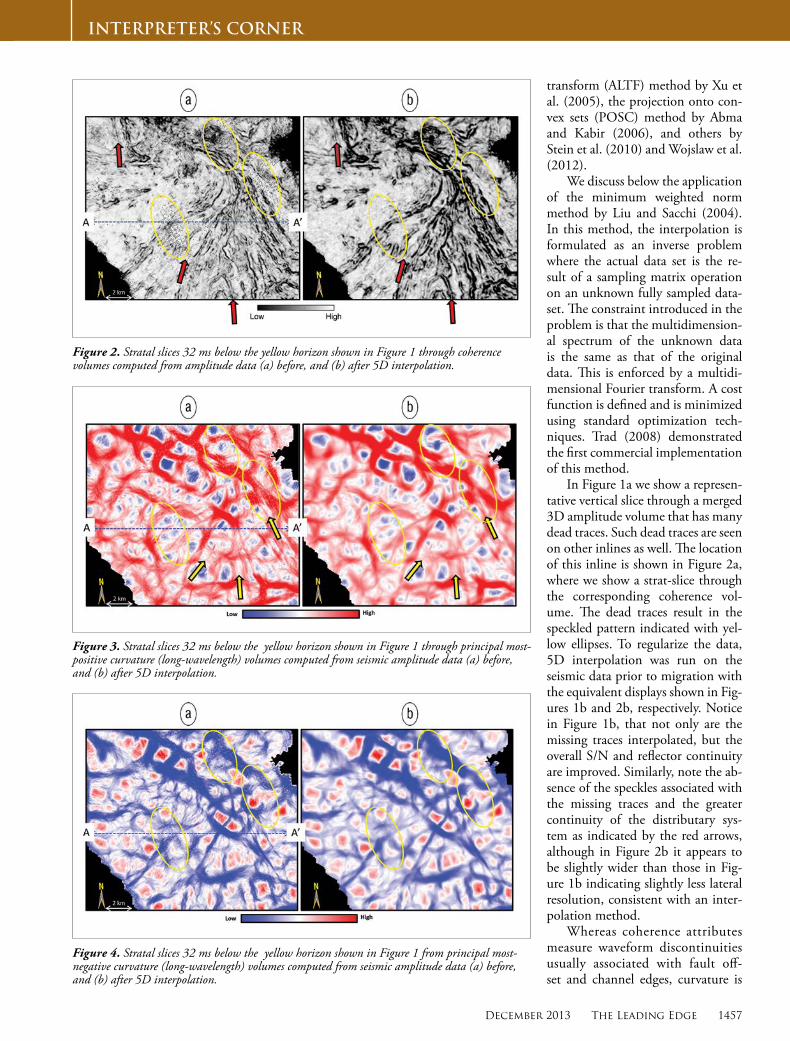
In Figure 1a we show a represen-tative vertical slice through a merged 3D amplitude volume that has many dead traces. Such dead traces are seen on other inlines as well. The location of this inline is shown in Figure 2a, where we show a strat-slice through the corresponding coherence vol-ume. The dead traces result in the speckled pattern indicated with yel-low ellipses. To regularize the data, 5D interpolation was run on the seismic data prior to migration with the equivalent displays shown in Fig-ures 1b and 2b, respectively. Notice in Figure 1b, that not only are the missing traces interpolated, but the overall S/N and reflector continuity are improved. Similarly, note the ab-sence of the speckles associated with the missing traces and the greater continuity of the distributary sys-tem as indicated by the red arrows, although in Figure 2b it appears to be slightly wider than those in Fig-ure 1b indicating slightly less lateral resolution, consistent with an inter-polation method.
Whereas coherence attributes measure waveform discontinuities usually associated with fault off-set and channel edges, curvature is
Figure 2. Stratal slices 32 ms below the yellow horizon shown in Figure 1 through coherence volumes computed from amplitude data (a) before, and (b) after 5D interpolation.
Figure 3. Stratal slices 32 ms below the yellow horizon shown in Figure 1 through principal most-positive curvature (long-wavelength) volumes computed from seismic amplitude data (a) before, and (b) after 5D interpolation.
Figure 4. Stratal slices 32 ms below the yellow horizon shown in Figure 1 from principal most-negative curvature (long-wavelength) volumes computed from seismic amplitude data (a) before, and (b) after 5D interpolation.

1458 The Leading Edge December 2013
INTERPRETER’S CORNER
commonly related with folds, flexures, and differential com-paction. In Figure 3, we show a comparison of the principal most-positive curvature (long-wavelength) on the input data and then the same data with 5D interpolation. Missing traces give rise to inaccurate estimates of structural dip which is in-put to volumetric curvature computations. Ellipses indicate the effect of dead traces on volumetric curvature in Figure 3a. Note the more continuous, better focused lineaments seen on curvature computed from the 5D-interpolated volume in Figure 3b. Figure 4 shows a similar comparison for the principal most-negative curvature (long-wavelength). As with Figure 2, we do, however, notice slightly less lateral resolution of the attributes computed from the 5D-interpolated data, indicated by yellow arrows in Figure 3b.
The inference we draw from this exercise is that regular-ization by 5D interpretation yields better focused but less well-defined images. To improve the lateral resolution, we suggest the use of the short wavelength version of the princi-pal curvature as shown in Figure 5. Interpretation carried out on such attributes will definitely be more accurate than the one carried out on data without regularization.
Acquisition footprint suppressionAcquisition footprint is a term we use to define linear spatial grid patterns seen on 3D seismic time slices. These patterns are com-monly seen on shallow time slices or horizon amplitude maps as striations masking the actual amplitude anomalies under con-sideration for stratigraphic interpretation, AVO analysis, and reservoir attribute studies. An acquisition footprint may be pres-ent for various reasons, but two general types of footprint can be distinguished: those depending on the details of the acquisition geometry, and those arising from signal-processing problems (Drummond et al., 2000). The choice of any acquisition design is characterized by a particular distribution of fold, offset, and azimuth. Apart from some variation in the taper zone, the fold for most common geometries should be uniform for all seismic bins. However, the offset and azimuth distribution can vary from bin to bin, or can be uniform in the inline direction and irregular in the crossline direction. Such varia-tions can lead to undesirable effects on the reflected signal. Deviations from a regular geometry pattern, such as in-accessible patches within a 3D survey area that are under human habitation or the location of a power station, can be responsible for such variation.
Economic considerations often compel coarse sampling in 3D data acquisition, which can cause arti-facts during processing. Coarse spa-tial sampling leads to aliasing, and aliased steeply dipping noise resulting from ground roll or multiples, for ex-ample, creates artifacts. Aliased noise can be accentuated during process-ing and leak into the stack volumes
as spatially periodic events, forming an acquisition footprint. Other processes that tend to accentuate footprints are residual NMO caused by incorrect velocities, systematic errors in com-puted offsets, or amplitude variations caused by inadequate 3D DMO formulation (Walker et al., 1995), 3D prestack migra-tion, signal enhancements based on f-x-y random noise attenu-ation, and coherency filtering (Moldoveanu et al., 1999).
An acquisition footprint, whether resulting from acquisi-tion design or accentuation during processing, is a nuisance for the interpreter. Efforts are sometimes made to prevent accen-tuation of the footprint during processing, usually by adopting interpolation or extrapolation to remedy the sparseness of the input data volumes before applying multichannel processes. If interpolation is computationally prohibitive, we can resort to trace mixing, which tends to minimize the footprint effect at the risk of reducing lateral resolution. Gulunay (1999) found that wavenumber domain filtering based on the acquisition de-sign often works. A similar filtering method for non-orthogo-nal geometries has been suggested by Soubras (2001).
Chopra and Larsen (2000) suggested a similar way of deal-ing with the acquisition footprint, which is to analyze the foot-print-contaminated poststack migrated data, time slice by time slice, in the kx-ky wavenumber domain. Apart from kx-ky filter-ing, spatially adaptive methods using wavelet transforms have been suggested for highly irregular footprint (Cvetkovic et al., 2007). Al-Bannagi et al. (2005) proposed a method using prin-cipal component analysis. By animating through the seismic as well as the corresponding coherence slices, the interpreter can define the change in footprint with depth.
As 5D interpolation discussed above regularizes the geom-etry of the seismic data, it addresses the root cause of the foot-print arising because of the acquisition irregularities. In Figure 6 we show time slices at 158 ms where the acquisition footprint appears prominently on the coherence attribute as striations in the NE-SW direction, masking the reflection detail behind them. Figure 6b shows the equivalent coherence slice after 5D regularization exhibiting considerable improvement in data
Figure 5. Stratal slices 32 ms below the yellow horizon shown in Figure 1 from (a) principal most-positive curvature (short-wavelength) and (b) principal most-negative curvature (short-wavelength) volumes run on input data with 5D interpolation.

December 2013 The Leading Edge 1459
INTERPRETER’S CORNER
Faculty PositionsEarth Sciences and Engineering ProgramThe Earth Sciences and Engineering (ErSE) Program at King Abdullah University of Science and Technology (KAUST) has two open faculty positions at Assistant, Associate, or Full Professor rank in the fields of:
1) Solid Earth Geophysics 2) Atmospheric SciencesWe are seeking exceptional scientists who use experimental and/or modeling approaches to address a wide range of Earth Science problems. The successful candidates should have an excellent internationally recognized scientific record, be able to lead a high impact research program, and have a strong commitment to teaching at the graduate level. The salary and research funding levels at KAUST are among the highest of any academic institution.
For more information and to apply for the position, please visit http://apptrkr.com/407016 and click on the Employment tab. Applications received by January 31, 2014 will receive full consideration and positions will remain open until filled.
About KAUSTKAUST is an international, graduate research university dedicated to advancing science and technology through interdisciplinary research, education, and innovation. Located on the shores of the Red Sea in Saudi Arabia, KAUST offers superb research facilities, generous assured research funding, and internationally competitive salaries, attracting top international faculty, scientists, engineers, and students to conduct fundamental and goal-oriented research to address the world’s pressing scientific and technological challenges related to the sustainability of water, food, energy, and the environment.
About ErSE ProgramThe ErSE Program, within the Division of Physical Sciences and Engineering, currently has eight full time faculty members, about 30 post-docs and research scientists and more than 50 graduate students. Research areas include: applications of modern computational methods to study geophysical problems associated with the atmosphere and/or ocean circulation, earthquakes, oil exploration, reservoir modeling, and subsurface phenomena. These areas are enhanced through close collaboration with some of the best geophysical and meteorological centers in the world, and advanced central research facilities including supercomputing and scientific visualization. More information about the ErSE program and research activities is available at: http://ese.kaust.edu.sa
www.kaust.edu.sa

1460 The Leading Edge December 2013
INTERPRETER’S CORNER
Chopra, S., and G. Larsen, 2000, Acquisition footprint—its detection and removal: CSEG Recorder, 25, no. 8, 16–20.
Cvetkovic, M., S. Falconer, K. J. Marfurt, and S. C. Perez, 2007, 2D stationary wavelet-based acquisition footprint suppression: 77th An-nual International Meeting, SEG, Expanded Abstracts, 2590–2593.
Drummond, J. M., A. J. L. Budd, and J. W. Ryan, 2000, Adapting to noisy 3D data – attenuating the acquisition footprint: 70th Annual International Meeting, SEG, Expanded Abstracts, 9–12.
Duijndam, A. J. W., M. A. Schonewille, and C. O. H. Hindriks, 1999, Reconstruction of band-limited signals, irregularly sampled along one spatial direction: Geophysics, 64, no. 2, 524–538, http://dx.doi.org/10.1190/1.1444559.
Gulunay, N., 1999, Acquisition geometry footprints removal: 69th An-nual International Meeting, SEG, Expanded Abstracts, 637–640.
Liu, B., and M. Sacchi, 2004, Minimum weighted norm interpola-tion of seismic records: Geophysics, 69, no. 6, 1560–1568, http://dx.doi.org/10.1190/1.1836829.
Moldoveanu, N., S. Ronen, and S. Mitchell, 1999, Footprint analysis of land and TZ acquisition geometries using synthetic data: 69th An-nual International Meeting, SEG, Expanded Abstracts, 641–644.
Soubaras, R., 2002, Attenuation of acquisi-tion footprint for nonorthogonal 3D geometries: 72nd Annual International Meeting, SEG, Expanded Abstracts, 2142–2145.
Stein, J. S., S. Boyer, K. Hellman, and J. Weigant, 2010, Application of POCS interpolation to exploration: 80th An-nual International Meeting, SEG, Ex-panded Abstracts, 2013–2016.
Trad, D., 2008, Five-dimensional seismic data interpolation: 78th Annual In-ternational Meeting, SEG, Expanded Abstracts, 978–982.
Walker, C. D. T., A. R. Mackewn, A. J. L. Budd, and J. W. Ryan, 1995, Marine 3D geometry design for optimum ac-quisition system response, 57th EAGE Conference and Exhibition, Extended Abstracts, B029.
Wojslaw, R., J. A. Stein, and T. Langston, 2012, 5D semblance-based interpola-tor in exploration-theory and practice: 74th EAGE Conference and Exhibi-tion, Extended Abstracts, B024.
Xu, S., Y. Zhang, and G. Lambaŕe, 2005, Recovering densely and regularly sam-pled 5D seismic data for current land acquisition, 67th EAGE Conference and Exhibition, Extended Abstracts, W024.
Acknowledgments: We thank Arcis Seismic Solutions, TGS, for encouraging this work and for permission to present these results. The first author acknowl-edges the processing division of Arcis Seismic Solutions for the processing of seismic data with 5D interpolation.
Corresponding author: [email protected]
quality. Similarly, Figure 7 shows cleaner and clearer curvature displays that one can derive from the data after 5D regulariza-tion and resulting in a more confident interpretation.
ConclusionsSeismic data usually have geometry regularization issues that give rise to artifacts on geometric attribute displays. 5D in-terpolation methods adopted during processing help address issues such as missing data pockets and acquisition footprint striations. Coherence and curvature attributes computed on regularized seismic data yield displays clear of these artifacts and so lead to more confident displays.
ReferencesAbma, R., and N. Kabir, 2006, 3D interpolation of irregular data with
a POCS algorithm: Geophysics, 71, no. 6, E91–E97, http://dx.doi.org/10.1190/1.2356088.
Al-Bannagi, M., K. Fang, P. G. Kelamis, and G. S. Douglass, 2005, Ac-quisition footprint suppression via the truncated SVD technique: case studies from Saudi Arabia: The Leading Edge, 24, no. 8, 832–834, http://dx.doi.org/10.1190/1.2032259.
Figure 6. Time slices at 158 ms through coherence volumes computed from amplitude data (a) before, and (b) after 5D interpolation.
Figure 7. Time slices at 158 ms. (a) Most-positive curvature (long-wavelength) and (b) most-negative curvature (long-wavelength) volumes run on the uninterpolated input data. Equivalent time slices through the (c) most-positive curvature (long-wavelength) and (d) most-negative curvature (long-wavelength) volumes run on the 5D-interpolated input data.

December 2013 The Leading Edge 1461
INTERPRETER’S CORNER
Increase and regularize your fold to push your azimuthal fracture analysis to the next level.
Merging 3D surveys of mixed vintages? Tricon’s 5D Interpolation enhances the fidelity of your legacy surveys, so there’s no need to “dumb down” your newer vintage seismic to get the optimal merged volume.
c l a r i t ytricON + 5D iNtErPOlatiON=
Denver 303.292.9222 Houston 713.532.5006 Caracas 58.212.2421233 Bogota 57.1.635.0700
www.tricongeophysics.com
Conventional unmigrated seismic section 5D Interpolated unmigrated seismic section