Embed Size (px)
Citation preview
1
Mr. THOMAS.K.J HASS SAHIBABAD
Interpretation of Topographical Maps
TYPES OF MAPS
There are different types of maps. We will focus now on Topographical Maps.
1. Topographical maps
In order to do this, you must be able to:
a.Interpret the shape of the ground from a map;
b.Definition of relief; and
c.Representation of height.
CONTOURS
•A contour is a line on a map joining two points of equal height, and is the standard method of showing
relief on a topographical map. Contours are shown at regular vertical intervals.
On a 1:50,000 map the interval is 10 m.
INTERPRETATION OF CONTOURS •The shape of the contours indicates the shape of the ground.
When contours are further apart, the slope is gentle and when contours are close together the greater the
drop.
When contours are equal distance apart the slope is uniform:
a.Contours are continuous. No matter how far they travel, they always return to where they started.
Except for a cliff.
b.When spacing of contours down a slope gets close together at the bottom, the slope is convex.
c. When spacing is further apart, the slope is concave.
STAGE 3 – PLOTTING GRID REFERENCES
•A grid is a rectangular square system of lines superimposed on a map, within which any point can be
located.
Maps are normally printed so that north is on top.
•North / South lines are called Eastings because the numbers increase as they go East.
•East / West lines are called Northings because the numbers increase as they go North. What are the 3 points in determining height?
1.bench marks;
2.trig points; and
3.spot height.
What are Eastings and Northings?
1. Eastings run – move left to right; and
2.Northings run – bottom to top.
What are the two most important things to remember when giving a grid?
1. Easting value first; and
2.never round up.
What is the purpose of a contour line?
Joins points of equal heights.

2
Mr. THOMAS.K.J HASS SAHIBABAD
•A topographic map is a type of map characterized by large-scale detail and quantitative representation
of relief, usually using contour lines in modern mapping, but historically using a variety of methods.
Traditional definitions require a topographic map to show both natural and man-made features. •The Centre for Topographic Information provides this definition of a topographic map: “A topographic map
is a detailed and accurate graphic representation of cultural and natural features on the ground."
•According to Cartographer's Kraak and Ormeling,"Traditionally, the main division of maps is into
topographic and thematic maps. Topographic maps supply a general image of the earth's surface: roads,
rivers, buildings, often the nature of the vegetation, the relief and the names of the various mapped
objects."
•The study or discipline of topography, while interested in relief, is actually a much broader field of study
which takes into account all natural and manmade features of terrain.
Uses
•Topographic maps have multiple uses in the present day: any type of geographic planning or large-
scale architecture; earth sciences and many other geographic disciplines; mining and other earth-based
endeavours; and recreational uses such as hiking or, in particular, orienteering, which uses highly
detailed maps in its standard requirements.
Map conventions •The various features shown on the map are represented by conventional signs or symbols. For example,
colors can be used to indicate a classification of roads. These signs are usually explained in the margin of
the map, or on a separately published characteristic sheet]
•Topographic maps are also commonly called contour maps or topo maps. In the United States, where
the primary national series is organized by a strict 7.5 minute grid, they are often called topo quads or
quadrangles.
•Topographic maps conventionally show topography, or land contours, by means of contour lines.
Contour lines are curves that connect contiguous points of the same altitude (isohypse). In other words,
every point on the marked line of 100 m elevation is 100 m above mean sea level.
•Spacing of contours: close contours indicate a steep slope; distant contours a shallow slope. Two or more
contour lines merging indicates a cliff.
•Of course, to determine differences in elevation between two points, the contour interval, or distance in
altitude between two adjacent contour lines, must be known, and this is given at the bottom of the map.
•These maps usually show not only the contours, but also any significant streams or other bodies
of water, forest cover, built-up areas or individual buildings (depending on scale), and other features and
points of interest.
•Today, topographic maps are prepared using photogrammetric interpretation of aerial photography.
Older topographic maps were prepared using traditional surveying instruments.
•In most cases, contour intervals are consistent throughout a map. Sometimes dashed contour lines are
present; these represent half the noted contour interval.
Understanding Topographical Maps
Understanding of surface depends on the ability to interpret topo maps. They-
•Are based on accurate surveys.
•Show a variety of landforms with carefully chosen symbols & signs.
•Shows natural features like hills, valleys, waterfalls,
•Also show man made features like roads, railways, buildings, bridges and canals.
3
Mr. THOMAS.K.J HASS SAHIBABAD
TOPOSHEETS ARE:-
•Are prepared on a number of sheets since they are large scale maps.
•Each sheet gives the details of a part of the whole area.
•When these joined together, they form a map of the whole area.
INTERPRETATION OF TOPO MAPS AND SURVEY MAPS
IT involves ability to follow the symbols portrayed in the map.
•Understand the information given in pictorial and written form
•Visualize the topography of the original area by interpreting the contour
•Spot heights skillfully
•Map reading is a practical skill.
•Can be developed only by reading topo map very minutely and mentally analyzing the details with the
help of conventional signs & symbols given in their conventional colours'
•As the conventional symbols cannot cover all the graphical details, each topographical map sheet
provides the necessary information in the margin for the users.
1.Identification of topographical maps
2.Reading the Grid reference
3.Scale (R.F.)
4.Representation of Relief by contours
5.Directions
6.Measuring distances and calculating distances
7.Drainage
8.Man-made and natural features
9.Means of transport in relation to relief
10.Land use and irrigation
11.Settlements
12. Inferring occupations
13. Importance of colours and tints in topographical survey sheets
14. Legend
15. Glossary of conventional signs and symbols used in survey maps INFORMATION IN THE MARGINS
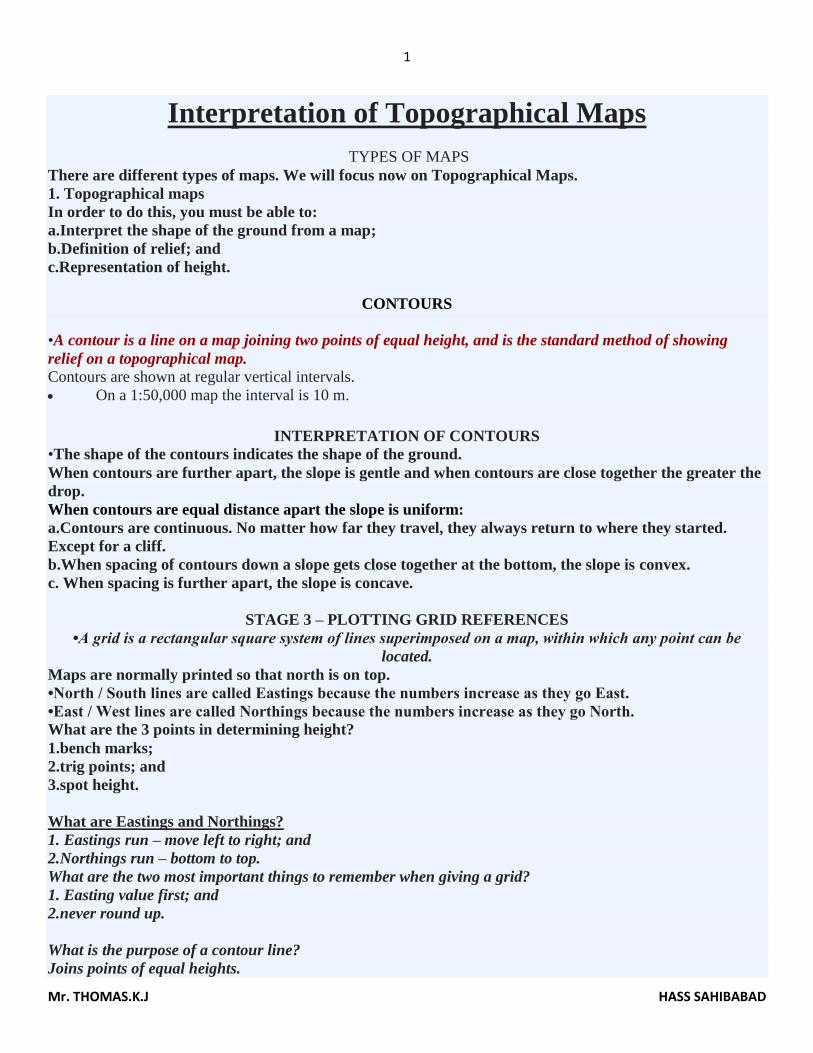
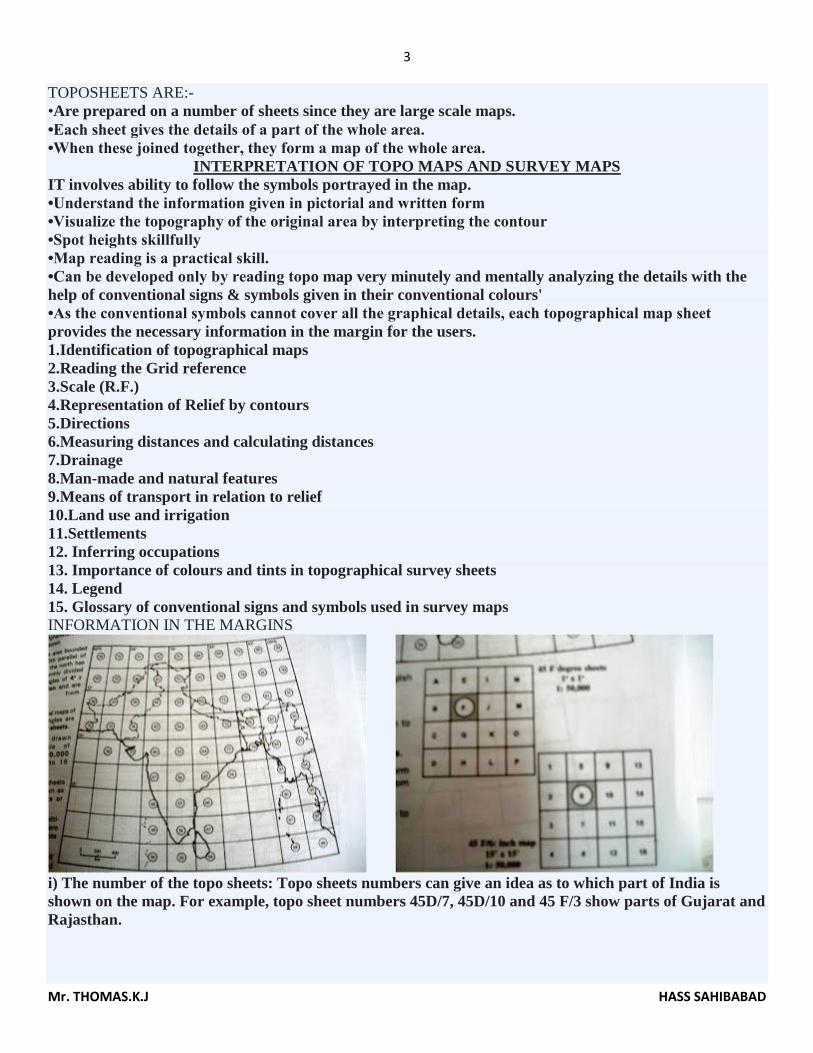
i) The number of the topo sheets: Topo sheets numbers can give an idea as to which part of India is
shown on the map. For example, topo sheet numbers 45D/7, 45D/10 and 45 F/3 show parts of Gujarat and
Rajasthan.
4
Mr. THOMAS.K.J HASS SAHIBABAD
•Knowing the number of toposheet can give us a clue about the general physical relief of the region and
its climate which can be confirmed by other information given in the map.
•Eg- since all toposheets are from India, it may be inferred that all the regions represented by those topo
sheets would have a tropical monsoon climate, with seasonal rainfall.
•Western Rajasthan – u may expect scanty rainfall- a fact which could be verified by the presence of dry
river beds and disappearing streams.
•45D/7 shows a region of northern Gujarat, closer to the border of Rajasthan
•45D/10 lies in the southern part of Rajasthan close to the border of Gujarat region
•45F/3 lies in the western Rajasthan, near Jodhpur
•53B/7 shows a region in Punjab, close to the border of Haryana.
•56D/11 shows a region in north-east Karnataka.
•64P/13 shows a region in north-east Orissa.
ii) Latitudinal and Longitudinal extent: These indicate in which part of the Earth the area is located.
•On a 4 degree topographical map, at least 4 lines of latitude and longitude can be seen. But as the scale
of the topo map increases, the number of latitudes seen on the map decreases.
GRID REFERENCE
•A Grid is a set of lines used to find the exact location of places on a map.
•The National Grid Reference is a system of rectangular co-ordinate.
•The origin of the grid reference lies at a point in the south-west corner of the map.
•Thus any place on the map can be located by starting its distance east or north of the origin of the grid
reference.
•Topo maps bear the national grid of squares drawn to the scale of 2 cm=1km with each square having a
side measuring 1 km.
•These are sheets most commonly used for various purposes and are of vital practical importance.
•Vertical lines=Eastings since they are numbered from west to East
•Horizontal lines = Northings - they are numbered from South to North
•Network of horizontal and vertical lines or the Eastings and Northings, is called the Grid.
5
Mr. THOMAS.K.J HASS SAHIBABAD
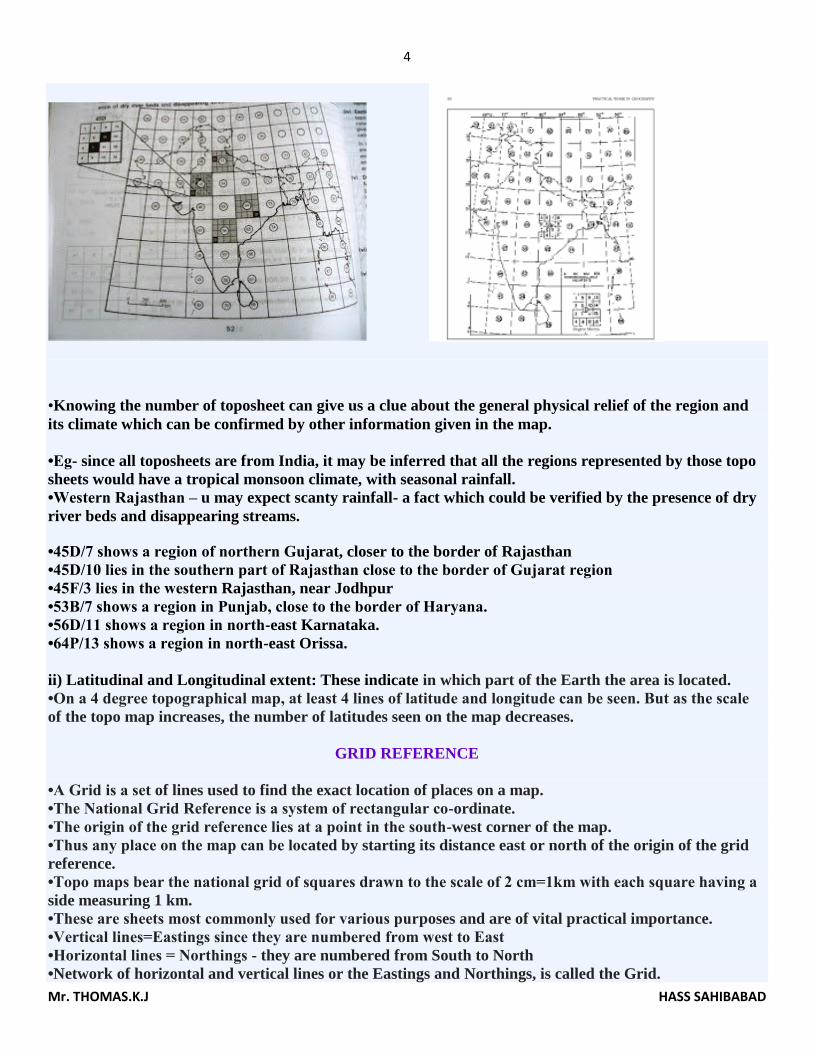
READING THE GRID REFERENCE
i)Origin is the South –West (SW) corner of the map. The reading on the map is always taken with
reference to this origin.
ii) Eastings are always read to the East of the origin.
iii) Northings are always read to the North of the origin.
•It is also identified as the Grid Reference
i) The readings are always taken to the right of the Eastings and to the North of the Northings.
ii)While giving a grid reference, Eastings are always stated first, followed by Northings
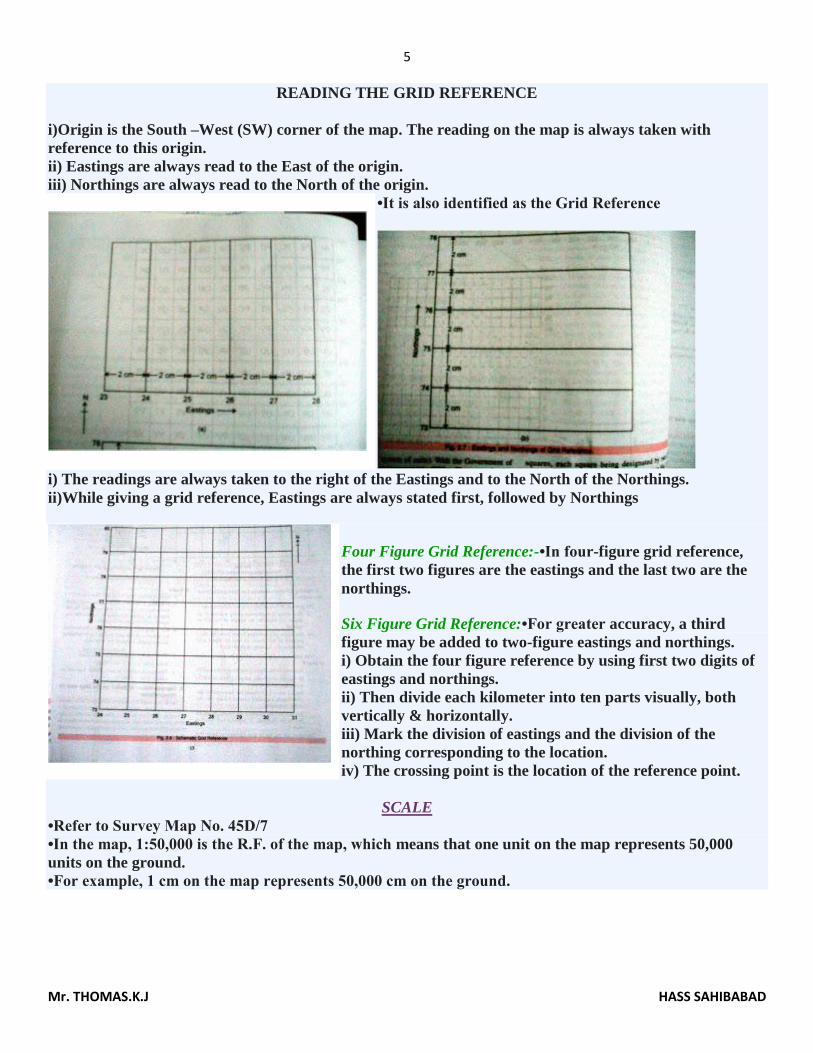
Four Figure Grid Reference:-•In four-figure grid reference,
the first two figures are the eastings and the last two are the
northings.
Six Figure Grid Reference:•For greater accuracy, a third
figure may be added to two-figure eastings and northings.
i) Obtain the four figure reference by using first two digits of
eastings and northings.
ii) Then divide each kilometer into ten parts visually, both
vertically & horizontally.
iii) Mark the division of eastings and the division of the
northing corresponding to the location.
iv) The crossing point is the location of the reference point.
SCALE
•Refer to Survey Map No. 45D/7
•In the map, 1:50,000 is the R.F. of the map, which means that one unit on the map represents 50,000
units on the ground.
•For example, 1 cm on the map represents 50,000 cm on the ground.
6
Mr. THOMAS.K.J HASS SAHIBABAD
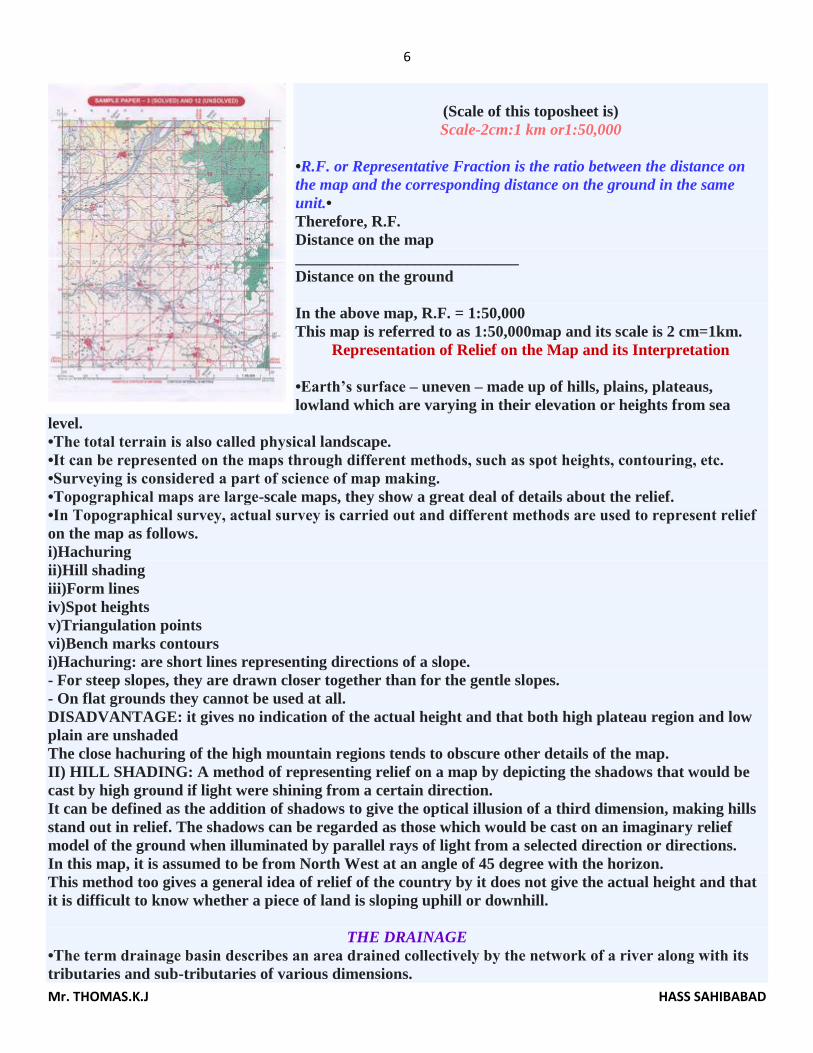
(Scale of this toposheet is)
Scale-2cm:1 km or1:50,000
•R.F. or Representative Fraction is the ratio between the distance on
the map and the corresponding distance on the ground in the same
unit.•
Therefore, R.F.
Distance on the map
____________________________
Distance on the ground
In the above map, R.F. = 1:50,000
This map is referred to as 1:50,000map and its scale is 2 cm=1km.
Representation of Relief on the Map and its Interpretation
•Earth’s surface – uneven – made up of hills, plains, plateaus,
lowland which are varying in their elevation or heights from sea
level.
•The total terrain is also called physical landscape.
•It can be represented on the maps through different methods, such as spot heights, contouring, etc.
•Surveying is considered a part of science of map making.
•Topographical maps are large-scale maps, they show a great deal of details about the relief.
•In Topographical survey, actual survey is carried out and different methods are used to represent relief
on the map as follows.
i)Hachuring
ii)Hill shading
iii)Form lines
iv)Spot heights
v)Triangulation points
vi)Bench marks contours
i)Hachuring: are short lines representing directions of a slope.
- For steep slopes, they are drawn closer together than for the gentle slopes.
- On flat grounds they cannot be used at all.
DISADVANTAGE: it gives no indication of the actual height and that both high plateau region and low
plain are unshaded
The close hachuring of the high mountain regions tends to obscure other details of the map.
II) HILL SHADING: A method of representing relief on a map by depicting the shadows that would be
cast by high ground if light were shining from a certain direction.
It can be defined as the addition of shadows to give the optical illusion of a third dimension, making hills
stand out in relief. The shadows can be regarded as those which would be cast on an imaginary relief
model of the ground when illuminated by parallel rays of light from a selected direction or directions.
In this map, it is assumed to be from North West at an angle of 45 degree with the horizon.
This method too gives a general idea of relief of the country by it does not give the actual height and that
it is difficult to know whether a piece of land is sloping uphill or downhill.
THE DRAINAGE
•The term drainage basin describes an area drained collectively by the network of a river along with its
tributaries and sub-tributaries of various dimensions.
7
Mr. THOMAS.K.J HASS SAHIBABAD
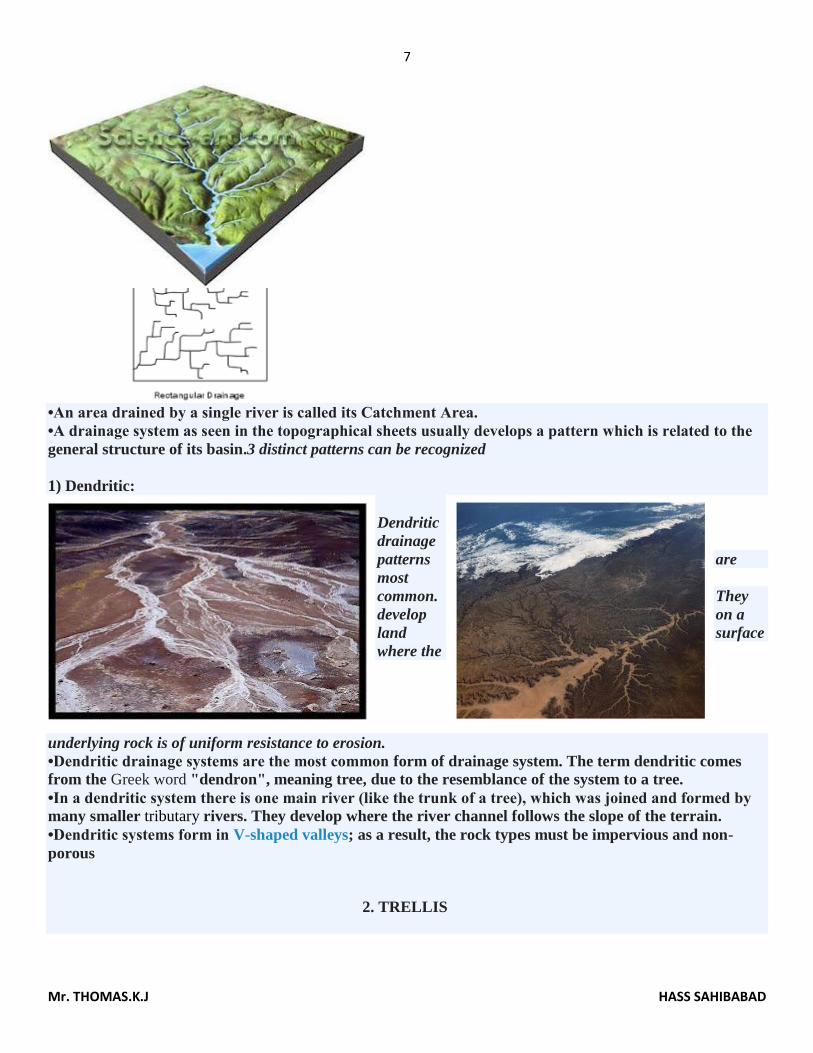
•An area drained by a single river is called its Catchment Area.
•A drainage system as seen in the topographical sheets usually develops a pattern which is related to the
general structure of its basin.3 distinct patterns can be recognized
1) Dendritic:
Dendritic
drainage
patterns are
most
common. They
develop on a
land surface
where the
underlying rock is of uniform resistance to erosion.
•Dendritic drainage systems are the most common form of drainage system. The term dendritic comes
from the Greek word "dendron", meaning tree, due to the resemblance of the system to a tree.
•In a dendritic system there is one main river (like the trunk of a tree), which was joined and formed by
many smaller tributary rivers. They develop where the river channel follows the slope of the terrain.
•Dendritic systems form in V-shaped valleys; as a result, the rock types must be impervious and non-
porous
2. TRELLIS
8
Mr. THOMAS.K.J HASS SAHIBABAD
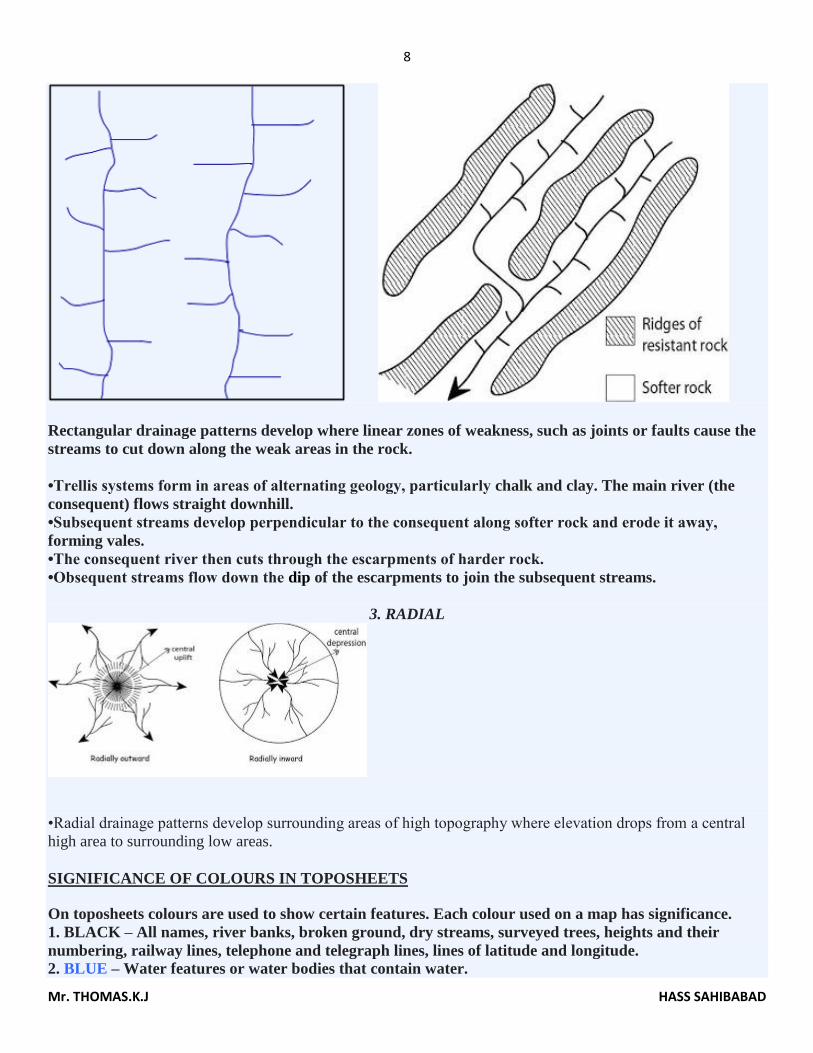
Rectangular drainage patterns develop where linear zones of weakness, such as joints or faults cause the
streams to cut down along the weak areas in the rock.
•Trellis systems form in areas of alternating geology, particularly chalk and clay. The main river (the
consequent) flows straight downhill.
•Subsequent streams develop perpendicular to the consequent along softer rock and erode it away,
forming vales.
•The consequent river then cuts through the escarpments of harder rock.
•Obsequent streams flow down the dip of the escarpments to join the subsequent streams.
3. RADIAL
•Radial drainage patterns develop surrounding areas of high topography where elevation drops from a central
high area to surrounding low areas.
SIGNIFICANCE OF COLOURS IN TOPOSHEETS
On toposheets colours are used to show certain features. Each colour used on a map has significance.
1. BLACK – All names, river banks, broken ground, dry streams, surveyed trees, heights and their
numbering, railway lines, telephone and telegraph lines, lines of latitude and longitude. 2. BLUE – Water features or water bodies that contain water.
9
Mr. THOMAS.K.J HASS SAHIBABAD
3. GREEN – All wooded and forested areas, orchards, scattered trees and scrubs.
Note: - Prominent surveyed trees are shown in black. Surveyed trees have numbers on their trunks. They
serve as landmarks and are not allowed to be cut.
4. YELLOW – All cultivated areas are shown with a yellow wash.
5. WHITE PATCHES – Uncultivable land
6. BROWN – Contour lines, their numbering, form lines, and sand features such as sand hills and dunes.
7. RED – Grid lines (eastings and northings) and their numbering, roads, cart tracks, settlements, huts
and buildings.
SETTLEMENTS 1. On a topo map, all settlements are shown by symbols in RED colour.
2. The size of the symbol and size and style of letters used give an idea of the size of the settlement.
3. In the case of large cities, major roads are marked and named.
4. Deserted village cities, temporarily occupied huts are also shown.
5. Places of worship, forts, water towers, burial grounds, police stations, post office, dak bungalow,
circuit houses, etc. are indicated by suitable symbols.
NOTE – Site is the land on which the settlement (village or town) is built.
Dense settlements: Fertile plains and wide river valleys.
· Sparse Settlements: forests, deserts, mountain slopes, plateaus and hill tops with poor vegetation·
Absence of Settlements: Swamps, marsh land, sandy deserts, thick impenetrable forests, flood-prone
areas, steep mountain slopes.
OCCUPATION AND MAP FEATURES
AGRICULTURE – Level land with yellow wash; many wells
LUMBERING: Forests
CATTLE REARING – Pastures, meadows, grasslands, presence of road in highland region (sheep)
FISHING – Plenty of rivers
MINING –Stony wastes, quarries, limestone beds
TRADE – Dense settlements near road
INDUSTRY – Large settlements near roads and railways, presence of raw materials, (like making,
cement industry near limestone beds)
TOURISM – hotels and inns
APPROXIMATE OR RELATIVE HEIGHT-is height is not taken from sea level but with respect to the
surrounding area. It may be the height of a dam, bridge, sand dune or it can be the depth of a well, tank,
hill or river canal, for example, 3r, 5r, 8r, etc.
EXAMPLE: 3r - the relative depth of perennial lined well in 3 meters
●5r – the relative height of dry tank is 5 meters
NOTE: CHECK THE SYMBOL – if it is tank, dam, bridge, embankment, etc. then write the answer this
way - the relative height of .............................. is ................meters.
Some Common Questions Based On Toposheets
If you get these questions, look for these points in the toposheets and can write these answers:
1.Mention any two features seen in the map extract which indicate the region has seasonal rainfall.
Seasonal streams/ Broken ground/open scrub/seasonal tank/cart track motorable in dry season/narrow
perennial channel in the dry bed of the river(after looking for these features, select any two features that
you find on the topo sheet and write this way)
Ans: Open scrub and seasonal streams are two features in the map that indicate the region has seasonal
10
Mr. THOMAS.K.J HASS SAHIBABAD
rainfall.
Rivers, streams and ponds/tanks are dry in nature.
Barren land shown in white colour also indicate that the region has seasonal rainfall.
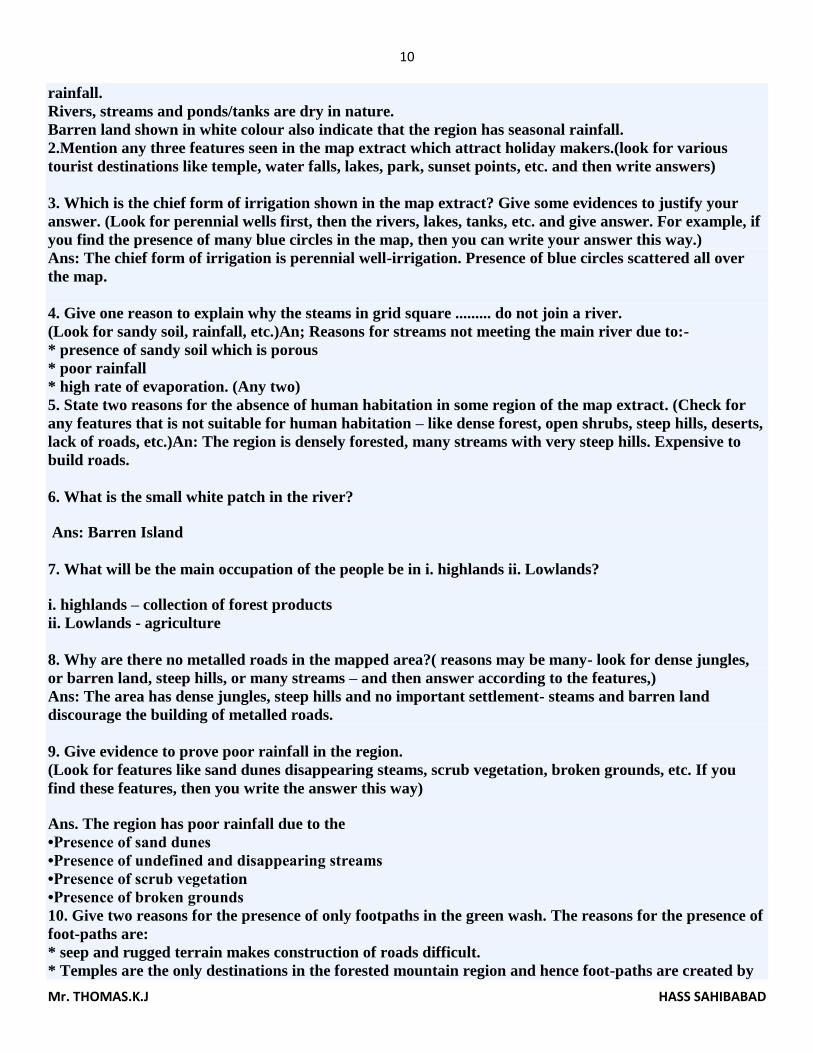
2.Mention any three features seen in the map extract which attract holiday makers.(look for various
tourist destinations like temple, water falls, lakes, park, sunset points, etc. and then write answers)
3. Which is the chief form of irrigation shown in the map extract? Give some evidences to justify your
answer. (Look for perennial wells first, then the rivers, lakes, tanks, etc. and give answer. For example, if
you find the presence of many blue circles in the map, then you can write your answer this way.)
Ans: The chief form of irrigation is perennial well-irrigation. Presence of blue circles scattered all over
the map.
4. Give one reason to explain why the steams in grid square ......... do not join a river.
(Look for sandy soil, rainfall, etc.)An; Reasons for streams not meeting the main river due to:-
* presence of sandy soil which is porous
* poor rainfall
* high rate of evaporation. (Any two)
5. State two reasons for the absence of human habitation in some region of the map extract. (Check for
any features that is not suitable for human habitation – like dense forest, open shrubs, steep hills, deserts,
lack of roads, etc.)An: The region is densely forested, many streams with very steep hills. Expensive to
build roads.
6. What is the small white patch in the river?
Ans: Barren Island
7. What will be the main occupation of the people be in i. highlands ii. Lowlands?
i. highlands – collection of forest products
ii. Lowlands - agriculture
8. Why are there no metalled roads in the mapped area?( reasons may be many- look for dense jungles,
or barren land, steep hills, or many streams – and then answer according to the features,)
Ans: The area has dense jungles, steep hills and no important settlement- steams and barren land
discourage the building of metalled roads.
9. Give evidence to prove poor rainfall in the region.
(Look for features like sand dunes disappearing steams, scrub vegetation, broken grounds, etc. If you
find these features, then you write the answer this way)
Ans. The region has poor rainfall due to the
•Presence of sand dunes
•Presence of undefined and disappearing streams
•Presence of scrub vegetation
•Presence of broken grounds
10. Give two reasons for the presence of only footpaths in the green wash. The reasons for the presence of
foot-paths are:
* seep and rugged terrain makes construction of roads difficult.
* Temples are the only destinations in the forested mountain region and hence foot-paths are created by
11
Mr. THOMAS.K.J HASS SAHIBABAD
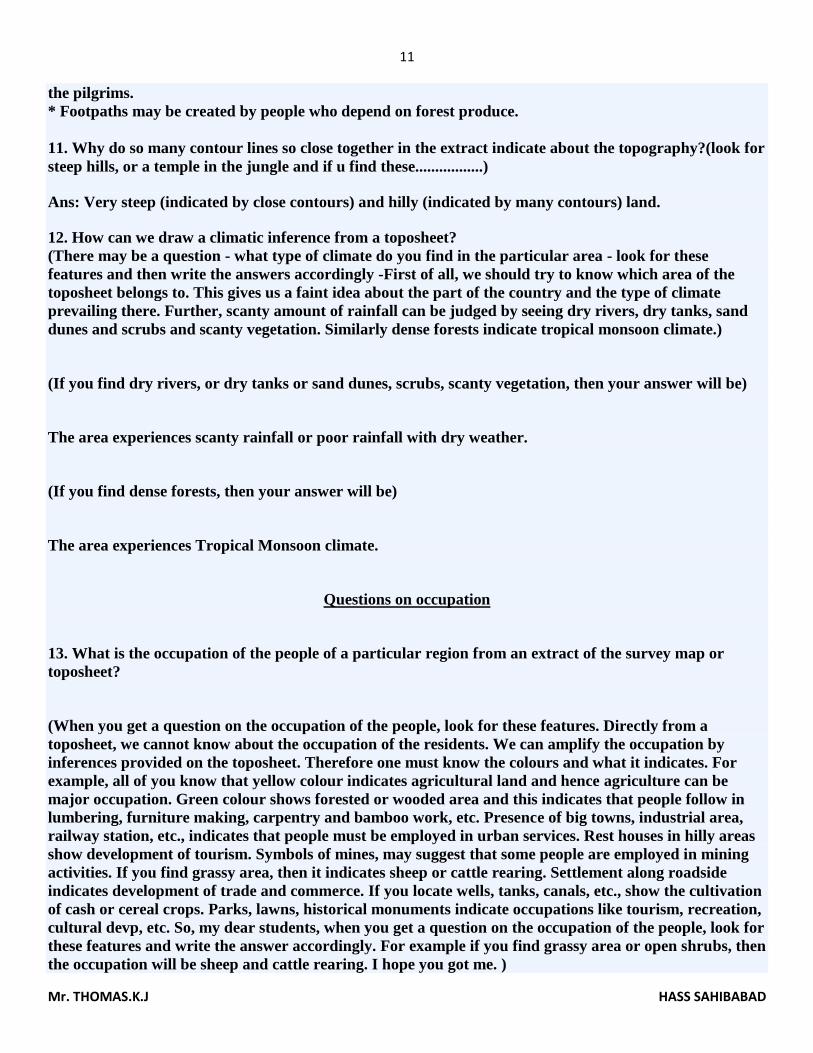
the pilgrims.
* Footpaths may be created by people who depend on forest produce.
11. Why do so many contour lines so close together in the extract indicate about the topography?(look for
steep hills, or a temple in the jungle and if u find these.................)
Ans: Very steep (indicated by close contours) and hilly (indicated by many contours) land.
12. How can we draw a climatic inference from a toposheet?
(There may be a question - what type of climate do you find in the particular area - look for these
features and then write the answers accordingly -First of all, we should try to know which area of the
toposheet belongs to. This gives us a faint idea about the part of the country and the type of climate
prevailing there. Further, scanty amount of rainfall can be judged by seeing dry rivers, dry tanks, sand
dunes and scrubs and scanty vegetation. Similarly dense forests indicate tropical monsoon climate.)
(If you find dry rivers, or dry tanks or sand dunes, scrubs, scanty vegetation, then your answer will be)
The area experiences scanty rainfall or poor rainfall with dry weather.
(If you find dense forests, then your answer will be)
The area experiences Tropical Monsoon climate.
Questions on occupation
13. What is the occupation of the people of a particular region from an extract of the survey map or
toposheet?
(When you get a question on the occupation of the people, look for these features. Directly from a
toposheet, we cannot know about the occupation of the residents. We can amplify the occupation by
inferences provided on the toposheet. Therefore one must know the colours and what it indicates. For
example, all of you know that yellow colour indicates agricultural land and hence agriculture can be
major occupation. Green colour shows forested or wooded area and this indicates that people follow in
lumbering, furniture making, carpentry and bamboo work, etc. Presence of big towns, industrial area,
railway station, etc., indicates that people must be employed in urban services. Rest houses in hilly areas
show development of tourism. Symbols of mines, may suggest that some people are employed in mining
activities. If you find grassy area, then it indicates sheep or cattle rearing. Settlement along roadside
indicates development of trade and commerce. If you locate wells, tanks, canals, etc., show the cultivation
of cash or cereal crops. Parks, lawns, historical monuments indicate occupations like tourism, recreation,
cultural devp, etc. So, my dear students, when you get a question on the occupation of the people, look for
these features and write the answer accordingly. For example if you find grassy area or open shrubs, then
the occupation will be sheep and cattle rearing. I hope you got me. )
12
Mr. THOMAS.K.J HASS SAHIBABAD
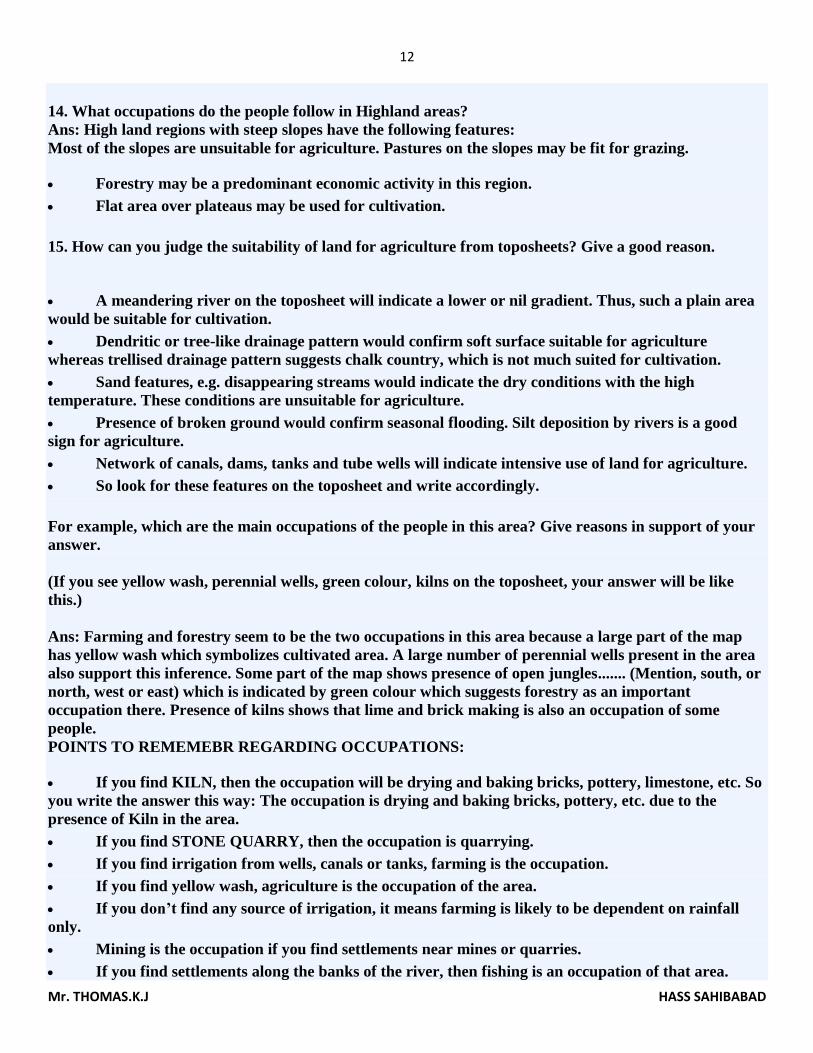
14. What occupations do the people follow in Highland areas?
Ans: High land regions with steep slopes have the following features:
Most of the slopes are unsuitable for agriculture. Pastures on the slopes may be fit for grazing.
Forestry may be a predominant economic activity in this region.
Flat area over plateaus may be used for cultivation.
15. How can you judge the suitability of land for agriculture from toposheets? Give a good reason.
A meandering river on the toposheet will indicate a lower or nil gradient. Thus, such a plain area
would be suitable for cultivation.
Dendritic or tree-like drainage pattern would confirm soft surface suitable for agriculture
whereas trellised drainage pattern suggests chalk country, which is not much suited for cultivation.
Sand features, e.g. disappearing streams would indicate the dry conditions with the high
temperature. These conditions are unsuitable for agriculture.
Presence of broken ground would confirm seasonal flooding. Silt deposition by rivers is a good
sign for agriculture.
Network of canals, dams, tanks and tube wells will indicate intensive use of land for agriculture.
So look for these features on the toposheet and write accordingly.
For example, which are the main occupations of the people in this area? Give reasons in support of your
answer.
(If you see yellow wash, perennial wells, green colour, kilns on the toposheet, your answer will be like
this.)
Ans: Farming and forestry seem to be the two occupations in this area because a large part of the map
has yellow wash which symbolizes cultivated area. A large number of perennial wells present in the area
also support this inference. Some part of the map shows presence of open jungles....... (Mention, south, or
north, west or east) which is indicated by green colour which suggests forestry as an important
occupation there. Presence of kilns shows that lime and brick making is also an occupation of some
people.
POINTS TO REMEMEBR REGARDING OCCUPATIONS:
If you find KILN, then the occupation will be drying and baking bricks, pottery, limestone, etc. So
you write the answer this way: The occupation is drying and baking bricks, pottery, etc. due to the
presence of Kiln in the area.
If you find STONE QUARRY, then the occupation is quarrying.
If you find irrigation from wells, canals or tanks, farming is the occupation.
If you find yellow wash, agriculture is the occupation of the area.
If you don’t find any source of irrigation, it means farming is likely to be dependent on rainfall
only.
Mining is the occupation if you find settlements near mines or quarries.
If you find settlements along the banks of the river, then fishing is an occupation of that area.
13
Mr. THOMAS.K.J HASS SAHIBABAD
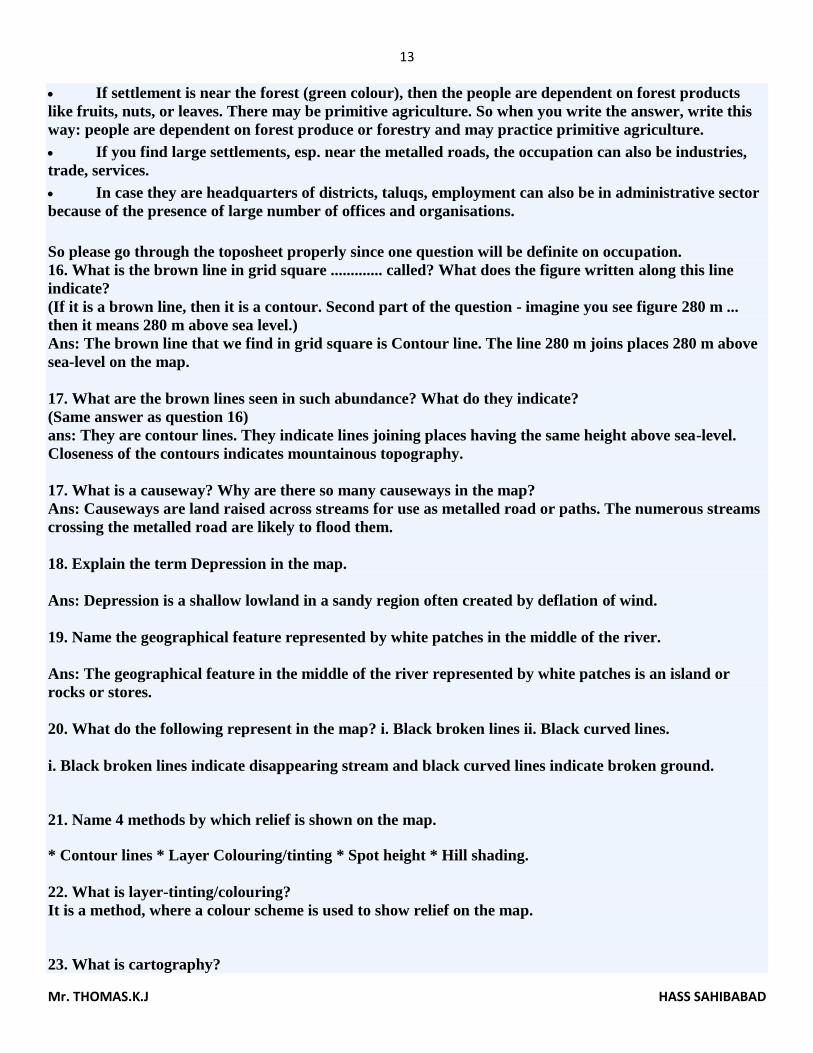
If settlement is near the forest (green colour), then the people are dependent on forest products
like fruits, nuts, or leaves. There may be primitive agriculture. So when you write the answer, write this
way: people are dependent on forest produce or forestry and may practice primitive agriculture.
If you find large settlements, esp. near the metalled roads, the occupation can also be industries,
trade, services.
In case they are headquarters of districts, taluqs, employment can also be in administrative sector
because of the presence of large number of offices and organisations.
So please go through the toposheet properly since one question will be definite on occupation.
16. What is the brown line in grid square ............. called? What does the figure written along this line
indicate?
(If it is a brown line, then it is a contour. Second part of the question - imagine you see figure 280 m ...
then it means 280 m above sea level.)
Ans: The brown line that we find in grid square is Contour line. The line 280 m joins places 280 m above
sea-level on the map.
17. What are the brown lines seen in such abundance? What do they indicate?
(Same answer as question 16)
ans: They are contour lines. They indicate lines joining places having the same height above sea-level.
Closeness of the contours indicates mountainous topography.
17. What is a causeway? Why are there so many causeways in the map?
Ans: Causeways are land raised across streams for use as metalled road or paths. The numerous streams
crossing the metalled road are likely to flood them.
18. Explain the term Depression in the map.
Ans: Depression is a shallow lowland in a sandy region often created by deflation of wind.
19. Name the geographical feature represented by white patches in the middle of the river.
Ans: The geographical feature in the middle of the river represented by white patches is an island or
rocks or stores.
20. What do the following represent in the map? i. Black broken lines ii. Black curved lines.
i. Black broken lines indicate disappearing stream and black curved lines indicate broken ground.
21. Name 4 methods by which relief is shown on the map.
* Contour lines * Layer Colouring/tinting * Spot height * Hill shading.
22. What is layer-tinting/colouring?
It is a method, where a colour scheme is used to show relief on the map.
23. What is cartography?
14
Mr. THOMAS.K.J HASS SAHIBABAD
Cartography is an art and science of drawing maps, diagrams and charts.
POINTS TO REMEMBER:
RELATIVE HEIGHT OR APPROXIMATE HEIGHT: REMEMBER:-This height is not taken from the
sea level but with respect to the surrounding area. It may be height of a dam, bridge, sand dune, or it can
be depth of a well, tank, hill, or river canal, for example 2r, 3r, 5r, 6r, etc.
Example:
●3r the relative depth of the perennial lined well is 3 meters. (If 3r is written near the symbol of perennial
well. don't write height but the depth)
5r the relative height of dry tank is 5 meters (if 5r is written near the dry tank symbol)
16r the relative height of sand dune is 16 meters. (If 16r is written near the symbol of sand dunes)
8r the relative height of river bank is 8 meters (if 8r is written near the river bank)
PLEASE NOTE: you must write the word RELATIVE HEIGHT/DEPTH of............................
COLOURS:
7 COLOURS are used on toposheets:
i. BLACK: Names, lines of latitudes and longitudes, broken grounds, river banks, dry rivers, surveyed
trees, heights and their numbering, railway mines, telephone, telepgraph lines
ii. RED: Grid lines (eastings and northings) , their numbering, roads, cart tracks, settlements, huts and
other buildings.
iii. GREEN: Forested and wooded areas, scrubs, scattered trees, orchards
iv. BLUE: Water bodies containing water like wells, rivers, etc
v. YELLOW: cultivated areas
vi. BROWN: Contour lines, their numbering, form lines, all sand features like sand dunes, sand hills,
stony waste
vii. WHITE PATCHES: uncultivated and barren lands
DIRECTIONS
Directions are important for physical as well as urban features. The physical features involve the
directions of rivers, streams, and the urban cities from one another.
When a question is asked regarding the banks of the river or direction of the river, the following steps
should be observed.
First of all, look at the spot heights to determine the slope of the land. As you know, spot heights
are marked this way ●265 ●289
See which spot heights are higher and where it is lower, and then you will know which way or
direction it slopes. The slope of the land may be from north east to south west. And if you see a river, then
it flows from north-east to south-west.
15
Mr. THOMAS.K.J HASS SAHIBABAD
To know on which side or bank of the river a place is situated (a place may be a temple,
settlement, town, etc.)one has to locate the source of the river. Having located the direction of the river,
imagine yourself standing at the source of the river f acing the main river. To your right is right bank
and to your left is left bank.
When a question is ascend on directions with reference to urban cites/settlements, remember these points.
Sometimes the questions are asked on the direction of a city or settlement with a reference to the
other. First of all, pay attention to the words 'FROM' a place and 'TO' a place. Imagine yourself standing
on the 'FROM' PLACE and look at the TO PLACE. Use the direction arrow and write the direction.
FEW IMPORTANT TERMS:
A. Layer Tinting: Layer tinting is a method of showing relief by color. A different color is used for each
band of elevation. Each shade of color, or band, represents a definite elevation range. A legend is printed
on the map margin to indicate the elevation range represented by each color. However, this method does
not allow the map user to determine the exact elevation of a specific point—only the range.
b. Form Lines. Form lines are not measured from any datum plane. Form lines have no standard
elevation and give only a general idea of relief. Form lines are represented on a map as dashed lines and
are never labeled with representative elevations.
c. Shaded Relief. Relief shading indicates relief by a shadow effect achieved by tone and color that results
in the darkening of one side of terrain features, such as hills and ridges. The darker the shading, the
steeper the slope. Shaded relief is sometimes used in conjunction with contour lines to emphasize these
features.
d. Hachures. Hachures are short, broken lines used to show relief. Hachures are sometimes used with
contour lines. They do not represent exact elevations, but are mainly used to show large, rocky outcrop
areas. Hachures are used extensively on small-scale maps to show mountain ranges, plateaus, and
mountain peaks.
e. Contour Lines. Contour lines are the most common method of showing relief and elevation on a
standard topographic map. A contour line represents an imaginary line on the ground, above or below
sea level. All points on the contour line are at the same elevation. The elevation represented by contour
lines is the vertical distance above or below sea level.
16
Mr. THOMAS.K.J HASS SAHIBABAD
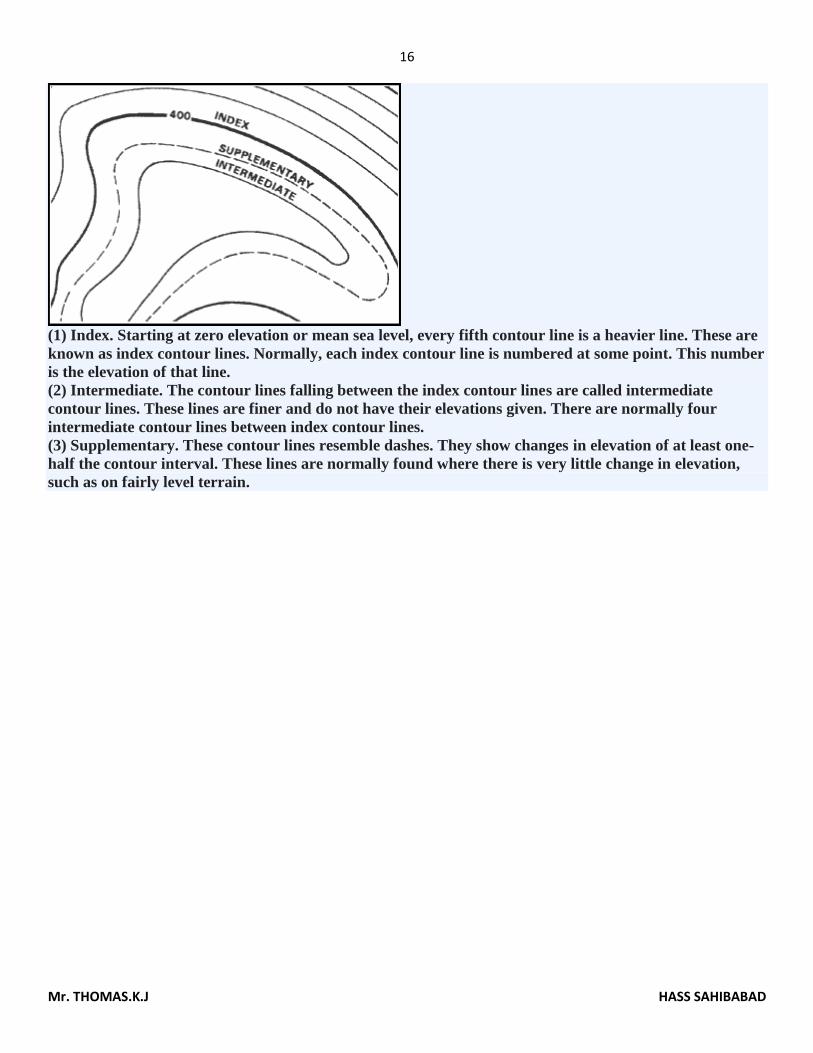
(1) Index. Starting at zero elevation or mean sea level, every fifth contour line is a heavier line. These are
known as index contour lines. Normally, each index contour line is numbered at some point. This number
is the elevation of that line.
(2) Intermediate. The contour lines falling between the index contour lines are called intermediate
contour lines. These lines are finer and do not have their elevations given. There are normally four
intermediate contour lines between index contour lines.
(3) Supplementary. These contour lines resemble dashes. They show changes in elevation of at least one-
half the contour interval. These lines are normally found where there is very little change in elevation,
such as on fairly level terrain.