Embed Size (px)
Citation preview
8/13/2019 Interpretation of Humphrey
http://slidepdf.com/reader/full/interpretation-of-humphrey 1/42
Traquair difined the visual field as the “island of vision
surrounded by the sea of darkness”
• Axis X, Y(parallel to the
sea level)
• Axis Z
(perpendicular
to the sea level)

8/13/2019 Interpretation of Humphrey
http://slidepdf.com/reader/full/interpretation-of-humphrey 2/42
•
The visualfield is
measured in
two ways• Kinetic and
Static
perimetry

8/13/2019 Interpretation of Humphrey
http://slidepdf.com/reader/full/interpretation-of-humphrey 3/42
The visual field is plotted as the
patient sees it
8/13/2019 Interpretation of Humphrey
http://slidepdf.com/reader/full/interpretation-of-humphrey 4/42
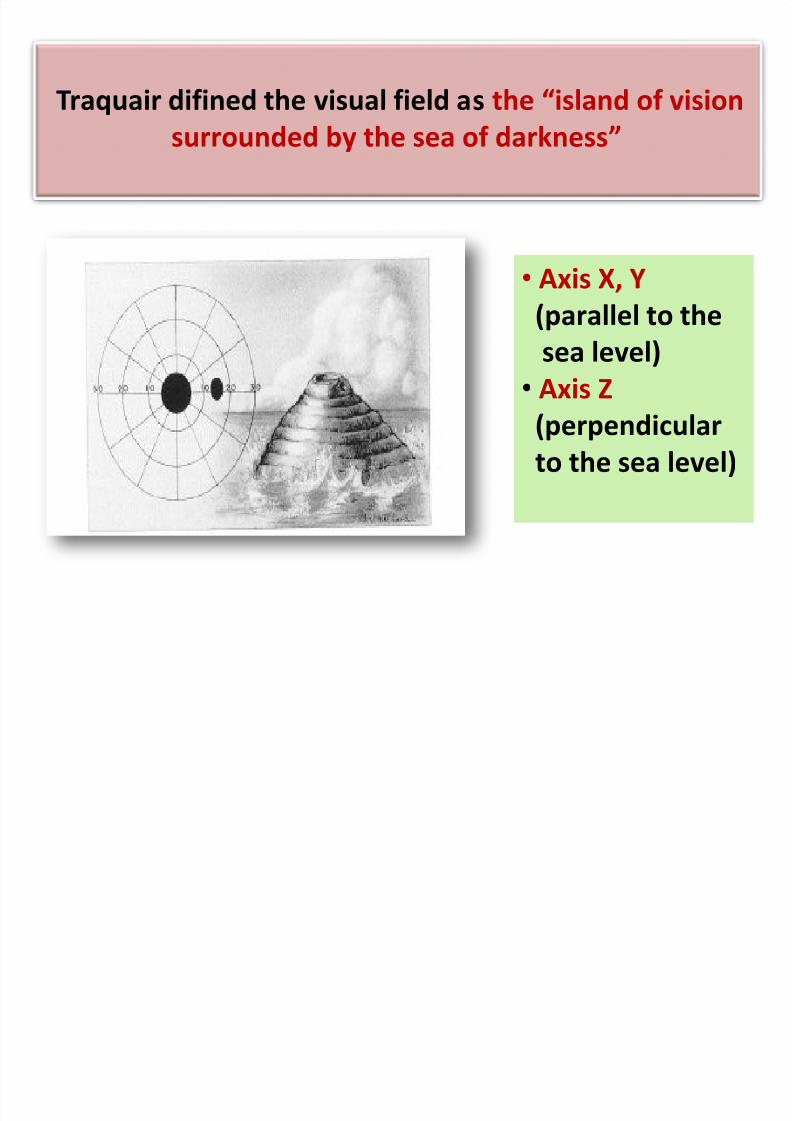
Units of light intensity
• The light intensity expressed in
apostilb (asb) or decibel (dB) units• Retinal sensitivity expressed in
decibel
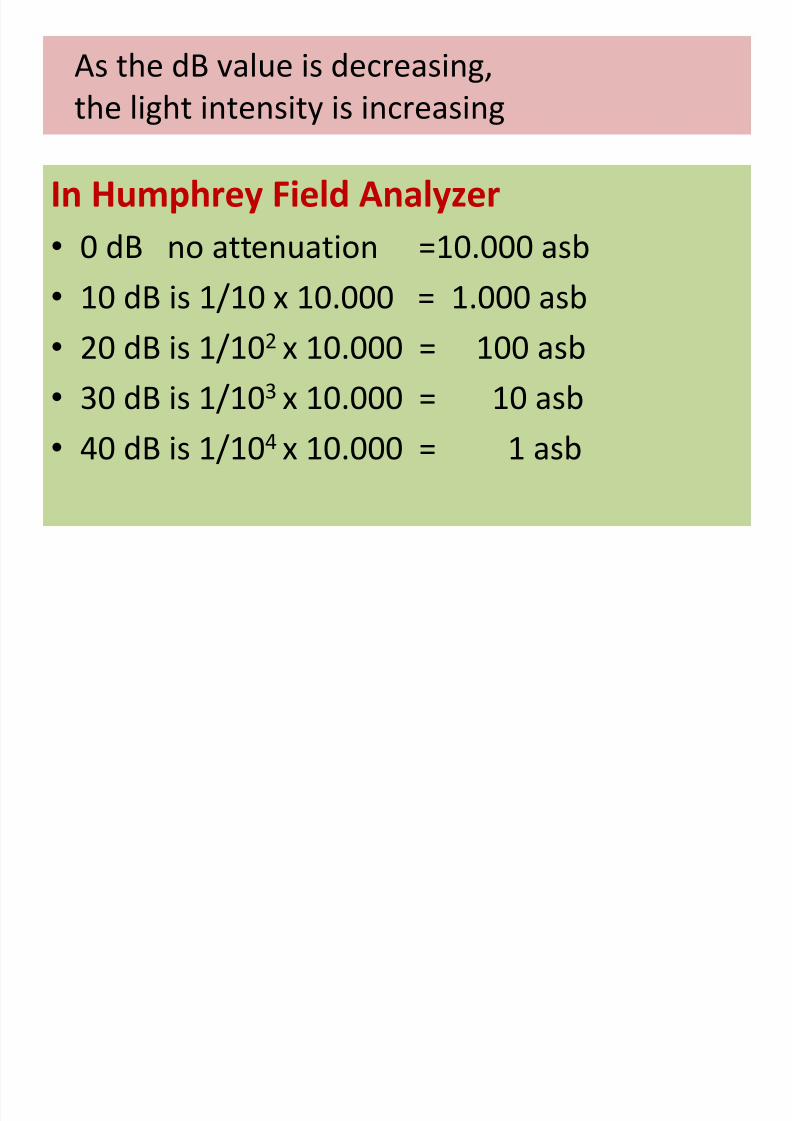
• As the dB value is decreasing,the light intensity is increasing
8/13/2019 Interpretation of Humphrey
http://slidepdf.com/reader/full/interpretation-of-humphrey 5/42
As the dB value is decreasing,
the light intensity is increasing
In Humphrey Field Analyzer
• 0 dB no attenuation =10.000 asb
• 10 dB is 1/10 x 10.000 = 1.000 asb
• 20 dB is 1/102 x 10.000 = 100 asb
•
30 dB is 1/10
3
x 10.000 = 10 asb• 40 dB is 1/104 x 10.000 = 1 asb

8/13/2019 Interpretation of Humphrey
http://slidepdf.com/reader/full/interpretation-of-humphrey 6/42

8/13/2019 Interpretation of Humphrey
http://slidepdf.com/reader/full/interpretation-of-humphrey 7/42

8/13/2019 Interpretation of Humphrey
http://slidepdf.com/reader/full/interpretation-of-humphrey 8/42
Definition of threshold
•
Threshold sensitivity is defined as thestimulus intensity at which the patient
respond 50% of the time

8/13/2019 Interpretation of Humphrey
http://slidepdf.com/reader/full/interpretation-of-humphrey 9/42
2
24
4
Humphrey Visual Field Analyzer

8/13/2019 Interpretation of Humphrey
http://slidepdf.com/reader/full/interpretation-of-humphrey 10/42

8/13/2019 Interpretation of Humphrey
http://slidepdf.com/reader/full/interpretation-of-humphrey 11/42
ANALYSIS OF VISUAL FIELD DATA
To understand and interpret the single
field printout it is divided in 8 zones
• Zone 1 : Patient and test data
•
Zone 2 : Reliability indices and foveal treshold• Zone 3 : Raw data
• Zone 4 : Gray scale
• Zone 5 : Total deviation plot
• Zone 6 : Pattern deviation plot• Zone 7 : Global indices
• Zone 8 : Glaucoma hemi field test (GHT)(Gupta AK,et al,2007)
8/13/2019 Interpretation of Humphrey
http://slidepdf.com/reader/full/interpretation-of-humphrey 12/42
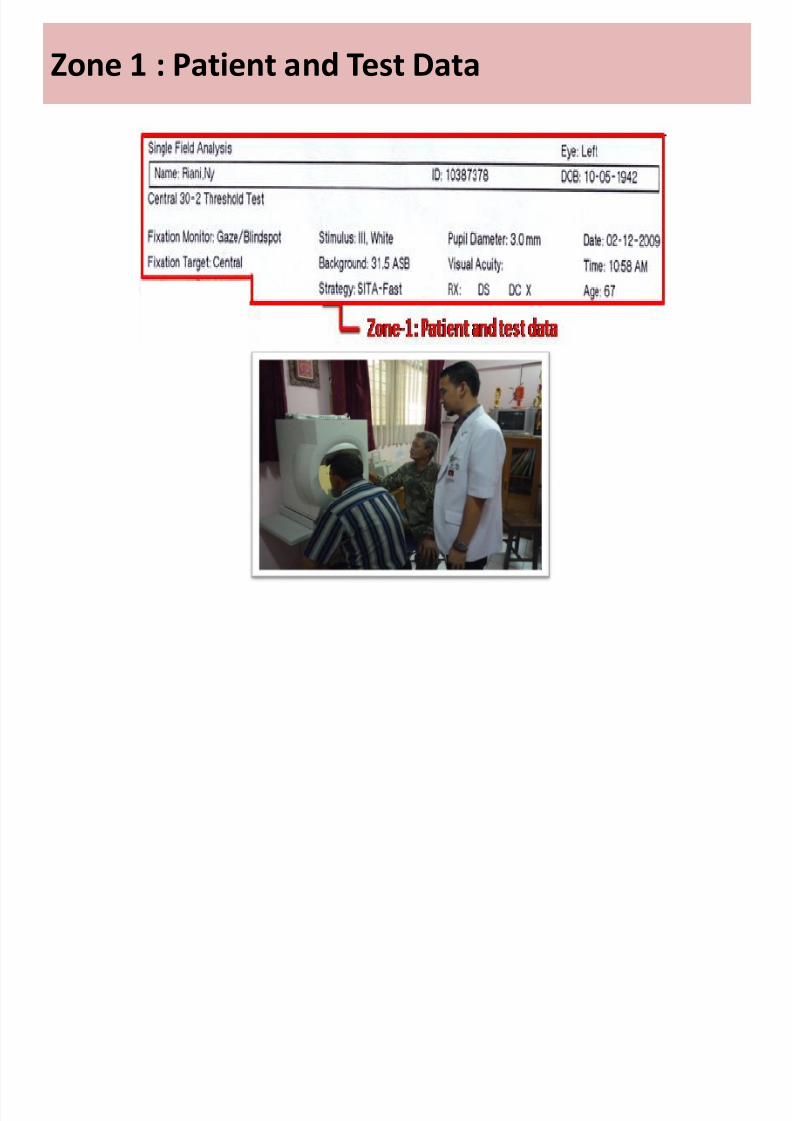
Zone 1 : Patient and Test Data

8/13/2019 Interpretation of Humphrey
http://slidepdf.com/reader/full/interpretation-of-humphrey 13/42
Zone 1 : Patient and Test Data
•
Patient name and identity number• Age and date of birth
– Wrong patients’ age can alter results of field test
•
Eye tested• Visual acuity and refractive correction used
• Pupillary size
– Pupillary size should remain constant in follow upfields

8/13/2019 Interpretation of Humphrey
http://slidepdf.com/reader/full/interpretation-of-humphrey 14/42
The test data has the following information
• Test pattern and strategy performed.
• Fixation monitor (Blind spot) *
• Stimulus size : Goldmann size III• Background illumination : It is a constant at 31.5
asb. *
•Color of the stimulus : White *
• Fixation target
8/13/2019 Interpretation of Humphrey
http://slidepdf.com/reader/full/interpretation-of-humphrey 15/42
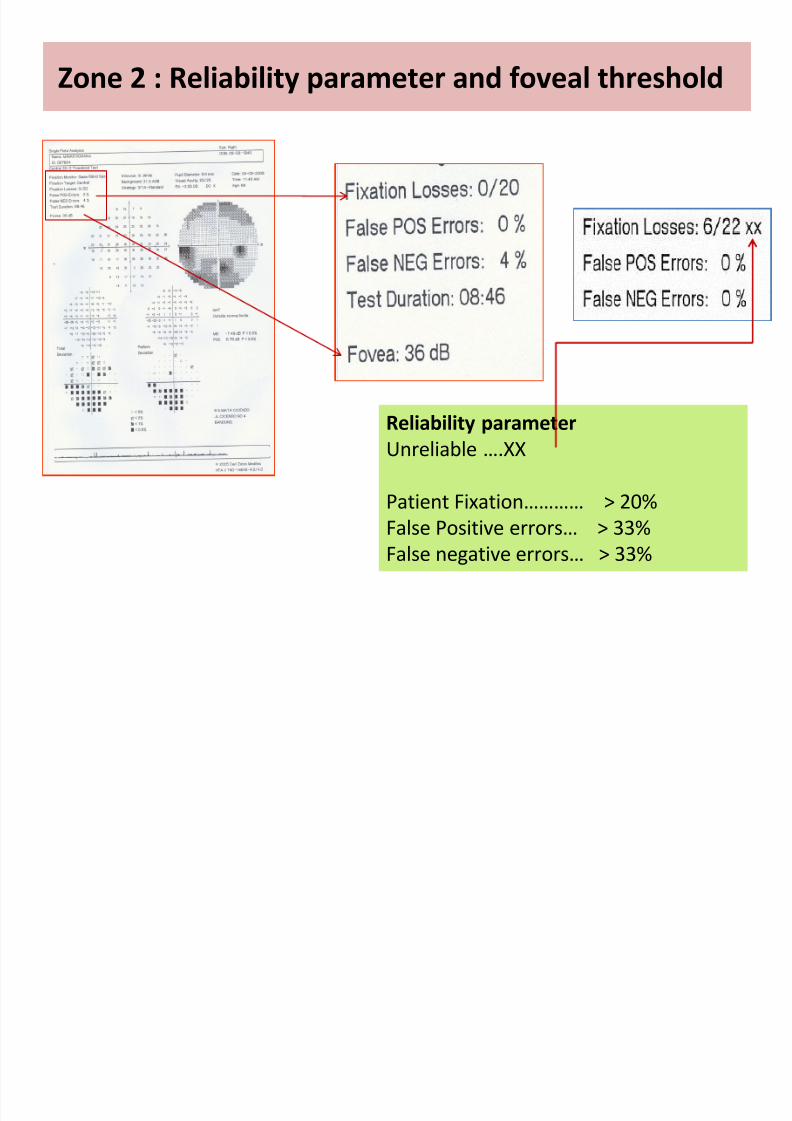
Zone 2 : Reliability parameter and foveal threshold
Reliability parameter
Unreliable ….XX
Patient Fixation………… > 20%
False Positive errors… > 33%
False negative errors… > 33%

8/13/2019 Interpretation of Humphrey
http://slidepdf.com/reader/full/interpretation-of-humphrey 16/42
Zone 2 : Reliability parameter and foveal threshold
False positive > 33%gray scale : white scotomaGHT : abnormaly high sensitivity
False negative >33%lack of attentive, fatique, advance damage
Low patient reliability does not necessarilymean lack useful information
It is just that such field are not included in thedatabase, such field must be interpreted withmore caution.

8/13/2019 Interpretation of Humphrey
http://slidepdf.com/reader/full/interpretation-of-humphrey 17/42
Zone 3: Raw data
• Actual threshold value
• Even if all zones are
normal, but the
clinical picture are
very suspicious,
inspect zone 8.
•
One may pick up ascotoma

8/13/2019 Interpretation of Humphrey
http://slidepdf.com/reader/full/interpretation-of-humphrey 18/42
Zone 4: Gray scale
• Conversion of the raw datato gray tone symbols
• Do not make any diagnosis
on the basis of gray scale
• It give an impression anddraw attention to an area
• Useful to explain thecondition to the patient

8/13/2019 Interpretation of Humphrey
http://slidepdf.com/reader/full/interpretation-of-humphrey 19/42
Useful when there areGross False positive (white scotoma)
False negative error (clover leaf)
Explain the seriousness of the condition to the patient
Zone 4: Gray scale

8/13/2019 Interpretation of Humphrey
http://slidepdf.com/reader/full/interpretation-of-humphrey 20/42
Paracentral
Scotoma
Arcuate
Scotoma
Nasal StepTemporal
Wedge
8/13/2019 Interpretation of Humphrey
http://slidepdf.com/reader/full/interpretation-of-humphrey 21/42
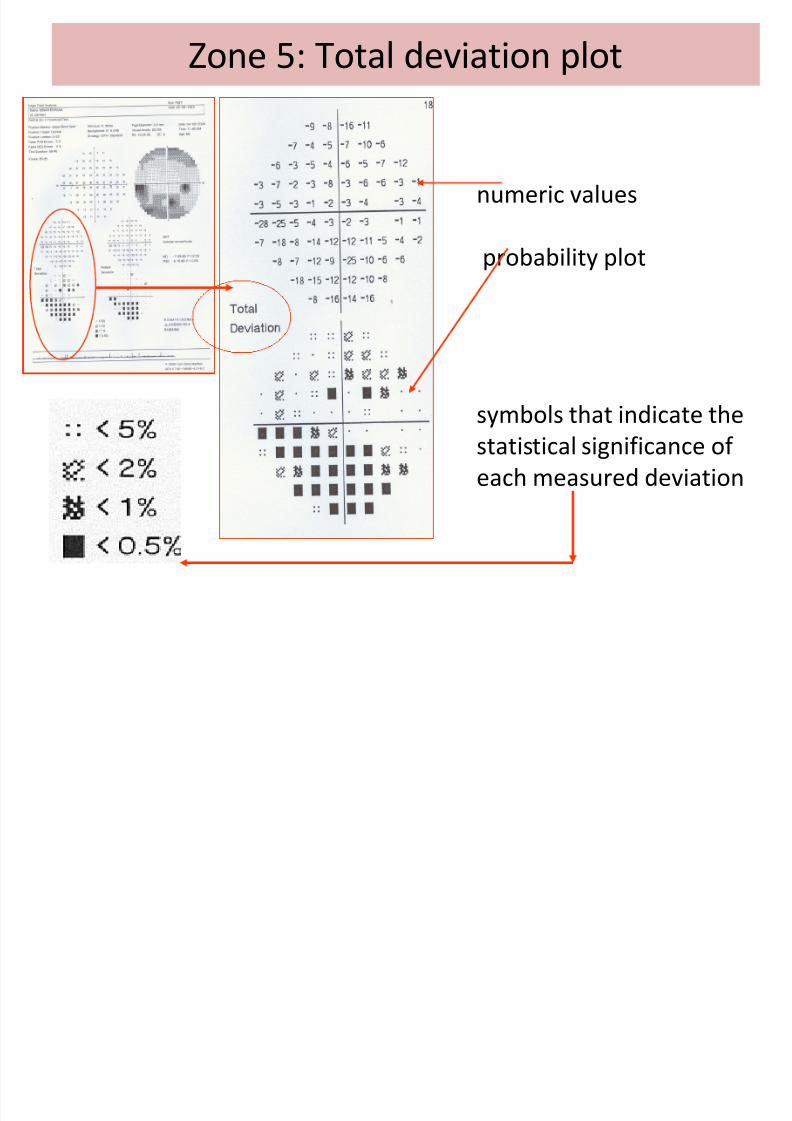
Zone 5: Total deviation plot
numeric values
probability plot
symbols that indicate thestatistical significance of
each measured deviation
8/13/2019 Interpretation of Humphrey
http://slidepdf.com/reader/full/interpretation-of-humphrey 22/42
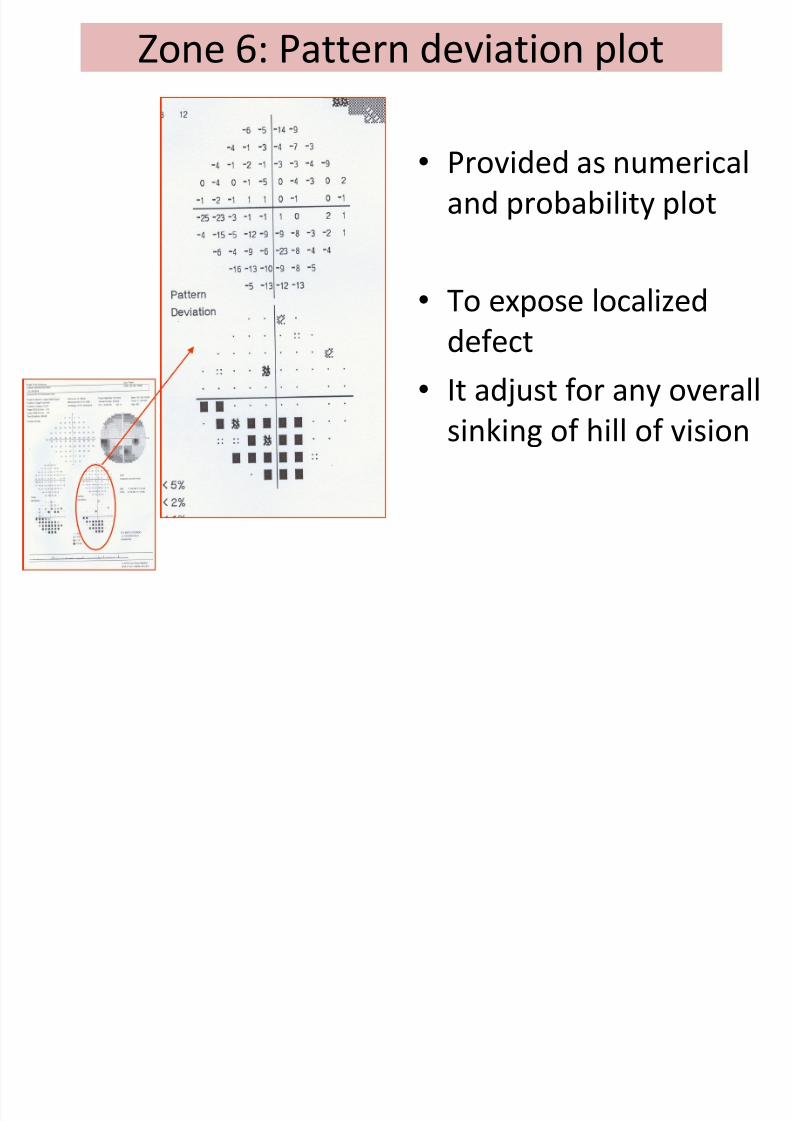
Zone 6: Pattern deviation plot
• Provided as numerical
and probability plot
• To expose localized
defect
• It adjust for any overall
sinking of hill of vision

8/13/2019 Interpretation of Humphrey
http://slidepdf.com/reader/full/interpretation-of-humphrey 23/42
Normal “Hill of vision”
Zone 4: normal no depressed point
Zone 5: normal no depressed point
(courtesy of Prof. Ravi Thomas)
8/13/2019 Interpretation of Humphrey
http://slidepdf.com/reader/full/interpretation-of-humphrey 24/42
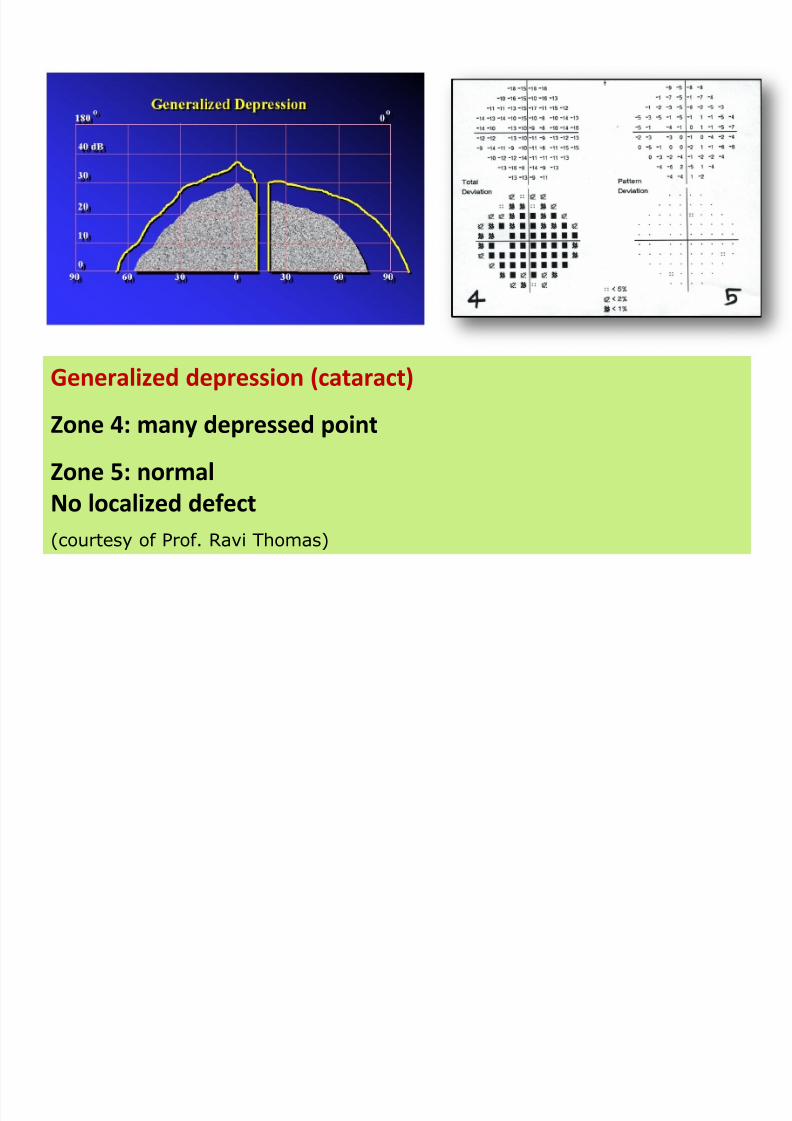
Generalized depression (cataract)
Zone 4: many depressed point
Zone 5: normal
No localized defect
(courtesy of Prof. Ravi Thomas)

8/13/2019 Interpretation of Humphrey
http://slidepdf.com/reader/full/interpretation-of-humphrey 25/42
Localized scotoma
There are depressed point in zone 4 that persist in zone 5
(courtesy of Prof. Ravi Thomas)

8/13/2019 Interpretation of Humphrey
http://slidepdf.com/reader/full/interpretation-of-humphrey 26/42
Zone 7: Global indices
• Each global index summarized andcharacterizes one aspect of the test as asingle value

8/13/2019 Interpretation of Humphrey
http://slidepdf.com/reader/full/interpretation-of-humphrey 27/42
Zone 7: Global indices
• MD (mean deviation)shows how much, on average, the whole field depart fromnormal
• PSD (Pattern Standard Deviation)reflects irregularities in the field caused by localizeddefects
• SF (Short term Fluctuation)is index of intra test variationSF is removed from PSD to produced CPSD (CorrectedPattern Standard Deviation)

8/13/2019 Interpretation of Humphrey
http://slidepdf.com/reader/full/interpretation-of-humphrey 28/42
Hoddap Classification
Early Glaucomatous Loss
a. MD > -6 dB
b. Fewer than 18 points depressed below
the 5% probability level and fewer than
10 points below the p<1% level
c. No point in the central 5 degrees with
a sensitivity of less than 15 dB

8/13/2019 Interpretation of Humphrey
http://slidepdf.com/reader/full/interpretation-of-humphrey 29/42
Moderate Glaucomatous Loss
a. -6>MD > -12 dB
b. Fewer than 37 points depressed below the5% probability level and fewer than 20points below the p<1% level
c. No absolute deficit (0 dB) in the 5 central
degreesd. Only one hemifield with sensitivity of < 15
dB in the 5 central degrees
Hoddap Classification

8/13/2019 Interpretation of Humphrey
http://slidepdf.com/reader/full/interpretation-of-humphrey 30/42
Advanced Glaucomatous Loss
a. MD < -12 dB
b. More than 37 points depressed below the5% probability level or more than 20points below the p<1% level
c. Absolute deficity (0 dB) in the 5 central
degreesd. Sensitivity < 15 dB in the 5 central degrees
in both hemifields
Hoddap Classification

8/13/2019 Interpretation of Humphrey
http://slidepdf.com/reader/full/interpretation-of-humphrey 31/42
Zone 8: Glaucoma Hemifield Test
Five possible message of GHT
• Outside normal limit
•
Borderline• General reduction of sensitivity
• Abnormally high sensitivity
• Within normal limits

8/13/2019 Interpretation of Humphrey
http://slidepdf.com/reader/full/interpretation-of-humphrey 32/42
Zone 8: Glaucoma Hemifield Test
Five zones in the
upper field arecompared its
mirror-image in
the lower field
8/13/2019 Interpretation of Humphrey
http://slidepdf.com/reader/full/interpretation-of-humphrey 33/42
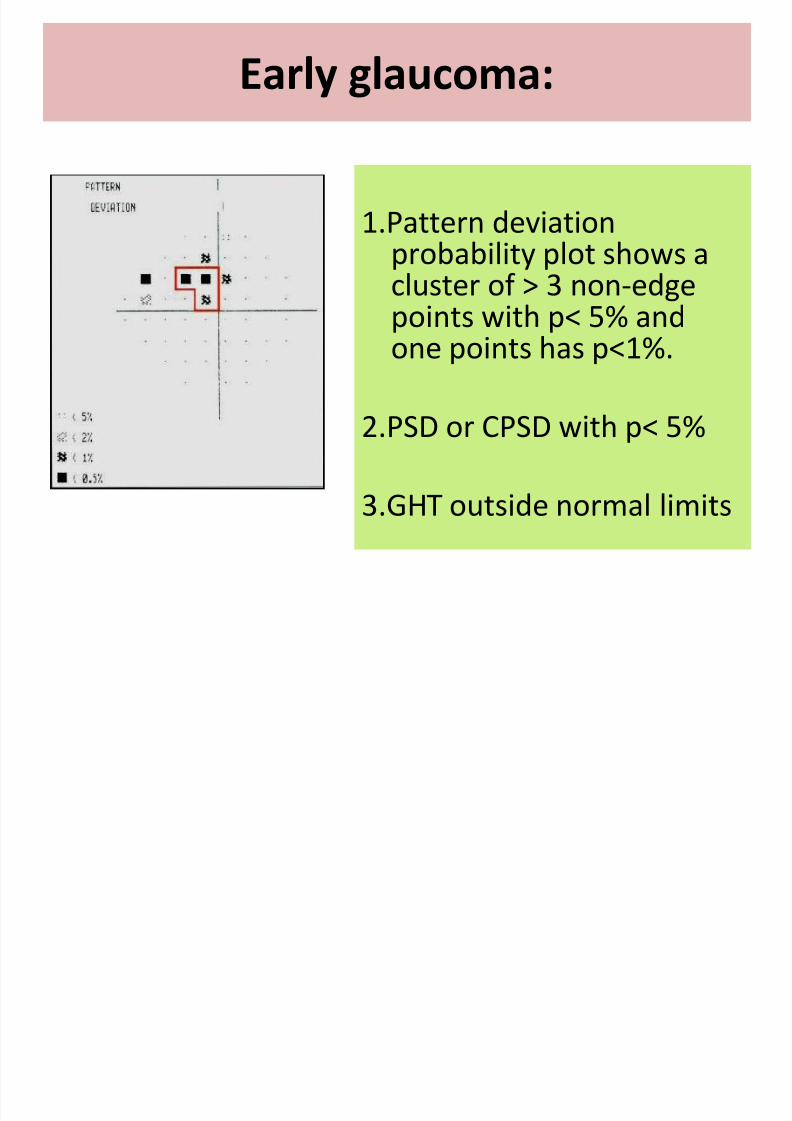
Early glaucoma:
1.Pattern deviationprobability plot shows a
cluster of > 3 non-edgepoints with p< 5% andone points has p<1%.
2.PSD or CPSD with p< 5%
3.GHT outside normal limits
8/13/2019 Interpretation of Humphrey
http://slidepdf.com/reader/full/interpretation-of-humphrey 34/42

8/13/2019 Interpretation of Humphrey
http://slidepdf.com/reader/full/interpretation-of-humphrey 35/42
FIGURE 1 :
HFA 30-2CONSTRICTED
FIELD
8/13/2019 Interpretation of Humphrey
http://slidepdf.com/reader/full/interpretation-of-humphrey 36/42
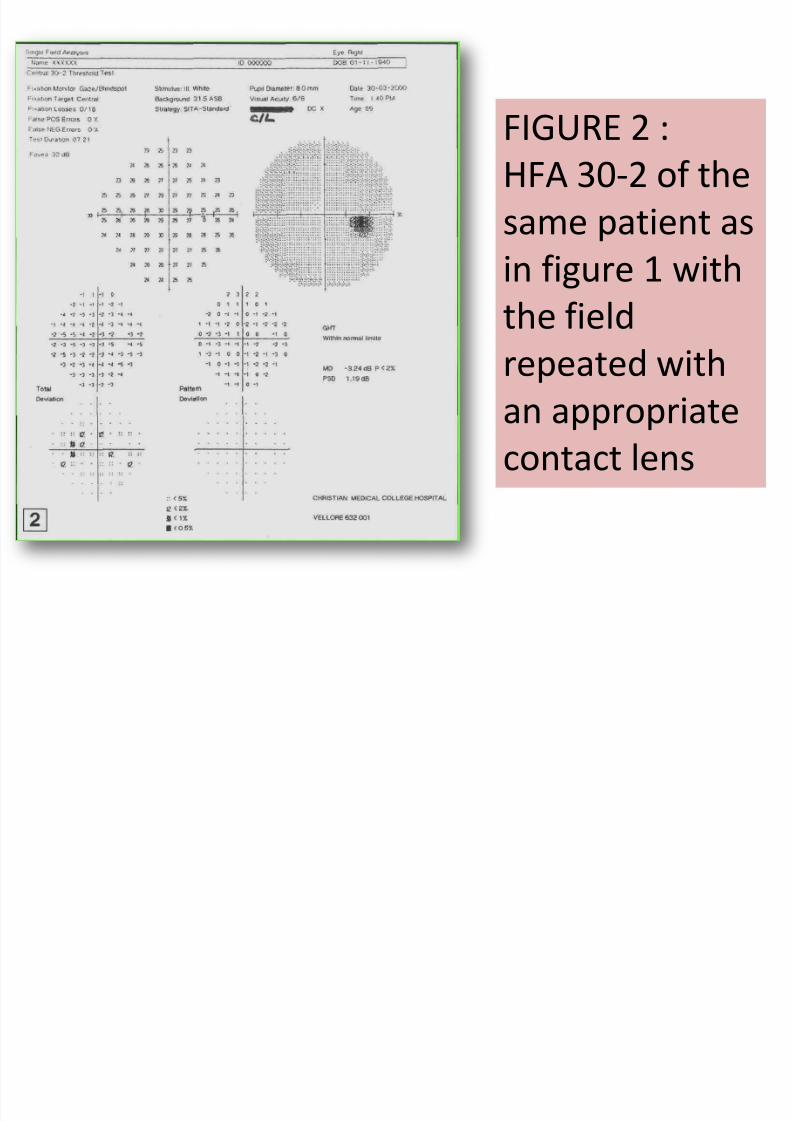
FIGURE 2 :HFA 30-2 of the
same patient as
in figure 1 withthe field
repeated with
an appropriatecontact lens

8/13/2019 Interpretation of Humphrey
http://slidepdf.com/reader/full/interpretation-of-humphrey 37/42
TRY TO INTERPRET THIS PRINTOUT...
CASE 1 Zone 1: entered correctly
Zone 2 : reliable field
false neg NA
Zone 3 : central islandZone 4 : all depressed point
Zone 5 : better than deviationplot
Zone 6 : MD and PSD flag asabnormal
GHT : outside normal limit
Advance field loss
Order for 10-2 and macula
program

8/13/2019 Interpretation of Humphrey
http://slidepdf.com/reader/full/interpretation-of-humphrey 38/42
The result of 10-2
CASE 1

8/13/2019 Interpretation of Humphrey
http://slidepdf.com/reader/full/interpretation-of-humphrey 39/42
CASE 2
Zone 1 and 2: OkZone 3 : arcuate defectZone 4 : depressed pointsuperiorlyZone 5 : arcuate scotomaZone 6: MD and PSDabnormalZone 7: GHT outside normallimits
It is consistent with typicalglaucomatous defect
Then correlate with fundusfinding

8/13/2019 Interpretation of Humphrey
http://slidepdf.com/reader/full/interpretation-of-humphrey 40/42
Inferiorretinochoroidcoloboma
Neverinterpret thefield alone!!
CASE 2

8/13/2019 Interpretation of Humphrey
http://slidepdf.com/reader/full/interpretation-of-humphrey 41/42
Case 3
Zone 1: 30-2 program
Zone 2: reliable field
Zone 4: many depressed pointp<0.5%
Zone 5 : many depressed point
persist with p< 0.5% in arcuatearea
Zone 6 :MD and PSD flag asabnormal
Zone 7: GHT outside normal limit
This is a Juvenile OAG, posttrabeculectomy, IOP 12 mmHg,
cd 0.7

8/13/2019 Interpretation of Humphrey
http://slidepdf.com/reader/full/interpretation-of-humphrey 42/42
THANK YOU