Embed Size (px)
Citation preview
Internship Report
Developing and testing models of fish behaviour around tidal turbines
Ilaria Spiga
In partnership with Sustainable Marine Energy Ltd
and HR Wallingford Ltd.

NERC MRE internship report Ilaria Spiga
Developing and testing models of fish behaviour around tidal turbines
Aim of the internship
The work described here has been carried out as an MRE Knowledge exchange NERC Fellowship
(NE/L014335/1) Developing and testing models of fish behaviour around tidal turbines. The
overarching aim of this project was to provide an evidence-based tool to forecast the effects of
anthropogenic noise on marine fish for Environmental Impact Assessments (EIA). The project was
run in collaboration with the tidal turbine developer Sustainable Marine Energy (SME), the marine
modelling consultant HR Wallingford (HRW) and University of Exeter. SME has provided access to
the marine operations to install the PLAT-O 1 platform, a structure for supporting two turbines off of
Yarmouth, Isle of Wight, for recording the noise levels generated by these activities. HRW provided
the HAMMER model to implement with the inclusion of measurements of sound levels from an MRE
and fish behavioural data in response to noise exposure. Behavioural experiments on fish have been
performed at the University of Exeter and supervised by Dr Steve Simpson.
Objectives are those included in the contingency plan and included: the acoustic measurements and
analysis of the underwater sound levels generated during the different marine operations, including
those accidental sounds coming from the vessel participating to the operations and the actual
sounds from the installation process. This noise has been employed in playback experiments to
collect data on the effects on behaviour of fish and use HAMMER model. SME has been unable to
install the tidal turbines during the internship period and, therefore, measurements of the
operational tidal device were not collected, but granted the access to the installation phase of
PLATO-O1.
The study objectives were fulfilled as follows:
1) we measured and quantified underwater noise levels of installation operations of PLAT-O
platform at Yarmouth, Isle of Wight;
2) we measured the reduction in sound level of installation noise with increasing range;
3) we measured sea ambient noise with no installation-noise;
4) we used noise levels of installation operations in HAMMER to predict noise levels of PLAT-O
installation operations experienced at increasing range from operational site;
5) we compared the computed sound levels in HAMMER with the measured levels;
6) we used the noise produced by PLAT-O installation operations to investigate the effects of noise
on European sea bass.

NERC MRE internship report Ilaria Spiga
This report presents 1) an analysis of the Yarmouth (Cowes, Isle of Wight) underwater noise
measurements before and during the PLATO-1 installation, 2) a validation exercise of the HAMMER
model propagation of noise for certain frequencies 3) the results from the behavioural experiments
on sea bass. The final discussion considers the biological implications of the noise produced by the
PLAT-O1 installation operations.
Field work
During the period between March and August 2014 we performed a total of three acoustic surveys.
On the 2nd July we surveyed the area off Yarmouth to collect ambient noise. The survey lasted one
day and produced 45 recordings of 30s (three consecutive recordings were made at each location).
During August 2014 we surveyed the area during the mooring of the drilling vessel (19/8) and drilling
of the first anchor pile (20/8). Both these surveys lasted one day and produced 21 and 56 recordings,
respectively, ranging from 30 to 90s.
The installation of the PLAT-O1 comprised:
1. to install vessel moorings
2. to load out drill rig
3. to moor up vessel
4. to deploy rig
5. to drill anchor piles
We had access to operations 3 and 5 during which we have recorded the noise emission of these
activities.
Field site
The areas designated for mooring of the vessel are reported in Table I and Table II presents the
screw pile anchor positions. The central position of PLAT-O1 was 50 42.57 N, 001 31 00 W. The
seabed contours run approximately 065/245 degrees and the slope run approximately 155/335
degrees. The steepest gradient was the North West pile location TNW and the North East pile
location TNE (Figure 1). Bottom type in the area was course, medium and fine gravel with clay
nearer the surface (known from material recovered on drill feet and anchors). Clay was expected
underlying this layer (based on historical borehole report and sub-bottom profile data).
NERC MRE internship report Ilaria Spiga
Figure 1 Map of the study area created with Mermaid v3.077 - Provided by HR Wallingford. Map reports isolines for bottom depth - Provided by HR Wallingford. The four black diamond dots represent the screw pile anchor positions as
planned (see Table II).
Table I Coordinates of the mooring stations.
Designation of Vessel Moorings Position of Vessel Moorings
Mooring 1 50 42.618’N 001 31.126’W
Mooring 2 50 42.561’N 001 31.111’W
Mooring 3 50 42.621’N 001 30.993’W
Mooring 4 50 42.584’N 001 30.984’W
Table II Screw Pile Anchor Positions (pre-lay)
Offset from planned position
Pile # Positions Distance (m)
Bearing (degrees)
TSE (1) 50 42.5893’ N 001 31.0303’ W 0.86 24
TNE (2) 50 42.6041’ N 001 31.0307’ W 2.5 16
TSW (3) 50 42.5832’ N 001 31.0700’ W 0.47 216
TNW (4) 50 42.5992’ N 001 31.0795’ W 0.71 54
TSE
TNE TNW
TSW

NERC MRE internship report Ilaria Spiga
Methods
Acoustic recordings
Underwater sounds were recorded from a RIB using a C55 Cetacean Research Technology
hydrophone (Transducer Sensitivity + Preamplifier Gain – Effective Sensitivity: -165dB, re 1V/µPa)
connected to a Fostex FR-2LE compact audio recorder (Recording/Reproduction Frequency 20 Hz -
20 kHz ±2dB; FS 44.1/48kHz), which recorded on a Type II CompactFlash™ card; to reduce the flow
noise over the device, the RIB was allowed to drift during the measurements. The hydrophone was
deployed into the water from the side of the vessel and it was mounted on an anti-heave buoy, at 5
m below the surface. To reduce additional noise from the RIB (movements, voices) the hydrophone
was allowed to drift at least 10 m away from the vessel before measurements were taken.
Recordings were made with the following format: 44.1 kHz/ 16 bit, BWF file mode.
For the measurements used in this study, transects radiating outwards from the source, at ranges
increasing geometrically were planned. The RIB was used to move from location to location along
transect lines. Each measurement location was identified by means of the GPS. At each location, the
RIB was manoeuvred into position, the engine stopped and all electrical equipment turned off. The
GPS information was recorded again at the end of the acoustic measurements.
Vessel specifications and activities
Willchallenge (Figure 2) was a multicat type vessel, length O.A. 20m, beam O.A. 7m, 2 engines (Total
Power 720HP/530Kw @ 2000rpm). The Willchallenge was used as vessel to install its own moorings
and to act as the platform to deploy the drill rig. The vessel was equipped of a USBL scout-vessel
based underwater positioning system.
The rig was lifted over the side and lowered from the bow slowly into the sea bed. Orientation of the
rig was maintained with tag lines. The drill rig has the following approximate specifications: length
3.40m, breadth 3.15m, height 1.66m. Drilling operation of the first pile lasted approximately 20
minutes.
NERC MRE internship report Ilaria Spiga
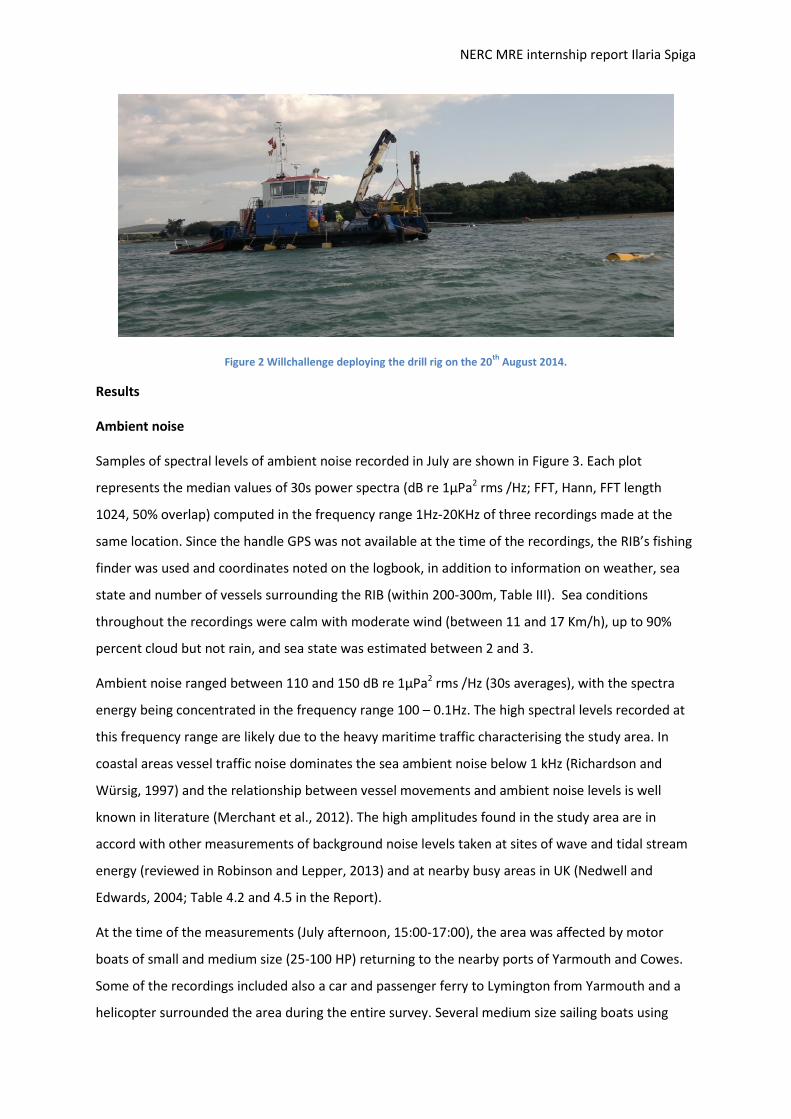
Figure 2 Willchallenge deploying the drill rig on the 20th August 2014.
Results
Ambient noise
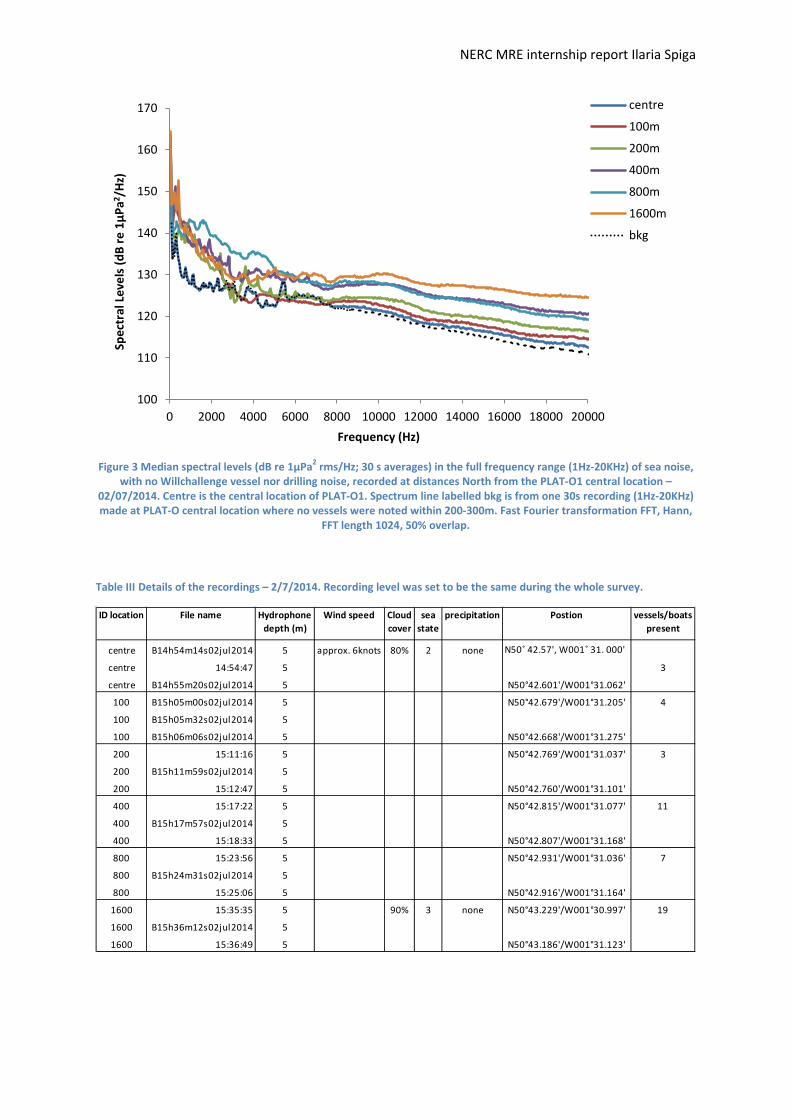
Samples of spectral levels of ambient noise recorded in July are shown in Figure 3. Each plot
represents the median values of 30s power spectra (dB re 1µPa2 rms /Hz; FFT, Hann, FFT length
1024, 50% overlap) computed in the frequency range 1Hz-20KHz of three recordings made at the
same location. Since the handle GPS was not available at the time of the recordings, the RIB’s fishing
finder was used and coordinates noted on the logbook, in addition to information on weather, sea
state and number of vessels surrounding the RIB (within 200-300m, Table III). Sea conditions
throughout the recordings were calm with moderate wind (between 11 and 17 Km/h), up to 90%
percent cloud but not rain, and sea state was estimated between 2 and 3.
Ambient noise ranged between 110 and 150 dB re 1µPa2 rms /Hz (30s averages), with the spectra
energy being concentrated in the frequency range 100 – 0.1Hz. The high spectral levels recorded at
this frequency range are likely due to the heavy maritime traffic characterising the study area. In
coastal areas vessel traffic noise dominates the sea ambient noise below 1 kHz (Richardson and
Würsig, 1997) and the relationship between vessel movements and ambient noise levels is well
known in literature (Merchant et al., 2012). The high amplitudes found in the study area are in
accord with other measurements of background noise levels taken at sites of wave and tidal stream
energy (reviewed in Robinson and Lepper, 2013) and at nearby busy areas in UK (Nedwell and
Edwards, 2004; Table 4.2 and 4.5 in the Report).
At the time of the measurements (July afternoon, 15:00-17:00), the area was affected by motor
boats of small and medium size (25-100 HP) returning to the nearby ports of Yarmouth and Cowes.
Some of the recordings included also a car and passenger ferry to Lymington from Yarmouth and a
helicopter surrounded the area during the entire survey. Several medium size sailing boats using
NERC MRE internship report Ilaria Spiga
motors were also observed during the survey. The only recording that did not include any boat
within 200m or other anthropogenic noise (bkg, Figure 3) had spectrum energy ranging 109-140 dB
re 1µPa2/Hz rms (30s averages) and it is likely to be very close to the true background level of the
area at the time of the measurements.
Analysis of the spectral levels in the region above 2 KHz also showed higher acoustic energy of
background noise, which is likely due to sediment transport generated by the high speed of tidal
flow in the area and consequently collisions between moving sediment grains and between moving
grains and the sea bed. Seabed surveys performed by SME reported a seabed of course, medium and
fine gravel with clay nearer the surface, which can produce noise at frequency close to 2KHz and
above (Thorne, 1986). The raise in levels is particularly visible in the spectrum line labelled as centre
in Figure 3, where frequencies between 2 and 8 KHz have higher levels. At the time of the
measurements, the tide was high (3.1m at 14:55 h; c.a. 2.5 at 17:00) and the tide speed estimated
based on the RIB’s drifting speed was 0.8Kn at the PLAT-O1 central location. Similar results have
been reached by other authors describing background noise in areas of high energy (reviewed in
Robinson and Lepper, 2013; Merchant et al., 2014), however it is important to note the our
recordings were highly affected by the presence of nearby vessels whose positioning system, about
which we were unware of during the entire survey, could possibly have contributed to the
background levels at high frequencies. The limited time window available for this survey did not
allow identifying the temporal variation in noise level to explain the relationship between tidal flow
and noise levels in the study area. It would be worth to do this in future surveys to better
characterise the background noise levels.
Finally, the low frequency component (<30Hz) identified in all recordings was likely caused by
turbulence around the hydrophone creating flow noise.
NERC MRE internship report Ilaria Spiga
Figure 3 Median spectral levels (dB re 1µPa2 rms/Hz; 30 s averages) in the full frequency range (1Hz-20KHz) of sea noise,
with no Willchallenge vessel nor drilling noise, recorded at distances North from the PLAT-O1 central location – 02/07/2014. Centre is the central location of PLAT-O1. Spectrum line labelled bkg is from one 30s recording (1Hz-20KHz) made at PLAT-O central location where no vessels were noted within 200-300m. Fast Fourier transformation FFT, Hann,
FFT length 1024, 50% overlap.
Table III Details of the recordings – 2/7/2014. Recording level was set to be the same during the whole survey.
100
110
120
130
140
150
160
170
0 2000 4000 6000 8000 10000 12000 14000 16000 18000 20000
Spec
tral
Lev
els
(dB
re 1
µPa2 /
Hz)
Frequency (Hz)
centre
100m
200m
400m
800m
1600m
bkg
ID location File name Hydrophone depth (m)
Wind speed Cloud cover
sea state
precipitation Postion vessels/boats present
centre B14h54m14s02jul2014 5 approx. 6knots 80% 2 none N50˚ 42.57', W001˚ 31. 000'
centre 14:54:47 5 3
centre B14h55m20s02jul2014 5 N50°42.601'/W001°31.062'
100 B15h05m00s02jul2014 5 N50°42.679'/W001°31.205' 4
100 B15h05m32s02jul2014 5
100 B15h06m06s02jul2014 5 N50°42.668'/W001°31.275'
200 15:11:16 5 N50°42.769'/W001°31.037' 3
200 B15h11m59s02jul2014 5
200 15:12:47 5 N50°42.760'/W001°31.101'
400 15:17:22 5 N50°42.815'/W001°31.077' 11
400 B15h17m57s02jul2014 5
400 15:18:33 5 N50°42.807'/W001°31.168'
800 15:23:56 5 N50°42.931'/W001°31.036' 7
800 B15h24m31s02jul2014 5
800 15:25:06 5 N50°42.916'/W001°31.164'
1600 15:35:35 5 90% 3 none N50°43.229'/W001°30.997' 19
1600 B15h36m12s02jul2014 5
1600 15:36:49 5 N50°43.186'/W001°31.123'

NERC MRE internship report Ilaria Spiga
Anchoring operations
Figure 4 refers to the background noise recorded at distances East from the Willchallenge vessel.
During the measurements the mooring vessel was preparing for anchoring and it was already
anchored to two of the four anchors. Ambient noise amplitudes compared with the results of the 2nd
July were on average 3-5 dB higher in the frequency range 100-0.1 Hz and this was mainly due to the
presence of Willchallenge vessel. However, in general spectral levels of background noise were
lower during these measurements (broadband ambient noise ranged between 102 and 140 dB re
1µPa2 rms /Hz; 30s averages) and this could be due to the relatively fewer vessels noted during the
survey and the calmer weather experienced (wind speed was 9-18 km/h), compared to the 2nd July.
Again, the spectral analysis revealed an increase in levels at high frequencies (2-8 KHz), which was
due to transport of coarse and fine sediments of the sea bed. The increase in background noise level
was more pronounced in these recordings compared to those of the 2nd July, potentially because the
measurements were made during flood tide when the water level was higher and the tide speed
reached 1.3kn (according to SME – Methods Statement).
Figure 4 Spectral levels (dB re 1µPa2 rms/Hz; 30 s averages) of ambient sea noise and mooring vessel recorded at distances <200m East from the mooring vessel – 19/08/2014. Individual spectra lines (colour lines; 30s averages) indicate each recording. The dotted spectrum line (30s average) is the median spectrum level of the four recordings. Willchallenge vessel noise contribution to background noise is visible at frequencies between 100-0.1Hz. Sounds at frequency between 2-8KHz are due to sediment transport. Fast Fourier transformation FFT, Hann, FFT length 1024, 50% overlap.
100
110
120
130
140
150
160
0 2000 4000 6000 8000 10000 12000 14000 16000 18000 20000
Spec
tra
Leve
ls (d
B re
1µP
a2 /Hz
)
Frequency (Hz)
vessel1vessel2vessel3vessel4<200m

NERC MRE internship report Ilaria Spiga
Figure 5 represents the background noise recorded at distances East from the third anchor (point
TNE in Table II) during the anchoring operations of Willchallenge. Measurements at 114 and 138m
included anchoring operations; the spectrum was computed from 8s recordings. Compared with the
amplitudes recorded at the same location when no anchoring was taking place (vessel noise, Figure
5), ambient sea noise levels are similar in the low frequencies of the spectrum, representing the
noise from the Willchallenge vessel (100-0.1 Hz), but increased at frequency up to 20 KHz, increase
likely due to the anchoring operation. The broadband nature of the anchoring noise is presented in
the spectrograms (15s samples) in Figure 6 and Figure 7.
Figure 5 Broadband spectral levels of ambient sound with mooring vessel (8s averages) during anchoring operations (anchor 3) – 19/08/2014. Distances are from the anchor located at TNE point (Table II). Spectrum line labelled vessel noise is from one recording of the background noise with vessel only, taken just before the anchor release at 114m East from TNE point. Fast Fourier transformation FFT, Hann, FFT length 1024, 50% overlap.
100
110
120
130
140
150
160
0 2000 4000 6000 8000 10000 12000 14000 16000 18000 20000
Spec
tra
Leve
ls (d
B re
1µP
a2 /Hz
)
Frequency (Hz)
vessel noise
114m
138m

NERC MRE internship report Ilaria Spiga
Figure 6 Spectrogram represents 15 s of the measurement taken during the anchoring operation and includes two steps of the anchor 3 lowering underwater. This recording was made at 114 m East from the anchor at location TNE at 15:00
hrs. Fast Fourier transformation FFT, Hann, FFT length 1024, 50% overlap.
Figure 7 Spectrogram of 15s of the measurement taken during the anchoring operation including the anchor lowering
underwater. This recording was made at 138 m East from the anchor at location TNE at 15:02 hrs. Fast Fourier transformation FFT, Hann, FFT length 1024, 50% overlap.
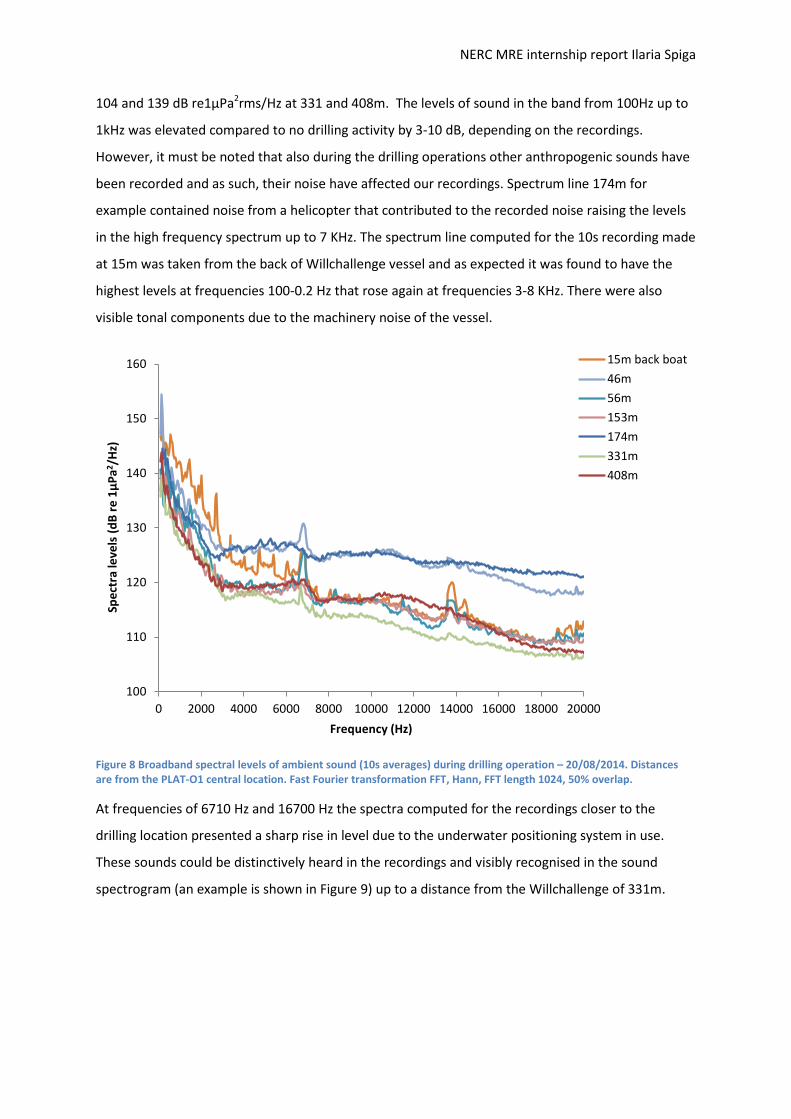
Installation noise
On day 20/8/2014, SME granted access to drilling operations of the first screw pile that would secure
the PLAT-O1 underwater. The measurements were made between 17:00 and 17:25 h, over as closer
distance range as possible within the constraints of operation. Spectral levels (dB re 1µPa2 rms /Hz;
10s averages) of noise recorded during drilling operation at different distances are presented in
Figure 8. The choice to analyse 10s of the total recordings was made to be sure to include the
highest levels of noise produced during the drilling operation since the RIB was drifting away from
the drilling vessel at relatively high speed (2.5 Kn), which we assumed it reflected the flow speed
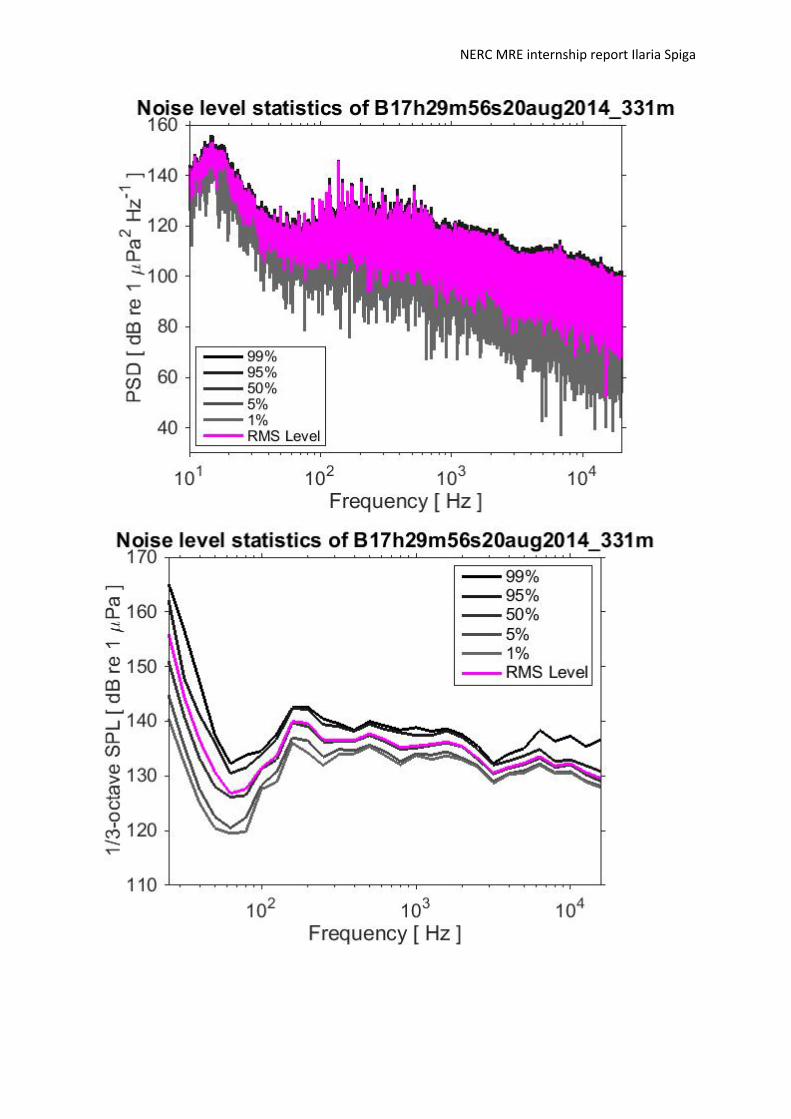
underwater. The Appendix at the end of this report includes all level statistics and 1/3 octave bands
of drilling recordings.
Drilling operation noise evolved between 111 to 144 dB re1μPa2rms/Hz at close distances (46, 56m).
At greater distances (153, 174m) drilling operation noise ranged between 112 and 138 and between
88
92
98
102
107
111
116
122
dB1 2 3 4 5 6 7 8 9 10 11 12 13 14 s
2468
101214161820
kHz
88
92
98
102
107
111
116
122
dB1 2 3 4 5 6 7 8 9 10 11 12 13 14 s
2468
101214161820
kHz
NERC MRE internship report Ilaria Spiga
104 and 139 dB re1μPa2rms/Hz at 331 and 408m. The levels of sound in the band from 100Hz up to
1kHz was elevated compared to no drilling activity by 3-10 dB, depending on the recordings.
However, it must be noted that also during the drilling operations other anthropogenic sounds have
been recorded and as such, their noise have affected our recordings. Spectrum line 174m for
example contained noise from a helicopter that contributed to the recorded noise raising the levels
in the high frequency spectrum up to 7 KHz. The spectrum line computed for the 10s recording made
at 15m was taken from the back of Willchallenge vessel and as expected it was found to have the
highest levels at frequencies 100-0.2 Hz that rose again at frequencies 3-8 KHz. There were also
visible tonal components due to the machinery noise of the vessel.
Figure 8 Broadband spectral levels of ambient sound (10s averages) during drilling operation – 20/08/2014. Distances are from the PLAT-O1 central location. Fast Fourier transformation FFT, Hann, FFT length 1024, 50% overlap.
At frequencies of 6710 Hz and 16700 Hz the spectra computed for the recordings closer to the
drilling location presented a sharp rise in level due to the underwater positioning system in use.
These sounds could be distinctively heard in the recordings and visibly recognised in the sound
spectrogram (an example is shown in Figure 9) up to a distance from the Willchallenge of 331m.
100
110
120
130
140
150
160
0 2000 4000 6000 8000 10000 12000 14000 16000 18000 20000
Spec
tra
leve
ls (d
B re
1µP
a2 /Hz
)
Frequency (Hz)
15m back boat46m56m153m174m331m408m

NERC MRE internship report Ilaria Spiga
Figure 9 Spectrogram of 10s of the recording taken at a distance of 46m from the Willchallenge during drilling activity. The underwater positioning system is visible as high energy dots at frequency 6710 Hz and 16700 Hz. Fast Fourier transformation FFT, Hann, FFT length 1024, 50% overlap.
The measurements made during the drilling operation at Yarmouth were in accord with others that
revealed an increase in the sound levels between 100 Hz and 600 Hz (Broudic et al., 2014; Nedwell
and Brooker, 2008). However, the spectral analysis of the recordings has not allowed us to identify
the signature of the drilling noise as the acoustic coupling of Willchallenge vessel noise and high
anthropogenic noise (local vessels noise) in the study area have masked most of the spectra at
frequencies were it is expected to find the drilling noise. Moreover, the relatively small size of the
drill rig used and substrate found in the area appeared to have damped the noise from the drilling
operation at ranges away from the central location, making the entire operation very quiet. A more
fine resolution of the spectra levels (1 KHz; FFT, Hann, FFT length 3267, 50% overlap) revealed an
increase in levels at 100-600 Hz, which could indicate that the energy of the noise generated by the
installation of the pile at Yarmouth was concentrated at that frequency range.
8890929598100102104107109111114116119122
dB1 2 3 4 5 6 7 8 9 s
2
4
6
8
10
12
14
16
18
20
kHz
NERC MRE internship report Ilaria Spiga
Figure 10 Spectral levels of ambient sound (10s averages) during installation operation – 20/08/2014. Distances are from the PLAT-O1 central location. The spectral levels between 100 and 600 Hz are elevated over the other and could represent the range where drilling noise has its main energy. Fast Fourier transformation FFT, Hann, FFT length 3267, 50% overlap.
Conclusion
This study has been carried out with the data collected during three days between July and August
2014 and so the results presented here are a snapshot of the ambient noise at the time of the
surveys. The study area presented high level of ambient noise, which could be expected for a coastal
high energy shallow water site. Sounds at frequencies below 1 kHz are most likely attributable to
anthropogenic noise (local and distant vessels, machinery noise), whereas re-deposition of
sediments on sea bed due to water flow made a significant contribution to the ambient sound field
at frequencies above 2 kHz.
Noise from installation of the first pile of PLAT-O1 comprised noise from Willchallenge and drilling.
During drilling activity noise was 3 dB to 10 dB higher than the background noise of the area and it
was more intensive between 100 Hz and 1 kHz, spectrum range that was dominated by the vessel
noise. It was suggested that frequencies between 100 and 600 Hz included the main energy of the
drilling noise. Drilling noise level appeared to decrease by 5dB at distance of 100m from the PLAT-O1
central location and reach the ambient noise levels at 300m. Considering the high background noise
found in the area and the low levels of drilling noise attenuating fast, we can suggest that noise
emitted during the installation of the PLAT-O pile in Yarmouth has potentially limited impact on the
surrounding marine environment. Levels recorded during this study are comparable with noise
80
90
100
110
120
130
140
150
160
1 10 100 1000 10000
Spec
tra
leve
ls (d
B re
1µP
a2 /Hz
)
Frequency (Hz)
46m56m153m174m331m

NERC MRE internship report Ilaria Spiga
radiated by small vessels and are considerably lower than the levels of noise generated by piling,
another marine techniques used to fix piles for offshore and coastal development. A major
contribution to the noise during construction was caused by the presence of Willchallenge and
machinery associated with the activity. Although these noise sources are not expected to cause
injury on animals, behavioural effects are documented in marine animals exposed to boat noise
(Codarin et al., 2010; Picciulin et al., 2010; Vasconcelos et al., 2007) and could result from exposure
to higher levels added by the presence of Willchallenge. Although the short time required by SME to
fix the pile underwater does not represent a concern upon the chronic exposure, in this study we
were able to measure levels of background noise only during the installation of one pile out of four,
which lasted 20 minutes. The installation of four piles or a commercial array of turbines each
supported by four piles could bring to a longer rise of ambient noise, whose effects on animals might
become a concern.
ANALYSIS OF THE SOUND PROPAGATION – HAMMER.
Acoustic monitoring of an area of interest (e.g. MRE development area) must consider the sound
propagation in the ocean, ideally computed from in-situ measurements. However, considering that
sound travels over great distances, it may be impracticable to cover the whole area of interest and
measurements may result to be insufficient. The use of numerical modelling can overcome this
difficulty and provide information on the propagation of sound in water.
In this study we used HAMMER (Hydro-Acoustic Model for Mitigation and Ecological Response), an
underwater noise propagation model which predicts noise levels at distance from a point source.
The underwater noise model is setup using the physical information from the bathymetric data and
hydrodynamic model with additional data relating to the specific noise source, e.g. drilling, in this
study. The model predicts the propagation of noise from the source point in a 2D vertical slice,
which determines the noise levels throughout the water column in a line out from the source,
covering a full 360 degrees. This allows sound maps of underwater radiated noise to be created, so
that the noise levels can be understood and interpreted for EIA. The model is based on the parabolic
equation method (Collins, 1993). HAMMER also incorporates an ecological response model to
investigate the impact of underwater noise on species behaviour. Individuals are represented as a
particle and the model predicts movement patterns, given initial input parameters of max/min
swimming speed, initial direction, directness, source level intensity and frequency (Hz).
We were not able to run the ecological model with HAMMER because of the lack of responses to
installation noise found in sea bass, the target species for this project. Therefore, only analysis of the
sound propagation of drilling noise was performed with HAMMER.
NERC MRE internship report Ilaria Spiga
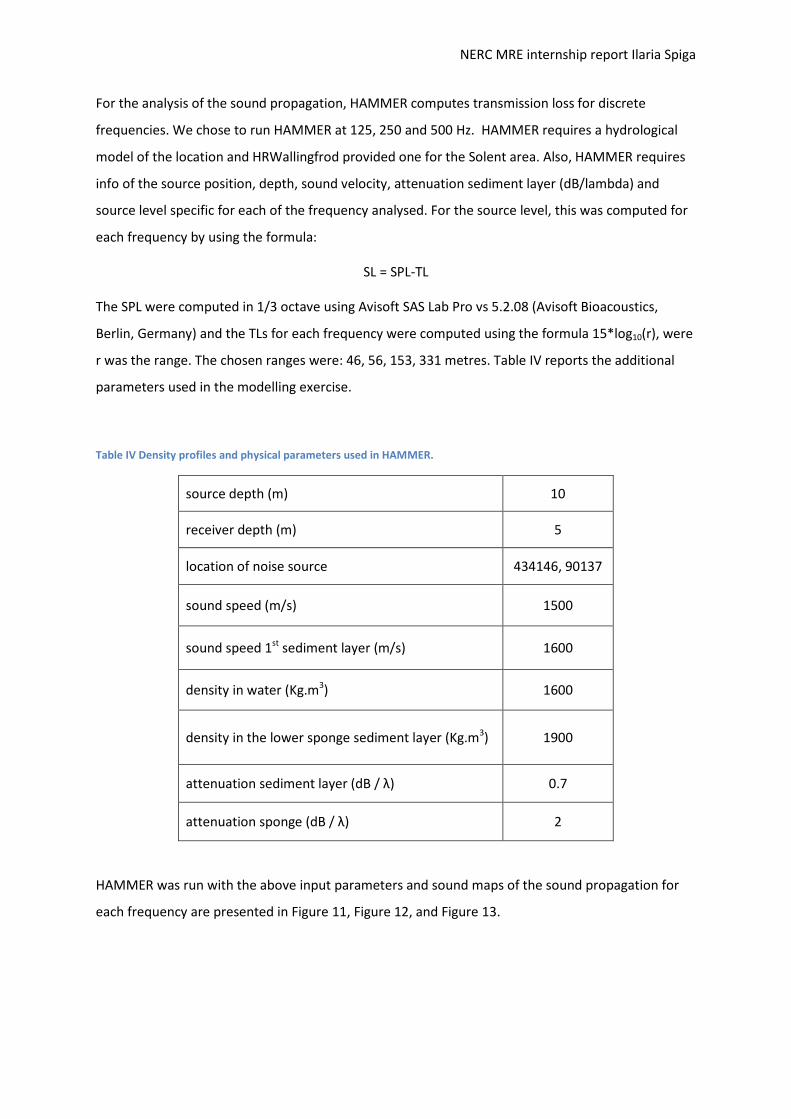
For the analysis of the sound propagation, HAMMER computes transmission loss for discrete
frequencies. We chose to run HAMMER at 125, 250 and 500 Hz. HAMMER requires a hydrological
model of the location and HRWallingfrod provided one for the Solent area. Also, HAMMER requires
info of the source position, depth, sound velocity, attenuation sediment layer (dB/lambda) and
source level specific for each of the frequency analysed. For the source level, this was computed for
each frequency by using the formula:
SL = SPL-TL
The SPL were computed in 1/3 octave using Avisoft SAS Lab Pro vs 5.2.08 (Avisoft Bioacoustics,
Berlin, Germany) and the TLs for each frequency were computed using the formula 15*log10(r), were
r was the range. The chosen ranges were: 46, 56, 153, 331 metres. Table IV reports the additional
parameters used in the modelling exercise.
Table IV Density profiles and physical parameters used in HAMMER.
source depth (m) 10
receiver depth (m) 5
location of noise source 434146, 90137
sound speed (m/s) 1500
sound speed 1st sediment layer (m/s) 1600
density in water (Kg.m3) 1600
density in the lower sponge sediment layer (Kg.m3) 1900
attenuation sediment layer (dB / λ) 0.7
attenuation sponge (dB / λ) 2
HAMMER was run with the above input parameters and sound maps of the sound propagation for
each frequency are presented in Figure 11, Figure 12, and Figure 13.
NERC MRE internship report Ilaria Spiga
Figure 11 Sound map of the propagation of drilling noise at frequency 125 Hz. Isolines represent the noise levels computed for the study area using HAMMER. The white dots represent the locations of the measurements. Colour bar
represents the noise levels for the 125 Hz.
Figure 12 Sound map of the propagation of drilling noise at frequency 250 Hz. Isolines represent the noise level computed for the study area using HAMMER. The white dots represent the locations of the measurements. Colour bar
represents the noise levels for the 250 Hz.
NERC MRE internship report Ilaria Spiga
Figure 13 Sound map of the propagation of drilling noise at frequency 500 Hz. Isolines represent the noise levels computed for the study area using HAMMER. The white dots represent the locations of the measurements. Colour bar
represents the noise levels for the 500 Hz.
It was not possible to do any sensitivity analysis of the modelling done with HAMMER because we
did not have replicates of the drilling measurements at each range and, therefore, we could not
computed any statistical difference. However, comparison of the computed levels for each
frequency with the available measured levels showed a good agreement. These data are showed in
Table V.
Table V computed and measured levels.
Comparing the background levels to the predicted levels during installation operations showed that
drilling noise levels should reach background noise levels at range of between 300 m and above,
which is in agreement with what it was found from the empirical measurements.
46m 56m 153m 331m 46m 56m 153m 331m 46m 56m 153m 331m
138.65 122.75 126.56 124.76 131.61 124.42 127.55 123.72 130.74 133.11 127.45 124.23
46m 56m 153m 331m 46m 56m 153m 331m 46m 56m 153m 331m
112.03 111.70 111.12 105.09 107.80 111.82 110.79 108.42 115.39 113.81 110.15 100.14
125Hz 250Hz 500Hz
measured
computed
measured
computed
measured
computed

NERC MRE internship report Ilaria Spiga
Effects of playback noise from installation of PLAT-O1 on movement and anti-predator behaviour
of European seabass, Dicentrarchus labrax
RATIONALE – European sea bass, Dicentrarchus labrax, is a commercially important species in the
UK in both aquaculture and for capture fisheries. They are migratory fish and move between feeding
and breeding grounds between the English Channel and the southern North Sea and along the west
coast and into Cornish waters (Pawson, 1995). Bass are generally regarded as a schooling fish which
perform migrations together. Older larger bass can often be solitary (Frimodt, 1995).
Sensitivity to low frequency sounds: a study of the saccular hair cells from D. labrax revealed that
this fish has an inner ear configuration similar to hearing generalist fish (Lovell et al., 2005). Sea bass
have their best hearing sensitivity at low frequencies (100-0.1 Hz; Lovell, 2003, Figure 14). Sea bass’s
50% reaction threshold occurred for pure tone signals of 0.1–0.7 kHz when the levels were 0-30dB
above hearing threshold (Kastelein et al., 2008).
Figure 14 Auditory brainstem response (ABR) audiogram of European sea bass. Redrawn from Lovell, 2003.
Movement in response to sounds: Buscanio et al. (2009) found significant increase in motility (total
movement) in sea bass exposed to a 0.1–1 kHz linear sweep (150 dB rms re 1uPa). Neo et al. (2014)
found that groups of European sea bass increased swimming speed at the onset of playback sounds
that differed in the temporal structure (frequency, amplitude and duration were the same between
sounds). The SPL of the consistent amplitude treatments was 165 dB re 1 µPa and the SPL of
fluctuating amplitude treatments changed gradually every minute between random levels ranging
from 134 to 172 dB re 1 µPa.
Anti-predator behaviour: why anti-predator behaviour? Studying anti-predator behaviour allows
investigating the link to individual fitness. If fish reduce the likelihood of escaping to a predator, its
60
70
80
90
100
110
120
130
10 100 1000 10000
thre
shol
d le
vel (
dB re
1 u
Pa)
Frequency (Hz)

NERC MRE internship report Ilaria Spiga
survival might be affected. Chan et al., 2010 found that crabs hid more slowly in response to a silent
visual stimulus when simultaneously broadcasting of a white noise (82 dB SPL) was introduced,
compared to silent conditions. Eels were less likely and slower to startle to a predator when exposed
to playback of additional noise (148 dB RMS re 1 µPa; Simpson et al., 2014).
AIMS – In this study, we played back noise recorded during the installation of the PLAT-O1’s first
screw pile to investigate whether it had an effect on movement and anti-predator behaviour of
European sea bass, Dicentrarchus labrax. Experiments were performed in tanks at the University of
Exeter.
RESEARCH QUESTIONS:
1. Does noise from the installation of PLAT-O affect movement of sea bass?
2. Does noise disrupt anti-predator behaviour?
HYPOTHESIS:
1. Fish exposed to installation noise will increase their movement behaviour.
2. Exposure to installation noise might make individuals less likely to detect the attack,
increasing the time they take to startle.
Materials and methods
Experimental set-up
Procedure included:
30 minutes acclimation (ambient noise) – 1 minute video (ambient noise) – change track – 1 minute
video (ambient/installation noise) – throw the ball – 30 s video – stop noise – stop camera.
Ambient- and installation noise playback files were created using recordings from Yarmouth (Cowes,
Isle of Wight). Ambient noise was that recorded during the acoustic survey in July 2014, whereas
installation noise was recorded in August 2014 during the drilling operations of the first pile that will
support the PLAT-O1 platform. Installation noise used in the playback experiments was that
recorded at 46m from the drilling activities and included noise from the vessel, drilling and the
positioning system. Individual tracks of recorded installation noise and ambient noise were split in
three 15s track and looped to obtain 3 minutes and 45 minutes playback tracks, respectively. Before
experiments began, noise playbacks were recorded and calibrated to verify that all recordings had
uniform sound levels (136 ± 0.2 for ambient and 146 ± 0.5 for installation noise dB re 1µPa2 rms /Hz
Figure 15 and Figure 16).

NERC MRE internship report Ilaria Spiga
Figure 15 Sound pressure level of ambient and installation noise playbacks recorded in tank A (FFT analysis: spectrum level units, Hann evaluation window, 50% overlap, FFT size 32768).
Figure 16 Sound pressure level of ambient and installation noise playbacks recorded in tank B (FFT analysis: spectrum level units, Hann evaluation window, 50% overlap, FFT size 1024).
Two tanks (53.6 x 43.9 x 44.2 cm) were used for the playback experiments. Individual fish were
randomly allocated to each tank. Two GoPro cameras filmed the fish from the top of each tank. A
simulated predator (a blue squash ball) was thrown from the side of the tank into the water at 30 cm
circa (Figure 17). Polystyrene blocks (5 cm high) were placed underneath the tanks to stop vibrations
during playback. Thick firm foam has been placed underneath the speakers to avoid additional
vibrations.
80
90
100
110
120
130
140
0 500 1000 1500 2000 2500 3000
Spec
tral
leve
l dB
re 1
µPa2 /
Hz
Frequency (Hz)
installation noiseambient noise
80
90
100
110
120
130
140
0 500 1000 1500 2000 2500 3000
Spec
tral
leve
l dB
re 1
µPa2 /
Hz
Frequency (Hz)
installation noiseambient noise

NERC MRE internship report Ilaria Spiga
Figure 17 Set up of the experiment showing the two tanks with above a pipe line used to throw the ball (predator) in the arenas. Above the tanks are also visible the two GoPro cameras used to video the fish during exposure to noise.
Experiments used an independent samples design: 36 animals were used. 50% received ambient
noise (N=18) and 50% received installation noise (N=18). All experiments involved an initial period of
a control playback (ambient noise) from one of the three ambient tracks, followed by a switch to
playback of either a control recording or an additional noise (installation noise). Twelve (12) unique
combinations of control to control or control to installation noise playback were created, with every
3 fish receiving one of the 12 possible playback combinations. The order in which these playback
combinations were presented was randomized within each testing block.
Behavioural analysis
Movements were scored by counting how many times per minute individual fish crossed the line of a
grid (5x5 cm) superimposed on the bottom of the experimental tank. Anti-predator behaviour was
scored by investigating whether or not the fish startled (a sudden movement at increased speed) to
the simulated predator (ball) and the lag time in the response (defined as the time between the ball
crossed the wall tank and the startle response in fish). The lag time was calculated by analysing the
videos frame by frame and converting the number of the frames to time using a simple formula:
Lag-time = observed frame numbervideo frame per second
During the analysis the observer was blind to the treatment to remove observer effects.
Data Analysis
Statistical analyses were conducted in R (R core team 2014, version 3.1.0). For the movement
experiment, generalised linear models (GLMs) were used with noise treatment (ambient,

NERC MRE internship report Ilaria Spiga
installation noise), tanks and fish as fixed factors using the MASS package for GLMs and the core
stats package for GLMs using a quasipoisson distribution (data overdispersion). For the anti-
predator experiment, survival analysis was used with noise treatment (ambient, installation
noise), tanks and fish ID as fixed factors using the SURVIVAL package for Cox proportional
hazards regression. All tests used a confidence level of 95%.
Results
Movement
Tested fish in the two tanks responded similarly to the noise treatment (quasipoisson GLM:
F1,33=0.0226, p= 0.8813). There was no significant difference in the fish movement when fish were
exposed to installation noise compared to ambient noise (GLM: F1,34= 0.6907, p= 0.4117; Figure 18).
Figure 18 Fish movement (mean ± S.D.) when exposed to playback ambient noise and installation noise
AP experiments
All tested fish in both experimental tanks responded to the simulated predatory attack by freezing or
running. Only four fish reacted by freezing at the occurrence of the predator compared to 32 fish
that run (Figure 19). After the initial response to the predator (either flying or freezing) the fish have
been found to freeze. There was no significant difference in the time taken by the fish to freeze after
the initial response to the predator when exposed to ambient compared to installation noise (Cox
proportional hazard regression = p = 0.708; C.I. = 0.41, 1.8; Figure 20).
ambientinstallation noise
45
40
35
30
25
20
15
10
treatment
grid
num
ber

NERC MRE internship report Ilaria Spiga
Figure 19 Startle response of Dicentrarchus labrax during playback of ambient noise or installation noise (n = 18 for each treatment).
Figure 20 Time (median, IQR) taken by Dicentrarchus labrax to freeze after the initial response to simulated predator.
Discussion
In this study we found that European sea bass exposed to playback of noise from the installation of
PLAT-O1 platform did not significantly change their movement behaviour compared to ambient
noise. These findings contrast the work from Buscaino et al. (2010), who found significant increase in
motility in caged sea bass exposed to low frequency sounds, but are in line with those found by Neo
et al. (2014), where sea bass maintained similar swimming speed throughout the experiment, with
the exception of a swimming burst at the onset of the noise. For active swimmers such as sea bass
are, the lack of movement change in response to additional noise has advantages in that fish will not
be affected in their routes to and from biologically important grounds (mating/ feeding). Similarly,
0
2
4
6
8
10
12
14
16
18
Ambient noise Installation noise
fish
num
ber
ambientinstallation noise
0.6
0.5
0.4
0.3
0.2
0.1
0.0
treatment
lag
resp
onse
(s)
Freeze
Run

NERC MRE internship report Ilaria Spiga
the anti-predator behaviour appeared to be unaffected by additional noise exposure. The majority
of the fish startled when presented to the predator, meaning that they did not fail to detect it during
the simulated attack. This has important consequences as the startle response in fish is crucial in
escaping to predator attacks and any factor that affects this ability may reduce the chance of survival
(Chan, 2010). In addition, fish did not change their time to react behaviourally when exposed to the
additional noise and this means that the noise produced during the installation of PLATO-1 does not
induce any subtle responses and fish would successfully escape to the predator.
One possibility for the apparent lack of response to noise exposure may be that the level of the
additional noise played back was moderate compared to ambient noise playback. Kastelein et al.
(2008) found that 50% reaction threshold levels occurred at 0–30 dB above the hearing thresholds
for the test frequencies (100-0.1 Hz). Buscaino et al. (2010) had level at 50dB above the species’
hearing threshold and found increased mobility. In our study the level of additional noise within the
frequencies 100-0.1 Hz was 10-20 dB above the species’ hearing threshold at low frequency
(<100Hz), which reflected the difference in levels recorded during the measurements in the field.
Although care should be taken not to generalize these findings from a laboratory study, our data
suggest that the moderate noise increase created during the installation activity of PLAT-O1 do not
have direct or subtle negative impacts on behaviour of sea bass. Nevertheless, further studies on
wild sea bass are needed to draw conclusions about the consequences of the noise from this kind of
installation procedure and these studies should include also an assessment of the physiological
responses to the noise (e.g. respiration rate and stress). Our data suggested that this kind of
installation might be less detrimental on fish behaviour than other more frequently used activities in
sea, such as piling, which add high levels of noise in the water (205 dB re 1 µPa; Bailey et al., 2010). It
is also important to consider that measurements of the PLAT-O1 noise were only conducted for
sound pressure level and not for particle motion, to which sea bass may be more sensitive.
The fact that noise from the installation of the PLAT-O1 platform did not change the behavioural
response to the predator in sea bass poses a great deal of interest on the procedure used by SME
and the activity (drilling) performed. Pile driving, for example, has the potential to induce a
reduction in startle responses in sea bass (Everley et al., 2015). As documented in this study, drilling
may reduce the extent of behavioural impact for fish to a much smaller area due to the lower sound
levels produced that mitigate the detrimental effects on local fish.

NERC MRE internship report Ilaria Spiga
Literature cited
Bailey H, Senior B, Simmons D et al. (2010) Assessing underwater noise levels during pile-driving at an offshore windfarm and its potential effects on marine mammals. Mar Pollut Bull 60:888-897.
Broudic, M., Voellmy, I., Dobbins, P., Robinson, S., Berggren, P., Laing, S., et al. (2014). Underwater noise emission from the NOAH’s drilling operation at the narec site, Blyth, UK. In Proceedings of the 2nd International Conference on Environmental Interactions of Marine Renewable Energy Technologies (EIMR2014).
Buscaino, G., Filiciotto, F., Buffa, G., Bellante, A., Di Stefano, V., Assenza, A., et al. (2010). Impact of an acoustic stimulus on the motility and blood parameters of European sea bass (Dicentrarchus labrax L.) and gilthead sea bream (Sparus aurata L.). Marine environmental research, 69 (3), 136-142.
Chan A, Giraldo-Perez P, Smith S et al. (2010). Anthropogenic noise affects risk assessment and attention: the distracted prey hypothesis. Biol Lett 6:458-461.
Collins, M.D., 1993. A split step padé solution for the parabolic equation method. Journal of the Acoustical Society of America 93, 1736–1742.
Codarin A., Wysocki L.E., Ladich F. & Picciulin M. (2009). Effects of ambient and boat noise on hearing and communication in three fish species living in a marine protected area (Miramare, Italy). Marine Pollution Bulletin, 58, 1880-1887.
Everley K. A., Radford A.N., Simpson S.D. (2015). Pile-Driving Noise Impairs Anti-Predator Behavior of the European Sea Bass, Dicentrarchus labrax. In Popper, A. N. and Hawkins, A. eds. The Effects of Noise on Aquatic Life II. Springer Science+Business Media, LLC, New York.
Frimodt, C., 1995. Multilingual illustrated guide to the world's commercial warmwater fish. Fishing News Books, Osney Mead, Oxford, England. 215 p.
Hatch, L., Clark, C., Merrick, R., Van Parijs, S., Ponirakis, D., Schwehr, K., Thompson, T., & Wiley, D. (2008). Characterizing the relative contributions of large vessels to total ocean noise fields: a case study using the Gerry E. Studds Stellwagen Bank National Marine Sanctuary. Environmental management, 42(5), 735-752.
Kastelein, R. A., Van Der Heul, S., Verboom, W. C., Jennings, N., Van Der Veen, J., & De Haan, D. (2008). Startle response of captive North Sea fish species to underwater tones between 0.1 and 64kHz. Marine Environmental Research, 65(5), 369-377.
Lovell, J.M., 2003. The hearing abilities of the bass, Dicentrarchus labrax. Technical report commissioned by ARIA Marine Ltd. for the European Commission Fifth Framework Programme. Project Reference: Q5AW-CT-2001-01896.
Lovell, J. M., Findlay, M. M., Harper, G., Moate, R. M., & Pilgrim, D. A. (2005). The polarisation of hair cells from the ear of the European bass (Dicentrarchus labrax). Comparative Biochemistry and Physiology Part A: Molecular & Integrative Physiology, 141(1), 116-121.
Merchant, N. D., Witt, M. J., Blondel, P., Godley, B. J., & Smith, G. H. (2012). Assessing sound exposure from shipping in coastal waters using a single hydrophone and Automatic Identification System (AIS) data. Marine pollution bulletin, 64 (7), 1320-1329.
Merchant, N. D., Pirotta, E., Barton, T. R., & Thompson, P. M. (2014). Monitoring ship noise to assess the impact of coastal developments on marine mammals. Marine pollution bulletin, 78(1), 85-95.
NERC MRE internship report Ilaria Spiga
Nedwell, J. R., & Edwards, B. (2004). A review of measurements of underwater man-made noise carried out by Subacoustech Ltd, 1993–2003. Subacoustech Report ref: 534R0109, 29.
Nedwell, J. R., & Brooker, A. G. (2008). Measurement and assessment of background underwater noise and its comparison with noise from pin pile drilling operations during installation of the SeaGen tidal turbine device, Strangford Lough. A report commissioned by COWRIE (Subacoustech Report No 724R0120). 33pp.
Picciulin M., Sebastianutto L., Codarin A., Farina A. & Ferrero E.A. (2010). In situ behavioural responses to boat noise exposure of Gobius cruentatus (Gmelin, 1789; fam. Gobiidae) and Chromis chromis (Linnaeus, 1758; fam. Pomacentridae) living in a Marine Protected Area. Journal of Experimental Marine Biology and Ecology, 386, 125-132.
Neo, Y. Y., Seitz, J., Kastelein, R. A., Winter, H. V., Ten Cate, C., & Slabbekoorn, H. (2014). Temporal structure of sound affects behavioural recovery from noise impact in European seabass. Biological Conservation, 178, 65-73.
Pawson, M., G. 1995. Biogeographical identification of English Channel fish and shellfish stocks. Fisheries Research Technical Report (number 99), MAFF Direct Fisheries Research Lowestoft, England. Available from: http://www.cefas.co.uk/Publications/techrep/tech99.pdf
Richardson, W. J., & Würsig, B. (1997). Influences of man-made noise and other human actions on cetacean behaviour. Marine & Freshwater Behaviour & Phy, 29(1-4), 183-209.
Robinson, S.P and Lepper, P.A. (2013). Scoping study: Review of current knowledge of underwater noise emissions from wave and tidal stream energy devices. The Crown Estate.
Simpson, S. D., Purser, J., & Radford, A. N. (2015). Anthropogenic noise compromises antipredator behaviour in European eels. Global change biology, 21(2), 586-593.
Thorne, P. D. (1986). Laboratory and marine measurements on the acoustic detection of sediment transport. The Journal of the Acoustical Society of America, 80(3), 899-910.
Vasconcelos R.O., Amorim M.C.P. & Ladich F. (2007). Effects of ship noise on the detectability of communication signals in the Lusitanian toadfish. Journal of Experimental Biology, 210, 2104-2112.

NERC MRE internship report Ilaria Spiga
Appendix

NERC MRE internship report Ilaria Spiga

NERC MRE internship report Ilaria Spiga
NERC MRE internship report Ilaria Spiga
NERC MRE internship report Ilaria Spiga