Embed Size (px)
Citation preview

Jaypee Business School A constituent of Jaypee Institute of Information Technology
(Deemed University)A-10, Sector 62, Noida (UP) India 201 307
www.jbs.ac.in
BRAND MANAGEMENT of MARUTI SUZUKI SX4
Corporate Internship ReportInternship Report submitted as a partial requirement for the award of the two year
Master of Business Administration ProgrammeMBA 2010-12
Name: Uday Prasad
(MARUTI SUZUKI INDIA LIMITED, DELHI) Corporate Internship Supervisor
Name: Mr. Amey Mujumdar
JBS-Faculty Supervisor: Mr. M.A. Sanjeev
Start Date for Internship: 2nd May, 2011End Date for Internship: 12th June, 2011
Report Date: 1st July, 2011 ACKNOWLEDGEMENT
1

I, Uday Prasad, take this opportunity to work on a project on the car that has been Maruti Suzuki’s Poster-boy in the upper A3 segment, Maruti SX4.
I have put my heart and soul in this project. However, it would not have been possible without the kind support and help of many individuals. I would like to extend my sincere thanks to all of them.
I am highly indebted to Mr. M.A. Sanjeev and Mr. Amey Mujumdar for their guidance and constant supervision as well as for providing necessary information regarding the project & also for their support in completing the project.
I would like to express my gratitude towards my parents & the employees of Maruti Suzuki India Limited for their kind co-operation and encouragement.
I would like to express my special gratitude and thanks to the customers of Maruti Suzuki SX4 car for giving me attention, time and necessary inputs.
My thanks and appreciations also go to all the people who have willingly helped me out with their abilities.
THANK YOU
...……………………… ……………………………..UDAY PRASAD Mr. M.A. SANJEEV MBA STUDENT FACULTY MENTOR JBS, Noida JBS, Noida
2
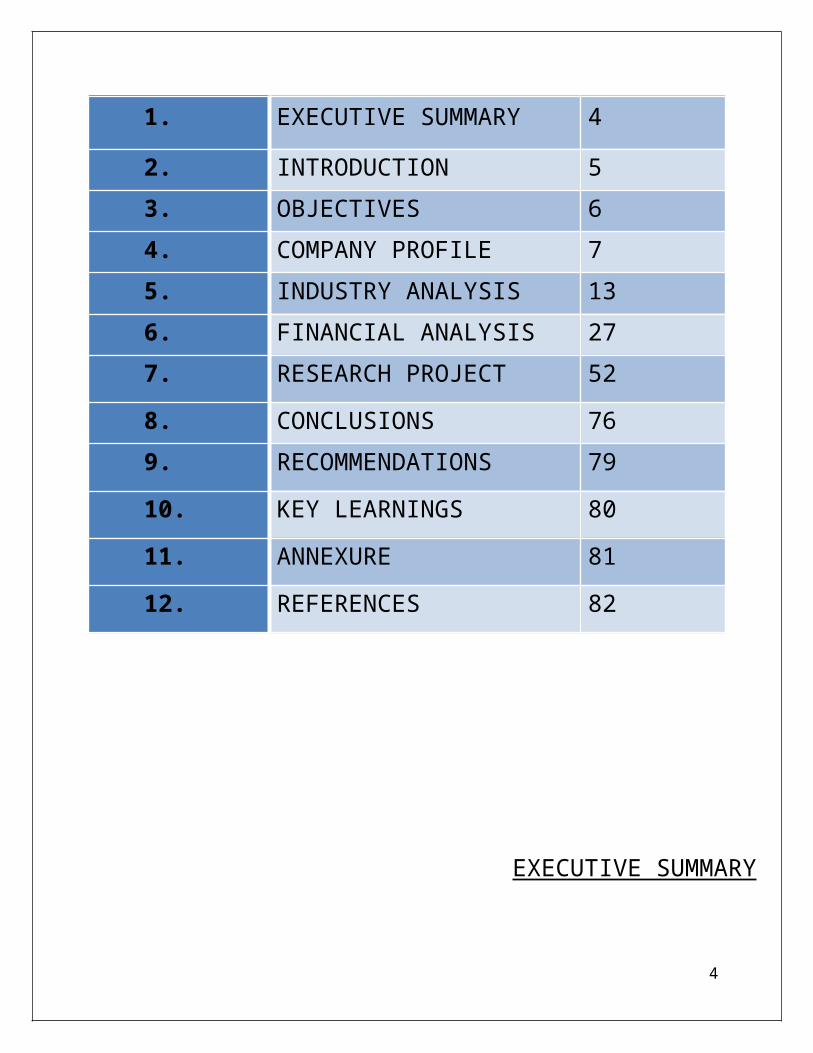
TABLE OF CONTENTS SERIAL NUMBER TOPIC PAGE NUMBER
1. EXECUTIVE SUMMARY 4
2. INTRODUCTION 5
3. OBJECTIVES 6
4. COMPANY PROFILE 7
5. INDUSTRY ANALYSIS 13
6. FINANCIAL ANALYSIS 27
7. RESEARCH PROJECT 52
8. CONCLUSIONS 76
9. RECOMMENDATIONS 79
10. KEY LEARNINGS 80
11. ANNEXURE 81
12. REFERENCES 82
3
EXECUTIVE SUMMARY
Maruti Suzuki India Limited is the largest car manufacturer in the country. Every second car sold in India is from the Maruti Suzuki stable. The product range of this firm extends from entry level car Maruti 800 to luxury sports sedan Maruti Kizashi.
The company produced and sold over one million cars in 2010-11 including domestic figures and export figures. It commands approximately 45% market share in Indian passenger cars market by sales. The firm has a dealer network of 950 dealers spread across 650 cities. Any product under the Maruti Suzuki brand, thus, reaches more than 1000 million people living in these cities.
Maruti’s major sports sedan SX4 has been delivering good sales figures since its launch in the year 2007. Earlier this year, Maruti launched a diesel variant of the SX4 which has had a very good response from the customers with the sales figures in May putting SX4 next only to Hyundai Fluidic Verna and ahead of its major competitor Volkswagen Vento and Honda City.
In this project I will be analyzing the sales pitch and positioning of Vento, Verna, City, Linea and Fiesta against SX4. For this purpose, I will be visiting dealers of each of these cars-as a customer- across the length and breadth of Delhi to find out the needed information, specification and statistics. The dealers of Maruti Suzuki will also be covered to find how they push and pitch for the sales of the SX4 car. The inputs from them would be necessary to evaluate SX4’s positioning in the A3 segment. This stage would serve as the resource to find where SX4 stands vis-à-vis other cars in its segment.
Next, the customers of the SX4 from all across India will be called for a telephonic survey with the goal to find the key characteristics of the customers based on few questions. This stage would serve as the resource for customer profiling of SX4 car on a national and regional basis.
Finally, the SWOT analysis of Maruti Suzuki India Limited will be done as a final stage of the corporate internship report.
The primary results will be collected along with the secondary data from sources like the journals, internet, databases and both of them will be assimilated to find SX4’s pros and cons, SX4’s customer profile and analyze Maruti’s internal and external environment
4

INTRODUCTION
The Indian Automobile industry is expected to grow at a CAGR of over 10 percent amounting to over $40 billion by 2010-11. The Commercial Vehicle Segment has been contributing to the automobile market to a great extent too.
The automobile sector of India is the seventh largest in the world. In 2010-11, the country manufactured about 3.7 million cars making up an identifiable chunk in the world’s annual production of about 73 million cars in a year. The country is the largest manufacturer of motorcycles and the fifth largest producer of commercial vehicles. Industry experts have visualized an unbelievably huge increase in these figures over the immediate future. In the year 2009, India rose to be the fourth largest exporter of automobiles following Japan, South Korea and Thailand. Experts state that in the year 2050, India will top the car volumes of all the nations of the world with about 611 million cars running on its roads.
The Indian automobile industry today reported 30 per cent growth in vehicle production and sales during 2010-11, mainly riding on the back of robust economic growth, more focus on rural areas and new model launches.
The Society of Indian Automobile Manufacturers (SIAM), however, forecast a slowdown in the rate and predicts a 15 per cent growth in 2011-12. The Indian industry is expected overtake Brazil to become the sixth largest auto maker in the world during this fiscal.
Many foreign companies have been investing in the Indian Automobile industry in various ways such as technology transfers, joint ventures, strategic alliances, exports, and financial collaborations. The auto market in India can boast of attractive finance schemes, increasing purchasing power, and launch of the latest products.
Maruti Suzuki India Limited is a partial subsidiary of Suzuki Motor Corporation of Japan, is India's largest passenger car company, accounting for over 45% of the domestic car market. The company offers a complete range of cars from entry level Maruti 800 and Alto, to stylish hatchback Ritz, A star, Swift, Wagon-R, Estillo and sedans DZire, SX4, Grand Vitara and Luxury Sports sedan Kizashi.
It is the first company in India to mass-produce and sell more than a million cars in a year. It is largely credited for having brought in an automobile revolution to India. It is the market leader in India and on 17 September 2007, Maruti Udyog Limited was renamed Maruti Suzuki India Limited. The company's headquarters are located in Delhi.
Maruti Suzuki is India’s No. 1 customer satisfaction car company. Its sales are more than 45% of total passenger cars sold in the Indian car market. For the past 10 years Maruti Suzuki is getting
5
a stiff competition from the foreign companies like Hyundai, Ford, Honda, Chevrolet and Volkswagen. As a result its sales have gone down and it has lost over 15% of the market share in the concerned period.
Maruti Suzuki SX4 has been the best-seller car in the A3 segment for quite some time but the recent sales figures have dropped with the inclusion of Volkswagen Vento and Hyundai Verna in the concerned segment. Recently, SX4 diesel variant was launched to give a boost to the sagging sales figures. The move has worked and SX4 is back in the reckoning. The work does not end there and thus, some surveys had to be carried regarding the profile of SX4 customers and the analysis of the competition for SX4.
OBJECTIVES
The main objectives of my Corporate Internship Project are:
The competitor analysis of Maruti SX4 based on sales pitch for the competitor brand’s car and sales pitch against SX4 by the competitor brand’s car.
The sales pitch of Vento, Verna, Fiesta, City and Linea to evaluate their positioning in A3 segment.
The customer profiling of the Maruti SX4 based on a questionnaire.
The national and regional analysis of the profile of SX4 buyers based on their profession, the car they used previously, their next best alternative to SX4 and the key reason to buy SX4.
The SWOT analysis of the concerned public company.
The period of the internship will be 6 weeks or 42 days flat.
6

COMPANY PROFILE
Maruti Suzuki India Limited, a partial subsidiary of Suzuki Motor Corporation of Japan, is India's largest
passenger car company, accounting for over 45% of the domestic car market. It was the first company in
India to mass-produce and sell more than a million cars. It is largely credited for having brought in an automobile revolution to India. The company's headquarters are located in New Delhi.
Maruti Udyog Limited (MUL) was established in February 1981, though the actual production commenced in 1983 with the Maruti 800, based on the Suzuki Alto car which at the time was the only modern car available in India.
Maruti Suzuki has been India's number one automobile manufacturer and the market leader in the car segment, both in terms of volume of vehicles sold and revenue earned, for over two decades.More than half the cars sold in India are Maruti Suzuki cars. The company is a subsidiary of Suzuki Motor Corporation, Japan, which owns 54.2 per cent of Maruti Suzuki. The rest is owned by public and financial institutions. It is listed on the Bombay Stock Exchange and National Stock Exchange in India.
The company annually exports more than 50,000 cars and has an extremely large domestic market in India selling over 1000000 cars annually. Maruti 800, till 2004, was the India's largest selling compact car ever since it was launched in 1983. More than a million units of this car have been sold worldwide so far. Currently, Maruti Suzuki Alto tops the sales charts and Maruti Suzuki Swift is the largest selling in A2 segment.
Its manufacturing facilities are located at two facilities Gurgaon and Manesar south of Delhi.
Maruti Suzuki offers 14 models across following segments:
A1 SEGMENT :Maruti 800A2 SEGMENT :Alto, WagonR, Estilo, A-star, Ritz, Swift, A3 SEGMENT :Swift DZire, SX4A4 SEGMENT: Kizashi.MULTI PURPOSE VEHICLES: Omni, EecoUTILITY VEHICLES: Gypsy, Grand Vitara.
Swift, Swift DZire, A-star and SX4 are manufactured in Manesar, Grand Vitara and Kizashi are imported from Japan as completely built units(CBU), remaining all models are manufactured in Maruti Suzuki's Gurgaon Plant.
7

Suzuki Motor Corporation, the parent company, is a global leader in mini and compact cars for three decades. Suzuki’s technical superiority lies in its ability to pack power and performance into a compact, lightweight engine that is clean and fuel efficient.
Nearly 75,000 people are employed directly by Maruti Suzuki and its partners. It has been rated first in customer satisfaction among all car makers in India from 1999 to 2009 by J D Power Asia Pacific.
MARUTI SUZUKI’s VISION
A leader in the Indian Automobile Industry.Creating Customer Delight and Shareholders wealth.A pride of India!
CREATING CUSTOMER DELIGHT THROUGH:
Values for money focusQuality in our productsUnparalleled Service network.
Maruti Suzuki India limited Manufacturing facilities
Maruti Suzuki has two state-of-the-art manufacturing facilities in India. Both manufacturing facilities have a combined production capacity of 1,250,000 vehicles annually.
Gurgaon Manufacturing Facility
The Gurgaon Manufacturing Facility has three fully integrated manufacturing plants and is spread over 300 acres (1.2 km2). All three plants have an installed capacity of 900,000 vehicles annually. The Gurgaon Facilities manufactures the 800, Alto, WagonR, Estilo, Omni, Gypsy and Eeco.
Manesar Manufacturing Facility
The Manesar Manufacturing Plant was inaugurated in February 2007 and is spread over 600 acres (2.4 km2). The production capacity is 550,000 vehicles annually. The Manesar Plant produces the A-star, Swift, Swift DZire and SX4.
CAPACITY ADDITION
The next few years will see great improvements in increasing the capacity at Manesar unit. Currently the company is functioning at a rate of 1.4 million units but by FY12, a 250000 capacity will come up at Manesar taking the total capacity to 1.65 million units. This will be followed by yet another unit at Manesar in FY13 with a further capacity of 250000 taking the total installed capacity to 1.9 million units by the end of FY13.
RESEARCH AND DEVELOPMENT
8

In addition to that the company is also in the process of setting up an R&D (Research and Development) centre at Rohtak. MSIL acknowledges that while it gets excellent support from its parent in launching a number of new models, it is about time that is develops the expertise to do this with its own R&D capability. Company is in the process of inducting and training design engineers, putting up world class proving grounds, crash test facilities, wind tunnel laboratories and other testing infrastructure. This will also see a greater degree of localization, thereby reducing the company’s exposure to the yen.
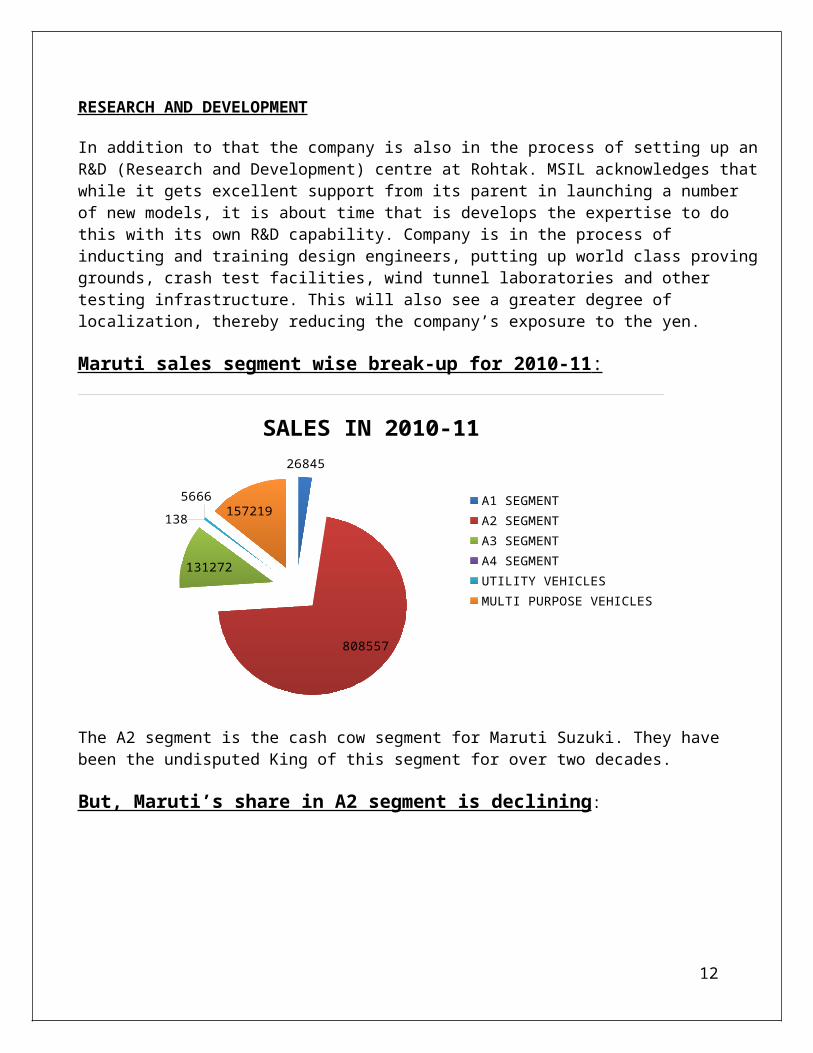
Maruti sales segment wise break-up for 2010-11 :
26845
808557
131272
1385666 157219
SALES IN 2010-11
A1 SEGMENTA2 SEGMENTA3 SEGMENTA4 SEGMENTUTILITY VEHICLESMULTI PURPOSE VEHICLES
The A2 segment is the cash cow segment for Maruti Suzuki. They have been the undisputed King of this segment for over two decades.
But, Maruti’s share in A2 segment is declining:
Jan-08 Jan-09 Jan-10 Jan-1155.00%
55.50%
56.00%
56.50%
57.00%
57.50%
58.00%
58.50%
58.11%57.74%
56.12% 55.99%
Maruti's market share in A2 segment
9

Maruti’s market share in 2010-11 stands declined at 44.94%.
13.97%
44.94%
14.26%
6.79%
4.25%
2.36%
3.91%
2.05% 3.34%0.84%
MARKET SHARE IN PASSENGER VEHICLE SALES IN 2010-11
Tata MotorsMaruti Suzuki IndiaHyundai Motor IndiaMahindra and MahindraGeneral Motors IndiaHonda Siel carsFordVolkswagenToyotaFIAT
LATEST MODEL LAUNCHED: MARUTI KIZASHIMODELS TO BE LAUNCHED IN 2011: RIII MUV, CERVO
Volkswagen AG have brought 19.9% stake in Suzuki Motor Corporation and thus, Maruti Suzuki cars like the SX4, A-star and Swift will be available in Europe under the Volkswagen brand name.
Maruti would soon enter the MPV segment with the RIII car to introduce itself into a segment where it has no market share.
SERVICES OFFERED
As of 30 June 2011 Maruti Suzuki has 1000 dealerships across 666 towns and cities in all states and union territories of India. It has 2,946 service stations (inclusive of dealer workshops and Maruti Authorized Service Stations) in 1,395 towns and cities throughout India. It has 30 Express Service Stations on 30 National Highways across 1,314 cities in India.
Service is a major revenue generator of the company. Most of the service stations are managed on franchise basis, where Maruti Suzuki trains the local staff. Other automobile companies have not been able to match this benchmark set by Maruti Suzuki. The Express Service stations help many stranded vehicles on the highways by sending across their repair man to the vehicle
10

MARUTI INSURANCE
Launched in 2002 Maruti Suzuki provides vehicle insurance to its customers with the help of the National Insurance Company, Bajaj Allianz, New India Assurance and Royal Sundaram.
MSIL was also previously involved in the distribution and selling of motor insurance policies to its clients which were facilitated by its 6 wholly owned insurance subsidiaries namely (Maruti Insurance Logistics Limited, Maruti Insurance Distribution Services Limited, Maruti Insurance Business Agency Limited, Maruti Insurance Agencies Solutions Limited, Maruti Insurance Agencies Services Limited and Maruti Insurance Agencies Network Limited). In fact in FY10 alone the company had sold close to 2.5 million policies.
MARUTI FINANCE
To promote its bottom line growth, Maruti Suzuki launched Maruti Finance in January 2002. Since March 2003, Maruti has sold over 12,000 vehicles through SBI-Maruti Finance. SBI-Maruti Finance is currently available in 166 cities across India.
Maruti True service is offered by Maruti Suzuki to its customers. It is a market place for used Maruti Suzuki Vehicles. One can buy, sell or exchange used Maruti Suzuki vehicles with the help of this service in India. As of 31 March 2010 there are 341 Maruti True Value outlets
ADVANTAGE MARUTI SUZUKI:
Biggest car-maker by a huge margin- one of every two cars sold is a Maruti.The company has reached perfection level in value-conscious small car market.With 1000 dealers in 666 cities, its reach is thrice that of No.2 Hyundai India.Kizashi launch has signaled the entry of Maruti Suzuki in premium A4 segment.
DISADVANTAGE MARUTI SUZUKI:
Its market share is falling as the global giants are getting serious about smaller cars.In the A3 segment, it will face stiffer competition in future. The parent company’s small car focus constrains its growth in the premium segment.Too much value for money focus has crippled its prospects in the premium segments.
THE PRODUCTS PORTFOLIO OF MARUTI SUZUKI:
11
.
12

AUTOMOTIVE INDUSTRY ANALYSIS
INDUSTRY SIZE AND GROWTH TRENDS
The Automotive industry in India is one of the largest in the world and one of the fastest growing globally. India manufactures over 17.5 million vehicles (including 2 wheeled and 4 wheeled) and exports about 2.33 million every year. It is the world's second largest manufacturer of motorcycles, with annual sales exceeding 8.5 million in 2009. India's passenger car and commercial vehicle manufacturing industry is the seventh largest in the world, with an annual production of more than 3.7 million units in 2010. According to recent reports, India is set to overtake Brazil to become the sixth largest passenger vehicle producer in the world, growing 16-18 per cent to sell around three million units in the course of 2011-12. In 2009, India emerged as Asia's fourth largest exporter of passenger cars, behind Japan, South Korea, and Thailand.
According to the Society of Indian Automobile Manufacturers, annual car sales are projected to increase up to 5 million vehicles by 2015 and more than 9 million by 2020. By 2050, the country is expected to top the world in car volumes with approximately 611 million vehicles on the nation's roads.
A chunk of India's car manufacturing industry is based in and around Chennai, also known as the "Detroit of India" with the India operations of BMW, Ford, Hyundai and Nissan headquartered in the city. Chennai accounts for 60 per cent of the country's automotive exports. Gurgaon and Manesar in Haryana are hubs where all of the Maruti Suzuki cars in India are manufactured. The Chakan corridor near Pune, Maharashtra is another vehicular production hub with companies like General Motors, Volkswagen, Skoda, Mahindra and Mahindra, Tata Motors, Mercedes Benz, Fiat and Force Motors having assembly plants in the area.
The dominant products of the industry are two wheelers with a market share of over 75% and passenger cars with a market share of about 16%. Commercial vehicles and three wheelers share about 9% of the market between them. About 91% of the vehicles sold are used by households and only about 9% for commercial purposes. The industry has attained a turnover of more than USD 35 billion and provides direct and indirect employment to over 13 million people.
13

Exports
India's automobile exports have grown consistently and reached $4.5 billion in 2009, with United Kingdom being India's largest export market followed by Italy, Germany, Netherlands and South Africa. India's automobile exports are expected to cross $12 billion by 2014.
According to New York Times, India's strong engineering base and expertise in the manufacturing of low-cost, fuel-efficient cars has resulted in the expansion of manufacturing facilities of several automobile companies like Hyundai Motors, Nissan, Toyota, Volkswagen and Suzuki.
In 2008, Hyundai Motors alone exported 240,000 cars made in India. Nissan Motors plans to export 250,000 vehicles manufactured in its India plant by 2011. Similarly, General Motors announced its plans to export about 50,000 cars manufactured in India by 2011.
AUTOMOBILE GROWTH TRENDS IN INDIA
2010
2009
2008
2007
2006
0 500,000 1,000,000 1,500,000 2,000,000 2,500,000 3,000,000 3,500,000 4,000,000
3,700,000
2,632,694
2,314,662
2,307,000
2,020,000
TOTAL PASSENGER VEHICLES MANUFACTURED IN INDIA
14

SALES VOLUME GROWTH TRENDS AT MARUTI SUZUKI
2007-08 2008-09 2009-10 2010-110
200000
400000
600000
800000
1000000
1200000
1400000
764842 7921671018365
1271005
ANNUAL SALES VOLUME
AUTOMOTIVE COMPANIES IN INDIA
Hindustan Motors : Ambassador ICML : Rhino Rx Mahindra : Major, Xylo, Scorpio, Bolero, Thar, Genio Premier Automobiles Limited : Sigma, RiO San Motors : Storm Tata Motors : Nano, Indica, Indica Vista, Indigo, Indigo Manza, Indigo CS, Sumo, Venture,
Safari, Xenon, AriaBMW India: 1 Series, 3 Series, 5 Series, X1.Fiat India (in collaboration with Tata Motors): Grande Punto, Linea.Ford India: Figo, Fiesta, Endeavour.Chevrolet: Spark, Beat, Aveo U-VA, Aveo, Optra, Cruze, Tavera.Honda Siel: Jazz, City, Civic, Accord.Hyundai Motor India: Santro, i10, i20, Accent, Verna Transform, Sonata Transform.Maruti Suzuki: 800, Alto, WagonR, Estilo, A-star, Ritz, Swift, Swift DZire, SX4, Omni, Versa, Eeco, Gypsy.Mercedes-Benz India: C-Class, E-Class.Mitsubishi (in collaboration with Hindustan Motors):[115] Lancer, Lancer Cedia, PajeroNissan Motor India: Micra.Renault India: Fluence
15

Toyota Kirloskar: Etios, Corolla, Innova.Volkswagen Group Sales India:Audi India: A4, A6, Q5Škoda Auto India: Fabia, Laura, Superb, Yeti.Volkswagen India: Polo, Vento, Jetta, Passat.
MARKET SIZE
The Indian Automotive Industry after de-licensing in July 1991 has grown at a spectacular rate on an average of 17% for last few years. The industry has attained a turnover of USD 39 billion and an investment of USD 10.9 billion. The industry has provided direct and indirect employment to 13.1 million people.
The projected size in 2016 of the Indian automotive industry varies between USD 122 billion and USD 159 billion including USD 35 billion in exports.
While in the interim Indian auto volumes may remain under pressure the long term outlook still looks very admirable
As the RBI goes about its business of tightening the purse strings by hiking interest rates and crude oil remains at elevated levels thereby increasing the cost of vehicle ownership and commodity prices continue to cause havoc to margins, a report elucidating the merits of investing in an automobile stock for the near term may struggle to whet the appetite of potential investors. Automobile sales volume growth which was around 28-30% in the last fiscal is expected to halve in the current fiscal as the above mentioned issues continue to unwind, even as rising commodity prices continue to put pressure on bottom line growth. Despite these issues, the automobile sector is still expected to play a proxy role in the rising demographics of India. As disposable income increases and rural India flourishes a large number of two-wheeler owners are expected to make a shift to compact cars in which MSIL is the leader.
Demand Determinants:
Determinants of demand for this industry include vehicle prices (which are determined largely by wage, material and equipment costs) and exchange rates, while the running cost of a vehicle (mainly determined by the price of petrol), income, interest rates and product innovation.
1. Exchange Rates
2. Affordability
3. Product Innovation
4. Demographics
5. Infrastructure
16

6. Price of Petrol/Diesel
REGULATORY ISSUES
In India the Rules and Regulations related to driving license, registration of motor vehicles, control of traffic, construction & maintenance of motor vehicles etc are governed by the Motor Vehicles Act 1988 (MVA) and the Central Motor Vehicles rules 1989 (CMVR).
In order to involve all stake holders in regulation formulation, MoSRT&H has constituted two Committees to deliberate and advise Ministry on issues relating to Safety and Emission Regulations, namely –
CMVR- Technical Standing Committee (CMVR-TSC) Standing Committee on Implementation of Emission Legislation (SCOE)
Major functions the Committee is:
To provide technical clarification and interpretation of the Central Motor Vehicles Rules having technical bearing, to MoRT&H, as and when so desired.
To make recommendations on any other technical issues which have direct relevance in implementation of the Central Motor Vehicles Rules.
STANDARDS :
17

1. CMVR-TSC is assisted by the Automobile Industry Standards Committee (AISC) having members from various stakeholders in drafting the technical standards related to Safety. The major functions of the committee are as follows:
o Preparation of new standards for automotive items related to safety. o To review and recommend amendments to the existing standards.
2. The National Standards for Automotive Industry are prepared by Bureau of Indian Standards (BIS). The standards formulated by AISC are also converted into Indian Standards by BIS.
Standing Committee on Implementation of Emission Legislation (SCOE) – This Committee deliberates the issues related to implementation of emission regulation. Major functions of this Committee are:
o To discuss the future emission norms o To finalize the test procedures and the implementation strategy for emission norms.
TECHNOLOGY :
The automobile industry has to address the following issues at all the stages of vehicle manufacture:
Environmental Imperatives Safety Requirements Competitive Pressures and Customer Expectations
THE PARAMETERS DETERMINING EMISSION FROM VEHICLES
Vehicular Technology Fuel Quality
VEHICULAR TECHNOLOGY:
To address the high pollution in 4 metro cities 0.05% sulfur petrol & diesel has been introduced since 2000-2001. The benzene content has been further reduced to 1% in Delhi and Mumbai.
From April 1995 mandatory fitment of catalytic converters in new petrol passenger cars sold in the four metros of Delhi, Calcutta, Mumbai and Chennai along with supply of Unleaded Petrol (ULP) was affected.
In the year 2000 passenger cars and commercial vehicles will be meeting Euro I equivalent India 2000 norms, while two wheelers will be meeting one of the tightest emission norms in the world. Euro II equivalent Bharat Stage II norms are in force from 2001 in 4 metros of Delhi, Mumbai, Chennai and Kolkata.
FUEL TECHNOLOGY
18

Maximum limits for critical ingredients like Benzene level in petrol have been specified only recently and a limit of 5% m/m and 3% m/m has been set for petrol in the country and metros respectively. The high levels of pollution have necessitated eliminating leaded petrol, throughout the country
COMPETITION ANALYSIS:Competition in this industry is high. Competition in this industry is increasing. Automotive industry is a volume-driven industry, and certain critical mass is a pre-requisite for attracting the much-needed investment in research and development and new product design and development. Research and development investment is needed for innovations which is the lifeline for achieving and retaining competitiveness in the industry.
India, with a rapidly growing middle class, market oriented stable economy, availability of trained manpower at competitive cost, fairly well developed credit and financing facilities and local availability of almost all the raw materials at a competitive cost, has emerged as one of the favorite investment destinations for the automotive manufacturers.
Since inception in 1983, Maruti Suzuki India has produced and sold over 10 million vehicles in India and exported over 500,000 units to Europe and other countries. The company’s revenue for the fiscal 2010-2011 stood over Rs 375,224 million and Profits after Tax at over Rs. 22,886 million.
Fiscal year 2010-11 passenger Car sales by Auto companies
Maruti Su
zuki
Hyundai India
Tata M
otors
Mahindra & M
ahindra
General M
otors
Ford India
Toyota Kirlo
skar
Honda Siel
Volkswage
nSko
da0
200000
400000
600000
800000
1000000
1200000 1129337
365405296614
167131 109294 98637 83971 83791 51388 22503
2010-11 sales
19

Key competitors to Maruti Suzuki India Limited
1. Tata Motors Market Share: Commercial Vehicles 63.94%, Passenger Vehicles 16.45%Tata Motors entered the passenger vehicle market in 1991.
Tata Motors Limited is India’s largest automobile company, with consolidated revenues of USD 14 billion in 2008-09. It is the leader in commercial vehicles and among the top three in passenger vehicles. Tata Motors has winning products in the compact, midsize car and utility vehicle segments.With over 3,000 engineers and scientists, the company's Engineering Research Centre, established in 1966, has enabled pioneering technologies and products. It was Tata Motors, which developed the first indigenously developed Light Commercial Vehicle, India's first Sports Utility Vehicle and, in 1998, the Tata Indica, India's first fully indigenous passenger car. Within two years of launch, Tata Indica became India's largest selling car in its segment.In January 2008, Tata Motors unveiled its People's Car, the Tata Nano, which signifies a first for the global automobile industry as it is the world’s cheapest car.Tata Motors has auto manufacturing and assembly plants in Jamshedpur, Pantnagar, Lucknow, Ahmedabad, Sanand, Dharwad and Pune in India, as well as in Argentina, South Africa and Thailand. The TATA MOTORS passenger vehicles and utility vehicles include:
Tata Nano Tata Safari Tata Vista Tata Indigo Tata Manza Tata Sumo Grande Tata Indica Tata Indigo Marina Tata Winger Tata Magic Tata Xenon XT Tata Aria
TATA MOTORS’ Subsidiary brands include:
Tata Daewoo Commercial Vehicle
Hispano Carrocera
Jaguar Cars and Land Rover
20

Sales & Service Network
Tata Motors has more than 250 dealerships in more than 195 cities across 27 states and 4 Union Territories of India. It has the 3rd largest Sales and Service Network after Maruti Suzuki and Hyundai.
1. HYUNDAI MOTORS INDIA LIMITED
Market Share: Passenger Vehicles 14.15%
Hyundai Motor India Limited is a wholly owned subsidiary of the Hyundai Motor Company in India. It is the 2nd largest automobile manufacturer in India after Maruti Suzuki.
HMIL's first car, the Hyundai Santro was launched in 23 September 1998 and was a runaway success. Within a few months of its inception HMIL became the second largest automobile manufacturer and the largest automobile exporter in India. HMIL presently markets 6 models of passenger cars across segments.HMIL has two manufacturing plants in Sriperumbudur, Tamil Nadu capable of producing 600,000 vehicles annually.The Hyundai Motors products include the Santro Xing, i10, and i20, Accent, Verna Fluidic, Sonata and Santa Fe. The new fluidic Verna is expected to give the firm a leader position in upper A3 segment.
Sales and service network
As of March 2011, HMIL has 451 dealerships and more than 647 Hyundai Authorized Service Centers in 340 cities across India. HMIL also operates its own dealerships known as Hyundai Motor Plazas in large metros across India. HMIL has the second largest sales and service network in India after Maruti Suzuki.
PRODUCT PORTFOLIO ANALYSIS OF MARUTI SUZUKI AND TOP COMPETITORS:
21

1. PRODUCT DIFFERENTIATION
THE COMPANIES INCLUDE VARIOUS PRODUCTS IN THEIR PORTFOLIO.
THEY RANGE ACROSS A1, A2, A3, A4 AND SUV/MUV SEGMENTS.
COMPANY A1 A2 A3 A4 SUV/MUV
Maruti Suzuki M-800 Alto, Wagon R, A-star, Ritz, Swift
Swift Dzire, SX4
Kizashi Grand Vitara, Gypsy
Hyundai India - i10,i20,Santro Xing
Accent, Verna New
Sonata Santa Fe
Tata Motors Nano Indica Vista Indigo, Manza - Aria, Safari, Sumo
Volkswagen - Polo Vento, Jetta Passat Touareg
Ford India - Figo Fiesta - Endeavor
Chevrolet Beat, Aveo-UVA
Aveo, Optra Cruze Captiva
Honda - Jazz City Civic, Accord CRV
Toyota - - Etios Corolla, Camry Fortuner, Land-cruiser
Mahindra & Mahindra
- - Verito - Scorpio, Xylo,Bolero
Fiat Punto Linea
2. MONOPOLY
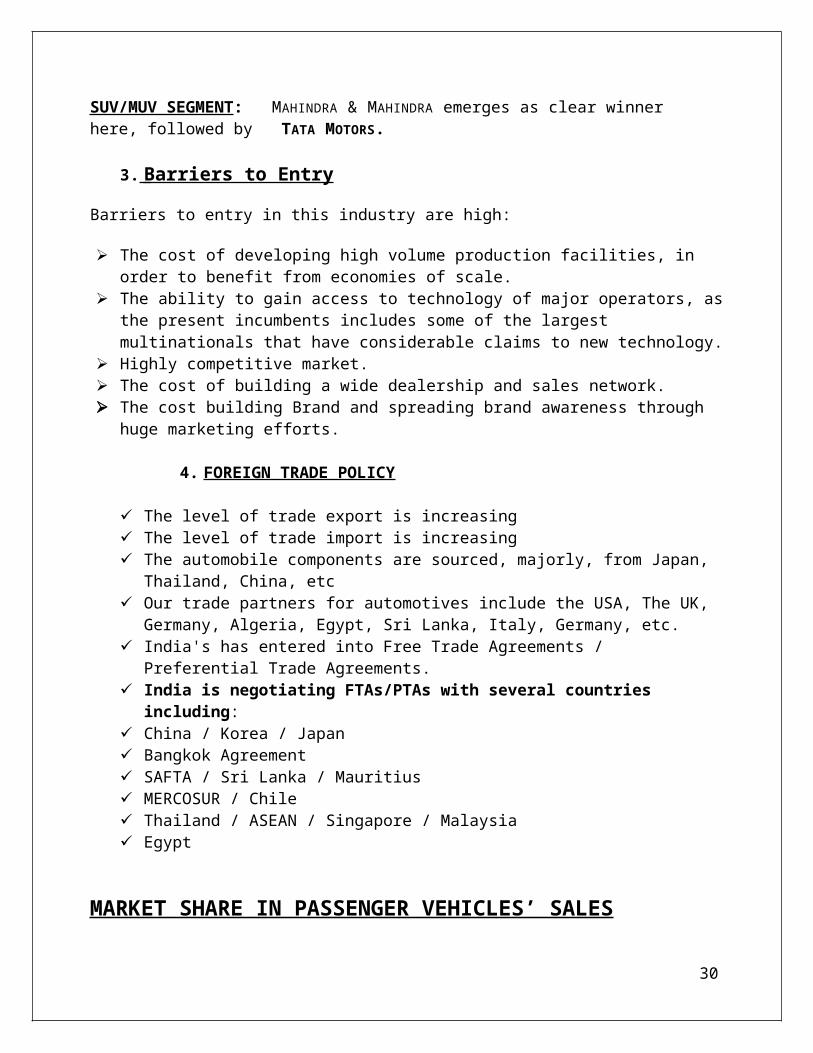
A1 SEGMENT: TATA MOTORS due to Nano sales.A2 SEGMENT: MARUTI SUZUKI due to exceptional sales of Alto, Wagon R, Swift.A3 SEGMENT: MARUTI SUZUKI due to sales figures of Swift Dzire, SX4 but they are followed closely by HYUNDAI, TATA MOTORS.A4 SEGMENT: TOYOTA AND HONDA rule this segment.SUV/MUV SEGMENT: MAHINDRA & MAHINDRA emerges as clear winner here, followed by TATA MOTORS.
3. Barriers to Entry
Barriers to entry in this industry are high:
The cost of developing high volume production facilities, in order to benefit from economies of scale.
The ability to gain access to technology of major operators, as the present incumbents includes some of the largest multinationals that have considerable claims to new technology.
Highly competitive market.
22

The cost of building a wide dealership and sales network. The cost building Brand and spreading brand awareness through huge marketing efforts.
4. FOREIGN TRADE POLICY
The level of trade export is increasing The level of trade import is increasing The automobile components are sourced, majorly, from Japan, Thailand, China, etc Our trade partners for automotives include the USA, The UK, Germany, Algeria, Egypt,
Sri Lanka, Italy, Germany, etc. India's has entered into Free Trade Agreements / Preferential Trade Agreements. India is negotiating FTAs/PTAs with several countries including: China / Korea / Japan Bangkok Agreement SAFTA / Sri Lanka / Mauritius MERCOSUR / Chile Thailand / ASEAN / Singapore / Malaysia Egypt
MARKET SHARE IN PASSENGER VEHICLES’ SALES
13.97%
44.94%
14.26%
6.79%
4.25%
2.36%
3.91%
2.05% 3.34%0.84%
MARKET SHARE IN PASSENGER VEHICLE SALES IN 2010-11
Tata MotorsMaruti Suzuki IndiaHyundai Motor IndiaMahindra and MahindraGeneral Motors IndiaHonda Siel carsFordVolkswagenToyotaFIAT
MARUTI SUZUKI’S VISION AND MISSION
23

A. Vision The Leader in the Indian Automobile Industry, Creating Customer Delight and Shareholder's Wealth; a pride of India
B. Mission/Objectives The main objectives/Missions of MSIL are:
1. CUSTOMER OBSESSION
2. FAST,FLEXIBLE AND FIRST MOVER
3. INNOVATION AND CREATIVITY
4. NETWORKING AND PARTNERSHIP
5. OPENNESS AND LEARNING
MARKET SEGMENTATION FOR INDIAN AUTOMOTIVE INDUSTRY:
DOMESTIC SALES TRENDS IN 2010-11 BASED ON DIFFERENT SEGMENTS
2520421
676408
526022
11790305
Sales of vehicles
Passenger vehiclesCommercial vehiclesThree wheelersTwo wheelers
MARKET SEGMENTATION IN AUTO INDUSTRY BY SIAM
A1 SEGMENT CAR UP TO 3400 mm
A2 SEGMENT CAR 3401 mm TO 4000 mm
A3 SEGMENT CAR 4001 mm TO 4500 mm
A4 SEGMENT CAR 4501 mm TO 4700 mm
A5 SEGMENT CAR 4701 mm TO 5000 mm
A6 SEGMENT CAR OVER 5000 mm
24

4Ps/MARKETING MIX of Maruti Suzuki India limited
PRODUCT
PRICE
PLACE
PROMOTION
PRODUCT STRATEGY:
Portfolio of 14 products
Six product lines
Product Line Products
A1 800
A2 Alto, Alto k10, Estilo ,Wagon –R, A-star, Ritz, Swift
A3 Dzire, SX4
A4 KIZASHI
SUV/MUV Grand Vitara, Gypsy, Ertiga
C – Class: VAN Omni, Eeco
PRICE STRATEGY:
The ex-showroom price of the cars ranges from INR 195028 to INR 1750000.
Maruti 800 is the lowest priced car of this company.
Alto, Omni, Eeco Wagon R, Estilo, A-star are the next higher in the price list.
Swift, Ritz and Gypsy are the mid price cars of the company.
Swift Dzire and SX4 are the value for money sedans that come next in the list based on ascending prices.
The Kizashi and Grand Vitara are the premium priced models of the company. The price of car is decided according to its product variety, quality, design etc.
PLACE OF DISTRIBUTION STRATEGY:
933 dealers spread across 668 cities for nation-wide sales.
25

353 ‘Maruti True Value’ outlets spread across 200 cities.
2946 Maruti Authorized Service Stations, covering 1400 cities.
Tie up with Adani group for exporting 200,000 units through Mundra port, Gujarat
Suggested future Place strategy :
Increase sales capacity by addition of 300 new dealers in next three years.
Add 150 new true value shops in the next three years.
Add 1200 new Maruti Authorized Service Stations in next three years.
Tie up with other distributors for Exports.
PROMOTION STRATEGY:
Advertising
TV Ads, Print Ads, Radio Ads
“Ghar Aa Gaya Hindustan”
“India Comes Home in Maruti Suzuki.”
Information Advertising
Aggressive social media presence
Sponsorships of events.
Sponsoring TV shows - India’s Got talent, Just Dance
Place Advertising – Bill boards
Sales Promotions
Product warranties, free maintenance.
Premiums (gifts), exchange bonuses, free gold coins.
Trade shows
Co-branding with major events and cricket tournaments. Like SX4 given to Dhoni as the Man of the series for a one day tournament in Sri Lanka in 2008.
3000: The number of service stations that provide customers with maintenance support in 1400 cities.
FINANCIAL STATEMENT ANALYSIS26

OF MARUTI SUZUKI INDIA LIMITED
A financial ratio (or accounting ratio) is a relative magnitude of two selected numerical values taken from an enterprise's financial statements. Often used in accounting, there are many standard ratios used to try to evaluate the overall financial condition of a corporation or other organization.
Financial ratios allow for comparisons
between companies between industries between different time periods for one company between a single company and its industry average
Ratios generally hold no meaning unless they are benchmarked against something else, like past performance or another company.
PROFITABILITY RATIOS OF MARUTI SUZUKI Profitability ratios measure the firm's use of its assets and control of its expenses to generate an acceptable rate of return.
1. GROSS PROFIT MARGIN RATIO or GPMR = GROSS PROFIT ÷ TOTAL REVENUE = (REVENUE – COGS) ÷ TOTAL REVENUE
The gross profit margin ratio, also known as gross margin, is the ratio of gross margin expressed as a percentage of sales. Gross margin, alone, indicates how much profit a company makes after paying off its Cost of Goods sold. It is a measure of the efficiency of a company using its raw materials and labor during the production process. The higher the profit margin, the more efficient a company is. A higher gross profit margin indicates that a company can make a reasonable profit on sales, as long as it keeps costs in control. Investors tend to pay more for a company with higher gross profit.
All figures in Rs. Cr. March 2008 March 2009 March 2010
Gross Profit 3071.2 2382.3 4417.5Revenue 19065 21172 30313.1
GPMR (%) 16.1% 11.25% 14.5%
REASON FOR THE TREND IN GROSS PROFIT MARGINThe gross profit decreased in 2009 from 2008 due to the increase in expenditures, expenses and costs incurred by Maruti Suzuki. Next, the profit levels bounced back in 2010 as the firm controlled its costs, expenses and increased its total revenue by over 43% from the previous year. As a result, the
27

gross profit margin ratio increased from 11.25% to 14.5% in 2010 but decreased from the level seen in 2008 due to rising expenditure cost.
2007-08 2008-09 2009-100.00%
2.00%
4.00%
6.00%
8.00%
10.00%
12.00%
14.00%
16.00%
18.00% 16.10%
11.25%
14.50%
GROSS PROFIT MARGIN
2. OPERATING PROFIT MARGIN RATIO or OPMR= OPERATING PROFIT ÷ TOTAL REVENUE= EBIT ÷ TOTAL REVENUE
The operating profit margin ratio indicates how much profit a company makes after paying for variable costs of production such as wages, raw materials, etc. It is expressed as a percentage of sales and shows the efficiency of a company controlling the costs and expenses associated with business operations.Operating profit margin ratio analysis measures a company’s operating efficiency and pricing efficiency with its successful cost controlling. The higher the ratio, the better a company is. A higher operating profit margin means that a company has lower fixed cost and a better gross margin or increasing sales faster than costs, which gives management more flexibility in determining prices.
All figures in Rs. Crores
March 2008 March 2009 March 2010
EBIT 2562.6 1726.8 3626REVENUE 19065 21172 30313.1OPMR (%) 13.44% 8.1% 11.96%
REASON FOR THE TREND IN OPERATING PROFIT MARGINThe operating profit margin dipped from 13.44% in 2008 to 8.1% in 2009 due to significant increase in depreciation by 25% along with the increase in expenditures and expenses over the previous year.
28

The sales increased in 2010 to INR 30313.1 Crores, and with better management of costs the EBIT figure increased by over 100% over the previous year to register a surge in operating profit margin from 8.1% to 11.96%.
2007-08 2008-09 2009-100.00%
2.00%
4.00%
6.00%
8.00%
10.00%
12.00%
14.00%13.44%
8.10%
11.96%
OPERATING PROFIT MARGIN
3. NET PROFIT MARGIN RATIO or NPMR= NET INCOME ÷ TOTAL REVENUE= (EBT – TAX) ÷ TOTAL REVENUE
The net profit margin, also known as net margin, indicates how much net income a company makes with total sales achieved. A higher net profit margin means that a company is more efficient at converting sales into actual profit. With net profit margin ratio all costs are included to find the final benefit of the income of a business.Net margin measures how successful a company has been at the business of making a profit on each rupee sales. It is one of the most essential financial ratios. The higher the ratio, the more effective a company is at cost control.
All figures in Rs. Crores March 2008 March 2009 March 2010
NET INCOME 1730.8 1218.7 2497.6
REVENUE 19065 21172 30313.1
NPMR 9% 5.7% 8.2%
REASON FOR THE TREND IN NET PROFIT MARGIN RATIODue to high depreciation and higher expenses in 2009 compared to 2008, the net profit declined by 3.3%. The net profit increased by over 100% in 2010 from 2009. The revenue, too, increased in 2010
29
from 21172 Crores to 30313.1 Crores and thus, the profit margin saw an increase over the previous year by 2.5% to close at, healthy, 8.2%. The tax burden stayed near 30% in each year.
2007-08 2008-09 2009-100%
1%
2%
3%
4%
5%
6%
7%
8%
9%
9.00%
5.70%
8.20%
NET PROFIT MARGIN RATIO
4. RETURN ON NET WORTH OR RETURN ON EQUITY RATIO= NET INCOME ÷ TOTAL SHAREHOLDERS’ FUND
Return on equity, defined also as return on net worth (RONW), reveals how much profit a company earned in comparison to the money a shareholder has invested. It tells investors how effectively their capital is being reinvested. A company with high return on equity is more successful to generate cash internally. Investors are always looking for companies with high and growing returns on equity. The higher the ratio, the better a company is.
All figures in Rs. Crores March 2008 March 2009 March 2010
NET INCOME 1730.8 1218.7 2497.6TOTAL EQUITY 8415.4 9344.9 11835.1
ROE 20.56% 13.04% 21.1%
REASON FOR THE TREND IN RETURN ON EQUITYThe total equity held by Maruti Suzuki increased consistently over the three from an initial of 8415.4 Crores to final 11835.1 Crores in 2010. Next, the net income dipped in 2009 as a result of higher expenditure and expenses incurred along with a high depreciation cost compared to the previous year. The net income increased considerably in 2010 and this has been the chief reason for the increase in the return on equity from 13.04% in 2009 to 21.1% in 2010. The final figure shows a good return on equity for the shareholders and investors of Maruti Suzuki.
30

2007-08 2008-09 2009-100.00%
5.00%
10.00%
15.00%
20.00%
25.00%20.56%
13.04%
21.10%
RETURN ON EQUITY
5. RETURN ON ASSETS RATIO or ROA= NET INCOME ÷ TOTAL ASSETS
The return on assets (ROA) percentage shows how profitable a company's assets are in generating revenue. This number tells you what the company can do with what it has, i.e. how many rupee of earnings they derive from each rupee of assets they control. Return on assets gives an indication of the capital intensity of the company, which will depend on the industry; companies that require large initial investments will generally have lower return on assets.The higher the ratio, the better it is for the firm.
All figures in Rs. Crores March 2008 March 2009 March 2010
NET INCOME 1730.8 1218.7 2497.6
TOTAL ASSETS 9315.6 10043.8 12656.5
ROA 18.5% 12.1% 19.7%
REASON FOR THE TREND IN RETURN ON ASSETS
The total assets under control of Maruti Suzuki increased from 9315.6 Crores in 2008 to 12656.5 Crores in 2010 due to the increase in shareholders fund and the reserves and surplus. Next, the net income also saw a dip in 2009 leading to a decline in ROA from 18.5% to 12.1%. The net income increased in 2010 on account of higher revenue leading to the increase in the ratio from 12.1% to a good and healthy 19.7%.
31

2007-08 2008-09 2009-100.00%
2.00%
4.00%
6.00%
8.00%
10.00%
12.00%
14.00%
16.00%
18.00%
20.00%18.50%
12.10%
19.70%
RETURN ON ASSETS
LIQUIDITY RATIOS OF MARUTI SUZUKI Liquidity ratios measure the availability of cash to pay debt.
1. CURRENT RATIO= CURRENT ASSETS ÷ CURRENT LIABILITIESCurrent ratios are commonly explained as a measure of a company's ability to pay the current debt liabilities. For the lenders, current ratio is very helpful to determine whether a company has a sufficient level of liquidity to pay liabilities. They would prefer a high current ratio since it reduces their risk. More importantly, investors should look at the trend of the current ratio of the company, types of current assets the company has and how quickly these can be converted into cash to meet company’s current liabilities.
All figures in Rs. Crores March 2008 March 2009 March 2010
CURRENT ASSETS 3197.5 5588.9 3856
CURRENT LIABLITIES 3095.4 3650.5 3788.4
CURRENT RATIO(times) 1.03 1.53 1.01
REASON FOR THE TREND IN CURRENT RATIOThe current ratio increased from 1.03 in 2008 to 1.53 in 2009 on the back of increase in the current assets to over 5500 Crores due to high cash and bank balances along with high loans and advances for the firm. The ratio dipped in 2010 as the company went on to use it cash and bank balances for the research and development of the new models like wagon R etc. As a result, the current assets decreased to 3856 Crores in 2010 and the current ratio declined to 1.01, despite good revenues.
32

2007-08 2008-09 2009-100
0.2
0.4
0.6
0.8
1
1.2
1.4
1.6
1.03
1.53
1.01
CURRENT RATIO
2. QUICK RATIO OR ACID TEST RATIO= Quick assets / Current liabilities= (Current assets – Inventories) / Current liabilities
The quick ratio, defined also as the acid test ratio, reveals a company's ability to meet short-term operating needs by using its liquid assets. In theory, the higher the ratio is, the better the position of the company is.Quick ratios are often explained as measures of a company’s ability to pay their current debt liabilities without relying on the sale of inventory.
All figures in Rs. Crores March 2008 March 2009 March 2010QUICK ASSETS 2159.5 4686.6 2647.2CURRENT LIABILITIES 3095.4 3650.5 3788.4QUICK RATIO(times) 0.697 1.28 0.698
REASON FOR THE TREND IN QUICK RATIOThe quick ratio increased from 0.697 to 1.28 due the increase in current assets and the decrease in the inventories held by Maruti Suzuki. But, the ratio decreased from 1.28 in 2009 to 0.698 in 2010 on the back of increase in the inventories and a decrease in current assets. The figure of 0.698 will improve as the new model launches will improve the cash and bank balances of Maruti Suzuki which will further increase its current assets.
33

2007-08 2008-09 2009-100
0.2
0.4
0.6
0.8
1
1.2
1.4
0.697
1.28
0.698
QUICK RATIO
3. CASH RATIO
= (CASH AND MARKETABLE SECURITIES) / CURRENT LIABILITIES
The cash ratio measures the liquidity of a company by calculating the ratio between all cash and cash equivalents assets and current liabilities. It measures the most liquid of all assets against current liabilities. It is an indicator of the extent to which a company can pay current liablities without relying on the sale of inventory or receipts of account receivables. A strong cash ratio is useful to creditors when deciding how much debt, if any, they would be willing to extend to the asking party.
All figures in Rs. Crores March 2008 March 2009 March 2010
CASH 330.5 1939 98.2CURRENT LIABILITY 3095.4 3650.5 3788.4
CASH RATIO 10.6% 53.1% 2.5%
REASON FOR THE TREND IN CASH RATIOThe cash ratio jumped astronomically from 10.6% in 2008 to 53.1% in 2009 due to high cash balance at bank because of good revenues earned by Maruti Suzuki in 2008 and 2009. But, the cash at bank decreased from 1939 Crores to just 98.2 Crores in 2010 due to high research and development costs and huge marketing expenses, bringing down the ratio to only 2.5%. The ratio would improve post 2011 with the launch of new models.
34

2007-08 2008-09 2009-100.00%
10.00%
20.00%
30.00%
40.00%
50.00%
60.00%
10.60%
53.10%
2.50%
CASH RATIO
4. OPERATIONAL CASH FLOW RATIO or OCFR= OPERATIONAL CASH FLOW ÷ CURRENT LIABLITIESA measure of how well current liabilities are covered by the cash flow generated from a company's operations. The operating cash flow ratio can gauge a company's liquidity in the short term. If the operating cash flow ratio is less than one, it means that the company has generated less cash over the year than it needs to pay off short term liabilities as at the year end.
All figures in Rs. Crores March 2008 March 2009 March 2010
CASH FLOW 1830.4 1193.3 2887.4CURRENT LIABILITY 3095.4 3650.5 3788.4
OCFR 59% 32% 76%
REASON FOR THE TREND IN OPERATIONAL CASH FLOW RATIOThe cash flow from operations at Maruti Suzuki decreased from 1830.4 Crores in 2008 to 1193.3 Crores in 2009 because of the decrease in net profit before tax. As a result, the operational cash flow ratio decreased to 0.32 in 2009. The ratio increased in 2010 to 0.76 on the back of an increased net profit before tax. The ratio of 0.76 augurs well and indicates that the firm can take care of its current liabilities using the cash flow from operations.
35

2007-08 2008-09 2009-100%
10%
20%
30%
40%
50%
60%
70%
80%
59%
32%
76%
OPERATIONAL CASH FLOW RATIO
ACTIVITY RATIOS OF MARUTI SUZUKI Activity ratios measure how quickly a firm converts non-cash assets to cash assets.
A. DEGREE OF OPERATING LEVERAGE RATIO= (% CHANGE IN EBIT) ÷ (% CHANGE IN SALES)A type of leverage ratio summarizing the effect a particular amount of operating leverage has on a company's earnings before interest and taxes (EBIT). The higher the degree of operating leverage, the more volatile the EBIT figure will be relative to a given change in sales, all other things remaining the same.Operating leverage is a measure of how sensitive net operating income is to percentage changes in sales. Operating leverage acts as a multiplier. If operating leverage is high, a small percentage increase in sales can produce a much larger percentage increase in net operating income. It is high near the breakeven point and decreases as the sales and profit increase.
All figures in Rs. CroresMarch 2008 March 2009 March 2010
EBIT 2562.6 1726.8 3626SALES 21025.2 23180.6 31947.7D.O.L (TIMES) 0.90 0.60 1.52
REASON FOR THE TREND IN DEGREE OF OPERATING LEVERAGEThe degree of operating leverage decreased from 0.90 in 2008 to 0.60 in 2009 on account of decrease in EBIT from 2562.6 Crores to 1726.8 Crores. But, in 2010, it increased to 1.52 due to the high sales turnover of 31947.7 Crores and more than 100% rise in EBIT to 3626 Crores. The degree of operating leverage stands at a healthy 1.52 for Maruti Suzuki.
36

2007-08 2008-09 2009-100
0.2
0.4
0.6
0.8
1
1.2
1.4
1.6
0.9
0.600000000000001
1.52
DEGREE OF OPERATING LEVERAGE
B. ASSET TURNOVER RATIO or ATR= NET SALES ÷ TOTAL ASSETS
Asset turnover is a financial ratio that measures the efficiency of a company's use of its assets in generating sales revenue or sales income to the company.Asset turnover measures a firm's efficiency at using its assets in generating sales- the higher the number the better.The higher the ratio, the more sales that a company is producing based on its assets. Thus, a higher ratio would be preferable to a lower one.
All figures in Rs. Crores March 2008 March 2009 March 2010
NET SALES 17891.6 20453.7 29098.9TOTAL ASSETS 9315.6 10043.8 12656.5RATIO( TIMES) 1.92 2.03 2.29
REASON FOR THE TREND IN ASSET TURNOVER RATIO
The net sales increased from 17891.6 Crores in 2008 to 29098.9 Crores in 2010 on account of high sales turnover, while the total assets increased from 9315.6 Crores in 2008 to 12656.5 Crores in 2010 on account of increase in reserves and surpluses, taking the asset turnover ratio from 1.92 to 2.29, in the given period.
37

2007-08 2008-09 2009-101.7
1.8
1.9
2
2.1
2.2
2.3
1.92
2.03
2.29
ASSET TURNOVER RATIO
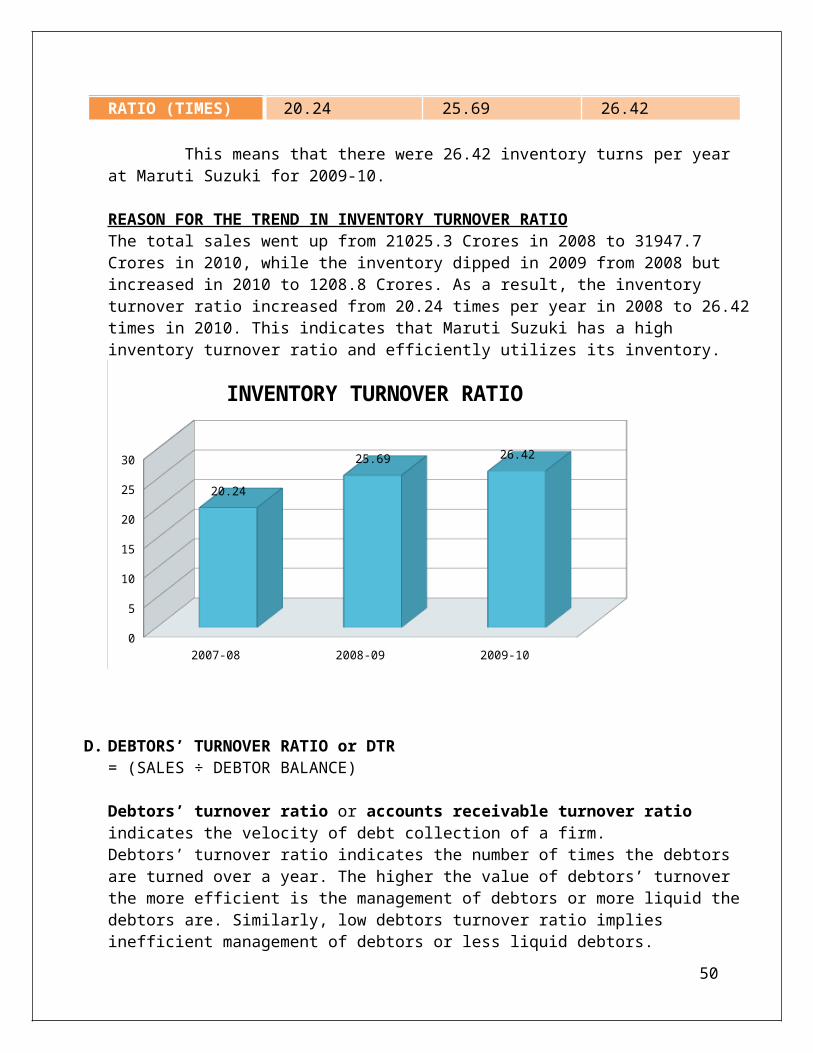
C. INVENTORY TURNOVER RATIO or ITR= TOTAL SALES ÷ INVENTORY
Inventory turnover ratio, defined as how many times the entire inventory of a company has been sold during an accounting period, is a major factor to success in any business that holds inventory. In general, a higher inventory turnover is better because inventories are the least liquid form of asset.A low inventory turnover ratio shows that a company may be overstocking or deficiencies in the product line or marketing effort. Higher inventory turnover ratios are considered a positive indicator of effective inventory management.It, thus, indicates how successful a firm is in utilizing its assets in generation of sales revenue.
All figures in Rs. Crores March 2008 March 2009 March 2010
TOTAL SALES 21025.2 23180.6 31947.7INVENTORY 1038 902.3 1208.8
RATIO (TIMES) 20.24 25.69 26.42
This means that there were 26.42 inventory turns per year at Maruti Suzuki for 2009-10.
REASON FOR THE TREND IN INVENTORY TURNOVER RATIOThe total sales went up from 21025.3 Crores in 2008 to 31947.7 Crores in 2010, while the inventory dipped in 2009 from 2008 but increased in 2010 to 1208.8 Crores. As a result, the inventory turnover ratio increased from 20.24 times per year in 2008 to 26.42 times in 2010. This indicates that Maruti Suzuki has a high inventory turnover ratio and efficiently utilizes its inventory.
38

2007-08 2008-09 2009-100
5
10
15
20
25
30
20.24
25.69 26.42
INVENTORY TURNOVER RATIO
D. DEBTORS’ TURNOVER RATIO or DTR= (SALES ÷ DEBTOR BALANCE)
Debtors’ turnover ratio or accounts receivable turnover ratio indicates the velocity of debt collection of a firm.Debtors’ turnover ratio indicates the number of times the debtors are turned over a year. The higher the value of debtors’ turnover the more efficient is the management of debtors or more liquid the debtors are. Similarly, low debtors turnover ratio implies inefficient management of debtors or less liquid debtors.
All figures in Rs. Crores March 2008 March 2009 March 2010
SALES 21025.3 23180.6 31947.7DEBTOR BALANCE 655.5 937.8 809.9RATIO (TIMES) 32.07 24.71 39.44
REASON FOR THE TREND IN DEBTORS TURNOVER RATIO
The debtor balance increased significantly from 655.5 Crores in 2008 to 937.8 Crores in 2009 leading to a drop in the debtors turnover ratio, but the debtor balance decreased to 809.9 Crores in 2010 causing an upward movement in the ratio from 24.71 times in 2009 to 39.44 times in 2010. This indicates that the debtors were turned over almost 40 times (once every 9 days) in 2009-10 and Maruti Suzuki has more liquid debtors.
39

2007-08 2008-09 2009-100
5
10
15
20
25
30
35
4032.07
24.71
39.44
DEBTORS' TURNOVER RATIO
LEVERAGE RATIOS FOR MARUTI SUZUKI Debt ratios measure the firm's ability to repay long-term debt.
A. DEBT RATIO=TOTAL DEBT ÷ TOTAL ASSETS
Debt ratio, defined as an expression of the relationship between a company’s total debt and assets, is a measure of the ability to service the debt of a company. It indicates what proportion of a company’s financing asset is from debt, making it a good way to check a company’s long-term solvency. In general, a lower ratio is better. Value of 1 or less in debt ratios shows good financial health of a company.The lower the company's reliance on debt for asset formation, the less risky the company is.
All figures in Rs. Crores March 2008 March 2009 March 2010
TOTAL DEBT 900.2 698.9 821.4TOTAL ASSETS 9315.6 10043.8 12656.5DEBT RATIO (TIMES) 0.096 0.069 0.064
REASON FOR THE TREND IN DEBT RATIO
The total debt went down from 900.2 Crores in 2008 to 698.9 Crores in 2010 leading to a drop in debt ratio from 0.096 to 0.069, while the debt increased in 2010 to 821.1 Crores, the total assets increased significantly leading to a further decline in Maruti Suzuki's debt ratio to 0.064, which represents the fact that the firm has a low debt burden. The ratio is much less than 1, so Maruti Suzuki has a good financial standing.
40

2007-08 2008-09 2009-100
0.01
0.02
0.03
0.04
0.05
0.06
0.07
0.08
0.09
0.10.096
0.069 0.0640000000000001
DEBT RATIO
B. DEBT TO EQUITY RATIO= TOTAL DEBT ÷ TOTAL EQUITY
Debt to equity ratio is defined as an indication of management’s reliance to finance its asset on debt rather than on equity. It measures a company’s capacity to repay its creditors. The debt ratio means an indication of the gearing level of a company. A high ratio means that a company may be over-leveraged with debt. This can result in high insolvent risk since excessive debt can lead to a heavy debt repayment burden. However, when a company chooses to rely largely on equity, they may lose the tax reduction benefit of interest payments.
All figures in Rs. Crores March 2008 March 2009 March 2010
TOTAL DEBT 900.2 698.9 821.4
TOTAL EQUITY 8415.4 9344.9 11835.1
RATIO(TIMES) 0.106 0.074 0.069
REASON FOR THE TREND IN DEBT TO EQUITY RATIO
The total debt present in the financing structure of Maruti Suzuki has gone down from 900.2 Crores in 2008 to 821.4 Crores in 2010. On the other hand, the total equity has moved up from 8415.4 Crores in 2008 to 11835.1 Crores in 2010. As a result of both the trends, the debt to equity ratio has come down from 0.106 in 2008 to 0.069 in 2010. Thus, the firm uses low debt to finance its operations compared to equity.
41

2007-08 2008-09 2009-100
0.02
0.04
0.06
0.08
0.1
0.12 0.106
0.0740.069
D-E RATIO
C. LONG TERM DEBT TO TOTAL ASSET RATIO= LONG TERM DEBTS ÷ TOTAL ASSETS
The Long Term Debt to total asset ratio is an indication of what portion of a company's total assets is financed from long term debt. Long term debt to total asset ratio explains the extent to which a company is using long term debt. It is an indicator of the long-term solvency of a company. The higher the level of long term debt, the more important it is for a company to have positive revenue and steady cash flow.
All figures in Rs. Crores March 2008 March 2009 March 2010DEBT 539.5 534.5 364ASSETS 9315.6 10043.8 12656.5RATIO(TIMES) 0.057 0.053 0.028
REASON FOR THE TREND IN LONG TERM DEBT TO TOTAL ASSET RATIO
The long term debt used by Maruti Suzuki has moved down, considerably, from 539.5 Crores in 2008 to just 364 Crores in 2010. Next, the level of total assets has increased from 9315.6 Crores to 12656.5 Crores in the same period. As a result, the long term debt to total asset ratio has decreased from 0.05 to 0.02 for the given period. A debt burden of just 0.02 indicates that Maruti Suzuki is not reliant on long term debt for financing its operations. This means they are financially strong despite very low debt.
42

2007-08 2008-09 2009-100
0.01
0.02
0.03
0.04
0.05
0.060.057
0.053
0.028
LONG TERM DEBT TO ASSETS
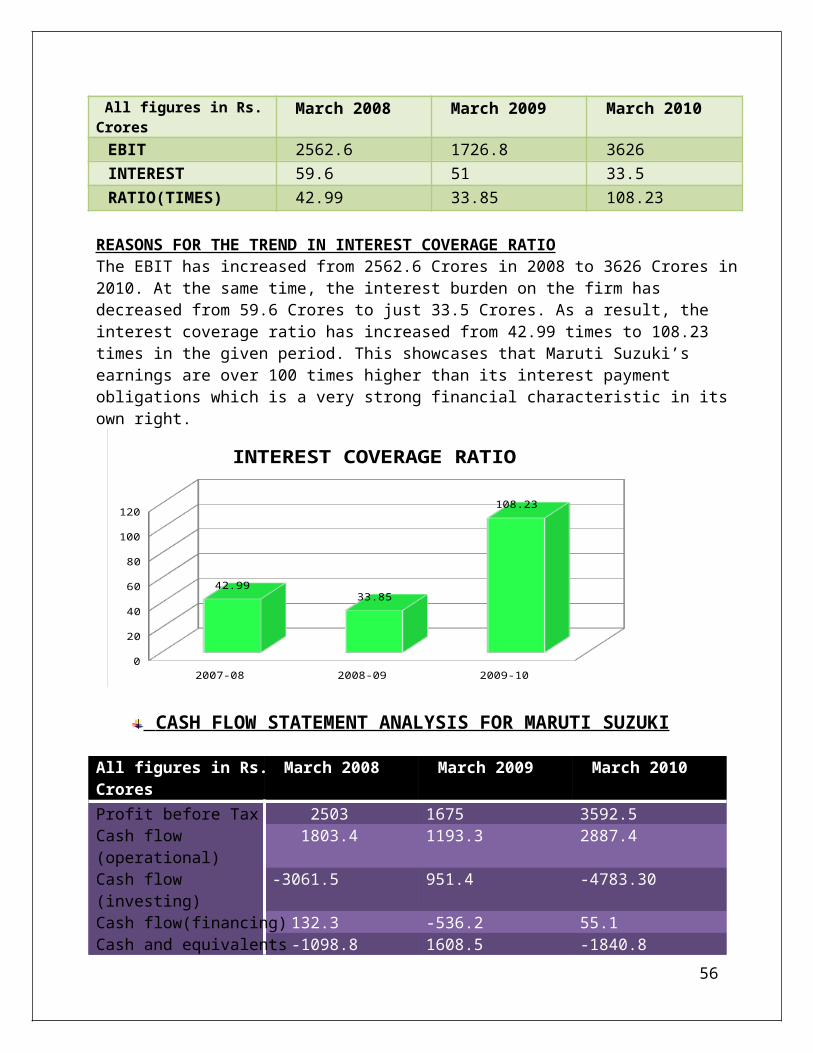
D. INTEREST COVERAGE RATIO= EBIT ÷ TOTAL INTERESTTime interest earned ratio (TIE), also known as interest coverage ratio, indicates how well a company can cover its interest payments on a pretax basis. The larger the time interest earned, the more capable the company is at paying the interest. A high ratio means that a company is able to meet its interest obligations because earnings are significantly greater than annual interest obligations.A lower times interest earned ratio means fewer earnings are available to meet interest payments.
All figures in Rs. Crores March 2008 March 2009 March 2010
EBIT 2562.6 1726.8 3626
INTEREST 59.6 51 33.5
RATIO(TIMES) 42.99 33.85 108.23
REASONS FOR THE TREND IN INTEREST COVERAGE RATIOThe EBIT has increased from 2562.6 Crores in 2008 to 3626 Crores in 2010. At the same time, the interest burden on the firm has decreased from 59.6 Crores to just 33.5 Crores. As a result, the interest coverage ratio has increased from 42.99 times to 108.23 times in the given period. This showcases that Maruti Suzuki’s earnings are over 100 times higher than its interest payment obligations which is a very strong financial characteristic in its own right.
43

2007-08 2008-09 2009-100
20
40
60
80
100
120
42.9933.85
108.23
INTEREST COVERAGE RATIO
CASH FLOW STATEMENT ANALYSIS FOR MARUTI SUZUKI
All figures in Rs. Crores March 2008 March 2009 March 2010
Profit before Tax 2503 1675 3592.5Cash flow (operational) 1803.4 1193.3 2887.4Cash flow (investing) -3061.5 951.4 -4783.30Cash flow(financing) 132.3 -536.2 55.1Cash and equivalents -1098.8 1608.5 -1840.8Opening balance 1422.8 330.5 1939Closing balance 324 1939 98.2
The cash flow indicates the financial position of the company. It showcases how the company is utilizing the cash for its operations, investments and financing activities.Maruti Suzuki utilizes its cash efficiently. The net cash from operations has increased from 1803.4 Crores in 2008 to 2887.4 Crores on account of increase in inventories, depreciation etc.The net cash flow from investments decreased in the same period on account of decrease in sale of investments, increase in purchase of investments etc.The net cash flow from financing activities decreased in the same period on account of decrease in proceeds from short term borrowings.Finally, net profit before tax increased by 43% from 2503 Crores in 2008 to 3592.5 Crores in 2010.
44

COMPETITOR ANALYSIS
FINANCIAL COMPARISON OF MARUTI SUZUKI WITH TATA MOTORS
TOTAL PASSENGER CAR SALES COMPARISON
1129337
296614
PASSENGER CAR SALES 2010-11
MARUTI SUZUKI TATA MOTORS
TOTAL SALES COMPARISON (Rs. Crores)
2007-08 2008-09 2009-100
5000
10000
15000
20000
25000
30000
35000
40000
45000
21025.223180.6
31947.732885.03
28503.91
38357.26
MARUTI SUZUKITATA MOTORS
45

NET SALES COMPARISON (Rs. Crores)
2007-08
2008-09
2009-10
0 5000 10000 15000 20000 25000 30000 35000 40000
17891.5999999999
20453.7
29098.9
28537.99
25565.43
35586.28
TATA MOTORSMARUTI SUZUKI
PROFIT AFTER TAX COMPARISON (Rs. Crores)
2007-08 2008-09 2009-100
500
1000
1500
2000
2500
3000
3500
4000
4500
5000
1730.81218.7
2497.6
2028.92
1001.26
2240.08
TATA MOTORSMARUTI SUZUKI
46

PROFITABLITY RATIOS ANALYSIS AND COMPARISONS
1. GROSS PROFIT MARGIN RATIO OR GPMR COMPARISON
March 2008 March 2009 March 2010GPMR (%), MARUTI SUZUKI
16.1 11.25 14.5
GPMR (%), TATA MOTORS
8.26 3.30 8.84
RATIO COMPARISONThe ratio at Maruti Suzuki, overall, decreased from the high of 16.1% in 2008 to 14.5% in 2010 with the effect of increasing interest rates and a higher fuel cost for the consumer, while the ratio at Tata motors dipped in 2009 and then climbed in 2010 on the account of higher revenues. But, the fact that Tata motors incurs a higher expenditure, expenses, employee costs, excise duty etc. compared to Maruti Suzuki has led to a smaller gross profit margin ratio of 8.84%.
2. OPERATING PROFIT MARGIN RATIO OR OPMR COMPARISON
March 2008 March 2009 March 2010
OPMR (%), MARUTI SUZUKI
13.44% 8.1% 11.96%
OPMR (%), TATA MOTORS
10.53% 6.71% 11.74%
RATIO COMPARISONThe ratio at Maruti Suzuki stood at 11.96% in 2010, while the ratio at Tata motors stood at 11.74%. Tata motors incurred a higher depreciation cost, in all the three years, after taking out the costs from revenues. Thus, despite having higher revenue than Maruti Suzuki, the Tata motors lose out due to high costs and depreciation.
3. NET PROFIT MARGIN RATIO OR NPMR COMPARISON
March 2008 March 2009 March 2010
NPMR (%), MARUTI SUZUKI
9% 5.7% 8.2%
NPMR (%), TATA MOTORS
6.96% 3.77% 6.26%
RATIO COMPARISONThe net profit margin at Tata motors decreased in 2009 on account of high interest payments, high depreciation and high raw material costs. The ratio increased in 2010 due to the higher revenues
47

earned by Tata motors that year. The presence of a large employee cost, high depreciation and interest burden puts Tata motors behind Maruti Suzuki in net profit margin ratio, too.
4. RETURN ON NET WORTH OR RETURN ON EQUITY OR ROE COMPARISON
March 2008 March 2009 March 2010
ROE (%), MARUTI SUZUKI
20.56% 13.04% 21.1%
ROE (%), TATA MOTORS
21.18% 7.45% 9.61%
RATIO COMPARISONThe shareholders funds at Tata motors have increased from 7813.99 Crores in 2008 to 14940.84 Crores in 2010, but the net profit has not increased substantially and thus, the ratio at Tata motors has decreased from 21.18% to 9.61%. The ratio is behind the return seen in Maruti Suzuki as the firm is able to efficiently manage its expenditure and costs, much better than Tata motors.
LIQUIDITY RATIOS ANALYSIS AND COMPARISONS
1. CURRENT RATIO COMPARISON
March 2008 March 2009 March 2010
CURRENT RATIO, MARUTI SUZUKI
1.03 1.53 1.01
CURRENT RATIO, TATA MOTORS
0.89 0.83 0.63
RATIO COMPARISONThe current ratio for Tata motors decreased from 0.89 in 2008 to 0.83 in 2009 due to the decrease in current assets like cash and bank balances along with an increase in the current liabilities. The ratio dropped to 0.63 due to increase in current liabilities on account of higher provisions for debts etc. The current ratio of Tata motors is weaker than the current ratio in the same period for Maruti Suzuki.
2. QUICK RATIO COMPARISON
March 2008 March 2009 March 2010
QUICK RATIO, MARUTI SUZUKI
0.697 1.28 0.698
QUICK RATIO, TATA MOTORS
0.69 0.65 0.49
RATIO COMPARISON
48

The quick ratio for Tata motors decreased marginally in 2009 and dropped further in 2010 due to rising level of inventories that went up to 2935.59 Crores. Despite lesser inventory, Maruti Suzuki manages to show a better quick ratio in the same period on account of efficient inventory utilization.
3. CASH RATIO COMPARISON
March 2008 March 2009 March 2010
CASH RATIO, MARUTI SUZUKI
10.6% 53.1% 2.5%
CASH RATIO, TATA MOTORS
19.9% 8.8% 8.9%
RATIO COMPARISONThe cash ratio at Tata motors declined from 19.9% in 2008 to 8.9% in 2010 due to the decrease in cash and cash equivalents from 2397 Crores to 1753.6 Crores. On the other hand, Maruti Suzuki went up to 53.1% in 2009 but dropped significantly to 2.5% in 2010 on account of cash usage for research and development activity. Thus, Tata motors stands ahead of Maruti Suzuki in terms of cash ratio for the given period.
ACTIVITY RATIOS ANALYSIS AND COMPARISON S
1. ASSETS TURNOVER RATIO OR ATR COMPARISON
March 2008 March 2009 March 2010
ATR, MARUTI SUZUKI
1.92 2.03 2.29
ATR, TATA MOTORS
2.06 1.02 1.13
RATIO COMPARISONThe net sales at Tata motors have increased from 28537.99 Crores in 2008 to 35586.21 Crores in 2010. While the total assets have increased from 14094.51 Crores to 28409.42 Crores in the same period and thus, the ratio has come down from 2.06 to 1.13, whereas for Maruti Suzuki the ratio has moved up from 1.92 to 2.29 on account of high sales and lesser total assets compared to Tata motors.
2. INVENTORY TURNOVER RATIO OR ITR COMPARISON
March 2008 March 2009 March 2010
ITR, MARUTI SUZUKI
20.42 25.69 26.42
ITR, TATA MOTORS
14.44 13.47 13.07
RATIO COMPARISON
49
The level of inventory at Tata motors has gone up from 2421.83 Crores in 2008 to 2935.59 Crores in 2010. This has put pressure on the inventory turnover ratio, despite increase in sales. As a result, the ratio has come down, slowly and steadily, from 14.44 times to 13.07 times in the given period. Compared to Maruti Suzuki, Tata motors loses out. The same ratio in Maruti Suzuki went up from 20.42 times to 26.42 times in 2010.
3. DEBTORS TURNOVER RATIO OR DTR COMPARISON
March 2008 March 2009 March 2010
DTR, MARUTI SUZUKI
32.07 24.71 39.44
DTR, TATA MOTORS
30.08 19.11 18.02
RATIO COMPARISONThe Tata motors lose out in debtors’ turnover ratio too. The Tata motors tends to have a large quantity of debtors balance in its current account which stands at 2391.92 Crores in 2010 and thus, despite increase in sales its debtors turnover ratio steps down from 30.08 times in 2008 to just 18.02 times in 2010. Maruti Suzuki again impresses with a climb in the ratio from 32.07 to 39.44 due to very less debtor balance of 809.9 Crores.
LEVERAGE RATIOS ANALYSIS AND COMPARISONS
1. DEBT TO EQUITY RATIO OR D-E RATIO COMPARISON
March 2008 March 2009 March 2010
D-E RATIO, MARUTI SUZUKI
0.106 0.074 0.069
D-E RATIO, TATA MOTORS
0.80 1.06 1.11
RATIO COMPARISONThe debt burden of Tata motors has increased from 6280 Crores in 2008 to 16625 Crores in 2010. On the other hand its equity has increased from 7839 Crores to 14965 Crores in the same period. As a result of higher debt in its finance structure, Tata motors’ debt to equity ratio has increased from 0.80 to 1.11, while Maruti’s ratio has decreased from 0.106 to 0.069 indicating a lower reliance on debts.
2. DEBT RATIO COMPARISON
March 2008 March 2009 March 2010
50

DEBT RATIO, MARUTI SUZUKI
0.096 0.069 0.064
DEBT RATIO, TATA MOTORS
0.445 0.494 0.474
RATIO COMPARISONTata motors use higher debt in their financing plans and thus, have a high debt ratio compared to Maruti Suzuki. Tata motors have a 47.4% debt in their total assets while Maruti Suzuki has only 6.4% debt in their total assets.
3. INTEREST COVERAGE RATIO OR ICR COMPARISON
March 2008 March 2009 March 2010
ICR, MARUTI SUZUKI
42.99 33.85 108.23
ICR, TATA MOTORS
6.28 2.43 2.77
RATIO COMPARISONThe interest burden for Tata motors stands at 1246.23 Crores in 2010 compared to 33.5 Crores for Maruti Suzuki in 2010. As a result, the interest coverage ratio for Tata motors is significantly lower than that of Maruti Suzuki, despite higher sales turnover.
CASH FLOW STATEMENT COMPARISONS
1. The net profit before tax increased from 2028 Crores in 2008 to 2240 Crores in 2010 for Tata motors, while it increased from 2503 Crores to 3592.5 Crores in the same period for Maruti Suzuki, indicating that Maruti registered a higher net profit.
2. The net cash and cash equivalents decreased from 1585 Crores in 2008 to 86 Crores in 2010 for Tata motors, while it decreased from -1098 Crores to -1840 Crores for Maruti Suzuki indicating that the former had positive net cash balance while the latter had a negative cash balance.
3. The net cash from operating activities increased from 1830 Crores in 2008 to 2887 Crores in 2010, while for Tata motors, in the same period, it increased from 6174 Crores to 6586 Crores.
RESEARCH PROJECT
51

The research project for summer internship can be divided into the following three stages:
STAGE 1: COMPETITIOR ANALYSIS OF MARUTI SX4 CAR
STAGE 2: CUSTOMER PROFILING OF MARUTI SX4 CAR
STAGE 3: SWOT ANALYSIS OF MARUTI SUZUKI INDIA LIMITED
STAGE 1
52

COMPETITION ANALYSIS OF MARUTI SX4
PROJECT DISCRIPTION
The first stage of the corporate internship project aims to analyze the level of competition that Maruti SX4 is getting from its competitors in the A3 segment.
The goal is to find how exactly our competitors are pushing their product against the SX4.
The method I used was going over to the dealers of the competitors posing as a customer to extract key attributes and point of sales information about their product and compare them vis-à-vis our SX4.
The SX4 faces stiff competition from the likes of the following:
1. Hyundai Verna
2. Ford Fiesta
3. Fiat Linea
4. Volkswagen Vento
5. Honda City
Let us compare our product Maruti Suzuki SX4 with each of the competition products on the following parameters:
1. What is the sales pitch for the competitor’s car? 2. How is the competitor firm positioning it’s product against the Maruti SX4? 3. How long is its waiting period? 4. Is there any discount available for the car in competition with SX4?
PROJECT ANALYSIS:
53

1. Maruti Suzuki SX4 v/s Hyundai Verna
SHOWROOMS VISITED:
1. HANS HYUNDAI, MOTI NAGAR2. HIMGIRI HYUNDAI, WAZIR PUR INDUSTRIAL AREA 3. DEEP HYUNDAI, MONGOLPURI
LAUNCH DATE OF NEW VERNA: 11TH MAY, 2011
Sales executive: Mr. Sandeep, 9971590877
Sales pitch for Hyundai Verna Fluidic:
1. The mileage of 21-22 km/l based on ARAI tests. 2. The class best features including a max. Power of 123 PS at 4,000 rpm and highest torque
of 24kgm at the rate of 1900-2750 rpm.3. It will have 6 airbags, Push-button start, tilt-steering, all-controls based on steering from
Bluetooth to the music system.4. A strikingly good looking appearance for its class .5. Verna comes with 6 gears so it offers higher mileage .6. Aggressive pricing for Verna from rupees 7 lac to rupees 10 lac.
Sales pitch for Verna against SX4:
1. The max. Power of SX4 is 90 PS at 4000 rpm, which is below Verna .2. The front and rear seating in SX4 is not comfortable enough which translates into a lesser
comfort level for the driver and the passengers on long routes.3. Technical specifications in Verna are ahead of what we have seen in SX4.
Overall, the sales guy refused to acknowledge SX4 as any competition for Verna.
54

He claimed Maruti SX4 is MSIL’s FAILED ATTEMPT AT A3 SEGMENT!
The waiting period for Verna will be from 2 months to 6 months or more depending on the color the costumer chooses.
No discounts are available, as of now, on Verna.
RATING FOR VERNA FLUIDIC*:
AFTER SALES SERVICE NETWORK 4/5VALUE FOR MONEY 4/5BRAND VALUE AND BRAND TRUST 4/5ENGINE AND POWER 5/5INTERIORS AND COMFORT 4/5EXTERIORS AND DESIGN 4.5/5DRIVE AND HANDLING 4.5/5MILEAGE 4.5/5
*1-POOR, 2-AVERAGE, 3-GOOD, 4-EXCELLENT, 5-OUTSTANDING
2. Maruti SX4 v/s Ford Fiesta
SHOWROOM VISITED:
1. HARPREET FORD, Moti nagar2. DELHI FORD, Vasant Kunj3. NCR FORD, Defence colony
Sales executive: Mr. Harvinder Singh
The New Fiesta will be powered a powerful engine that would produce over 90PS at 4000 rpm. The sales executive was quick to claim that the new Fiesta will overtake any car in the A3 segment in terms of sales and specifications.
Sales pitch for Ford Fiesta:
55
1. The new Fiesta will have automatic climate control.2. It will have automatic cruise control.3. Great to look exteriors and interiors.4. It comes with features like voice activated controls, mobile-inspired centre console,
premium dashboard finish, a multi-function display.5. The ford has used stronger yet lighter components in the new car that gives it a lesser
overall weight as compared to its A3 segment competitors that translates into a fuel efficiency of over 20km/l for its diesel variant.
6. The new fiesta offers good fuel economy, good comfort, and larger space than its previous versions.
Sales pitch for Fiesta against SX4:
1. The comfort ability of SX4 fell short of the same of Fiesta.2. The visibility of SX4 was also not up to the standards that Fiesta will come up with.3. The SX4 lags behind the Fiesta in exteriors designing aspect.4. SX4 does not give enough control while turning at high speeds.
The waiting period for Fiesta will be close to 3 months. There is no discount provision, as of now.
RATING FOR FEISTA:
AFTER SALES SERVICE NETWORK 3/5VALUE FOR MONEY 3/5BRAND VALUE AND BRAND TRUST 3/5ENGINE AND POWER 4/5INTERIORS AND COMFORT 4.5/5EXTERIORS AND DESIGN 4.5/5DRIVE AND HANDLING 3.5/5MILEAGE 4/5
1-POOR, 2-AVERAGE, 3-GOOD, 4-EXCELLENT, 5-OUTSTANDING
3. MARUTI SUZUKI SX4 v/s VOLKSWAGEN VENTO
56

SHOWROOMS VISITED:
1. VOLKSWAGEN DELHI WEST, MOTI NAGAR2. VOLKSWAGEN DELHI NORTH, GT KARNAL ROAD3. VOLKSWAGEN DELHI SOUTH, SOUTH EX
Sales Executive: Mr. Buddh Mitra, 08826606155
Volkswagen Vento Diesel is powered by a 4 cylinder, DOHC engine that pumps out 105 PS @ 4400 rpm. The petrol version delivers same level of power as well.
Sales pitch for Vento diesel:
1. Most powerful and heaviest bonnet in the A3 segment for advanced safety .2. Best in the class interiors for high degree of comfort that includes features like the wide
Armrest, length adjustable front seats from behind, adjustable seats, tilt steering etc.3. The best ride quality which stands head to head with Honda City .4. A light steering .5. Electronic display of speed, fuel efficiency, gear shift requirements, fuel left in car,
kilometers that the car can run with left fuel etc.6. Airbags for the front seat members.7. A good boot space that is larger than SX4 .8. Greater power than SX4 and higher fuel efficiency on diesel version at 21 km/l .
Sales pitch of Vento against SX4:
1. SX4’s comfort factor falls short against the Vento.2. SX4’s interiors are curves behind the interiors’ quality of the Vento.3. The ride quality of SX4 is behind that of Vento.4. SX4 does not have a rear AC vent.
He said that once the SX4 is hit while in a traffic jam or at speeds less than 50 km/hr, its bumpers start to sag and the body displays a huge scratch.
Overall, the Vento is an example of a customized car that portrays a car designed as per the needs and wants of the Indian Auto consumers.
The waiting period for the petrol version of the Vento is 1week to 1 month and that of the diesel version stands at 2 months.
There is corporate discount available on the Vento.
RATING FOR VENTO*:
57

AFTER SALES SERVICE NETWORK 2/5VALUE FOR MONEY 2.5/5BRAND VALUE AND BRAND TRUST 3/5ENGINE AND POWER 5/5INTERIORS AND COMFORT 4.5/5EXTERIORS AND DESIGN 4/5DRIVE AND HANDLING 5/5MILEAGE 2.5/5
*1-POOR, 2-AVERAGE, 3-GOOD, 4-EXCELLENT, 5-OUTSTANDING
4. MARUTI SUZUKI SX4 v/s FIAT LINEA
SHOWROOMS VISITED:
1. TATA MOTORS , PEERAGARHI2. TATA MOTORS , WAZIR PUR3. SANYA AUTOMOBILES, MAYAPURI
SALES EXECUTIVE:
Mr. Sujeet Bhardwaj, 9999292485
Fiat Linea Diesel is equipped with a 1.3 L, 1248cc, DOHC, 16 valves, Multijet diesel engine that produces maximum power of 93 PS at 4000 rpm and the maximum torque of 209 Nm at 2000 rpm and offers mileage of 19.9 kmpl.
Sales pitch for Linea:
1. Good interiors and comfortable front and rear seats.2. Advanced multi-jet diesel engine that delivers a powerful performance.
58

3. Advanced safety with airbags, fire prevention system that cuts off the supply of fuel in case of accidents, powerful bonnet of the car that has double line of defense to prevent major damage in case of head-on collision.
4. Electronic display similar to the Vento and rear AC vents .5. Head lamps can act as torch .6. Steering mounted controls from Bluetooth and stereo to the voice and phone-call .7. An electronic service schedule reminder .
Sales pitch for Linea against SX4:
1. Linea delivers more power than SX4 diesel.2. There is no speed alarm present in SX4, which is there in Linea.3. Linea looks more stylish than the SX4 on exteriors’ front.4. Linea has a larger boot space.5. Linea cuts-off the supply of fuel in case of any accident; SX4 has no such safety
feature.
The waiting period for Linea is less than two weeks. There is up to 6000 rupees corporate discount available on Linea.
RATING FOR LINEA*:
AFTER SALES SERVICE NETWORK 2.5/5VALUE FOR MONEY 3/5BRAND VALUE AND BRAND TRUST 2.5/5ENGINE AND POWER 4.5/5INTERIORS AND COMFORT 4.5/5EXTERIORS AND DESIGN 5/5DRIVE AND HANDLING 4/5MILEAGE 4/5
*1-POOR, 2-AVERAGE, 3-GOOD, 4-EXCELLENT, 5-OUTSTANDING
5. MARUTI SUZUKI SX4 v/s HONDA CITY
59

SHOWROOMS VISITED:
1. RING ROAD HONDA, PEERAGARHI2. COURTESY HONDA, WAZIRPUR INDUSTRIAL AREA3. CLASSIC HONDA, MATHURA ROAD
SALES EXECUTIVE:
Mrs. Inderpreet Kaur, 9213950697 Mr. Sanjan, 9899699640
Honda City 1.5 E MT is equipped with 1.5L, 1497cc, i-VTEC petrol engine with the 5-speed manual transmission gearbox that is able to produce 118PS power @ 6600rpm and 14.9Kg-m torque @ 4600rpm.
Sales pitch for City:
1. Great resale value .2. Sleek V-TEC engine that pumps out 118 PS of Power.3. The higher price tag comes with higher degree of comfort, good ride quality and great
interiors.4. Very comfortable to drive .5. City returns 13-14km/l in city and 19km/l on highways; great mileage .6. Honda is a huge brand and gives higher promise of quality.7. Honda’s service network is good.8. Honda has tied up with “MODIL ON-ROAD services” to give ON-road assistance of
all types to City drivers all across India.9. City is the most stylish car with good contours.10. City gives the best suspension system in its class.
Arguments against SX4 by the sales executive:
1. Lesser fuel efficiency for petrol SX4 against City petrol .2. The comfort ability of SX4 fell short against the standards set by City .3. City looks far more stylized than SX4 .4. SX4 has a lesser wheel base than city. 5. City offers a premium flavor to it, much more than SX4 .
The waiting period for Honda City is a maximum of 15 days. There are corporate discounts available for City to the tune of 7000.
RATING FOR CITY*:
AFTER SALES SERVICE NETWORK 4/5VALUE FOR MONEY 3/5
60

BRAND VALUE AND BRAND TRUST 4/5ENGINE AND POWER 5/5INTERIORS AND COMFORT 5/5EXTERIORS AND DESIGN 5/5DRIVE AND HANDLING 5/5MILEAGE 3.5/5
*1-POOR, 2-AVERAGE, 3-GOOD, 4-EXCELLENT, 5-OUTSTANDING
6. MARUTI SUZUKI SX4
SHOWROOMS VISITED:
1. D.D. MOTORS, WAZIRPUR2. SAYA AUTOMOBILES, G.T. KARNAL ROAD3. RANA MOTORS, BHIKAJI KAMA PLACE
Sales executive:
1. Mr. Pradeep Chatterjee, 99585493842. Mr. Nikhil Grover, 8860082041
Both of them pushed for SX4 Diesel and SX4 CNG ahead of SX4 Petrol.
Sales pitch for SX4:
1. The most spacious car in its class .2. Comfortable rear seats.3. The tallest, lengthiest and the widest car in the A3 segment .4. The car has been made with the Indian road conditions in mind.5. It offers highest ground clearance .6. It has wider wheels for more support on ground.7. It offers good power and performance .8. It looks sporty and sturdy .
61

9. The best value for money car in A3 segment .10. SX4 even has a CNG engine for boosting its value for money tag .
Sales pitch against rest of the A3 segment cars:
1. No A3 segment car is as good a value for money as SX4 diesel.2. SX4 has the advantage of being 100000 rupees cheaper than City, Vento yet being
similarly powerful and giving good ride quality.3. SX4 has a higher resale price than any car in A3 segment. 4. SX4 offers more headroom/legroom than any other A3 segment car .
RATING FOR SX4*:
AFTER SALES SERVICE NETWORK 5/5VALUE FOR MONEY 5/5BRAND VALUE AND BRAND TRUST 5/5ENGINE AND POWER 3.5/5INTERIORS AND COMFORT 3/5EXTERIORS AND DESIGN 3/5DRIVE AND HANDLING 4/5MILEAGE 5/5
*1-POOR, 2-AVERAGE, 3-GOOD, 4-EXCELLENT, 5-OUTSTANDING
62

UPPER A3 SEGMENT COMPARISONS’ TABLE
PARAMETER MARUTI SX4 ZDI
HONDA CITY 1.5 V MT
FIAT LINEA Emotion (Diesel)
VOLKSWAGEN VENTO Diesel Trend line
Price (Rs.) 8,66,999 9,09,800 8,27,737 9,23,500
Transmission Type
Manual Manual Manual Manual
Engine Description
1.3L, 1248cc, 90PS, 4-cyl. DDiS Diesel engine
1.5L 116.4bhp i-VTEC
1.3L, 1248cc, Multi-jet Diesel Engine
1.6L, 105PS Diesel Engine
Engine Displacement(cc)
1248 1497 1248 1598
Maximum Power 90 PS at 4000 rpm 118PS at 6,600 rpm
93 PS at 4000 rpm
105PS@4400rpm
Maximum Torque
200 Nm at 1750 rpm
146Nm at 4800 rpm
209 Nm at 2000 rpm
250Nm@1500-2500rpm
Mileage-City(kmpl)
17.5 14.0 14.0 15.8
Mileage-Highway(kmpl)
21.5 17.0 19.0 20.5
Fuel Type Diesel Petrol Diesel Diesel
Fuel Tank Capacity(litres)
50 42 45 55
Turning Radius 5.3 m 5.3 m 5.55 m 5.4 m
Length 4490mm 4420mm 4460mm 4384mm
Width 1735mm 1,695 mm 1730mm 1,699 mm
Height 1570mm 1,480 mm 1,487 mm 1,466 mm
Ground Clearance
180mm 160 mm 161 mm 168 mm
63

Wheel Base 2500mm 2550mm 2603 mm -
Kerb Weight 1210kg 1,100 kg 1291 kg 1190 kg
Anti-Lock Braking
Standard Standard Standard Standard
Brake Assist Standard Standard Standard Not Available
PARAMETER MARUTI SX4 ZDI Hyundai Verna 1.6 SX VTVT
Price (Rs.) 8,66,999 8,24,501Transmission Type Manual ManualEngine Description 1.3L, 1248cc, 90PS, 4-cyl. DDiS
Diesel engine1.6L 123bhp VTVT
Engine Displacement(cc)
1248 1591
Maximum Power 90 PS at 4000 rpm 123.05 @ 6,300 (PS@rpm)
Maximum Torque 200 Nm at 1750 rpm 15.8 @ 4,200 (kgm@rpm)
Mileage-City(kmpl) 17.5 13.4
Mileage-Highway(kmpl)
21.5 17.1
Fuel Type Diesel Petrol
Fuel Tank Capacity(litres)
50 43
Turning Radius 5.3 m 5 m
Length 4490mm 4370 mmWidth 1735mm 1700 mmHeight 1570mm 1475 mmGround Clearance 180mm -Wheel Base 2500mm 2570 mmAnti-Lock Braking Standard Standard
64
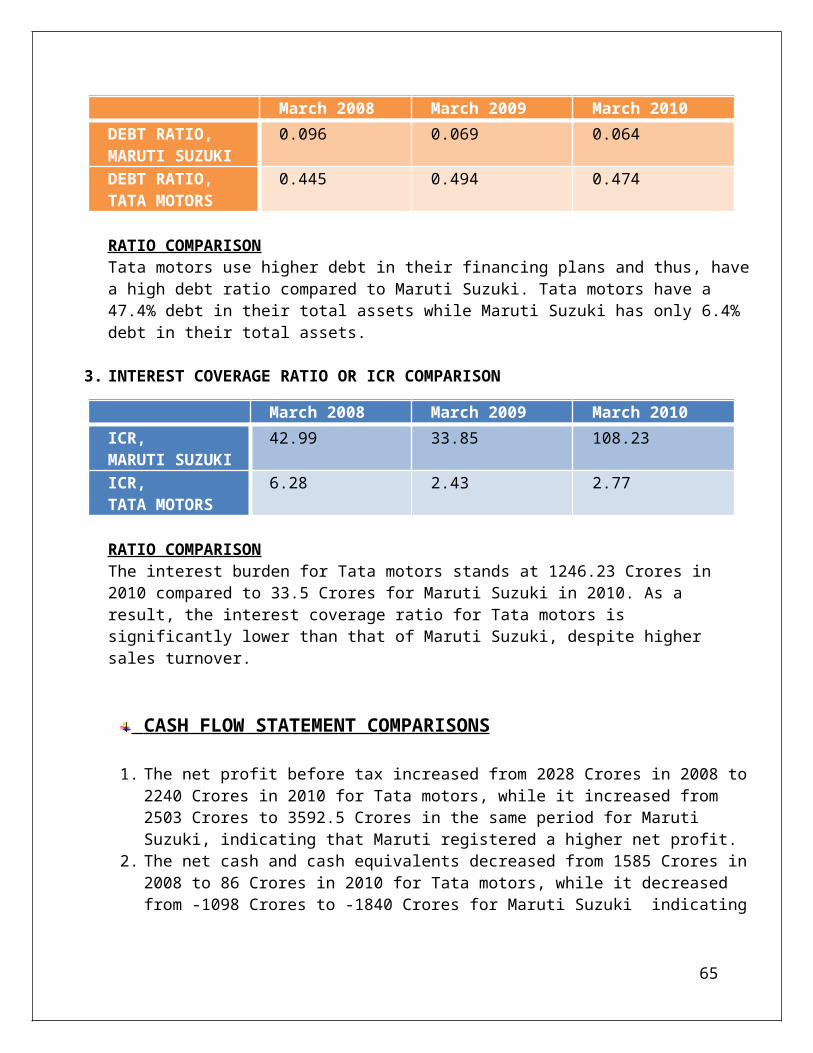
Brake Assist Standard Standard
THE SALES FIGURES IN UPPER A3 SEGMENT FOR 2010-11
25317
4663118252
18381
13812 9177
Annual Sales in 2010-11
Maruti SX4Honda CityHyundai VernaVolkswagen VentoFord Fiesta Fiat Linea
To sum up the experience, the Volkswagen and Honda showrooms had an up market touch to them and their sales executives were the most cordial and friendly.
The Fiat and Maruti showrooms were a little cramped with lot of customers and staff members, but the Fiat sales executives fell short of the standards set by Maruti sales executives in terms of being warm hosts, providing ample information about the cars and being friendly enough to offer snacks and cold-drinks.
The Ford and Hyundai sales team was too busy charting out plans to launch the new versions of Fiesta and Verna and thus, appeared short of time while giving me details of their new cars.
65

Volkswagen people believe in CRM and they even texted me a thank-you note after I left their showroom. Personally, the Volkswagen and Maruti Suzuki sales executives were the most hospitable ones and gave ample time and details to me. Tea, coffee was offered to me in all
showrooms except for the Fiat showroom. It was a learning experience for me.
STAGE 2
CUSTOMER PROFILING OF MARUTI SX4 DIESEL
PROJECT DESCRIPTIONThe second stage of the corporate internship project takes an insight into the lives of the customers buying the Maruti Suzuki SX4 Diesel. Respondents will be surveyed from various parts of the nation and the results of the survey will be assimilated to obtain a coherent National Result.The idea of the project is to help Maruti Suzuki India Limited in obtaining a general profile of the customers taking home the all new car, launched in February this year.The project was done in the third and fourth week of the summer internship.
CUSTOMER SURVEYOver 250 customers of Maruti Suzuki SX4 Diesel car were surveyed from all across the length and breadth of the country. And 100 customers responded for this national survey.The cities and included in the survey were:01. TIRUVALLUR02. CHENNAI03. COIMBATORE04. SALEM05. MUMBAI and NAVI MUMBAI
66

06. KOLKATA07. BANGALORE08. PUNE09. HYDERABAD10. LUDHIANA11. DELHI and NCR12. REWARI13. AHMEDABAD14. COCHIN15. INDORE16. BHOPAL
A. GOAL OF THE PROJECT :
The customer Profiling of the Maruti Suzuki SX4 Diesel based on the following parameters:
1. LOCATION 2. NATURE OF WORK 3. THEY USE A CHAUFFEUR OR SELF DRIVE THEIR CAR 4. THE PREVIOUS CAR THEY OWNED 5. THEIR NEXT BEST CHOICE AFTER SX4 DIESEL 6. KEY REASON TO CHOOSE SX4 DIESEL
B. METHODS USED FOR THE PROJECT COMPLETION :
1. TELEPHONIC INTERVIEW OF THE CUSTOMERS 2. ONE TO ONE CUSTOMER INTERVIEW
C. MARKETING TECHNIQUES USED FOR INFLUENCING CUSTOMER’S BEHAVIORAL COMPONENT: 1. RECIPROCITY (DOOR IN THE FACE TECHNIQUE)
The customers were contacted for the feedback and all the listed parameters, straightaway.The customers were told about the overall benefit of the national survey for the customer as well as Maruti Suzuki in helping us know the SX4 customer better alongside the feedback for the car they had taken for their additional personal benefit.Most of the customers responded positively and gave good deal of time along with inputs from their side to help make SX4 a better car and perform complete customer profiling.The duration of such telephonic interviews extended up to 10 minutes.The duration of such one to one customer interview extended to 20 minutes.
67

2. SCARCITY (SHORT TERM CUSTOMER SURVEY)
They were told about the time constraint allotted for the national survey for SX4 customers. And they were given the privileged customer title for their role in the ongoing survey.Out of the 10000 latest customers only 300 were chosen for this survey and as a result they felt privileged and responded well.
3. COMMITMENT ( FOOT IN THE DOOR TECHNIQUE)
Since the survey was important to Maruti Suzuki so the customers who complained about lack of time for such efforts were given commitment of a better service and quality through their profile information.
4. COMPLIMENTS
The customers were congratulated for their new SX4 diesel.
PROJECT ANALYSIS
1. THE NATURE OF WORK DONE BY THE SX4 CUSTOMER
60%23%
17%
NATIONAL RESULT
BUSINESSSERVICESELF-EMPLOYED
68

58%25%
17%
MUMBAI AND PUNE RESULTS
BUSINESSSERVICESELF-EMPLOYED
52.40%
23.80%
23.80%
BANGALORE, HYDERABAD AND COCHIN RESULTS
BUSINESSSERVICESELF-EMPLOYED
54.05%
21.62%
24.33%
DELHI NCR RESULTS
BUSINESSSERVICESELF-EMPLOYED
2. SELF-DRIVEN CAR OR CHAUFFER DRIVEN CAR
69

78%
22%
NATIONAL RESULT
SELF-DRIVENCHAUFFER DRIVEN
3. THEIR TOP 5 PREVIOUS CARS:
ESTEEM
SWIFT DIESEL
SWIFT DZIRE DIESEL
HYUNDAI VERNA PETROL
WAGON R
0 1 2 3 4 5 6 7 8 9 10
4
5
6
7
9
NATIONAL RESULT
4. IF NOT SX4 DIESEL THEN..
70

VENTO FLUIDIC VERNA
SWIFT DZIRE DIESEL
HONDA CITY TOYOTA ETIOS
OTHERS0.00%5.00%
10.00%15.00%20.00%25.00%30.00%35.00%40.00%45.00%50.00% 45.94%
21.60%
10.80%8.10%
5.40%8.16%
NATIONAL RESULT
Volkswagen Vento is the national competitor of Maruti SX4 and more than 45% of customers thought of taking Vento if they did not take SX4. Similar pattern is seen across all the cities too.
VentoSwift Dzire
Etios
0%5%
10%15%20%25%30%35%40%45%50%
50.00%
33.33%
16.66%
MUMBAI AND PUNE RESULTS
71

VENTO VERNA COROLLA ALTIS0.00%
10.00%
20.00%
30.00%
40.00%
50.00%
60.00%
70.00%
80.00%75%
14% 11%
BANGALORE, HYDERABAD AND COCHIN RESULTS
VENTO CITY VERNA AVEO, DZIRE0%
5%
10%
15%
20%
25%
30%
35%
40%
45%
45%
20%
29%
6%
DELHI NCR RESULTS
5. KEY REASON TO CHOOSE SX4 DIESEL
72

34
49
39
17
4
NATIONAL RESULT
MARUTI SUZUKI BRAND VALUEMARUTI SUZUKI TRUSTSERVICE NETWORKEFFICIENCYLOW MAINTAINANCE
Maruti Suzuki banks heavily on its Brand Value and Brand Trust to win customers.An unparalleled and extensive service network is also a boon to company’s products.National results coincided with Delhi and Mumbai results in this case.
29%
33%
16%
15%
7%
DELHI NCR RESULT
MARUTI SUZUKI BRAND VALUEMARUTI SUZUKI BRAND TRUSTSERVICE NETWORKEFFICIENCYLOW MAINTAINANCE
73

33%
11%35%
9%
12%
MUMBAI AND PUNE RESULTS
MARUTI SUZUKI BRAND VALUEMARUTI SUZUKI BRAND TRUSTSERVICE NETWORKEFFICIENCYLOW MAINTAINANCE
CONCLUSIONS BASED ON CUSTOMER PROFILING:
SX4 Customer happens to be, majorly, from the business background followed by services background.
SX4 customer, largely, drives the car himself. Most SX4 customers have graduated from Wagon R or an A2 or an A3 segment car. Volkswagen Vento is their next best choice followed by Hyundai Verna Fluidic, Swift
Dzire, and Honda City. Maruti Suzuki’s Trust, Brand Value and Service Network are the major reasons to buy
this car.
STAGE 3
SWOT ANALYSIS OF MARUTI SUZUKI
PROJECT AIM: Analyze the internal and external industry environment of Maruti Suzuki India Limited.
PROJECT DESCRIPTION:The strengths, weaknesses, opportunity and threats of the concerned company have been analyzed using inputs from the primary and secondary sources including mentors and industrial surveys and latest news.
74

METHODOLOGY:The surveys, researches, inputs from mentor, inputs from dealers, and inputs from service station owners has been taken into account.
PROJECT ANALYSIS
1. STRENGTHSEstablished distribution and after-sales networksUnderstanding of the Indian market and ability to liaison with the governmentAbility to design products with differentiating featuresBrand ImageExperience and Know-how in technologyEstablished brand in Indian market. Experience in Indian market Very old player in Indian market and has the first mover advantage.
2. WEAKNESSESLack of experience with the foreign marketHeavy Import tariffsNo huge online presenceNot diversifiedToo much focus on Value for money brand imageNo car in the Multi-purpose vehicle segment
3. OPPORTUNITYIncreased purchasing power of Indian middle class categoryGovt. subsidiesTax benefitsForeign collaborationAcquisitionsInnovationHuge social media place waiting to be tappedProduct and services expansionTakeovers and AcquisitionsTargeting Higher Middle Class requirements
4. THREATS
75
Threats from Chinese manufacturersIndian as well as foreign competitorsCheaper technologyExternal changes (government, politics, taxes, etc)Aggressive Price warsProduct substitutionEver changing customer's taste with rising disposable incomes.Purchasing power of customer moving upwardGlobal manufacturers flooding Indian market.
CONCLUSIONS
CONCLUSIONS for Maruti SX4 from STAGE 1
Maruti SX4 v/s Hyundai Verna
Maruti SX4’s maximum power stays behind Hyundai Fluidic Verna at 90 PS as against 123 PS Verna offers.Its mileage on the highway stays behind Hyundai Verna which offers over 21 KM/LITRE.It does not have a push button start option provided in Hyundai Verna.The exterior designing of SX4 is few notches behind Verna.The interior comfort of Verna is ahead of SX.The SX4 offers more discounts and a shorter waiting period.SX4 has a larger service network and bigger Brand Trust that work in its favor.
76

Maruti SX4 v/s Ford Fiesta
Fiesta scores over SX4 in terms of the exterior designing and interior comfort. Fiesta offers voice activated climate control and automatic cruise control that is not there in our SX4.Fiesta offers class best mileage in city and on highway, more than SX4.Fiesta offers more visibility and better handling than SX4.The service network and Brand Trust of our SX4 is miles ahead of Fiesta.Fiesta will have a longer waiting period than SX4.SX4 offers more value for money.
Maruti SX4 v/s Volkswagen Vento
Vento is German engineering at its best, and it offers highest level of safety features which are miles ahead of any other car in A3 segment.Vento delivers more power and higher fuel economy than SX4.The interior comfort of Vento is leaps ahead of SX4 with wider arm-rests, length adjustable seats from behind, one touch power windows.Vento gives better ride quality and sharper maneuvering at turns, much more than SX4.Vento provides electronic multi-function display at the steering near the speedometer for driver’s comfort.The rear view mirror in Vento is electronically adjustable.Vento offers larger boot space than SX4.Vento has rear AC vents for enhanced rear seat comfort.SX4 still find itself ahead on the value for money front with an extensive service network, lower maintenance cost and bigger Brand Trust.Vento has a higher waiting period on diesel model and lesser corporate discount than SX4.SX4 zooms past Vento on the Value for money front with a much bigger service network than Volkswagen and a lower maintenance cost.
Maruti SX4 v/s Fiat Linea
Linea offers multi-jet diesel engine that churns out higher power and smoother drive than SX4Linea moves past SX4 on safety features as it has a powerful bonnet with two lines of defense and can cut off the fuel supply in case of any accident.Linea has a better exterior design and offers more interior comfort than SX4.Linea offers electronic displays, service reminders, steering mounted controls and rear AC vents that are missing in SX4.Linea has a good handling, but SX4 matches that.Linea loses out to SX4 on Value for money front with lesser maintenance cost, wider service network and a bigger Brand Value compared to Fiat.SX4 offers higher corporate discount, although they have the same waiting period.
Maruti SX4 v/s Honda City
77

Honda has a huge Brand trust/reliability in the A3 segment, much more than Maruti Suzuki.City offers more comfort, better ride quality, better handling, more power than SX4.City stands head to head with SX4 with a comparable service network and good on road service assistance in case of breakdown.City gives the class best suspension system and thus, it’s much more comfortable than SX4 on the Indian roads.City gives a premium flavor due to its sharp design and good-looking exteriors, much more than the sporty SX4.SX4 zooms past city on value for money front as it offers diesel model while city is available only in petrol.City offers more resale value than SX4.
Thus Maruti SX4:
SX4 is miles ahead of all the competitor cars on value for money front. The service network is the widest for SX4. It offers good mileage and low maintenance. It has highest ground clearance and can be used for off-roading too. It lags behind in the interiors and exteriors department. It has some work to do on the power and handling.
CONCLUSIONS FROM STAGE 2
On a national basis, out of the total customers driving Maruti SX4 diesel 60% is businessmen, 23% servicemen and 17% self-employed persons.The same trend was followed in all the regions of the nation with businessmen being the top customers of SX4 followed by servicemen.On a national basis, the SX4 diesel is a self-driven car with 78% customers driving the car themselves and the rest customers use a chauffeur.The same trend was followed in all the cities except in Ahmadabad where 100% customers used a chauffeur.On a national basis, Wagon R was the previous car of most customers followed by Verna Transform and Swift Dzire.In Delhi NCR, 88% customers had moved on to SX4 diesel from an A3 segment petrol car.On a national basis, Volkswagen Vento emerged as the major competitor to SX4 with over 45% of the customers choosing Vento as the next best alternative followed by Verna Fluidic.Vento was the second best alternative to SX4 in all cities across India.
78

On a national basis, Maruti Suzuki Brand Trust was the major reason cited by the customer to buy SX4 diesel, followed by extensive service network and high efficiency of the car.
CONCLUSIONS FROM STAGE 3
Maruti Suzuki has a nation-wide presence in the form of 3000 service centers which is its biggest strength.
Maruti Suzuki are the king of the A2 segment and sell over 800000 cars in this segment annually, which is again a big strength.
Maruti Suzuki’s good word-of-mouth and huge Brand Trust are the biggest contributors to its sales and revenues.
Maruti focuses too much on value for money image such that it is facing problems in the positioning in premium segments.
Maruti must grab the opportunity of luring the upper middle class customers though better positioning of their products.
The product line and service network must be expanded further to reap and sustained the advantage it holds.
The global players like Honda, General Motors, Hyundai, Toyota, Nissan, Ford and Volkswagen entering the small car segment is the biggest threat to Maruti’s small car dominance in the Indian market.
The aggressive price wars can also be a threat that Maruti may face.
RECOMMENDATIONS
1. Maruti SX4 has some work to do in the drive and handling department to match the
competitors in the A3 segment.
2. Maruti SX4’s interiors can be spruced up further with the possible additions of multi-
function electronic displays, rear ac vents and making leather seat covers standard.
3. The SX4’s styling has been left untouched since its launch in 2007, Maruti can give it a
facelift before the next generation of SX4 comes out to improve its exterior styling
quotient.
79
4. Maruti SX4 is the only car in A3 segment with off-roading capability due to its high
ground clearance, and this aspect of SX4 must be emphasized it its marketing campaigns.
5. The automatic gear shift option must also be available for the SX4 diesel. This would
improve its sales further.
6. The social media must also be aggressively used for SX4 sales promotions and customer
feedback and interaction.
7. Maruti SX4’s biggest competitor are the Volkswagen Vento and Hyundai Verna, both of
which are loaded with electronic controls and displays, and as a result SX4 should come
up with similar features in the top variant of petrol and diesel to push its sales.
8. The service network and dealer network must be expanded further to reach a larger
number of small towns and rural areas to increase the Brand Awareness.
9. The expansion of facilities would mean that each of the products of Maruti Suzuki,
including SX4, will have the benefit of a large area of distribution and greater reach
spanning whole of the nation, literally.
10. Maruti SX4 must go for co-branding with different brands domestically to boost sales.
11. Most of the customers of SX4 are businessmen and service men and thus, the
advertisements of SX4 must be made with that customer segment in mind.
KEY LEARNINGS
1. The summer internship period taught me not to jump on to conclusions too soon. Every
decision, every thought, every step must be followed only after a thorough understanding
and analysis.
2. The customer profiling required me to talk to customers from all across the nation with
varying backgrounds, varying cultures and different languages. It was a unique experience
and it taught me to be patient with each of them. I learnt greetings in various languages to
80

better connect with the customer and listened to each of their suggestions and orders too.
This was a high point as it involved the interaction with new and different people.
3. The A3 segment was extensively studied and thus, I developed a key insight into the
automobile industry and the apt method of comparing cars across same segment over
different parameters ranging from interiors and exteriors to the power and performance.
4. Corporate environment requires proper dressing sense and I learned that here, from the
employees of Maruti Suzuki India limited.
5. Reporting to my mentor on time, coming to office on time and not missing the deadlines are
the other important things I followed here and learned from my mentor and colleagues.
6. The incisiveness of my thoughts was enhanced through a three dimensional thinking
promotion, helped by my mentor over the 42 days of internship.
ANNEXURE Q.1 YOU ARE SALARIED, SELF-EMPLOYED OR WORKING FOR YOUR BUSINESS?
SALARIED
SELF-EMPLOYED
WORKING
Q.2 DO YOU DRIVE YOUR SX4 YOURSELF OR USE A CHAUFFEUR TO DRIVE THE SX4?
SELF-DRIVE THE CAR
USE A CHAUFFEUR
Q.3 WHICH PREVIOUS CAR DID YOU OWN BEFORE TAKING SX4?
MARUTI WAGON R
81

HYUNDAI VERNA PETROL
MARUTI SWIFT
MARUTI SWIFT DZIRE
OTHERS
Q.4 WHICH OTHER CARS DID YOU CONSIDER WHILE BUYING SX4?
VOLKSWAGEN VENTO
HYUNDAI VERNA FLUIDIC
SWIFT DZIRE
HONDA CITY
TOYOTA ETIOS
Q.5 WHAT WAS YOUR MAIN REASON TO BUY SX4?
MARUTI SUZUKI BRAND VALUE
MARUTI SUZUKI BRAND TRUST
LOW MAINTENANCE
WIDE SERVICE NETWORK
GOOD FUEL EFFICIENCY
REFERENCES
www.marutisuzuki.comen.wikipedia.orgwww.siam.comwww.carwale.comwww.cardekho.comwww.economictimes.comwww.timesofindia.comwww.facebook.comwww.team-bhp.comwww.suzukimotors.comOverdrive magazineAutocar magazine
82

83
![[Internship Report] folder... · Web view[Internship Report] [Internship Report] 3 [Internship Report] Prince Mohammed Bin Fahd University College of Computer Engineering and Science](https://img.dokumen.tips/doc/110x75/5adbc5e37f8b9add658e5f6e/internship-report-folderweb-viewinternship-report-internship-report-3-internship.jpg)