Embed Size (px)
Citation preview
Clemson UniversityTigerPrints
All Dissertations Dissertations
May 2018
Internet of Things and Intelligent Technologies forEfficient Energy Management in a Smart BuildingEnvironmentGuneet BediClemson University, [email protected]
Follow this and additional works at: https://tigerprints.clemson.edu/all_dissertations
This Dissertation is brought to you for free and open access by the Dissertations at TigerPrints. It has been accepted for inclusion in All Dissertations byan authorized administrator of TigerPrints. For more information, please contact [email protected].
Recommended CitationBedi, Guneet, "Internet of Things and Intelligent Technologies for Efficient Energy Management in a Smart Building Environment"(2018). All Dissertations. 2411.https://tigerprints.clemson.edu/all_dissertations/2411

INTERNET OF THINGS AND INTELLIGENT TECHNOLOGIES FOR EFFICIENT ENERGY MANAGEMENT IN A
SMART BUILDING ENVIRONMENT
A Dissertation Presented to
the Graduate School of Clemson University
In Partial Fulfillment of the Requirements for the Degree
Doctor of Philosophy Electrical Engineering
by Guneet Bedi May 2018
Accepted by: Ganesh Kumar Venayagamoorthy, Committee Chair
Rajendra Singh, Committee Co-Chair Richard Brooks Amy Apon
ii
ABSTRACT
Internet of Things (IoT) is attempting to transform modern buildings into energy
efficient, smart, and connected buildings, by imparting capabilities such as real-time
monitoring, situational awareness and intelligence, and intelligent control. Digitizing the
modern day building environment using IoT improves asset visibility and generates
energy savings. This dissertation provides a survey of the role, impact, and challenges
and recommended solutions of IoT for smart buildings. It also presents an IoT-based
solution to overcome the challenge of inefficient energy management in a smart building
environment. The proposed solution consists of developing an Intelligent Computational
Engine (ICE), composed of various IoT devices and technologies for efficient energy
management in an IoT driven building environment.
ICE’s capabilities viz. energy consumption prediction and optimized control of
electric loads have been developed, deployed, and dispatched in the Real-Time Power
and Intelligent Systems (RTPIS) laboratory, which serves as the IoT-driven building case
study environment. Two energy consumption prediction models viz. exponential model
and Elman recurrent neural network (RNN) model were developed and compared to
determine the most accurate model for use in the development of ICE’s energy
consumption prediction capability. ICE’s prediction model was developed in MATLAB
using cellular computational network (CCN) technique, whereas the optimized control
model was developed jointly in MATLAB and Metasys Building Automation System
(BAS) using particle swarm optimization (PSO) algorithm and logic connector tool
(LCT), respectively. It was demonstrated that the developed CCN-based energy

iii
consumption prediction model was highly accurate with low error % by comparing the
predicted and the measured energy consumption data over a period of one week. The
predicted energy consumption values generated from the CCN model served as a
reference for the PSO algorithm to generate control parameters for the optimized control
of the electric loads. The LCT model used these control parameters to regulate the
electric loads to save energy (increase energy efficiency) without violating any
operational constraints.
Having ICE’s energy consumption prediction and optimized control of electric
loads capabilities is extremely useful for efficient energy management as they ensure that
sufficient energy is generated to meet the demands of the electric loads optimally at any
time thereby reducing wasted energy due to excess generation. This, in turn, reduces
carbon emissions and generates energy and cost savings. While the ICE was tested in a
small case-study environment, it could be scaled to any smart building environment.

iv
DEDICATION
The dissertation work is dedicated to the 1.3 billion people around the world who
do not yet have access to electricity. I hope that my work can be a step in achieving the
goal of providing access to clean, affordable, sustainability electricity to meet the
growing electricity demands around the world.

v
ACKNOWLEDGMENTS
I would like to acknowledge the great contributions of my dissertation chair Dr.
Kumar Venayagamoorthy and co-chair Dr. Rajendra Singh, as well as my dissertation
committee members, Dr. Richard Brooks and Dr. Amy Apon. Their guidance and
feedback has helped me grow and become the scientist and researcher that I am today.
The Clemson University Holcombe Department of Electrical and Computer
Engineering has given me many opportunities for professional development, which I
greatly appreciate. Furthermore, my labmates were a constant source of encouragement
during the dissertation process. Their friendship and willingness to always lend a helping
hand makes the Real-Time Power and Intelligent Systems Laboratory a special place to
work. I would also like to acknowledge the gracious support I received from Clemson
Facilities, Johnson Controls, and ProtoConvert as I set up my building case study
environment.
I would like to thank my family and my wife for their love and support. They
inspired me to aim for excellence and gave me confidence that I could achieve my goals
and aspirations.
Finally, I would like to acknowledge the funding support from the US National
Science Foundation (NSF) IIP #1312260, 1232070, 1408141, and the Duke Energy
Distinguished Professor Endowment Fund. Any opinions, findings and conclusions or
recommendations expressed in this material are those of the author(s) and do not
necessarily reflect the views of NSF and Duke Energy Foundation.

vi
TABLE OF CONTENTS
Page
TITLE PAGE .................................................................................................................... i ABSTRACT ..................................................................................................................... ii DEDICATION ................................................................................................................ iv ACKNOWLEDGMENTS ............................................................................................... v LIST OF TABLES .......................................................................................................... ix LIST OF FIGURES ......................................................................................................... x CHAPTER I. INTRODUCTION ......................................................................................... 1 Overview .................................................................................................. 1 Energy Efficient Buildings ...................................................................... 2 IoT for Energy Efficient Buildings .......................................................... 3 Intelligence for IoT and Energy Management ....................................... 12 Contributions of This Dissertation ......................................................... 14 Summary ................................................................................................ 15 II. CHALLENGES AND RECOMMENDED SOLUTIONS FOR
IMPLEMENTING IOT IN SMART BUILDINGS ..................................... 16 Introduction ............................................................................................ 16 Sensing ................................................................................................... 18 Connectivity ........................................................................................... 19 Power Management ............................................................................... 23 Big Data ................................................................................................. 29 IoT Computational Requirements and Capabilities ............................... 30 Complexity ............................................................................................. 36 Security .................................................................................................. 38 Need for Behavior Change ..................................................................... 47 Influence of Social Attitudes ................................................................. 52 Recommendations for Mixed Methods Research Design Study for Implementing IoT in Smart Buildings ................................................... 53 Summary ................................................................................................ 55

vii
Table of Contents (Continued)
Page III. INTELLIGENT COMPUTATIONAL ENGINE ........................................ 56 Introduction ............................................................................................ 56 Features and Impact of ICE ................................................................... 56 General Control Framework for Smart Buildings ................................. 57 Summary ................................................................................................ 59 IV. IOT DRIVEN BUILDING CASE STUDY ENVIRONMENT ................... 60 Introduction ............................................................................................ 60 Real-Time Power and Intelligent Systems Laboratory .......................... 60 Deployment of IoT Devices and Technologies in RTPIS laboratory .... 61 Data Measurement ................................................................................. 67 Summary ................................................................................................ 67 V. ENERGY CONSUMPTION PREDICTION-I ............................................ 69 Introduction ............................................................................................ 69 Problem Definition ................................................................................. 70 Measurement Data ................................................................................. 71 Elman RNN Model ................................................................................ 72 Exponential Model ................................................................................. 77 Experiment Results and Discussions ..................................................... 84 Summary ................................................................................................ 85 VI. ENERGY CONSUMPTION PREDICTION-II ........................................... 87 Introduction ............................................................................................ 87 Problem Definition ................................................................................. 88 Measurement Data ................................................................................. 89 CCN-Based Energy Prediction Model ................................................... 91 Experiment Results and Discussions ..................................................... 94 Summary ................................................................................................ 99 VII. OPTIMIZED CONTROL OF ELECTRIC LOADS .................................. 101 Introduction .......................................................................................... 101 Problem Definition ............................................................................... 103 PSO-Based Optimized Control Parameters ......................................... 104 LCT Model ........................................................................................... 108
viii
Table of Contents (Continued)
Page Experiment Results and Discussions ................................................... 112 Summary .............................................................................................. 122 VIII. CONCLUSIONS ....................................................................................... 124 Introduction .......................................................................................... 124 Research Summary .............................................................................. 124 Main Conclusions ................................................................................ 126 Suggestions for Future Research ......................................................... 127 Summary .............................................................................................. 128 REFERENCES ............................................................................................................ 129 BIOGRAPHY .............................................................................................................. 148

ix
LIST OF TABLES
Table Page 5.1 Elman RNN Training Parameters ................................................................ 75 5.2 Value of the Decision Variable, Constant, and Minimum Error for Weekday and Weekend Data ................................................................................. 84 5.3 Predicted Energy Consumption and Measured Net Energy Consumption Using Elman RNN and Exponential Models ......................................... 85 6.1 PEC and MEC Values for All Three Cells Using CCN-Based Energy Consumption Prediction Model ............................................................. 95 7.1 Electric Load Magnitude and Priorities ..................................................... 107 7.2 Control Parameters Generated Using PSO ................................................ 113
7.3 Measured vs. Predicted Energy Consumption along with the safety factors for each zone .............................................................................................. 113
7.4 energyOC, energyN, and %Savings Values for All Three Cells Using Optimized Control of Electric Loads Model ....................................... 120

x
LIST OF FIGURES
Figure Page 1.1 Examples of energy efficient buildings around the world: (a) Glumac in
China, (b) The Edge in Netherlands, (c) Legion House in Australia, and (d) DPR Construction in USA ................................................................. 3
1.2 IoT sensors on the market with their leading suppliers for smart building
applications .............................................................................................. 8 1.3 Global IoT sensor market forecast ($ billion) .............................................. 10 1.4 Computational systems thinking machine for smart building environment 13 2.1 Technological innovations for intelligent & cyber-secured building environment ........................................................................................... 16 2.2 Recommendations for successful implementation of IoT in smart buildings ................................................................................................. 18 2.3 (a) Application of wireless convergence module in a smart building scenario, (b) Redpine RS9113 module with built-in antenna, and (c) Redpine RS9113 module without built-in antenna .............................................. 22 2.4 Neural Networks used for reducing data size .............................................. 36 2.5 Attack taxonomy by CERT .......................................................................... 39 2.6 Modified attack taxonomy for a smart building environment ..................... 39 2.7 Transtheoretical Model of Behavior Change ............................................... 48 3.1 ICE with IoT technologies integration ......................................................... 57 3.2 General control framework of ICE for efficient energy management in an IoT driven building environment .................................................................. 58 4.1 RTPIS laboratory layout .............................................................................. 61
4.2 Integration of all the IoT devices and technologies and software platforms using BACnet protocol for data measurement in RTPIS laboratory ..... 64
xi
List of Figures (Continued) Figure Page 5.1 Problem definition. (a) Electric energy consumption prediction model under development and (b) developed model used in prediction mode .......... 70 5.2 (a) Temperature and (b) occupancy data vs. net energy consumption data for October 18 – December 12, 2017 .......................................................... 72 5.3 Elman RNN model for electric energy consumption prediction ................. 75 5.4 Pseudo-code for PSO ................................................................................... 79 5.5 Flowchart of the proposed PSO algorithm to generate values of the decision variables ................................................................................................. 83 5.6 Predicted and the measured net energy consumption values using Elman RNN and exponential models .......................................................................... 85 6.1 CCN cell internal unit .................................................................................. 88 6.2 Energy consumption prediction problem definition: (a) Model in development mode; (b) developed model operating in prediction mode .................... 89 6.3 Example of the data samples for (a) ambient and zone temperatures, (b) energy consumption, and (c) occupancy state over a period of one week ....................................................................................................... 90 6.4 CCN-based energy consumption prediction model ..................................... 91 6.5 Elman RNN for each CCN cell .................................................................... 92 6.6 PEC and MEC values for (a) cell 1, (b) cell 2, and (c) cell 3 using CCN-based energy consumption prediction model ................................................... 96 6.7 PEC and MEC waveforms for all three cells (or zones) for the period March 4 – 10, 2018............................................................................................... 99 7.1 Metasys BAS LCT graphical user interface in (a) edit mode and (b) view mode ..................................................................................................... 102 7.2 Optimized control of electric loads problem definition ............................. 104

xii
List of Figures (Continued) Figure Page
7.3 Communication link between the Metasys BAS LCT model and PSO algorithm developed in MATLAB ....................................................... 105
7.4 LCT model for electric load energy consumption magnitude (in kWh) inputs
to PSO algorithm from (a) zone 1 light panels, (b) zone 1 HVAC 1, (c) zone 1 HVAC 2, (d) zone 2 light panels, (e) zone 2 HVAC, and (f) zone 3 light panels ........................................................................................... 106
7.5 Metasys BAS LCT logic diagram for optimized load shedding/reduction. A,
B, C, D, E, and F are the optimized control parameters from the PSO algorithm .............................................................................................. 109
7.6 Comparison between (a) zone temperature, (b) ambient temperature, and (c)
occupancy state for all three zones for week 1 (April 2-8) and week 2 (April 16-22) ........................................................................................ 111
7.7 Waveforms of (a) light panels energy consumption, (b) HVAC 1 energy
consumption, (c) HVAC 2 energy consumption, (d) zone temperature, (e) occupancy state, and (f) ambient temperature for zone 1 with and without the dispatch of optimized control model .............................................. 116
7.8 Waveforms of (a) light panels energy consumption, (b) HVAC energy
consumption, (c) zone temperature, and (d) occupancy state for zone 2 with and without the dispatch of optimized control model .................. 117
7.9 Waveforms of (a) light panels energy consumption, (b) HVAC energy
consumption, (c) zone temperature, and (d) occupancy state for zone 3 with and without the dispatch of optimized control model .................. 119
7.10 Net energyOC and energyN values for (a) zone 1, (b) zone 2, and (c) zone 3
for the period April 2 – 8, 2018 and April 16 – 22, 2018, respectively .......................................................................................... 121 7.11 Net energyOC and energyN waveforms for (a) zone 1, (b) zone 2, and (c) zone
3 for the period April 2 – 8, 2018 and April 16 – 22, 2018, respectively .......................................................................................... 122

1
CHAPTER ONE
INTRODUCTION
Overview
In 1999, Cherry Murray of Bell Labs stated: “In the next century, planet earth will
don an electronic skin. It will use the Internet as a scaffold to support and transmit its
sensations” [1]. The next major advancement with the Internet and the web that would
impact our lives significantly is the Internet of Things (IoT). IoT is the connection of
everyday objects in the physical world to the Internet. It imparts intelligence to the
current devices and equipment using sensors and software that are networked together
through the Internet. Literally every physical entity on earth, like appliances, goods,
objects, machines, buildings, vehicles, plants, animals and even us humans, can be the
“things” in IoT [2].
IoT is attempting to transform modern buildings into energy efficient, smart, and
connected buildings. IoT imparts capabilities, such as real-time monitoring, situational
awareness and intelligence, and control to transform the modern buildings into smart
buildings, which are more energy efficient. Additionally, digitizing the modern day
building environment using IoT improves asset visibility, eliminates energy wastage,
reduces carbon emissions, and creates cost savings [3].
IoT has a significant impact on smart building environments and offers several
opportunities for growth and development. The advancements in computational
intelligence capabilities can evolve an intelligent IoT system by emulating biological

2
nervous systems with cognitive computation, streaming and distributed analytics
including at the edge and device levels [3].
Energy Efficient Buildings
There are a number of energy efficient buildings around the world. Each of these
buildings have incorporated certain innovative technologies for improving energy
efficiency. The following are the examples of some of the top energy efficient buildings
and their respective technological innovations (Fig. 1.1) [4]:
• Glumac (Fig 1.1(a)) in Shanghai, China features an indoor air monitoring system, five
air purification systems, and a planted green wall. It is the first building in Asia to
apply for a Living Building Challenge Certification.
• The Edge (Deloitte HQ) (Fig 1.1(b)) in Amsterdam, Netherlands features world's
most efficient aquifer thermal energy storage system, water-efficient trickle-down
rainwater toilet water system, human powered gym, and smart LED light panels
across a floor reporting temperature and humidity measurements. With the BREEAM
sustainability score of 98.4%, Edge is the greenest building in the world.
• Legion House (Fig 1.1(c)) at Liberty Place in Sydney, Australia features chilled beam
technology-based air conditioning, which uses 100% fresh outside air for maintaining
a very high level of indoor environment quality for the building occupants. The Green
Building Council of Australia has certified the Legion House with a 6-Star Green
Star-Office v3 Design rating.

3
• DPR Construction (Fig 1.1(d)) in San Francisco, CA features photovoltaics (PV)
panels, ultra-energy efficient ceiling fans, rooftop solar thermal water heating system,
living horticulture wine bar, intelligent electrochromic windows, and the first-ever-
deployed LEED dynamic plaque in Northern California. It is the first commercial
office space to receive NZEB certification in the city of San Francisco.
Fig. 1.1. Examples of energy efficient buildings around the world: (a) Glumac in China, (b) The Edge in Netherlands, (c) Legion House in Australia, and (d) DPR Construction in USA [4]
IoT for Energy Efficient Buildings
With IoT, modern buildings can be transformed into energy efficient, smart, and
connected buildings. A smart building environment is comprised of IoT sensors and
actuators for communication, control, and visualizations. IoT imparts real-time feedback

4
capabilities to the smart building administrators, which function to better serve building
occupants through enhanced monitoring and control functionalities [2]. The IoT
framework provides a technology-driven architecture for integration of building
infrastructure and resources, and thus provide mechanisms to optimize their use and
provide an efficient, informed, and equitable distribution of services, which benefits the
building occupants in multiple ways. Three of the major benefits include improved
energy efficiency of a smart building environment, active monitoring of the building
environment, and enhanced social well-being of the occupants [5, 6]. IoT presents
numerous opportunities in smart buildings having a significant economic, environmental,
and societal impact.
IoT Sensors
IoT sensors play an important role in improving the energy efficiency of smart
buildings. With IoT sensors, the building administrators can actively optimize energy
supplies as needed to avoid energy waste. IoT sensors also contribute to building
environment monitoring by actively detecting the presence of pollutants or other harmful
gases in the building environment and alerting the building occupants to take corrective
measures in a timely manner. Additionally, IoT sensors enhance the social well-being of
smart building occupants by bringing more comfort and convenience in their lives [6].
The different types of IoT sensors are listed below [3, 6].

5
IoT Smart Building Occupancy Sensors
With IoT smart building occupancy sensors, the building administrators can
monitor all movements in and around the building, thereby helping to protect the building
from criminals and vandals. These sensors also reduce energy waste by controlling
lighting in an area dependent on its occupancy. The different types of IoT smart building
occupancy sensors include motion sensors, open/close sensors, and perimeter sensors [7-
9].
Motion sensors monitor movements inside the building. With motion sensors, the
building administrators can detect unexpected movements in the building and detect the
presence or absence of people in a particular area and control the lights to turn on/off
accordingly [7, 9]. Examples of motion sensors include passive infrared sensors,
microwave sensors, ultrasonic sensors, area reflective sensors, dual sensors, video
sensors, wireless sensors, vibration sensors, and pet immune sensors [10].
Open/close sensors monitor the opening or closing of cabinets, doors, and
windows. Open/close sensors can also automatically turn on the lights when a door is
opened [7, 9]. Examples of open/close sensors include glassbreak sensors, passive
infrared sensors, and door and window sensors [10, 11].
Perimeter sensors provide the extra layer of security by detecting any vehicles or
persons approaching the building [14, 16]. Examples of perimeter sensors include active
infrared sensors, capacitance sensors, vibration sensors, radar sensors, fence sensors,
driveway sensors, and electric field sensors [18].

6
IoT Smart Building Environmental Sensors
The building administrators can create a comfortable living environment for the
occupants inside the building with IoT smart building environment sensors [7]. IoT smart
building environmental sensors include temperature and humidity sensors, leak and water
sensors, smoke and air sensors, and light sensors [9].
Temperature and humidity sensors monitor unexpected changes in heating,
cooling, and the amount of water vapor inside the building. Temperature and humidity
sensors also reduce energy waste by turning off the cooling or heating in an area where
there is no person present [7]. Examples of temperature sensors include resistive
temperature devices, thermometers, thermocouples, infrared sensors, bimetallic devices,
silicon diode, and change-of-state sensors [12]. Examples of humidity sensors include
resistive sensors and capacitive sensors [13].
Leak and water sensors alert the building occupants as soon as a leak is detected,
thereby helping to prevent damaging floods that can be costly to repair [7]. Examples of
leak and water sensors include under carpet leak detectors, rope-style sensors, spot leak
detectors, and hydroscopic tape-based sensors [14].
Smoke and air sensors monitor the air quality inside the building. With smoke and
air sensors, the building occupants can detect the presence of smoke, carbon monoxide or
any other harmful gas in the building [7]. This would in turn help the building occupants
to take corrective measures before any serious harm happens to anyone inside the
building. Examples of smoke and air sensors include photoelectric sensors, ionization

7
sensors, dual sensors, aspirating sensors, projected beam sensors, video sensors, and heat
sensors [15].
Light sensors monitor the lighting levels inside the building. These sensors
automatically adjust the lighting inside the building depending on the ambient natural
lighting from the sun [7]. This helps enhance the lifetime of the light bulbs and reduce
energy wastage. Examples of light sensors include photo-junction sensors,
photoconductive sensors, and photovoltaic sensors [16].
IoT Smart Building Power Monitors
IoT smart building power monitors keep track of the amount of energy used by
each appliance or any other device inside the building [7]. Using these power monitors,
the building occupants can be more conscious of their energy usage, adjust their energy
usage behaviors to reduce energy wastage, and ensure that all appliances and other
devices operate efficiently and not consume too much power. There are four types of
power monitors including readout and history monitors (e.g., Wattvision power monitor),
instant readout monitors (e.g., Blue Line PowerCost monitor), plug in monitors (e.g., Kill
a Watt EZ electricity monitor), and circuit by circuit measurement monitors with both
history tracking and instant readout capabilities (e.g., eMonitor) [17].
Other IoT Smart Building Sensors
Some of the other IoT smart building sensors that are currently on market and
have not been listed above include dry contact sensors to detect contact between two
wired contact points; smart plugs to enable building administrators to turn on/off the

8
appliances or other electronic devices remotely using their smartphones; current
transformers to monitor the electricity flow inside the building; AC/DC voltage sensors to
determine the powered state of equipment and alert the building administrators if voltage
levels exceed the device ratings; power synching sensors to create customized triggers in
response to changing state of the plugged-in device (e.g., the building administrator can
have the conference room projector set the lighting level in the room when turned on);
and smart home monitoring kits, which are made by incorporating some of the above-
mentioned IoT sensors in a single package, to provide the homeowners with a more
advanced and affordable way to monitor and stay connected to their house from
anywhere and at all times [7, 8].
Fig 1.2 shows different types of IoT sensors with their leading suppliers, which
are currently on the market for smart building applications.
Fig. 1.2. IoT sensors on the market with their leading suppliers for smart building applications [3].

9
Economic Impact
McKinsey Global Institute has estimated that by 2025, the per year global
economic impact of IoT for the different smart building environments will be as follows
[18]:
• Smart homes: $200 billion - $350 billion
• Smart retail: $410 billion - $1.2 trillion
• Smart offices: $70 billion - $150 billion
• Smart factories: $1.2 trillion - $3.7 trillion
• Smart worksites: $160 billion - $930 billion
The market for IoT sensors for smart buildings is undergoing a favorable progression as
well and offers numerous opportunities for growth and development. Driven by reduction
in cost and energy per sensor, IoT sensors are now becoming more popular for industrial
and consumer applications [19]. Transparency Market Research has estimated the
increase in global market for IoT sensors from $9 billion in 2012 up to $21.60 billion by
2019, growing at a CAGR of 12.2 percent (Fig. 1.3) [20]. ABI Research has estimated an
increase in the market value of enterprise IoT analytics from $4.2 billion in 2014 to $23
billion by 2020, indicating the increasing investment in IoT analytics [21].
While there are considerable opportunities for increased revenue in smart
buildings, these impressive statistics must be balanced with the costly investments
companies must make upfront when employing novel IoT devices and technologies.
Nevertheless, the surplus generated will outweigh the initial expenses. Additionally, IoT

10
technologies can be deployed in existing devices and infrastructures, further minimizing
expenses [3].
Fig. 1.3. Global IoT sensor market forecast ($ billion) (adapted from [20]).
Environmental Impact
With IoT deployed in smart buildings, energy is utilized more efficiently. Also,
control systems are optimized for maximum power absorption from renewable sources
(solar and wind) [22]. This has a positive impact on the environment in terms of less
energy waste and reduced carbon dioxide (CO2) emissions. By 2020, 2 Gigatons annual
decrease in CO2 emissions is expected [23].
Societal Impact
As world’s population continues to grow, it becomes increasingly necessary for
its inhabitants to care for the available resources. With rising living standards globally,
health, convenience, and comfort have become personal priorities. IoT can meet all of

11
these needs and desires through its abilities to sense, collect, transmit, analyze, and
distribute big data [3].
To meet these demands, organizations and institutions will deploy IoT in building
environments, leading to increased energy efficiency and greater control and auditing
capabilities. However, with greater amounts of personal data collected from smart meters
to decrease energy waste (e.g., energy usage data and user movements and activities
tracking data), personal security could be jeopardized if the meter is hacked. For instance,
a hacker could determine if a user is in the building or not or if a child at home alone [3].
While there are cyber-security and privacy risks associated with IoT deployment in smart
buildings, there are overwhelming societal benefits including lifestyle convenience,
public safety, energy conservation, expense reduction, and a healthy living environment
[24]. Individuals and corporations must decide the optimal use of the technology for their
needs based on these tradeoffs [25].
IoT deployment cannot be pushed onto the society and expected to be readily
accepted. People like to take responsibility for their well-being. Considering the
numerous benefits of the deployment of IoT technology, a lot of people might be willing
to try it out. But there will be some people who will resist this technology, even after
being aware of its benefits. For them, IoT technology might not be the need of the hour,
or they might just fear the unknown. Additionally, the competition between nations to
excel at IoT device manufacturing and technology development makes it difficult for a
company to establish a base in a foreign country and utilize its resources [3]. An instance
of this was reported recently in [26] where GE launched its digital foundry in Shanghai

12
and is facing tough competition from the Chinese local firms. In any case, people's
choices must be respected, and they should not be forced down a path that makes them
uncomfortable.
Intelligence for IoT and Energy Management
Modern building owners are enamored by the possibility of being able to reduce
monthly energy bills and resource usage by monitoring and having control over their
building at all times without having to be physically present. IoT is making this concept a
reality and transforming simple building energy management into smart building energy
management. With IoT, every physical object present inside the building will be
networked over the internet through sensors and software enabling these objects to
communicate with one another and with the user over the internet. Some of the
applications of a smart building energy management include improved energy efficiency,
access control, lighting control, fire/leak detection, heating, ventilation, and air
conditioning (HVAC) monitoring and temperature control, and improved building
security [6].
Some of the leading building energy management system (BEMS) developers
include Schneider Electric, Honeywell, Siemens, and Johnson Controls [27]. The BEMS
developed by these companies are computational systems with capabilities including
automated and real-time energy consumption monitoring and control and advanced
building analytics using historic and real-time data. Situational intelligence (SI) must be
incorporated into these computational systems to transform them into computational

13
systems thinking machines [28] to overcome current energy challenges. SI imparts
capabilities including security and stability limit prediction with contingency analysis,
load and generation forecasting, cyber security, and real-time/predictive visualizations
[28]. SI can be implemented by integrating historical IoT sensor data with real-time IoT
sensor data (equation 1.1).
Intelligence (near-future) = (history, current status, some predictions) (1.1)
Fig. 1.4 shows a block diagram of a smart building computational systems thinking
machine that imparts intelligence for IoT and energy management in a building
environment by providing communication (sense-making), computation (decision-
making), and control (adaptation) capabilities [28].
Fig. 1.4. Computational systems thinking machine for smart building environment (extended from [28]) A wide variety of IoT sensors (e.g., motion sensor, lighting sensor, and temperature and
humidity sensor) impart monitoring capabilities to the existing building appliances and
make them better aware of their surroundings. The wireless communication technologies
(e.g., Bluetooth, Zigbee, IPv6, and Wi-Fi) impart connectivity capabilities to the building

14
appliances to transfer sensor data to the cloud, the control system, and other building
appliances. Additionally, these wireless communication technologies enable remote
monitoring and control of the building appliances in smart building electric energy
management. The control system includes devices such as remote control, tablet, and
smartphone, which utilize the sensor data to generate the appropriate control signal and
transmit it to the building appliance (actuator) using the wireless communication
technology. The building appliance uses this control signal to adjust its current state of
operation to account for any deviations in the operating parameters. One such
computational systems thinking machine [28] called the Intelligent Computational
Engine (ICE) is developed in this dissertation and is described in Chapter 3.
Contributions of This Dissertation
The contributions of this dissertation are as follows:
• Detailed review of the role, impact, and challenges and recommended solutions for
implementing IoT in building environments (Chapters 1 and 2) [2, 3, 6, 29]
• Development of a general framework of a control architecture for the Intelligent
Computational Engine (ICE) to overcome current energy challenges in an IoT driven
building environment (Chapter 3) [30]
• Development of building case study environment (i.e., Real-Time Power and
Intelligent Systems (RTPIS) Laboratory) with integration of IoT devices and
technologies) (Chapter 4) [31, 164]

15
• Development of energy consumption prediction models viz. exponential model and
Elman recurrent neural network (RNN) model and their comparison to determine the
most accurate model for use in the development of ICE’s energy consumption
prediction capability (Chapter 5) [31, 164]
• Development of ICE’s cellular computational network (CCN)-based energy
consumption prediction capability (Chapter 6) [30]
• Development of ICE’s optimized control of electric loads capability using particle
swarm optimization (PSO) algorithm and logic connector tool (LCT) (Chapter 7) [30]
• Deployment and dispatch of ICE’s energy consumption prediction and optimized
control of electric loads capabilities in the RTPIS laboratory to demonstrate energy
savings (increased energy efficiency) (Chapter 7) [30]
Summary
IoT for smart buildings presents an exciting area of innovative growth and
development. The important role of IoT in transforming modern day buildings into
energy efficient, smart, and connected buildings was presented in this chapter. Digitizing
the building environment using IoT reduces wasted energy and improves the energy
efficiency of the building environment. The economic, environmental, and societal
impact of IoT for smart buildings was also presented in this chapter. Furthermore, IoT
sensors for smart building environment were discussed in this chapter. The contributions
of this dissertation were enumerated in the last section.
16
CHAPTER TWO
CHALLENGES AND RECOMMENDED SOLUTIONS FOR IMPLEMENTING
IOT IN SMART BUILDINGS
Introduction
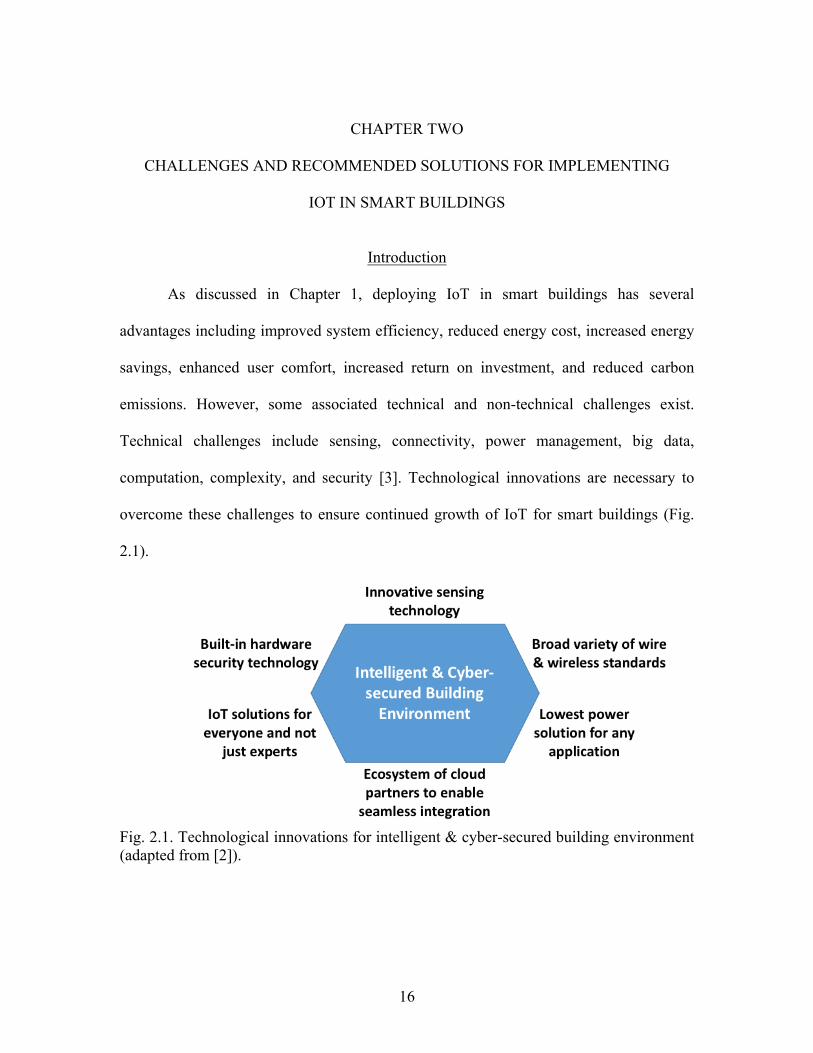
As discussed in Chapter 1, deploying IoT in smart buildings has several
advantages including improved system efficiency, reduced energy cost, increased energy
savings, enhanced user comfort, increased return on investment, and reduced carbon
emissions. However, some associated technical and non-technical challenges exist.
Technical challenges include sensing, connectivity, power management, big data,
computation, complexity, and security [3]. Technological innovations are necessary to
overcome these challenges to ensure continued growth of IoT for smart buildings (Fig.
2.1).
Fig. 2.1. Technological innovations for intelligent & cyber-secured building environment (adapted from [2]).

17
Non-technical challenges include need for behavior change and influence of
social attitudes for uptake of the technologies and buy-in regarding smart buildings from
consumers in order to realize the benefits of deploying IoT technologies in smart
buildings [29]. Thus, it is important to employ science to consider not only the actual
benefits of the technologies under laboratory conditions but also how the technologies
will affect the real lives and communities of human users. Human behavior change and
social attitudes will prove to be a driving factor of the penetration of IoT technologies in
smart buildings [29].
Therefore, studying the implementation of IoT in smart buildings is complex
because it involves not only measuring quantitative success but also consumer
perceptions and satisfaction. To gain a rich, multi-dimensional, synergetic understanding,
quantitative and qualitative data should be integrated [32]. Mixed method research
designs have the capacity to capture the experiences, emotions and motivations of
individuals as well as the objective measures of the successful deployment of IoT
technology in the smart building.
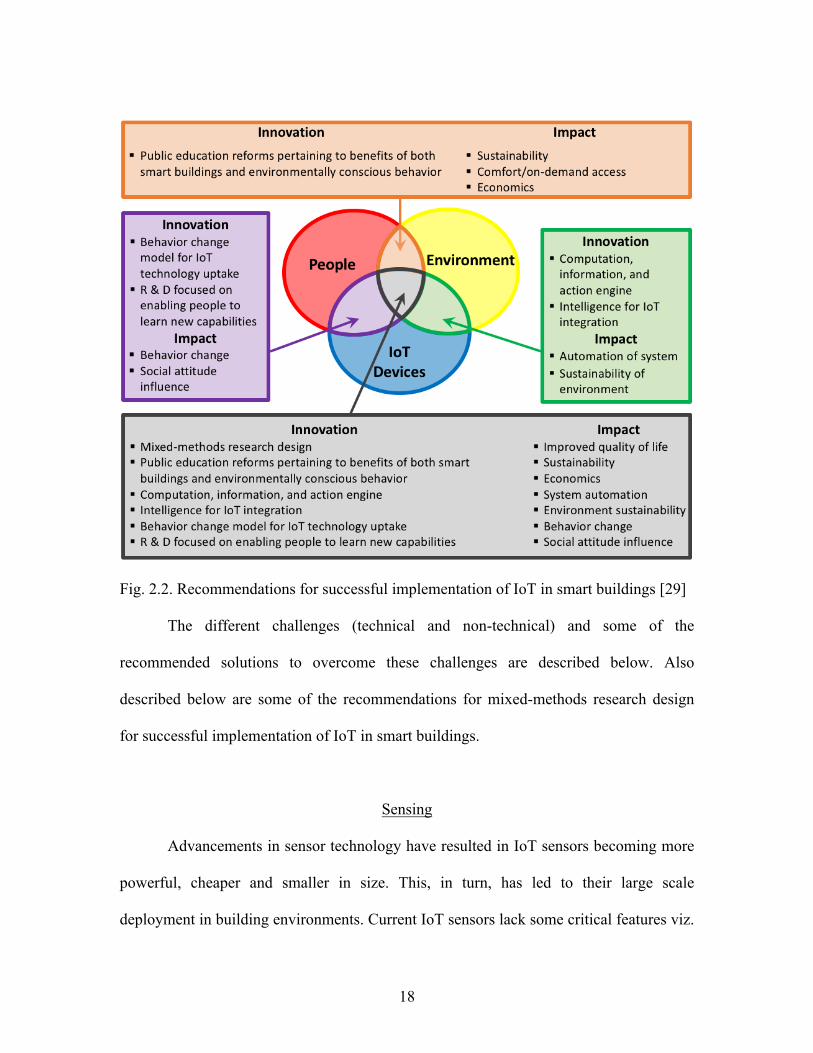
Fig. 2.2 shows the recommendations for successful implementation of IoT devices
and technologies in smart buildings. As presented in the figure, the key entities including
people, IoT devices, and environment overlap or interact with one another and therefore,
should not be treated as distinct entities. Each overlapping region has its associated
impact and innovation needs. In order to realize this transformation goal, the innovation
needs must be fulfilled [29].
18
Fig. 2.2. Recommendations for successful implementation of IoT in smart buildings [29]
The different challenges (technical and non-technical) and some of the
recommended solutions to overcome these challenges are described below. Also
described below are some of the recommendations for mixed-methods research design
for successful implementation of IoT in smart buildings.
Sensing
Advancements in sensor technology have resulted in IoT sensors becoming more
powerful, cheaper and smaller in size. This, in turn, has led to their large scale
deployment in building environments. Current IoT sensors lack some critical features viz.

19
situational intelligence, efficient power management, and enhanced cyber security, which
must be incorporated into future IoT sensors to enhance their functionalities [33].
As discussed in Chapter 1, near-future situational intelligence can be implemented
by integrating historical IoT sensor data with real-time IoT sensor data. Benefits of
implementing near-future situational intelligence in IoT sensors include security and
stability limit prediction with contingency analysis, load and generation forecasting,
cyber security, and real-time/predictive visualizations [28]. For efficient power
management, solutions include using arrays of low-accuracy sensor modules with
subsequent data fusion to generate high-accuracy information, employing energy
harvesting solutions (e.g., light, heat, RF, and vibration) to prolong battery life, and using
digital circuits to design low power sensor nodes [34]. Cyber security solutions include
embedding hardware security features and adding more layers of security [35-37].
Connectivity
Need for Comprehensive Connectivity Standards for IoT
There are many connectivity standards for IoT applications that can broadly be
classified into three categories: service-related, communications-related, and data-related
[38]. The service-related connectivity standards provide definitions for common services
to support IoT applications. They provide definitions for common capabilities, their
respective access interfaces, and the protocols employed over these interfaces in a
manner that enables different IoT applications to gain access to these capabilities across
protocol stacks developed by different standard organizations (e.g., International

20
Telecommunication Union [39], European Telecommunication Standards Institute [40],
oneM2M [41]). Additionally, the service-related connectivity standards develop access-
independent interface standards (e.g., [42] by Telecommunications Industry Association),
addresses carrier portability matters (e.g., [43] by ATIS), and network security concerns
(e.g., [43] by ATIS) for IoT applications. The communications-related connectivity
standards provide definitions for efficient communication mechanisms for supporting IoT
applications. They provide application guidelines to fit the operation of particular
standards, like Transport Layer Security, in an IoT setting (e.g., [44, 45] by Internet
Engineering Task Force (IETF)). They also define additional protocols, like RPL
(pronounced “ripple”) routing protocol for 6LowPAN, to fill gaps in the protocol solution
set for IoT (e.g., [46] by IETF). They also provide support for multiple vertical
application domains (e.g., [47] by IEEE). The data-related connectivity standards provide
definitions for generic mechanisms for supporting versatile data usage and interoperable
data exchange in IoT applications. They provide technology-independent interfaces for
generic data definition and access (e.g., [48] by Open Geospatial Consortium, and [49] by
Object Management Group). Additionally, they provide flexible mechanisms for defining
object identity information and exchanging this information with other administrative
domains (e.g., [50, 51] by OASIS, [38]).
Interoperability between all the different standards available for IoT applications
is critical to support the integration of different types of data generated from a variety of
sources. Interoperability enables the IoT devices to support the curation, provenance and
exposure of data to third party applications enabling rapid innovations in the application
21
and service ecosystems [38, 52]. Without interoperability, there will be challenges with
data representation formats, data dissemination mechanisms, and data management
platforms. The diverse physical and virtual assets can no longer remain disparate entities
in a smart building environment. They must be interoperable entities across IoT
applications. These challenges along with the continuously increasing number of IoT
devices demand the development and implementation of comprehensive connectivity
standards that will be critical in achieving interoperability and seamless transitions
between the physical and virtual domains of IoT [38, 52].
With the emerging 5G cellular communication standard, low-cost and efficient
communication with increased network coverage and bandwidths are expected to support
a sheer scale of IoT devices, the continuously increasing multimedia applications, and an
exponential increase in wireless data [53].
Coexistence Challenge
IoT application in a smart building environment utilizes several connectivity
protocols (e.g., Wi-Fi, Bluetooth, ZigBee, and BLE) for data transmission [54, 55]. Such
heterogeneous connectivity scenarios are faced with the coexistence challenge i.e.,
interferences resulting from interaction between wireless connectivity protocols that
share the same (2.4 GHz) frequency band. These interferences significantly degrade the
network’s quality of service [54].
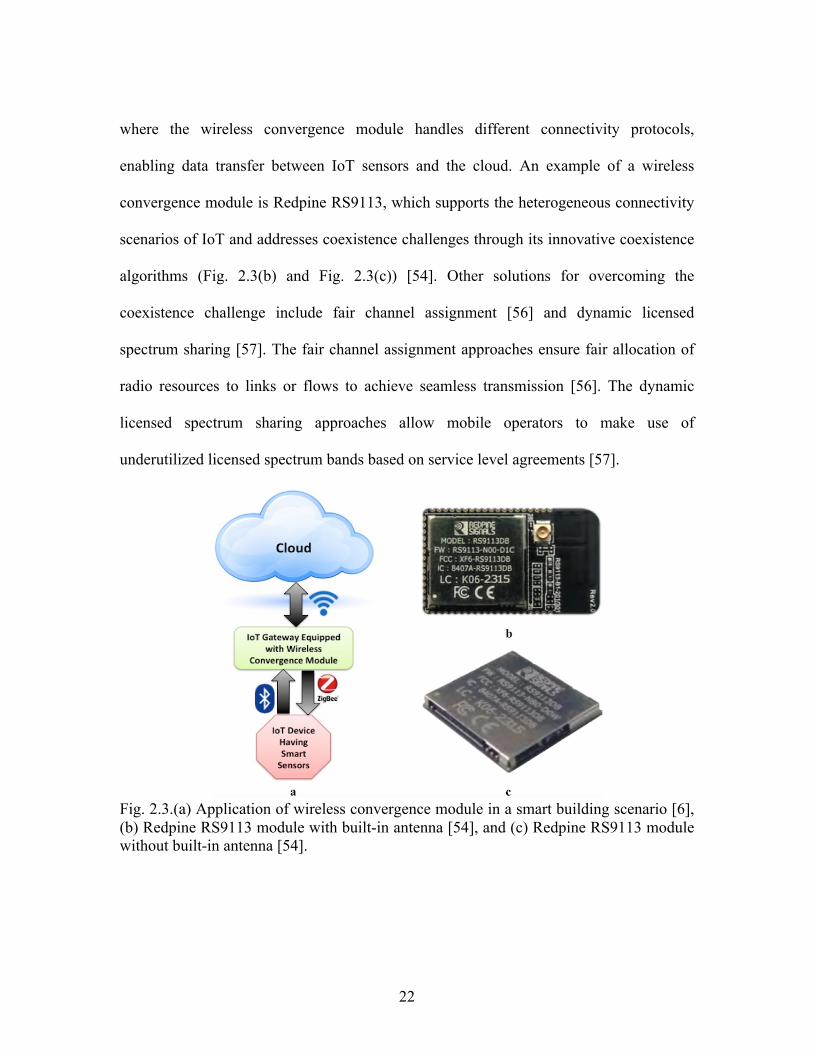
A solution for overcoming the coexistence challenge is with a wireless
convergence module since it can handle multiple connectivity protocols simultaneously
using advanced coexistence algorithms. Fig. 2.3(a) shows a smart building scenario
22
where the wireless convergence module handles different connectivity protocols,
enabling data transfer between IoT sensors and the cloud. An example of a wireless
convergence module is Redpine RS9113, which supports the heterogeneous connectivity
scenarios of IoT and addresses coexistence challenges through its innovative coexistence
algorithms (Fig. 2.3(b) and Fig. 2.3(c)) [54]. Other solutions for overcoming the
coexistence challenge include fair channel assignment [56] and dynamic licensed
spectrum sharing [57]. The fair channel assignment approaches ensure fair allocation of
radio resources to links or flows to achieve seamless transmission [56]. The dynamic
licensed spectrum sharing approaches allow mobile operators to make use of
underutilized licensed spectrum bands based on service level agreements [57].
Fig. 2.3.(a) Application of wireless convergence module in a smart building scenario [6], (b) Redpine RS9113 module with built-in antenna [54], and (c) Redpine RS9113 module without built-in antenna [54].

23
Power Management
Incorporating power management is critical for an IoT device to perform its
designated functions. Based on the position and functionality of IoT devices in a smart
building environment, their power collection methods vary. This makes it challenging to
incorporate power management in IoT devices [3]. The recommended solutions to
overcome the power management challenge in IoT devices are discussed below.
Energy Harvesting System
IoT devices in a smart building may be installed in locations that are not easily
accessible (hazardous, toxic, or hard-to-reach areas) making grid connection or battery
replacement a complex and expensive approach to power these devices. In such
scenarios, an energy harvesting system can be a promising alternative to prolong the
lifetime of the IoT device and reduce their dependency on the grid or battery [58].
The energy harvesting system comprises of three components: energy source,
harvesting architecture, and load (sink for the harvested energy) [59]. An energy source is
the source of energy to be harvested. The energy sources that are present in the
surrounding environment are called ambient energy sources, for example solar, wind and
vibrations. Energy may also be harvested using body movements of humans and is called
human power. Human power can be active or passive depending on whether the body
movements are controllable by the user or not. Examples of active human power include
finger motions and footfalls; and examples of passive human power include exhalation,
breathing, and blood pressure. In general, energy sources can either be controllable or
non-controllable. Controllable energy sources can be harvested as needed. There is no

24
need to predict energy availability before harvesting them. Examples of controllable
energy sources include finger motions and footfalls. Non-controllable energy sources
must be harvested whenever they are available. Prediction models are needed for non-
controllable energy sources to forecast their availability to plan the next recharge cycle.
Examples of non-controllable energy sources include (solar, wind, and vibrations) [59].
Out of all the different energy sources, solar energy emerges as the most promising
harvestable energy source due to the following reasons [58]:
• Solar energy is freely available and easily accessible energy source
• The amount of energy harvested from solar is 24mW/cm2
• It is uncontrollable but predictable
• Solar panels can be made small enough to fit the form factor of wireless IoT sensor
nodes
A harvesting architecture is a mechanism to collect and convert ambient energy to
electrical energy. It either harvests the source energy for just-in-time use (harvest-use
architecture) or stores the harvested source energy for future use (harvest-store-use
architecture). The energy conversion mechanism in the energy harvesting architecture
depends on the energy source being harvested. For example, solar panels are used to
convert solar energy into electrical energy; piezoelectric elements are used to convert
mechanical energy sources such as walking, paddling, pushing buttons/keys, into
electrical energy; and rotors and turbines are used to convert wind energy into electrical
energy [59].

25
Employing energy harvesting systems exclusively to power IoT devices that have
low-energy requirements can make these devices truly portable and self-sustaining in
addition to helping reduce the carbon footprint [58, 59]. Studies have shown that an
energy harvesting system has the potential to prolong the lifetime of low-power IoT
sensor nodes when deployed in randomly distributed multi-hop topology and uniformly
distributed ring topology [60]. Although energy harvesting systems offer promising
benefits, they also have the following associated drawbacks [58]:
• The random and intermittent nature of the renewable sources of energy (e.g., solar
and wind) for energy harvesting systems makes it challenging to provide a stable
power source to the IoT devices.
• RF Energy harvesting systems have very low efficiencies (around 16.3 percent [61]).
Therefore, there is a need to overcome these drawbacks for successful deployment
of ambient energy harvesting solutions to power the IoT devices. A solution to account
for the intermittent nature of renewable sources of energy is to employ storage
technologies (e.g. NiMH batteries, Li-ion batteries, and supercapacitors) to store the
harvested energy [59].
Energy-Efficient Communication Networks
Energy consumption in communication networks is increasing at a tremendous
rate, which is attributed to the rapid rise in the number of IoT devices with networking
capabilities and the progressive growth of information and communication technology.
Therefore, effective power management solutions need to be developed to overcome this
issue. Energy-efficient communication networks for a smart building environment can be

26
achieved by incorporating power management in both peripheral (e.g., IoT sensor nodes
and smartphones) and access (e.g., base stations, switches, and routers) network
equipment of the communication network. This section discusses the energy-efficient
communication techniques for wireless, wired, optical, and optical-wireless
communication networks [62].
Energy-Efficient Wireless Communication Networks
Cellular networks including 3G, 4G, 5G (yet to be launched), WiMAX, ZigBee,
and Wi-Fi are utilized in wireless communication. The metric for energy efficiency in
wireless networks is “bits-per-joule” and is a measure of throughput with regards to unit
energy consumption [62]. The following power management solutions can be
incorporated in wireless communication networks to make them energy-efficient:
• Employing the relaying technique using mobile relays between IoT entities that are
geographically spread, resulting in shorter transmission range requiring low
transmission power [63, 64]
• Using the cooperative communication technique for IoT entities that have different
channel conditions (channel diversity) [63]
• Placing the base station (BS) in sleep mode during low traffic volume since they
account for 60–80% of the whole power consumption in a wireless network [65, 66]
• Using the coordinated multi-point technology, where the function of the base station
is separated into baseband unit and remote radio unit parts. By doing so, the distance
between the user and antennas decreases, resulting in reduced system transmission
power consumption [67].
27
• Adoption of the power saving mode by IEEE 802.11 standards that allow the wireless
nodes to go into sleep mode when they are neither receiving nor transmitting [68]
• Employing networks like ZigBee [69] and ultra-low power Wi-Fi [70], which are
inherently energy efficient, for home area network
• Connecting IoT devices in mesh topology to improve power efficiency and
communication capability [71]
• Using radio frequency energy harvesting to power the wireless communication
networks [72]
• Deploying turbo codes in energy-constrained wireless communication applications
can help decrease RF bandwidth requirements and/or increase information bit rates
significantly, without having to increase the transmission energy consumption [73].
Energy-Efficient Wired Communication Networks
Power line communication (PLC) and Energy Efficient Ethernet (EEE) are
utilized in wired communication [62]. The following power management solutions can be
incorporated in wired communication networks to make them energy-efficient:
• Incorporating spectrum sensing scheme in PLC to reduce its power consumption [74,
75]
• Incorporating green resource allocation scheme in PLC that optimizes data allocation
to the available channels [76]
• Adoption of the power saving mode by HomePlug Alliance (PLC standard for Smart
Grid applications) within its Green PHY 1.1 definition [77]

28
• Employing low-power cycles in EEE with periodic refresh intervals to maintain the
transmitter-receiver alignment and save energy [78]
Energy-Efficient Optical Communication Networks
Fiber optical communication networks offer several advantages including high
speed, large bandwidth, and a high degree of reliability. These networks follow a
hierarchical organization consisting of core (providing coverage ranging from a few
hundred to a few thousand kilometers), metro (providing coverage ranging from a few
tens to a few hundred kilometers) and access (providing coverage ranging over a few
kilometers) domains [62]. The following power management solutions can be
incorporated in optical communication networks to make them energy-efficient:
• Turning off the network equipment (e.g. switches, line cards or the links) that is in its
idle state during low traffic volume [79, 80]
• Employing lightpath bypass technique over lightpath non-bypass technique to
provision survivable demands with minimized power consumption in IP-over-WDM
networks [81, 82]
• Incorporating techniques like multi-path selection [83], multi-granular switching [84],
and energy-aware routing [85] to save energy
• Employing energy-efficient access technologies such as passive optical networks
[86], Ethernet passive optical networks [87, 88], long-reach passive optical networks
[89], and point to point optical networks [90]

29
Energy-Efficient Optical-Wireless Communication Networks
Optical-wireless communication networks, commonly known as fiber-wireless
(Fi-Wi) communication networks, combine the ubiquity, coverage and flexibility of
wireless communication networks with the speed and the reliability of optical
communication networks. To make the optical-wireless communication networks energy-
efficient, the optical network unit (ONU) module of a joint ONU-BS node can be placed
in sleep mode during low traffic volumes. In this case only the BS module from the joint
ONU-BS node handles data forwarding to the peers [62, 90].
Big Data
Hundreds of IoT devices connected across a smart building environment generate
large amounts of data (or big data), making it challenging to store, track, analyze,
capture, cure, search, share, transfer, secure, visualize, and interpret the generated data
[91]. It is challenging to process big data using traditional data processing applications
due to the following unique characteristics that are associated with big data [92]:
• Large volume/quantity of generated data
• Variety in the type of generated data
• Different velocity/speed of data generation
• Variation in the veracity/quality of source data
• Data inconsistency/variability
Big data must be transformed to actionable/intelligent information, knowledge,
and understanding to extract value from it. Understanding is a process by which

30
individuals attach meaning to an experience. Understanding of what matters must be a
priority, especially for critical operations. Additionally, understanding must be gained
from a shared view due to the interconnected (spatial and temporal) nature of the electric
power grid dynamics [28].
A recommended solution to overcome big data storage and processing challenge
is Apache Hadoop – an open-source software framework. Hadoop utilizes large clusters
of commodity servers to enable distributed processing of big data. Hadoop has a number
of advantages including hardware infrastructure scalability, cost efficiency, data type
flexibility, and fault tolerance, which makes it a leading candidate for storing, managing,
and processing big data [92]. It is important to note that Apache Hadoop works well for
smart grid markets days or weeks ahead, but does not work well for real-time application
scenarios like smart buildings. Hence there is a need for real-time big data solutions for
smart building like application scenarios. A prospective solution to overcome the real-
time big data handling and storage challenge involves a collaborative effort from all
leading cloud providers to develop a new IoT cloud ecosystem [91].
IoT Computational Requirements and Capabilities
As compared to human brain, IoT infrastructure is not that complicated. In a
human brain, there are 100 billion neurons with each neuron connected to 10,000 other
neurons [93]. Imparting computational capabilities to the IoT devices and the network-
edge devices (e.g. gateways and routers) have resulted in a paradigm shift from
connected/networked IoT devices to intelligent IoT devices.
31
The advancements in computational intelligence capabilities can evolve an
intelligent IoT system by emulating biological nervous systems with cognitive
computation, streaming and distributed analytics including at the edge and device levels.
Cognitive computation emulates biological thinking, analysis, and strategy, serving as a
learning mechanism for the entire IoT ecosystem. It can identify patterns from large and
diverse data sequences in real-time by weighing the incoming data against the long-term
information and making strong decisions. Several companies such as Intel and
CognitiveScale are exploring intelligent interactions by combining sensors, contextual
data, and cognitive computing to drive new strategies for various industries including
home automation, healthcare, and traffic management. Streaming analytics mimics the
biological spinal cord by controlling the reflex actions that do not need extensive
computations to make decisions in real time. It weighs the incoming analytical data with
historical information in real time to make quick decisions (very low latency). The
decision making with streaming analytics is much faster than batch processing large
amounts of data. There are several cloud solutions (e.g. Amazon Kineses and Azure
Streaming Analytics) and cloud-based, open source or on-premise applications (e.g.
Apache Spark and Apache Storm) that support streaming analytics. Edge and device
computation mimics biological nerves and neurons that filter the incoming data, retain
the data that can be processed locally in the edge devices (impacting only a small part of
the IoT ecosystem), and forward the remaining data to be processed in the cloud
(impacting a larger part of the IoT ecosystem). An example of a small and inexpensive
edge computing device is Raspberry Pi [94, 95].
32
The number of IoT devices and applications are continuously growing leading to
a significant increase in IoT data volume. ABI Research has estimated the IoT data
volume to grow from 233 exabytes in 2014 to 1.6 zettabytes in 2020 [96]. The different
IoT devices and applications generating real-time data are dispersed over large
geographical areas and support a variety of use cases and domains. A centralized
computation and storage solution (e.g. cloud) for real-time heterogeneous IoT data is not
ideal. IoT applications have strict requirements like high throughput during short time
periods, very low latency, and prompt decision making based on real-time data analytics,
which cloud computation cannot satisfy. With all the IoT devices and applications
sending service requests to the cloud, it would be challenging to serve these requests in
real-time resulting in inefficient service-provisioning and increased latency. Additionally,
IoT ecosystems are constrained in terms of low power communications, scarce energy,
and lossy communications, which necessitates localized computation and storage
solutions for processing, analyzing, and storing IoT data [97-101].
Two approaches for overcoming the IoT data computation challenge are discussed
below viz. fog computing and IoT data footprint reduction methods. Deploying these
solutions in the IoT ecosystem will drive the smart building operations using hard
evidence and statistical probabilities rather than relying on soft opinions and intuitions.
Fog Computing
The term fog computing was coined by Cisco Systems, Inc. in 2012 [102]. Fog
computing is a distributed computing infrastructure that provides computational and
33
storage capabilities to the network devices located at different levels in the IoT hierarchy
viz. endpoint level, gateway/server level, and cloud level [97].
Fog computing is based on the principle of edge computing where IoT application
service requests, requiring low latency, support for mobility, and real-time data analysis
with decision making abilities (e.g. smart grid, smart traffic monitoring, and smart
parking), are processed locally within the fog computing devices (e.g. gateways, routers,
and access points). Alternatively, the requests that demand extensive analysis involving
historical data-sets, or semi-permanent and permanent storage (e.g. social media data,
photos, videos, medical history, and data backups), are forwarded to the cloud by the fog
computing devices [97].
Therefore, fog computing and cloud computing are not competing computational
technologies, but are instead complementary. Together they support the IoT applications'
real-time and low latency service requests at the network edge, as well as applications
requiring complex analysis and long-term data storage in the cloud [97, 100, 101].
The following are the advantages of employing fog computing in the IoT
ecosystem. Many of these advantages are a result of the proximity of fog computing
devices to consumers, their dense geographical distribution, and mobility support [98,
103]:
• Refining the generated IoT data by distributing it among the edge devices [96]
• Lowering latency and saving bandwidth by processing IoT applications' service
requests at the network edge [96, 98]
• Improving availability through local storage and analytics [96]
34
• Providing location awareness, improved quality of service, heterogeneity support,
fault tolerance, scalability, and reliability [103]
• Reducing network traffic by increasing the operational size of the network [104]
• Maximizing security and compliance by encrypting critical data packets at the source
[96]
• Saving both time and cost of transmitting the locally generated IoT data to the cloud
over the Internet (high latency network) [105]
• Optimizing the total cost of ownership by reducing the connectivity costs and
increasing the lifetime of battery-operated IoT devices [96]
Although there are several advantages, associated challenges with fog computing
also exist:
• Handling data generated from dissimilar sources because of different protocols and
data formats [104]
• Cyber attacks (e.g. node-compromised attack and man-in-the-middle attack) and
privacy concerns (e.g. data protection and data management issues) [105]
• The unpredictability of the computational availability of the edge devices [106]
• Increased costs and energy consumption at a Fog node due to additional resource
requirement by migrating Fog applications [107].
Several fog computing techniques have been proposed to overcome these
challenges including software defined network and network functions virtualization
[103], schema-less database record [104], task execution by idle edge resources [106],
and smart shadow technique [108].
35
IoT Data Footprint Reduction Methods
As mentioned before, centralized computation and storage are not ideal for IoT
applications. The increased IoT data velocity and volume from the growing scale of IoT
devices can elevate the stress on the communication network resources to a point where
resource starvation occurs. Therefore, it is critical to minimize the traffic inserted into the
communication network. One way to reduce the data traffic is by appropriately
distributing the data between the network elements based on their computation
capabilities and available resources. Another way to reduce the IoT data footprint is
dimensionality reduction method. This method relies on the global awareness and
knowledge of the IoT ecosystem for eliminating redundancy and filtering out the noise
from IoT data packets. The drawback with the dimensionality reduction method is that it
does not address the impact of IoT data exchanges on the communication network. Data
filtering methods are used to address the impact of IoT data exchanges at an operational
level. These methods are distributed throughout the communication infrastructure,
monitoring the IoT data in transit for significant events. Once a significant event is
detected, data filtering methods label them with critical local information (e.g. network
load) resulting in a more efficient treatment for these events at the operational level. The
IoT data footprint on the communication networks can be further reduced by employing
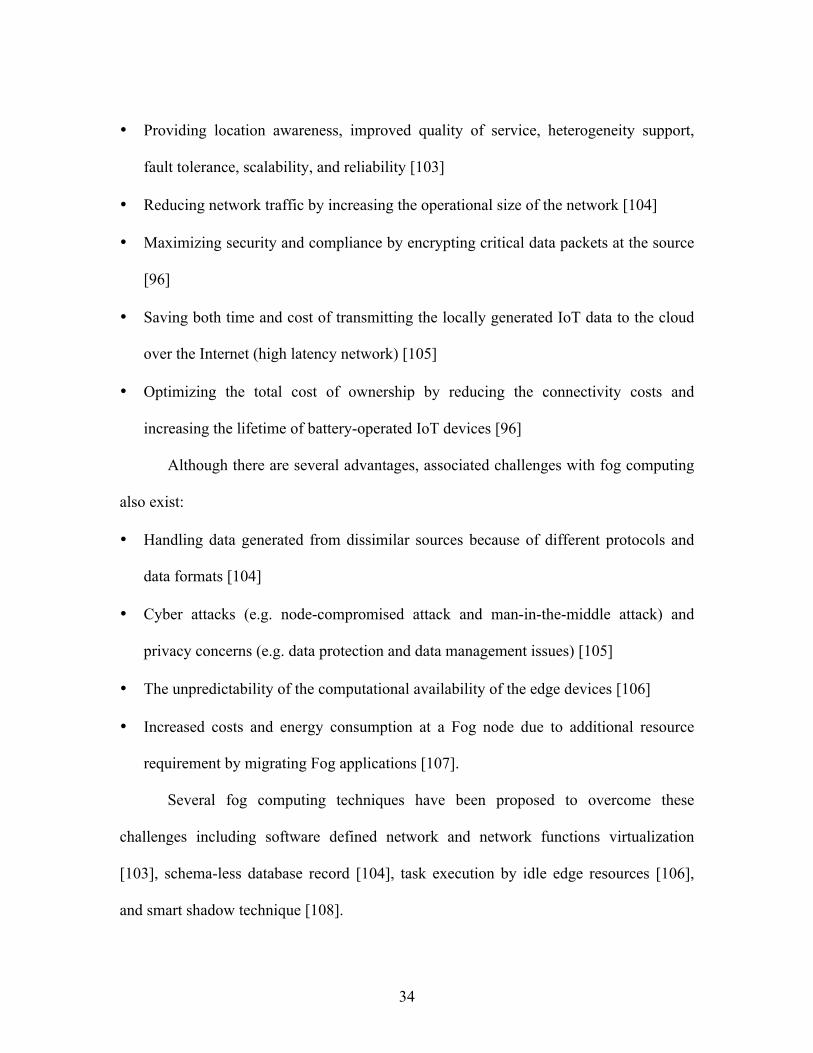
both data filtering and data processing methods within the same IoT node [104]. Neural
Networks can also be employed to reduce data size during transmission over the
communication network (Fig. 2.4) [109].
36
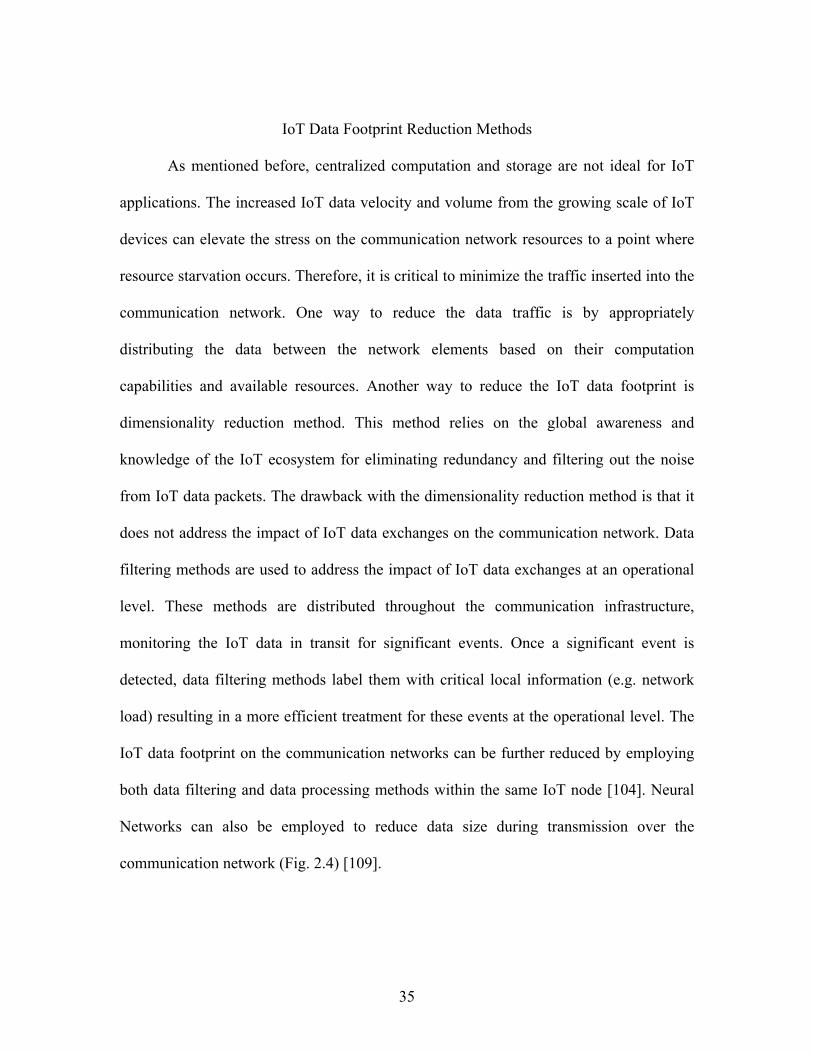
Fig. 2.4. Neural Networks used for reducing data size
Complexity
The expansion of network infrastructure due to the wide penetration of IoT
devices has resulted in increased network size, heterogeneity (different vendors providing
services, equipment, and applications), and complexity [110, 111]. For a lot of these
devices, networked connectivity is a brand new feature. To continue this trend of adding
more IoT devices with networked connectivity that seamlessly integrate with a smart
building environment, IoT device design and development must be simplified [91, 55].
Further, the wireless capabilities must be encapsulated and instead easier to understand
reference designs, modules, and on-chip connectivity stack and development
environment must be provided [91].
The traditional approaches for network optimization, configuration, and
troubleshooting are cumbersome, error-prone, and have proved to be inefficient in
resolving the complexity issue [110]. For example, autonomous system based approaches
have resulted in suboptimal performance, local optimization methods have resulted in
conflicting operations, and the lack of inbuilt programmability, flexibility, and support

37
has resulted in service interruptions while implementing new ideas [112-114].
Additionally, the development, implementation, and testing of new methods for network
optimization, configuration, and troubleshooting takes several years before they can be
deployed, which may render them useless [115, 116]. A promising solution to manage the
growing network complexity is software-defined networking (SDN) [110, 111].
The Open Networking Foundation defines SDN as “an emerging network
architecture where network control is decoupled from forwarding and is directly
programmable [117].” SDN decouples the control plane from the data plane. The data
plane includes devices such as routers and switches that follow the controller rules to
perform packet forwarding. The control plane includes controllers that oversee the
network operations and provide a platform for the implementation of different network
services and applications. The main advantage of SDN is that it offers the rapid
implementation and deployment of innovative solutions (e.g., network security, network
virtualization, and green networking) in the form of software. Additionally, SDN uses the
cross-layer information and global network view in the logical centralization of feedback
control to make better decisions. Therefore, SDN provides enhanced network
configuration, improved network performance, and higher network flexibility to
accommodate innovative architectures and operations [110].
Although SDN provides many benefits to overcome the complexity issue, it also
has some associated challenges including SDN interoperability issues with legacy
network devices, performance and privacy concerns with centralized control, and lack of

38
experts for technical support. Additionally, the shift from traditional networking to SDN
can be disruptive [110].
Security
“A cyber security vulnerability is a weakness in a computing system that can
result in harm to the system or its operation, especially when this weakness is exploited
by a hostile actor or is present in conjunction with particular events or circumstances
[118].” Cyber security is a potential issue for a smart building environment. Recent cyber
attacks on IoT devices include the distributed denial of service (DDoS) attack on Dyn’s
managed domain name system infrastructure using Mirai botnet affecting over 100,000
endpoints [119], ransomware for smart thermostats that lock the user out and demand
bitcoins to release the thermostat [120], Bluetooth smart locks that are easily hacked
[121], DoS attacks by a lightbulb that froze the controls of the entire smart home [122],
and the ease by which a neighbor was able to unlock the resident’s front door smart lock,
connected over Apple HomeKit, and gained entry into the house by simply issuing the
unlock voice command to Siri [123].
Security solutions developed for IT computer systems will typically be
inappropriate for a smart building environment. The attack incident taxonomy used by
Computer Emergency Response Team (CERT) to describe security incidents is shown in
Fig. 2.5 [124]. This taxonomy provides uniform terminology and useful framework to the
security research community. Incidents consist of a set of attacks that are executed to
achieve the desired objectives. Attacks produce unauthorized results by using tools to
exploit system/network vulnerabilities. An attack consists of a sequence of events. Fig.
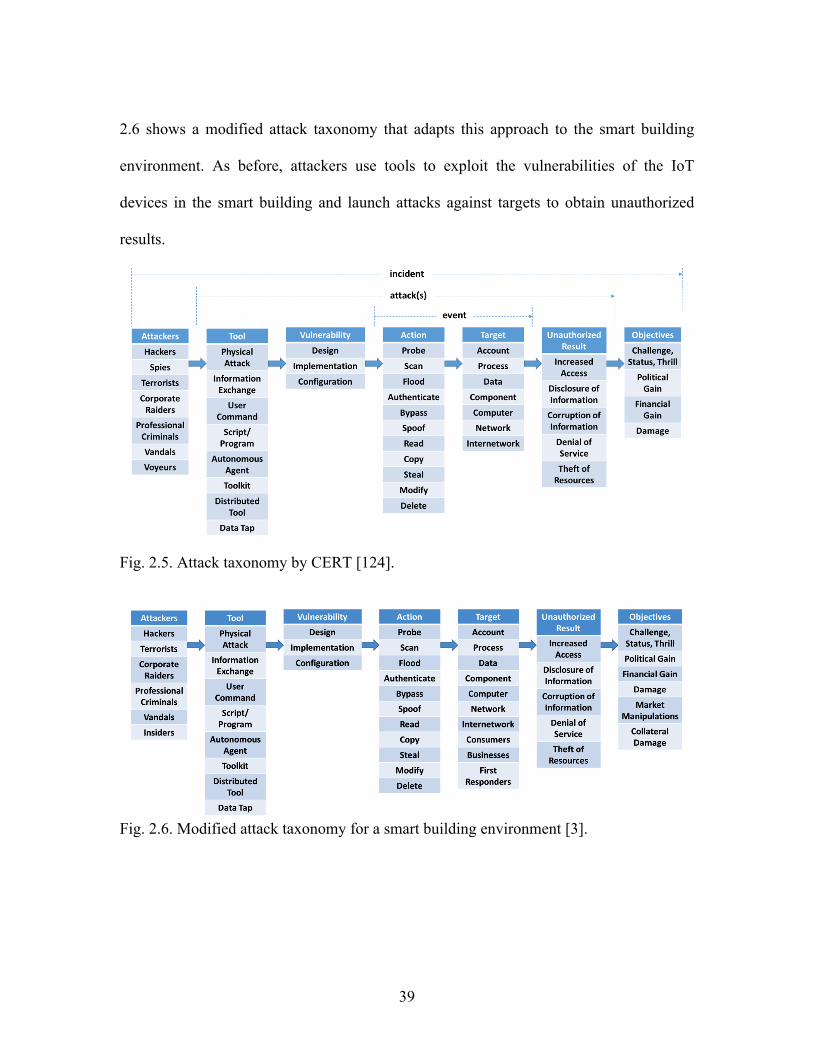
39
2.6 shows a modified attack taxonomy that adapts this approach to the smart building
environment. As before, attackers use tools to exploit the vulnerabilities of the IoT
devices in the smart building and launch attacks against targets to obtain unauthorized
results.
Fig. 2.5. Attack taxonomy by CERT [124].
Fig. 2.6. Modified attack taxonomy for a smart building environment [3].

40
There are four general classes of attacks for the integrity, availability,
confidentiality, access control, authentication, and nonrepudiation security aspects [125,
126]:
• Interruption: Asset availability is disrupted
• Interception: Unauthorized asset access
• Modification: Unauthorized asset tampering
• Fabrication: Fictitious asset creation
Security solutions are needed to overcome these risks and protect the IoT devices,
networks, and sensitive data from security breaches and unauthorized access. Discussed
below are some of the security challenges and recommended solutions for IoT devices in
smart buildings [127].
Interruption Attacks
An interruption attack includes both hardware-based DoS attack or sabotage and
software-based DoS attack [128].
Sabotage and Countermeasures
IoT device hardware or infrastructure sabotage (e.g. cutting a cable or inflicting
damage to a physical IoT device) results in the disconnection of the device from the
network. An example of sabotage in a smart building environment includes inflicting
physical damage to smart meters [129-132]. These attacks can be reduced by limiting
access to critical IoT infrastructure.
41
DoS Attacks and Countermeasures
In DoS attacks, the attacker compromises several machines (or zombies) and
consumes network resources, which overloads the bandwidth of the target and results in
slowed or dropped legitimate traffic (also known as distributed DoS (DDoS)). For
instance, DoS attacks on smart building devices (e.g. smart meters) relying on the real-
time measurement data cause delayed or lost measurements from these devices. This
results in inaccurate demand predictions or complete failure of network measurement
devices. Other examples of DoS attacks include network layer attacks, transport layer
attacks, Local Area Network Denial attacks, and teardrop attacks [133]. In teardrop
attacks, the attackers transmit fragmented packets to a target. Due to a bug in TCP/IP
fragmentation reassembly, the target is not able to reassemble the received packets
resulting in overlapping packets, which crash the target network device [134]. DoS
attacks have the capability to inflict serious damage to the smart building environment
and therefore, must be reduced by using network security techniques such as air gapped
network, anomaly detection approaches, big pipes, and traffic filtering.
An air gapped network is a network security technique that physically isolates a
secure computer network from other insecure networks (e.g. public Internet or an
insecure local area network). It eliminates any communication with the machines not
connected to the local segment. However, there is a drawback to this technique in terms
of the high costs associated with building separate network infrastructures for the smart
building environment.
42
Anomaly detection approaches are used to detect DoS attacks on a smart building
environment. Experimental results have shown that the detection performance is
inversely proportional to the network utilization. Also, the optimal detection parameters
have a strong dependence on the network utilization [135].
Big pipes are large bandwidth network connections that can absorb attack traffic
to mitigate the DoS attack on a smart building environment. However, there is a
drawback to this technique in terms of the high costs associated with it.
A less expensive approach to mitigate DoS attacks on a smart building
environment is traffic filtering. This approach utilizes distributed or redundant
infrastructure to redirect attack traffic [136]. However, there are a couple of drawbacks
with this technique including the lack of documentation to support the claim of filtering
DoS traffic from normal traffic and the difficulty of employing this technique, especially
with large traffic volume [128-130, 136-142].
Interception Attacks
An interception attack gains access to the information that is traversing the
network between the smart building devices (e.g. between IoT sensors and actuators).
These attacks can either be passive or active. Two types of interception attacks, packet
sniffing and side channel attacks, are discussed below [135].
Packet Sniffing and Countermeasures
Attackers can gain access to the contents of the smart meter Transmission Control
Protocol (TCP)/Internet Protocol (IP) packets that are sent across the smart building

43
network using software programs such as Wireshark [128]. This is known as packet
analysis or packet sniffing. In the absence of encryption, the attacker can see and harvest
all the sensitive information in the data packet.
Packet sniffing can be mitigated by using a security gateway that sends packets
through a virtual private network (VPN) tunnel, which is created by embedding an IP
tunnel (with encryption) within the normal IP network payload. The encryption hides the
data from the attackers, making the network private, in addition to being virtual [141].
The communications between VPNs are secured using the Transport Layer Security
(TLS) protocol. The connections between different parties on the smart building network
are secured using the X.509 certificates, which first authenticate users and subsequently
exchange symmetric keys. However, there is a possibility that the X.509 certificates are
compromised or are issued in error [130]. An instance of compromised certificates was
reported in [143], where an imposter tricked VeriSign into issuing two certificates for
Microsoft. Although using VPN tunnels provide smart building network security, they
have associated implementation and design errors. For example, an attack on a VPN
tunnel was reported in [130], where the Heartbleed bug was discovered in the OpenSSL
cryptography library leaving around half a million supposedly secure web servers
vulnerable to cyber attacks. Therefore, it is essential to verify the security of VPN tunnels
during their implementation [130, 137, 141, 144]. Using pre-shared keys is usually
effective. Also, Secure Sockets Layer certificates or TLS certificates, which are generated
by a common root of trust controlled by a trusted entity, can be used.

44
Side Channel Attacks and Countermeasures
From the above discussion, even though VPN encryption provides security for
network connections, side-channel attacks are still possible. In side-channel attacks,
sensitive information can be extracted by observing implementation artifacts [127, 145].
An example side-channel attack is in [134], where the protocol information was extracted
by using a timing side-channel vulnerability for secure shell – a cryptographic network
protocol [146]. This could severely degrade the monitoring of the smart building
environment as the attacker can stop parts of the system’s feedback control and hide
inefficiencies or instabilities in the smart building environment.
To counter side channel attacks on a smart building environment, the
communication channel bandwidth could be saturated to disallow any new patterns to
emerge. However, this approach has an extreme resource requirement and can only be
used in extreme cases [147]. Additionally, the detection of saturated channels, which can
potentially be side channels, helps mitigate side channel attacks in a smart building
environment. Also, building a separate infrastructure for smart building device
communications can help resolve side channel attacks, but it is an expensive approach
[148].
Modification Attacks
Modification attacks exploit security vulnerabilities in a smart building
environment for corrupting, highjacking, or altering a legitimate process. Examples of
modification attacks include man-in-the-middle (MITM) attack, Structured Query
Language (SQL) injection, and malicious code injection [127].
45
MITM Attacks and Countermeasures
In MITM attacks, the attacker poses as the legitimate target to both the legitimate
client and server during the protocol session. In other words, if A and B are
communicating with each other, the intruder I disguises itself as B in front of A and as A
in front of B, thereby replacing the AB link with two links AI and IB [127]. Some of the
MITM attack methods include route table poisoning, modified packet source and
destinations, and compromised certificates [127]. An instance of compromised certificate
of Hypertext Transfer Protocol (HTTP) over TLS (HTTPS) connection was reported in
[149], where the authors used fake certificates to initiate a MITM attack.
To counter the MITM attacks, the network traffic should be encrypted using
security gateways [145]. The security gateway creates a VPN tunnel (unsecure network)
connecting two secure networks. To ensure that the sensitive data is protected when
passing through the VPN tunnel, the security gateway encrypts the data at the source and
decrypts the data at the target. This encryption is typically done in hardware and can be
efficient. Security gateways support smart building communications and interoperability
by employing the Internet Protocol Security (IPsec) protocol. IPsec secures the
communication link by ensuring that the data stays authentic, unaltered, and confidential
throughout the communication process [145]. Additionally, to mitigate MITM attacks,
both the system client and server need to be authenticated [144]. TLS protocols have in-
built public key cryptography mechanisms that can promptly detect and correct any errors
to avoid the occurrence of MITM attacks [128-130, 137, 139, 144, 150].

46
SQL Injection and Countermeasures
In SQL injection, the attacker alters the database by inserting new script
commands [127]. Smart meters continuously send energy usage data to the utilities and
the users, which is stored in a database. The SQL injection occurs if the queries
formulated by the user are not properly validated before inclusion in the SQL query
[151]. This attack can send malicious queries to the database management system to add,
delete, or modify the database contents and take control of the system. This can disrupt
the smart building operations as the attacker can indicate a normal operation state even
when it’s not, which might eventually result in an outage.
SQL injection on smart building networks can be mitigated by using measures
including input type checking, positive pattern matching, penetration testing, static code
checking, limiting database access to remote users, and avoiding dynamic SQL use [152,
153]. In input type checking, the characters that can be abused, like “;”, are filtered out by
the programmer to avoid any malformed input. This is not simple; authors in [154] have
shown that most existing tools for sanitizing inputs have errors. In positive pattern
matching, the user input is matched with the format of a good input. In penetration
testing, SQL injection is attempted on the interface to ensure that these attacks are
properly detected. In static code checking, the program is checked for correctness using
code checking tools. Limiting database access to remote users means that the remote
users should have limited rights on the database and all their inputs should go through an
application program interface (API). Dynamic SQL use should be avoided and user
inputs should be forced to use static templates and existing tables [130, 152, 153].

47
Fabrication Attacks
In fabrication attacks, the attacker creates a fictitious asset on the smart building
network that transmits fabricated data across the network, which may be accepted by
other network assets if not properly authenticated. Data spoofing – a type of fabrication
attack is discussed below [127].
Data Spoofing and Countermeasures
The accuracy of data in the smart building network is critical for its efficient and
reliable operation. In data spoofing, fabricated (inaccurate) data is injected into the
control centers. Data spoofing severely degrades the smart building operation, stability,
security, and reliability, which may result in an outage.
To counter data spoofing, the authors in [129] advise using a single data feed.
Additionally, multiple/redundant smart building devices (smart meters) can be used to
monitor the same electrical transmission bus to reduce data spoofing [83]. Other
approaches to mitigate data spoofing include collaboration among GPS receivers to
efficiently detect any spoofing [155] and synchronizing measurements using the network
time protocol (NTP) across different locations in real time [156]. A combination of NTP
and GPS is recommended to limit the modification of timestamps through GPS spoofing
[124, 129-131, 137, 139, 141, 157].
Need for Behavior Change
Behavioral change is critical for realizing the impact of IoT in smart buildings.
For behavior change to occur, it is necessary to understand the factors that influence a
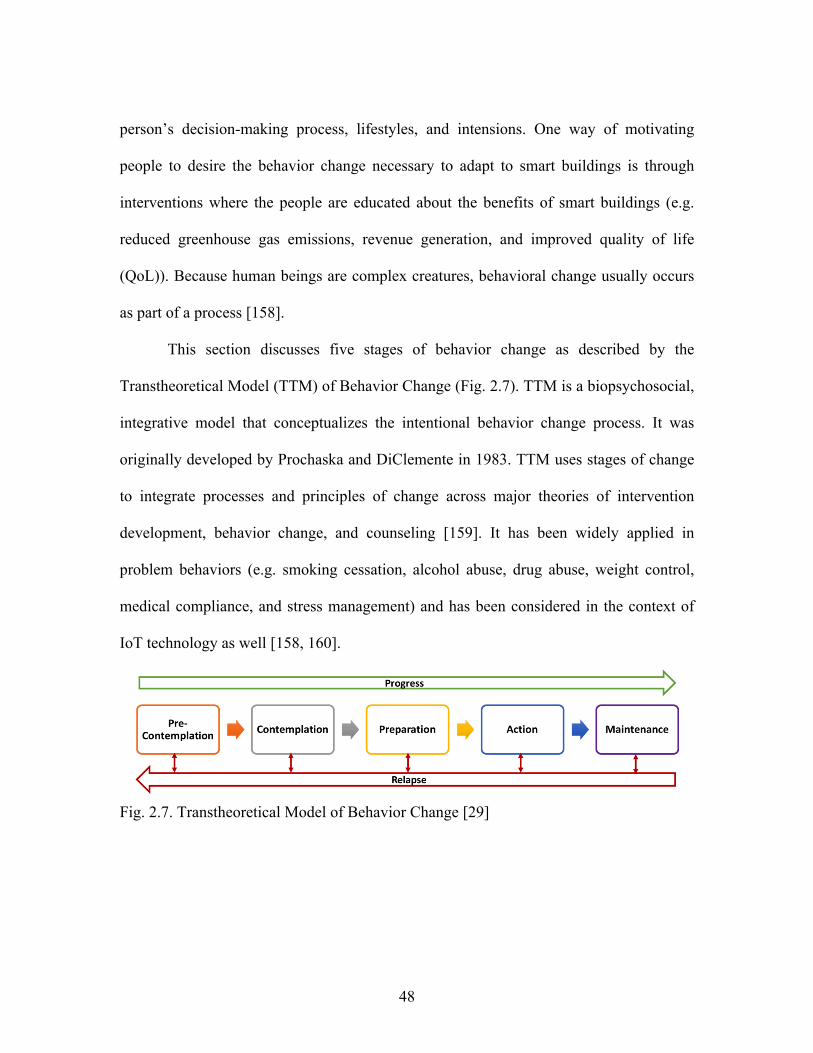
48
person’s decision-making process, lifestyles, and intensions. One way of motivating
people to desire the behavior change necessary to adapt to smart buildings is through
interventions where the people are educated about the benefits of smart buildings (e.g.
reduced greenhouse gas emissions, revenue generation, and improved quality of life
(QoL)). Because human beings are complex creatures, behavioral change usually occurs
as part of a process [158].
This section discusses five stages of behavior change as described by the
Transtheoretical Model (TTM) of Behavior Change (Fig. 2.7). TTM is a biopsychosocial,
integrative model that conceptualizes the intentional behavior change process. It was
originally developed by Prochaska and DiClemente in 1983. TTM uses stages of change
to integrate processes and principles of change across major theories of intervention
development, behavior change, and counseling [159]. It has been widely applied in
problem behaviors (e.g. smoking cessation, alcohol abuse, drug abuse, weight control,
medical compliance, and stress management) and has been considered in the context of
IoT technology as well [158, 160].
Fig. 2.7. Transtheoretical Model of Behavior Change [29]

49
Pre-Contemplation
In the pre-contemplation stage, the person is not aware that he/she needs a change
in behavior. As applied to smart buildings this group includes people who are not aware
of IoT technologies nor of their benefits for smart buildings [29].
To make this group of people interested in and excited about being part of a smart
building, it is necessary to focus on improving communication and raising awareness that
highlights the benefits of IoT technology and its impact on smart buildings. The
information that is shared with this group should be clear, easy to understand, and
tailored to their needs [161]. This information can be disseminated through social media
outlets (e.g. Facebook and Twitter), testimonials from locals they know and trust, and
news stories. By doing so, this group of people will hopefully progress to the
contemplation stage [29].
Contemplation
In general, when people have reached the contemplation stage they realize they
need a behavior change. In the context of smart buildings, these people acknowledge the
existence and benefits of IoT technologies for smart buildings and desire to be a part of
one such building [29].
At this stage it is necessary to foster “self efficacy” in the people by helping them
move from a desire or goal to believing their desire or goal can actually become a reality.
This could be accomplished by empowering people with practical tangible knowledge for
helping them realize how IoT technology can make them energy efficient and save
money in the long run as well as with the idea that they themselves can indeed learn to

50
use the new technological devices. It is important to provide enough information to the
people but not to overwhelm them with too much information at this stage in order to
hopefully move into the preparation stage [29].
Preparation
When reaching the preparation stage, people prepare for action. These people
have the desire and are preparing to be a part of a smart building. These preparations can
include understanding the different resources and IoT technologies available to them,
budgeting these resources to meet their needs, and motivating their neighbors or finding a
group of people that is interested in building or converting to a smart building. With a
myriad of IoT devices available from various vendors, it would be helpful for the people
in this stage to be able to consult with experts to determine the IoT devices and
technologies that best fits their constraints [29].
Action
The action stage is when people actually begin changing behavior. They become a
part of a smart building and start availing IoT devices and technologies. There is much
enthusiasm associated with the novelty of this stage as well as a learning curve for
operating the IoT devices. For instance, IoT technologies are implemented and people
begin to see their effects in their day to day lives in terms of saving time, energy, and
money; and improving their QoL. To engender a community of practice where
participants share information and knowledge, users must be given important feedback
that connects their individual home use with the community as a whole. Giving

51
community members the power to enact change through data-driven choices will provide
a fertile context for exploring their relationships with energy resilience and smart systems
[29].
Maintenance
The maintenance phase is about maintaining the behavior change. People in this
phase are already availing IoT devices and technologies and are living in a smart
building. The goal of this phase is to maintain the “smart nature” of their building on a
daily basis so as not to terminate the behavior and to revert the smart building back to its
“non-smart” state. Once people are reaping the benefits of IoT devices and technologies
in smart buildings, they should feel good about their decision to avail these technologies.
These feelings will motivate the people to continue using IoT technologies and remain
excited to be a part of a smart building. It is vital that the IoT technologies are updated
periodically (software and hardware) to ensure the best user experience. Additionally, the
community has to work together as a society and help its residents stay motivated and
keep up the spirit [29].
The success of the implementation of IoT technologies in smart buildings will be
largely determined by their use by consumers. Thus, understanding the stages of behavior
change can be insightful for industries and researchers in developing solutions to
motivate and sustain behavior change. An important influence that could motivate
personal behavior change related to deploying IoT technologies in smart buildings is
social attitudes toward IoT [29].

52
Influence of Social Attitudes
Social attitudes will greatly influence the health and penetration of IoT in smart
buildings. Members of smart buildings work toward energy resilience using system
information, which involves issues of self-sufficiency, responses to and recovering from
emergencies, and adapting to changing conditions. Achieving energy resilience is crucial
for the vitality of the smart building [29].
One aspect that may greatly influence the development of energy resilience in
smart buildings is the perception of Quality of Life (QoL) among its occupants. As smart
systems change the built environment, the built environment affects the well-being of its
residents. The introduction of smart buildings has the potential to affect the well-being of
its residents, which will be evidenced by their attitudes and behaviors in their interactions
with the smart system and with one another, especially around the topic of energy use.
The social attitude of the building must be supportive of individual and community
behaviors that collectively enhance QoL [29].
According to authors in [162] who conducted expert interviews and public
deliberative workshops in two locations in the United Kingdom regarding smart home
adoption, the public saw many social benefits, including better QoL due to aspects such
as the potential to increase leisure time, save money, make life easier, and provide
support for assisted living as people age. Concerns were also raised, however, regarding
social barriers such as loss of control and apathy; reliability issues; perceiving smart
technology as divisive, exclusive, or irrelevant; privacy and data security; cost; and trust.

53
These benefits and issues are relevant to the development of smart buildings since smart
homes are a subset of smart buildings and directly impact the daily life of their occupants.
With the growth in the development of IoT devices and technologies, there is a
burgeoning need for research and development focused on how people learn to use these
new capabilities to change their minds and improve their knowledge. In order to increase
the penetration and health of smart buildings, it is necessary to determine the motivators
and initial attitudes that impact the willingness of users to engage with their smart
environment [29].
Recommendations for Mixed-Methods Research Design Study for
Implementing IoT in Smart Buildings
Researching the Implementation of IoT
The availability of IoT technology will not necessarily guarantee its uptake and
use in achieving its benefit to society. People often do not progress through the steps
outlined in the TTM of Behavior Change, and it is possible that persons may also regress.
For researchers interested in studying the implementation of IoT in smart buildings, it is
paramount that qualitative data be collected to determine the technological success, but it
is also necessary to garner qualitative data that takes into account the complexity of the
initiative due to many social and behavioral considerations. Therefore, employing mixed
methods research designs can be beneficial. Currently, IoT technology developers rely
primarily on quantitative data to ensure the IoT devices they develop help reduce
electricity waste and generate savings for people using them. As these devices penetrate

54
deeper into society, studying the objective outcome measures alone is not sufficient for
understanding factors that will majorly influence the widespread adoption of IoT
technology. The integration of qualitative methods of data collection and analysis into
this research will involve exploration and understanding of individual and group
behavior, organizational dynamics, and cultural influences [32].
Methods for Collecting and Analyzing Data
Data is collected similarly in the quantitative and qualitative arms of a mixed
methods study in that a sampling criteria and variables or constructs of interest must be
carefully considered. There are three major types of mixed methods study designs
(convergent parallel, exploratory sequential, and explanatory sequential) [32, 163]. The
type of design chosen informs whether the quantitative or qualitative data is collected
first or both datasets are collected simultaneously.
The qualitative research arm of the mixed methods study would likely utilize
focus groups, key informant interviews, and surveys to identify barriers and facilitators
related to the IoT deployment in smart buildings. Structured interviews can be used to
generate a wide range of ideas and topics, whereas focus groups can be used to observe
issues around which there seems to be consensus as well as topics that generate
disagreement [32]. Surveys are often used to generate a large representative sample of
data in order to generalize to the population [163]. Regardless of the chosen data
collection method, a primary goal of the qualitative research would be to use the
information learned to develop interventions that address the priorities and concerns of
the residents.

55
Considerations for Mixed Methods Research Designs
Before employing a mixed methods design, it is important that researchers
carefully consider the purpose of their research and the intended use of their findings in
order to limit external validity issues. For example, it is especially important to consider
the difference in focusing on representativeness versus seeking out information rich cases
[32]. Before pursuing mixed methods research, researchers should also consider their
budget to ensure that there are sufficient resources for this type of design since it is
generally costlier in terms of time, labor, and resources. Mixed methods research also
requires a flexible, dynamic, and often multi-disciplinary team that is willing to learn
from one another and from the data they are collecting. Team members must value the
mixed methods approach, share a common goal, and effectively communicate with one
another in order for the collaboration to be successful [32].
Summary
The technical and non-technical challenges associated with implementing IoT in
smart buildings were described in this chapter. The technical challenges included sensing,
connectivity, power management, big data, computation, complexity, and security. The
non-technical challenges included the need for behavior change and influence of social
attitudes. Some of the viable solutions to overcome these challenges were recommended.
Additionally, recommendations for mixed-methods research design to realize the
potential of IoT for transforming modern buildings into smart buildings were presented in
this chapter.

56
CHAPTER THREE
INTELLIGENT COMPUTATIONAL ENGINE
Introduction
With the growing world population, the demand for access to affordable, clean
and sustainable energy is increasing. Currently, we are faced with problems including
inefficient energy management, wasted energy resources, and expensive energy costs that
make it very difficult to meet the growing energy demands [164]. As discussed in
Chapter 1, the existing building energy management systems need to be transformed into
computational systems thinking (CSTMs) by incorporating situational intelligence [205]
to overcome current energy challenges. One such CSTM has been developed in this
dissertation and is called the Intelligent Computational Engine (ICE). A general
framework of a control architecture for ICE in an IoT driven building environment is
described in this chapter. Also described in this chapter are the features and impact of
ICE.
Features and Impact of ICE
The purpose of developing ICE is not only to overcome the above-stated
problems, but also to make life more convenient, safe, and comfortable. Fig. 3.1 shows a
block diagram of ICE with IoT technologies integration. ICE is a computation,
information and action engine, which receives operational data from IoT sensors,
processes it, and generates actionable information for IoT actuators. This data can be
accessed using smartphone, tablet, or personal computer. Additionally, ICE controls the

57
switching of the electric power from the electric grid to optimally supply energy to the
electric loads in a smart building environment. This, in turn, saves energy, reduces carbon
emissions, generates cost savings, improves system efficiency, and enhances user
comfort [31].
Fig. 3.1. ICE with IoT technologies integration [29]
General Control Framework for Smart Buildings
Fig. 3.2 shows the general control framework of ICE for efficient energy
management in an IoT driven building environment. It comprises of sensing,
communication, computation, control, and visualization blocks. The sensing block
includes IoT sensors that record operational data (e.g. energy consumption, temperature,
occupancy, etc.) and communicate it to the computation block. The computation block
uses historic operational data to develop a prediction model/algorithm, which is used for
analyzing the forecasted/real-time operational data to generate energy consumption
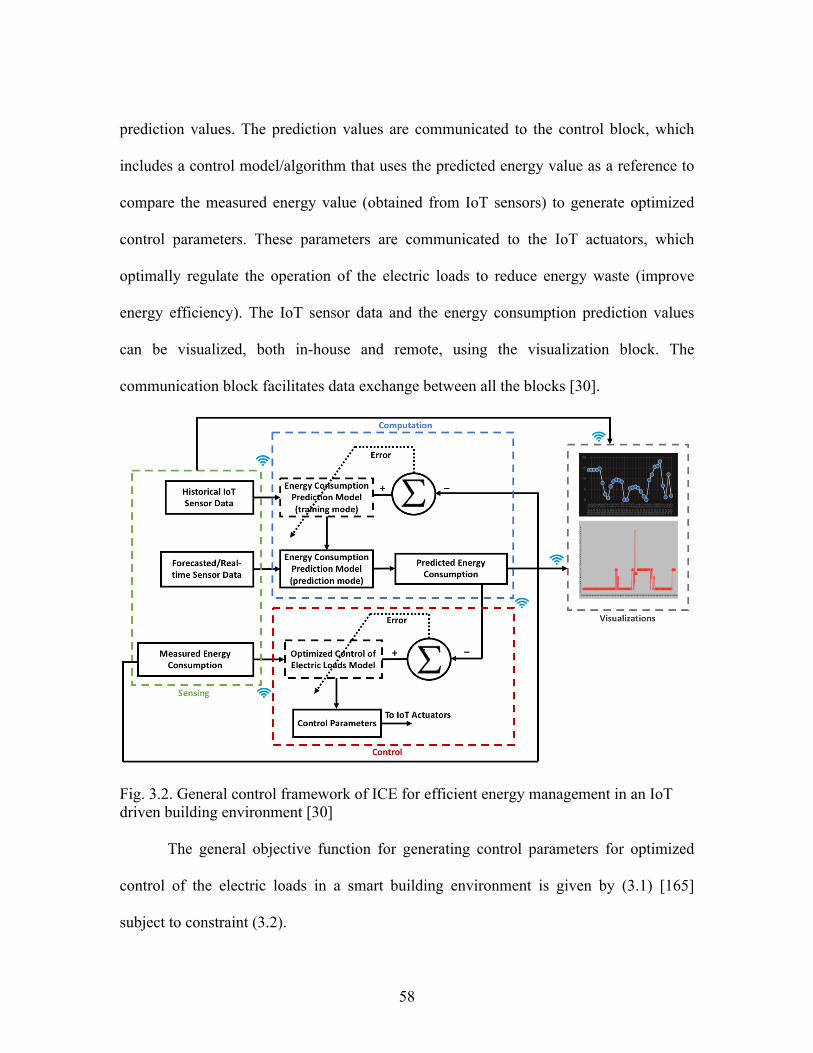
58
prediction values. The prediction values are communicated to the control block, which
includes a control model/algorithm that uses the predicted energy value as a reference to
compare the measured energy value (obtained from IoT sensors) to generate optimized
control parameters. These parameters are communicated to the IoT actuators, which
optimally regulate the operation of the electric loads to reduce energy waste (improve
energy efficiency). The IoT sensor data and the energy consumption prediction values
can be visualized, both in-house and remote, using the visualization block. The
communication block facilitates data exchange between all the blocks [30].
Fig. 3.2. General control framework of ICE for efficient energy management in an IoT driven building environment [30]
The general objective function for generating control parameters for optimized
control of the electric loads in a smart building environment is given by (3.1) [165]
subject to constraint (3.2).
59
max%∑ '(. *(+(,- . (3.1)
where !" is the electric load priority weighting and !" is the electric load magnitude
(kWh) for a particular electric load ! . ! represents the total number of electric loads.
!"# ≤ %&×()* (3.2)
where MEC is the measured/actual energy consumption, SF is the safety factor, and Ref is
the reference to guide the optimization procedure
In the subsequent chapters, the proposed ICE framework is deployed and
dispatched in an IoT driven building case study environment to test for its effectiveness
in terms of reduction in the amount of energy wasted (or improved energy efficiency).
Summary
A solution to overcome the inefficient energy management problem in a building
environment was proposed in this chapter. The solution involves the development,
deployment, and dispatch of ICE for efficient energy management in an IoT driven
building environment. A general control framework providing an overview of ICE’s
capabilities along with its features and impact were discussed. ICE is scalable and
flexible, providing the capability to adapt it for use with any IoT driven building
environment.

60
CHAPTER FOUR
IOT DRIVEN BUILDING CASE STUDY ENVIRONMENT
Introduction
The building case study environment for implementing ICE is the Real-Time
Power and Intelligent Systems (RTPIS) laboratory integrated with intelligent monitoring
and control capabilities using IoT devices and technologies. The electric loads under
consideration include heating, ventilation, and air conditioning (HVAC) units and light
panels. The different IoT devices and technologies and their deployment in RTPIS
laboratory are described in this chapter. Also described in this chapter is the methodology
for data measurement.
Real-Time Power and Intelligent Systems Laboratory
The Real Time Power and Intelligent Systems laboratory is a premier world class
research, education and innovation-ecosystem laboratory for smart grid technologies. It is
housed in the sub-basement of Riggs Hall at Clemson University, Clemson, South
Carolina, USA. The RTPIS laboratory comprises of the following three specialized
laboratories each housed in a separate zone [166]:
• Zone 1 (SB002): Real-Time Grid Simulation Laboratory
• Zone 2 (SB003): Situational Intelligence Laboratory
• Zone 3 (SB007B): Digital Laboratory
The layout of the RTPIS laboratory is shown in Fig. 4.1.
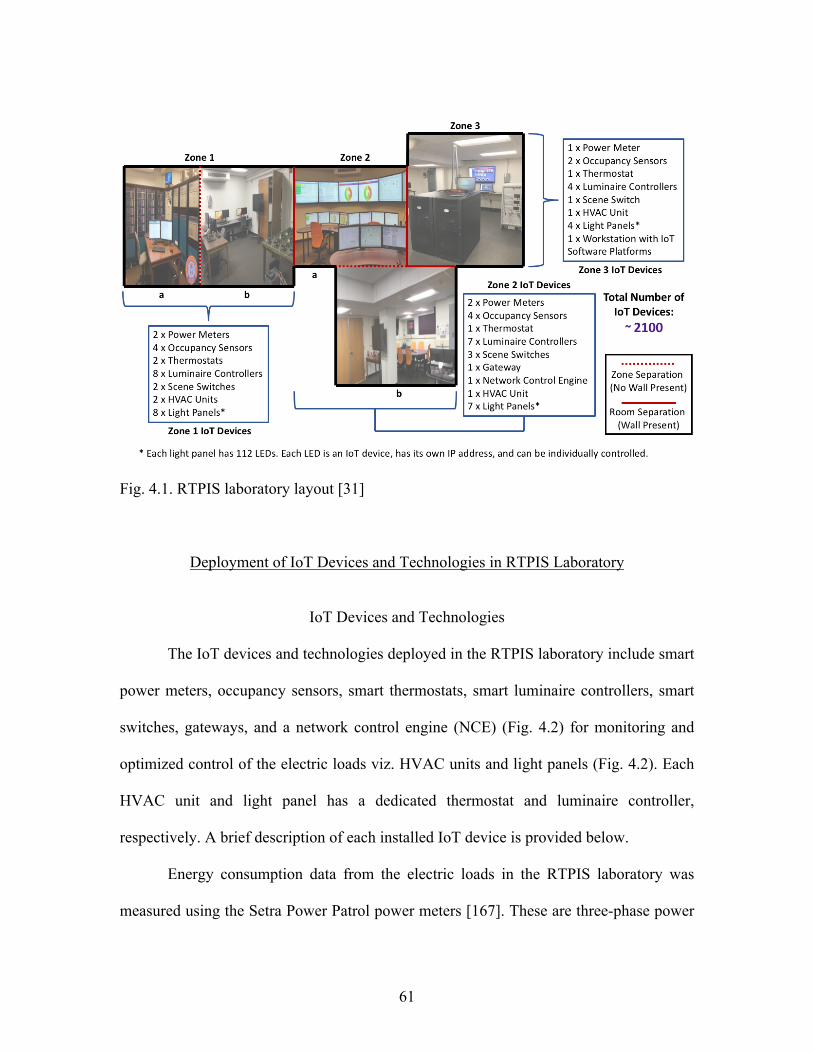
61
Fig. 4.1. RTPIS laboratory layout [31]
Deployment of IoT Devices and Technologies in RTPIS Laboratory
IoT Devices and Technologies
The IoT devices and technologies deployed in the RTPIS laboratory include smart
power meters, occupancy sensors, smart thermostats, smart luminaire controllers, smart
switches, gateways, and a network control engine (NCE) (Fig. 4.2) for monitoring and
optimized control of the electric loads viz. HVAC units and light panels (Fig. 4.2). Each
HVAC unit and light panel has a dedicated thermostat and luminaire controller,
respectively. A brief description of each installed IoT device is provided below.
Energy consumption data from the electric loads in the RTPIS laboratory was
measured using the Setra Power Patrol power meters [167]. These are three-phase power

62
meters that work with Rogowski Coils and communicate either through Ethernet
(Building Automation and Control Network (BACnet) IP/ Modbus TCP) or through RS-
485 serial connection (BACnet MS/TP / Modbus). The Power Patrol BACnet/Modbus
Power Meters offer the following benefits:
• Small form factor that makes it easy to mount inside or outside the panel
• Rogowski and CT compatible, providing added flexibility
• Easy to configure through computer’s USB port
• Supports both BACnet and Modbus-based communication
• No external power required since power meter is line powered from 80-600V
Johnson Controls thermostats [168] measured zone temperatures and controlled
switching off and on of the HVAC units based on user-specified temperature setpoint.
These thermostats offer the following benefits:
• Remote monitoring and temperature setpoint management
• Remote wireless occupancy scheduling
• Programmable temperature and control schedule
• BACnet compatible
• Maintenance-free operation
• Reliable zone comfort
• Enhanced energy economy
• Maximized energy savings without sacrificing user comfort
Each light panel in the RTPIS laboratory had an Audacy luminaire controller
[169] installed in it, which controlled the switching on and off as well as 0-10V dimming

63
of lights. The luminaire controllers are AC-powered, BACnet compatible, operate in
highly reliable 915 MHz spectrum, and easy to install.
Audacy scene switches [170] were wall-mounted in each zone of the RTPIS
laboratory. These switches were pre-configured with four custom scene settings/light
levels (0, 30%, 60%, and 100%) for each room, which allowed on-site occupants to
instantly adjust the light levels according to their preference. The scene switches operate
in highly reliable 915 MHz spectrum, easy to install, and wireless.
RTPIS laboratory’s occupancy state was measured using the Audacy ceiling-
mount occupancy sensors [171]. Additionally, the occupancy sensors controlled the light
panels switching on and off by communicating the occupancy state of the rooms in the
RTPIS laboratory with the luminaire controllers over BACnet protocol. These sensors
offer the following benefits:
• Infrared devices capable of detecting occupancy and/or vacancy
• BACnet compatible
• Easy to mount
The central processing hub included the Audacy gateway [172], the ProtoConvert
gateway [173], and the Johnson Controls Network Control Engine (NCE) [174].
Operational data from occupancy sensors, weather station, thermostats, and power meters
is wirelessly transmitted to the workstation using the central processing hub, where the
data is processed to generate actionable information. This actionable information is
wirelessly transmitted to thermostats and smart luminaire controllers using the central
processing hub. All communications take place over the BACnet protocol.

64
Fig. 4.2. Integration of all the IoT devices and technologies and software platforms using BACnet protocol for data measurement in RTPIS laboratory [30]
Software Platforms
The software platforms used to manage and drive the IoT devices deployed in the
RTPIS laboratory include Metasys Building Automation System software, online Audacy
Interface, and MATLAB (Fig. 4.2). A brief description of each software platform is
provided below.
Metasys Building Automation System software [175] by Johnson Controls is the
state-of-the-art software platform for modern building energy management. It is a world-
class, intelligent technology system that connects the electric loads and IoT devices in the
RTPIS laboratory, enabling them to communicate the desired information that makes
their optimized control possible. This results in increased energy efficiency and enhanced
occupant’s comfort, safety, and productivity. The following are some of the features and
benefits of Metasys Building Automation software:

65
• Web accessible with full capabilities from laptops, tablets, and smart phones
• Easy space-based navigation
• Intuitive design that reduces learning time
• Shows space-by-space status info that makes troubleshooting relatively easy
• Easy to compare equipment performances though single-view equipment summary
• Increased interoperability through support for BACnet protocol
• Follows government and industry best practices for continuous security
improvements
Online Audacy Interface [176] provides a convenient access, monitoring, and
control platform for wireless lighting control using Audacy IoT devices. It comprises of
three primary sections viz. IoT device upload, IoT device scheduling and control, and
electric energy consumption profile. Audacy IoT devices can be uploaded to the online
interface during installation from the IoT device upload section via the mobile app or
desktop computer. Once the IoT devices are uploaded and activated, their preferred
control and scheduling settings can be instantly configured from the IoT device control
section to achieve the desired light intensity levels across the building environment.
Sliders are available in the user interface of the IoT device scheduling and control section
to set dim levels and decide timeout delays for the light panels. The lighting load energy
consumption profiles can be visualized from the electric energy consumption section.
Energy consumption profiles can be broken down by date, room, range, or time period
and can be easily exported for performing further analytics. The following are some of
the features and benefits of Online Audacy Interface:

66
• Easy to program and customize
• Flexible scheduling
• Accessible from Apple devices through the mobile app
• Supports BACnet protocol
MATLAB or matrix laboratory [177] is a proprietary programming language that
was developed by MathWorks. It is the state-of-the-art multi-paradigm numerical
computing environment with professional mathematical, graphical, and programming
toolboxes and interactive apps that are scalable to run on clusters, GPUs, and clouds. In
this research, MATLAB was used to analyze operational data from the IoT devices and
develop optimization algorithms to create optimized control models for the IoT actuators
controlling the electric loads in the RTPIS laboratory.
BACnet Protocol
BACnet protocol [178] is an internationally recognized and accepted protocol. It
is an American national standard, European standard, national standard in more than 30
countries, and ISO global standard. BACnet protocol was developed by the American
Society of Heating, Refrigerating and Air-Conditioning Engineers (ASHRAE). Its
increasing use is attributed to the following benefits:
• Single operator workstation for all systems
• Competitive System expansion
• Eliminates fear of being “locked in”
• Possibility of integrating all building automation and control functions

67
• Interoperability to facilitate efficient data sharing, alarm and event management,
scheduling, and remote device and network management
Data Measurement
Fig. 4.2 shows a circuit diagram with the different data sources (IoT devices) used
for this research and their integration with software platforms using the BACnet protocol
for recording measurement data for different parameters. Energy consumption data from
the HVAC units and light panels is measured using the power monitors, which transmit
this data to the network control engine (NCE). The zone temperature (ZT) and ambient
temperature (AT) data is measured using the thermostats and the weather station
temperature sensor, respectively, which transmit this data to the NCE. The occupancy
state (OS) data is measured using the occupancy sensors, which transmit this data to the
NCE via the Audacy gateway. The NCE transmits all the received data (operational data)
to the Metasys BAS software, where it can be visualized. The operational data is
subsequently transmitted to MATLAB via a BACnet to Modbus TCP/IP gateway where
it is analyzed to obtain actionable information [30].
Summary
This chapter provided a description of the development of the building case study
environment (i.e. RTPIS laboratory) for implementing ICE. Also described in this chapter
were the various IoT devices and technologies and software platforms that were deployed

68
in the RTPIS laboratory over the BACnet protocol. Finally, the measured data for the
research experiment was presented in this chapter.
69
CHAPTER FIVE
ENERGY CONSUMPTION PREDICTION – I
Introduction
Current energy challenges including inefficient energy management, wasted
energy resources, and expensive energy costs need to be addressed to meet the growing
demand for clean, affordable, and sustainable energy [179-182]. Energy generation is
currently controlled based on energy demands of electric loads in near real-time. In this
case, maintaining reserve energy resources operational at all times for generating and
supplying excess energy to account for sporadic increases in energy demands is an
inefficient and unsustainable approach. Electric energy consumption prediction
capabilities are needed to reduce the amount of energy wasted from maintaining reserve
resources operational at all times. With prediction capabilities, the electric energy
consumption can be estimated for the near future and thus, the required amount of energy
can be generated and supplied as needed to meet the demands of the electric loads, which
minimizes wasted energy, reduces carbon emissions, and generates energy and cost
savings [164].
The development of two energy consumption prediction models viz. exponential
model and Elman recurrent neural network (RNN) model have been described in this
chapter. The developed prediction models were compared with each other to determine
the most accurate model for use in the development of ICE’s energy consumption
prediction capability, which is described in chapter 6.
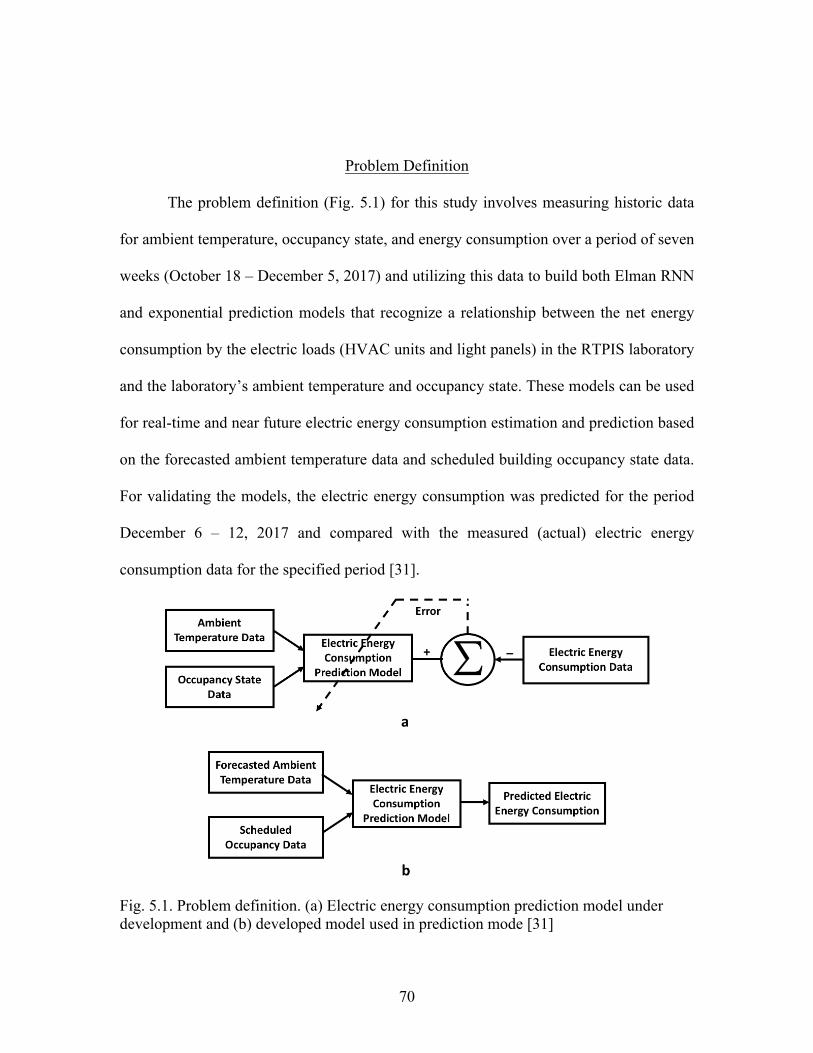
70
Problem Definition
The problem definition (Fig. 5.1) for this study involves measuring historic data
for ambient temperature, occupancy state, and energy consumption over a period of seven
weeks (October 18 – December 5, 2017) and utilizing this data to build both Elman RNN
and exponential prediction models that recognize a relationship between the net energy
consumption by the electric loads (HVAC units and light panels) in the RTPIS laboratory
and the laboratory’s ambient temperature and occupancy state. These models can be used
for real-time and near future electric energy consumption estimation and prediction based
on the forecasted ambient temperature data and scheduled building occupancy state data.
For validating the models, the electric energy consumption was predicted for the period
December 6 – 12, 2017 and compared with the measured (actual) electric energy
consumption data for the specified period [31].
Fig. 5.1. Problem definition. (a) Electric energy consumption prediction model under development and (b) developed model used in prediction mode [31]

71
Measurement Data
The ambient temperature, occupancy state, and electric energy consumption data
was measured over a period of eight weeks (October 18 – December 12, 2017) and had a
resolution of 10 minutes, which makes it a total of 8064 data points (Fig. 5.2). This
measured data was divided into two categories: (1) data used to develop the electric
energy prediction models and (2) data used to test the prediction accuracy of the
developed models. Seven weeks of data (October 18 – December 5, 2017) (7056 data
points) was used to develop both Elman RNN and exponential models for energy
consumption prediction. This data was further separated based on weekday data (thirty-
five weekdays = 5040 data points) and weekend data (fourteen weekend days = 2016 data
points) for improving the accuracy of electric energy consumption predictions as trying to
predict electric energy consumption for the weekend using weekday data or vice versa is
not ideal. The remaining one week of data (December 6 – December 12, 2017) (1008
data points) was used to test the developed models’ energy consumption prediction
accuracies [31].

72
Fig. 5.2. (a) Temperature and (b) occupancy data vs. net energy consumption data for October 18 – December 12, 2017 [31]
Elman RNN Model
Elman RNN was conceived and first used by Jeff Elman in 1990 [183]. It is
usually a two-layer backpropagation network where the output of the hidden layer in the
previous time step (k-1) is fed back as an input to the hidden layer in the current time step
(k). This feedback is the recurrent connection in the Elman RNN that gives the neural
network a short term memory that allows it to generate and recognize spatial and
temporal patterns [184, 185]. The hidden/recurrent layer in an Elman RNN has a
hyperbolic tangent sigmoid (tansig) or log-sigmoid (logsig) transfer function whereas the
output layer has a linear (purelin) transfer function [184].
The Matlab function used to create an Elman RNN is newelm [184, 186]. The
default parameter settings when using newelm include Nguyen-Widrow layer

73
initialization (initnw) function for initializing the weights and biases of each layer, tansig
and purelin transfer functions for hidden and output layers respectively, BFGS quasi-
Newton backpropagation (trainbfg) function for backpropagation training, gradient
descent with momentum weight and bias learning (learngdm) function for
backpropagation weight/bias learning, and mean squared normalized error performance
(mse) function for performance. The mathematical equations for tansig (5.1), purelin
(5.2), and mse (5.3) functions are as follows [177]:
!"#$%& # = ()*+--. − 1 (5.1)
!"#$%&' ' = ' (5.2)
!"# = %& (#(()(*),&
*-% (5.3)
There are two Matlab functions that can be used for training Elman RNN viz.
train or adapt [184]. The following happens at each epoch when using the train function:
The network is presented with the input sequence for which the outputs are calculated.
Next, an error sequence is generated by comparing the outputs with the target sequence.
Once the error is known, error gradients for each bias and weight are determined by
backpropagating this error sequence. It is important to note here that the value of the
gradients is an approximation since in Elman RNN the biases and weights contributions
to error through the delayed feedback or recurrent connection are ignored. Finally, the
weights are updated using the approximate gradient with a backpropagation training
function. The gradient descent with momentum and adaptive learning rate
backpropagation (traingdx) function is recommended and generally used. In the case of
the adapt function, the following happens at each time step: The network is presented

74
with the input vectors and an error is generated. Next, error gradients for each bias and
weight are determined by backpropagating this error. As with the train function, the value
of the gradients in this case is an approximation. Finally, the weights are updated using
the approximate gradient with a learning function. The gradient descent with momentum
weight and bias learning (learngdm) function is recommended and generally used. Since
the training and adaption in an Elman RNN occurs using the error gradient
approximation, this network is not as reliable as some other kinds of networks. A solution
to overcome this drawback and give an Elman RNN the best chance at learning and
solving a problem is to have more neurons in the hidden layer than is typical for any
other network to solve a similar problem [177, 184].
A two-layer Elman RNN model was developed and used for electric energy
predictions. It comprised of two input neurons, ten hidden layer neurons, and a single
output layer neuron (Fig. 5.3). For training the Elman RNN model, the measured
weekday and weekend training data (described above) was divided into three datasets viz.
the input, target, and sample dataset. The input dataset included the ambient temperature
and occupancy state data, the target dataset included the measured electric energy
consumption data, and the sample dataset included the forecasted temperature and
scheduled occupancy state data for electric energy consumption prediction. To avoid
overfitting, the data in each dataset was randomly divided into three subsets: 70% of the
data was used for training, 15% for validation, and 15% for testing [31].
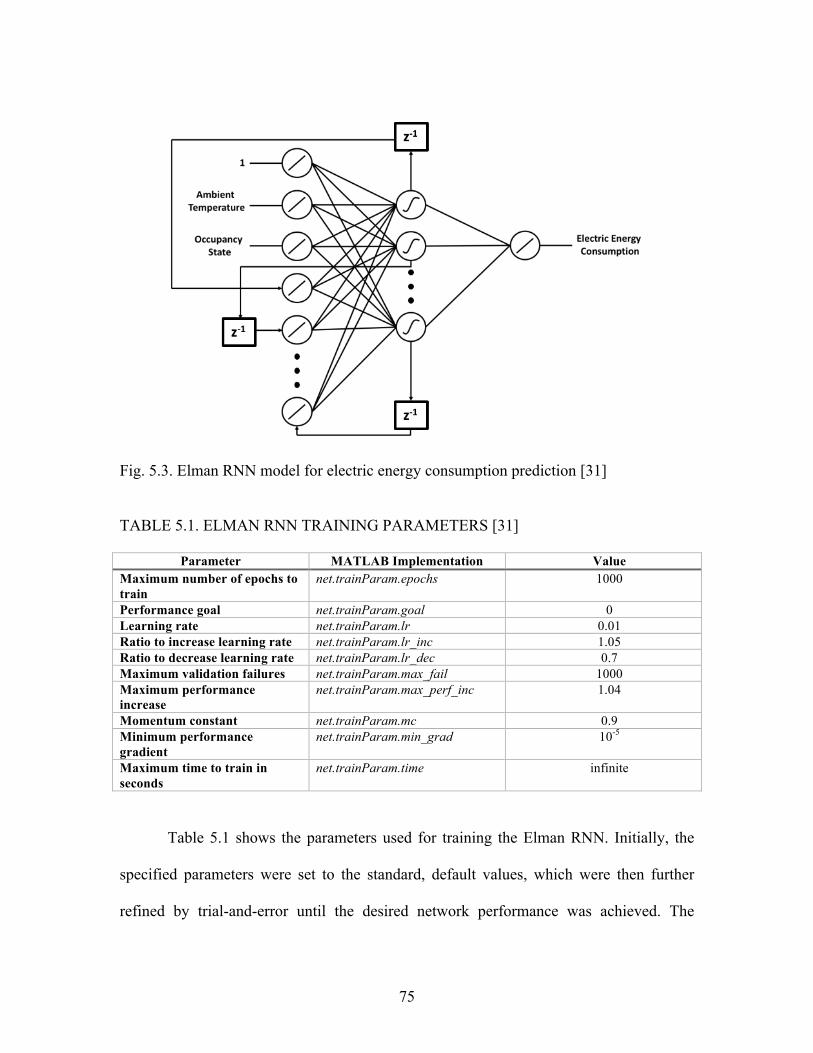
75
Fig. 5.3. Elman RNN model for electric energy consumption prediction [31]
TABLE 5.1. ELMAN RNN TRAINING PARAMETERS [31]
Parameter MATLAB Implementation Value
Maximum number of epochs to train
net.trainParam.epochs 1000
Performance goal net.trainParam.goal 0
Learning rate net.trainParam.lr 0.01 Ratio to increase learning rate net.trainParam.lr_inc 1.05 Ratio to decrease learning rate net.trainParam.lr_dec 0.7 Maximum validation failures net.trainParam.max_fail 1000 Maximum performance increase
net.trainParam.max_perf_inc 1.04
Momentum constant net.trainParam.mc 0.9 Minimum performance gradient
net.trainParam.min_grad 10-5
Maximum time to train in seconds
net.trainParam.time infinite
Table 5.1 shows the parameters used for training the Elman RNN. Initially, the
specified parameters were set to the standard, default values, which were then further
refined by trial-and-error until the desired network performance was achieved. The

76
network was trained separately for weekday and weekend data to obtain the
corresponding weights and biases. The performance (perf) derivatives with respect to the
bias and weight variables X were calculated using backpropagation. The gradient descent
with momentum is used to adjust each variable (5.4) [177].
!" = $%*!"'()* + ,-*$%* .')(/.0 (5.4)
where,
!"#$%& = previous change to bias or weight
!" = momentum constant
!" = learning rate
After each epoch, the network perf is evaluated and the learning rate (lr) is
updated accordingly. If the perf decreases towards the goal, lr is increased by lr_inc. If
the perf increases beyond the max_perf_inc value, lr is decreased by lr_dec. The Elman
RNN training stops when any of the following conditions hold true [184]:
• Maximum number of epochs is reached
• Maximum time to train is exceeded
• Performance goal is achieved
• Performance gradient falls below min_grad value
• Validation performance increases more than max_fail times since the last time it
decreased
The developed Elman RNN model was used to generate the RTPIS laboratory’s
electric energy consumption predictions for the period December 6 – 12, 2017 using the
forecasted temperature and scheduled occupancy state data. The electric energy

77
consumption for the specified period was predicted for weekdays and weekends,
separately using their respective weights and biases. The predicted values were then
compared with the measured net electric energy consumption values for these days and
the %#$$%$ was calculated using (5.5). The results are shown and discussed in the
Experiment Results and Discussions section below.
%#$$%$ = '()*+,-)*./)(0123/4567-+3/-9):45()*./)(0123/4567-+3/9):45()*./)(0123/4567-+3/ ;100 (5.5)
Exponential Model
Particle Swarm Optimization
In summary, PSO utilizes a particle population where each particle is given a
velocity with which it flies through the problem hyperspace. After each iteration, the
velocity for each individual particle is adjusted stochastically depending on its historic
best position and the best position of the swarm. PSO algorithm is referred to as the global
(gbest) PSO or local (lbest) PSO depending on whether the neighborhood of a particle is
the entire swarm or whether a smaller neighborhood is used. The best positions of both
particle and neighborhood are obtained from a user defined fitness function [187-189].
Therefore, movement of each particle evolves towards an optimal solution.
A particle ! in a swarm is represented by its current position (!" ), current velocity
(!" ), and personal best position (!" ). If ! denotes the objective function, then the personal
best position of a particle ! at time ! is updated according to (5.6) [190].
!" # + 1 = !" # ())(+"(# + 1)) ≥ )(!"(#))+" # + 1 ())(+"(# + 1)) < )(!"(#)) (5.6)

78
The global best particle’s position vector (") is given by (5.7) [190].
! " ∈ !$, !&, … , !( = min{/ !$ " , / !& " , … , / !( " } (5.7)
where ! = size of swarm.
For the lbest model, the neighborhood best particle’s position vector ("#) is given by (5.8)
[190].
!" # + 1 ∈ '(|* !" # + 1 = ,-. * !/ # , ∀!/ ∈ '( (5.8)
where each neighborhood, !" = $%-' ( , $%-'*+ ( , … , $% ( , $%*+ ( , … , $%*'-+ ( , $%*' ( (5.9)
These neighborhoods can either be determined using particle indices [191] or topological
neighborhoods can be employed [192].
The velocity !" of a particle ! is updated according to (5.10) [190]:
!",$ % + 1 = )!",$ % + *+,+,$ % -",$ % -/",$ % + *0,0,$ % -$ % -/",$ % (5.10)
where,
! ∈ 1,… ,&'
!" = dimension of the problem
!",$ = ! -th element of the velocity vector of the ! -th particle
! = inertia weight [192]
!" and !" = acceleration constants
!",$, !%,$~'(0, 1)
It is possible to clamp velocity updates at a user defined value of maximum velocity
(!"#$ ). This is done to prevent their explosion, which in turn avoids premature
convergence [193].
The position !" of a particle ! is updated according to (5.11) [190]:

79
!" # + 1 = !" # + '"(# + 1) (5.11)
The equations listed above are updated with each iteration of the PSO algorithm until a
stop condition is reached. This stop condition may either be that the algorithm has reached
its specified number of iterations or that the velocity updates are nearly zero. The
optimality of the achieved solution is measured using a fitness function. Fig. 5.4 shows the
general pseudo code for PSO algorithm.
Fig. 5.4. Pseudo-code for PSO [165]
There are several advantages of PSO that make it very effective for a variety of
optimization problems [194-197] that are similar to the one considered in this paper.
Some of the advantages of PSO include [189, 198, 199]: (1) PSO is relatively simple and
easy to implement with fewer parameters to adjust; (2) it has effective memory capability
to store individual particle’s and neighborhood’s best values; (3) PSO is less sensitive to

80
the objective and the parameters; (4) it is efficient to maintain swarm diversity; and (5)
PSO produces high-quality stable solution with low computational cost. Therefore, PSO
is the chosen candidate for the proposed methodology. The authors in [189] have
performed a detailed review of the basic concepts, different structures, and variants of the
PSO computational intelligence technique.
Objective Function Formulation
To solve the above-mentioned pattern recognition problem using PSO-based
algorithm, it is essential to formulate its objective function. For this study, the objective
function does the following: (1) gathers the RTPIS lab’s ambient temperature and
occupancy state historic data over a period of one week (December 6 – December 12,
2017), (2) calculates the net energy consumption of the RTPIS laboratory based on this
data, and (3) compares the calculated net energy with the measured net energy and
calculates the error [31].
The mathematical formulation of the objective function is shown below
(equations 5.12-5.14) [31].
!"#$ = &. ()*+ + -. ()*+ . + /. )- 1#23 + 4. 5667+8 + 9. 5667+8 . +:. )- ;<<=3> + ? (5.12)
where,
!"#$ = instantaneous net RTPIS lab power consumption (kW)
!"#$ = ambient temperature (°C)
!""#$% = occupancy state of the RTPIS lab

81
!, #, $%&( = decision variables for ambient temperature data having units of kW/ºC,
kW/ºC2, and kW, respectively
!, #, $%&( =decision variables for occupancy state data, all having units of kW
! =constant (kW)
All decision variables and the constant are determined using the proposed PSO algorithm
and are shown in the Results and Discussions section below. The net energy consumption
of the RTPIS lab over time ! can be calculated using equation (5.13) [31].
!"#$% = '"#$($)* +, (5.13)
where,
!"#$% = calculated net energy consumption (kWh)
Using (5.12) and (5.13), electric energy consumption was predicted for the period
December 6 – 12, 2017 using the same forecasted temperature and scheduled occupancy
state data as used in the Elman RNN model. The electric energy consumption for the
specified period was predicted for weekdays and weekends, separately using their
respective parameters. The predicted values were compared with the measured net energy
consumption values for the period, and the %#$$%$ was calculated using (5.14) [31]. The
results are shown and discussed in the Experiment Results and Discussions section below
(Table 5.2).
%#$$%$ = '()*+-'()*-'()*-
.100 (5.14)
where,
!"#$% = measured net energy consumption (kWh)

82
PSO Algorithm to Determine Decision Variables
PSO algorithm was used to generate values of the decision variables
!, #, $, %, &, ', ()*, while minimizing %!""#". A flowchart representing the proposed PSO
algorithm is shown in Fig. 5.5. The parameters specified in the proposed PSO algorithm
are as follows [31]:
• Number of particles = 20
• Number of iterations = 500
• Number of dimensions = 7
• Particle velocity (vi) and position (xi) range = [-100, 100]
• Inertia weight (w) = 0.729
• Acceleration constants c1 = c2 = 1.49
Initially, the specified PSO parameters were set to the standard, tested values, which were
then further refined by trial-and-error until the convergence was achieved. For example,
the inertia weight of PSO was initially set at 0.9 and reduced to 0.729 with iterations.

83
Fig. 5.5. Flowchart of the proposed PSO algorithm to generate values of the decision variables [31].

84
Experiment Results and Discussions
Decision Variables for Exponential Model
TABLE 5.2. VALUE OF THE DECISION VARIABLES, CONSTANT, AND MINIMUM ERROR FOR WEEKDAY AND WEEKEND DATA [31]
Parameter Value for Weekday Data Value for Weekend Data A (kW/°C) 0.0022 0.0382 B (kW/°C2) -0.0002 -0.0027
C (kW) 0.3244 -0.0806 D (kW) 0.2291 0.1350 E (kW) 0.1407 0.1275 F (kW) 0.2342 0.1200 G (kW) 0.2459 0.2764
Minimum Error (gbest) 98.1959 74.4046
Prediction Results
The comparison of the predicted and the measured net electric energy
consumption values using Elman RNN and exponential models, along with the % Error
values are tabulated in Table 5.3 and shown in Fig. 5.6. From the small % Error values, it
can be inferred that the predicted and measured net electric energy consumption values
are very similar for all the days. This validates the developed Elman RNN and
exponential models and shows they work well for electric energy consumption prediction
in a smart building environment.
From the comparison between the Elman RNN model and the exponential model,
it is clear that the Elman RNN model outperforms the exponential model on six out of
seven days of electric energy consumption predictions, thereby making it a more efficient
approach for use in the development of ICE’s energy consumption prediction capability.
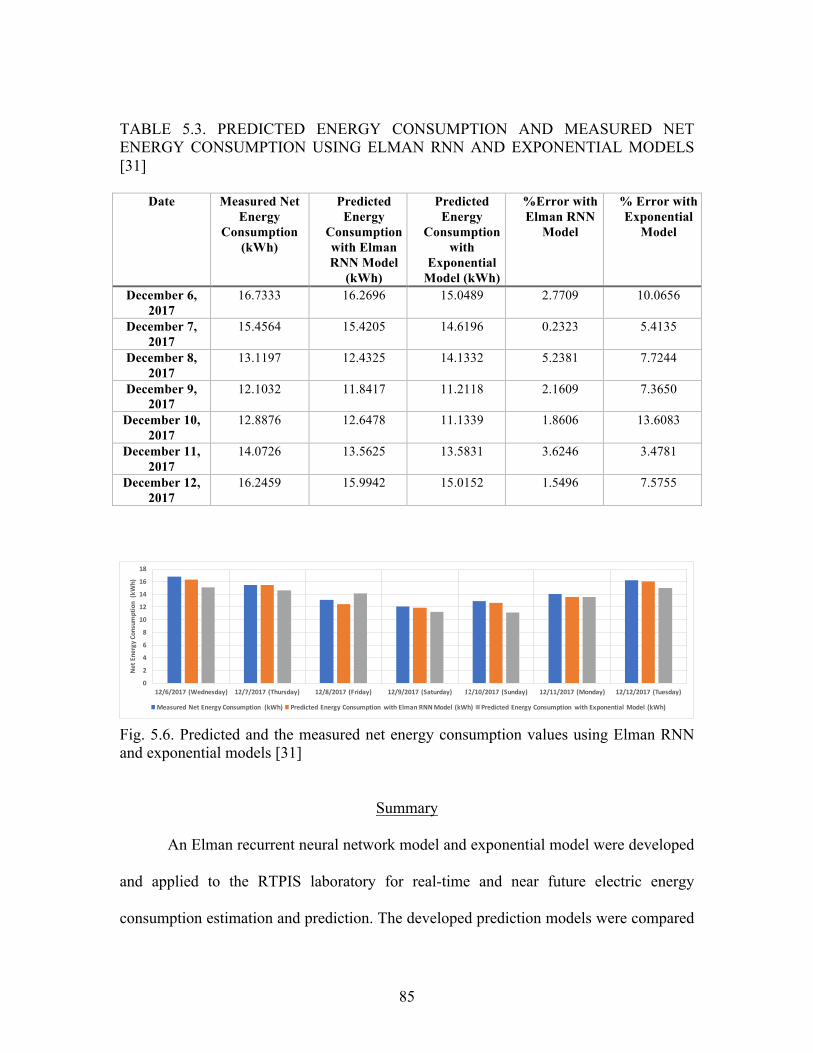
85
TABLE 5.3. PREDICTED ENERGY CONSUMPTION AND MEASURED NET ENERGY CONSUMPTION USING ELMAN RNN AND EXPONENTIAL MODELS [31]
Date Measured Net Energy
Consumption (kWh)
Predicted Energy
Consumption with Elman RNN Model
(kWh)
Predicted Energy
Consumption with
Exponential Model (kWh)
%Error with Elman RNN
Model
% Error with Exponential
Model
December 6, 2017
16.7333 16.2696 15.0489 2.7709 10.0656
December 7, 2017
15.4564 15.4205 14.6196 0.2323 5.4135
December 8, 2017
13.1197 12.4325 14.1332 5.2381 7.7244
December 9, 2017
12.1032 11.8417 11.2118 2.1609 7.3650
December 10, 2017
12.8876 12.6478 11.1339 1.8606 13.6083
December 11, 2017
14.0726 13.5625 13.5831 3.6246 3.4781
December 12, 2017
16.2459 15.9942 15.0152 1.5496 7.5755
0
2
4
6
8
10
12
14
16
18
12/6/2017 (Wednesday) 12/7/2017 (Thursday) 12/8/2017 (Friday) 12/9/2017 (Saturday) 12/10/2017 (Sunday) 12/11/2017 (Monday) 12/12/2017 (Tuesday)
NetEnergyConsum
ption(kWh)
MeasuredNetEnergyConsumption (kWh) PredictedEnergyConsumption withElmanRNNModel (kWh) PredictedEnergyConsumption withExponentialModel (kWh)
Fig. 5.6. Predicted and the measured net energy consumption values using Elman RNN and exponential models [31]
Summary
An Elman recurrent neural network model and exponential model were developed
and applied to the RTPIS laboratory for real-time and near future electric energy
consumption estimation and prediction. The developed prediction models were compared

86
with each other to determine the most accurate model for use in the development of
ICE’s CCN-based energy consumption prediction capability. From the comparison
between the Elman RNN model and the exponential model, the Elman RNN model
emerged as the more accurate model. Although developed for the RTPIS laboratory at
Clemson University, the Elman RNN and exponential models are scalable and flexible,
providing the capability to adapt these models for usage with any IoT driven building
environment.
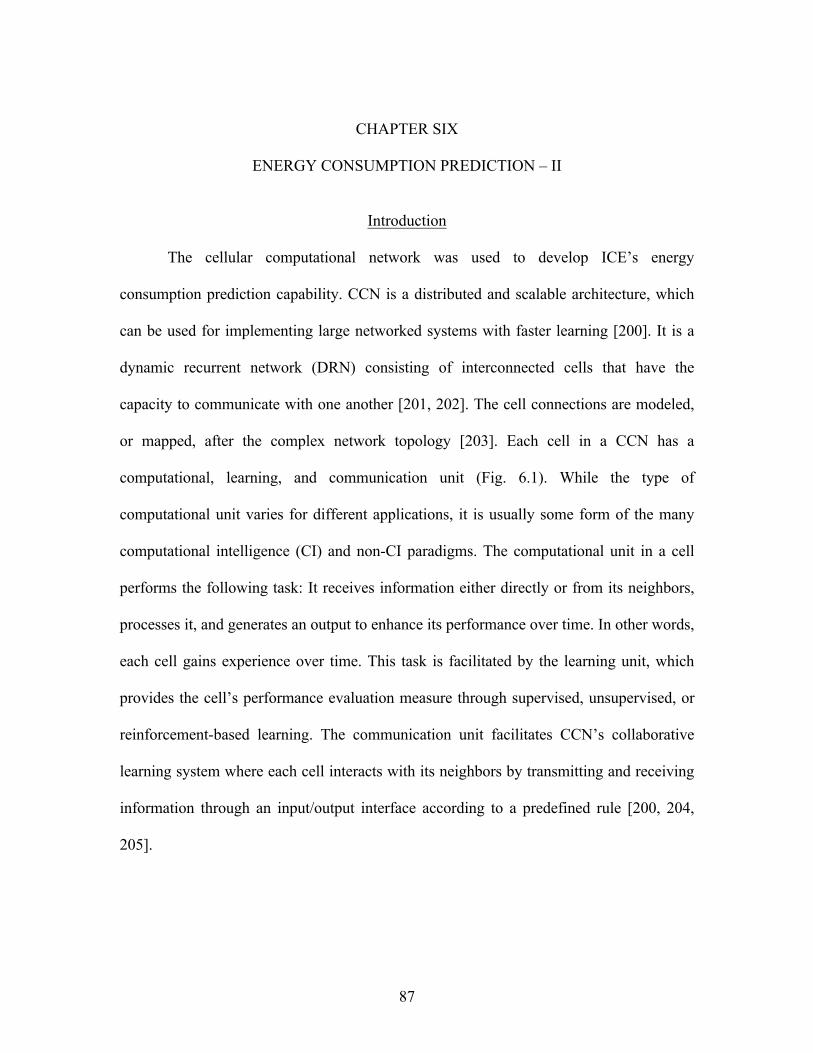
87
CHAPTER SIX
ENERGY CONSUMPTION PREDICTION – II
Introduction
The cellular computational network was used to develop ICE’s energy
consumption prediction capability. CCN is a distributed and scalable architecture, which
can be used for implementing large networked systems with faster learning [200]. It is a
dynamic recurrent network (DRN) consisting of interconnected cells that have the
capacity to communicate with one another [201, 202]. The cell connections are modeled,
or mapped, after the complex network topology [203]. Each cell in a CCN has a
computational, learning, and communication unit (Fig. 6.1). While the type of
computational unit varies for different applications, it is usually some form of the many
computational intelligence (CI) and non-CI paradigms. The computational unit in a cell
performs the following task: It receives information either directly or from its neighbors,
processes it, and generates an output to enhance its performance over time. In other words,
each cell gains experience over time. This task is facilitated by the learning unit, which
provides the cell’s performance evaluation measure through supervised, unsupervised, or
reinforcement-based learning. The communication unit facilitates CCN’s collaborative
learning system where each cell interacts with its neighbors by transmitting and receiving
information through an input/output interface according to a predefined rule [200, 204,
205].
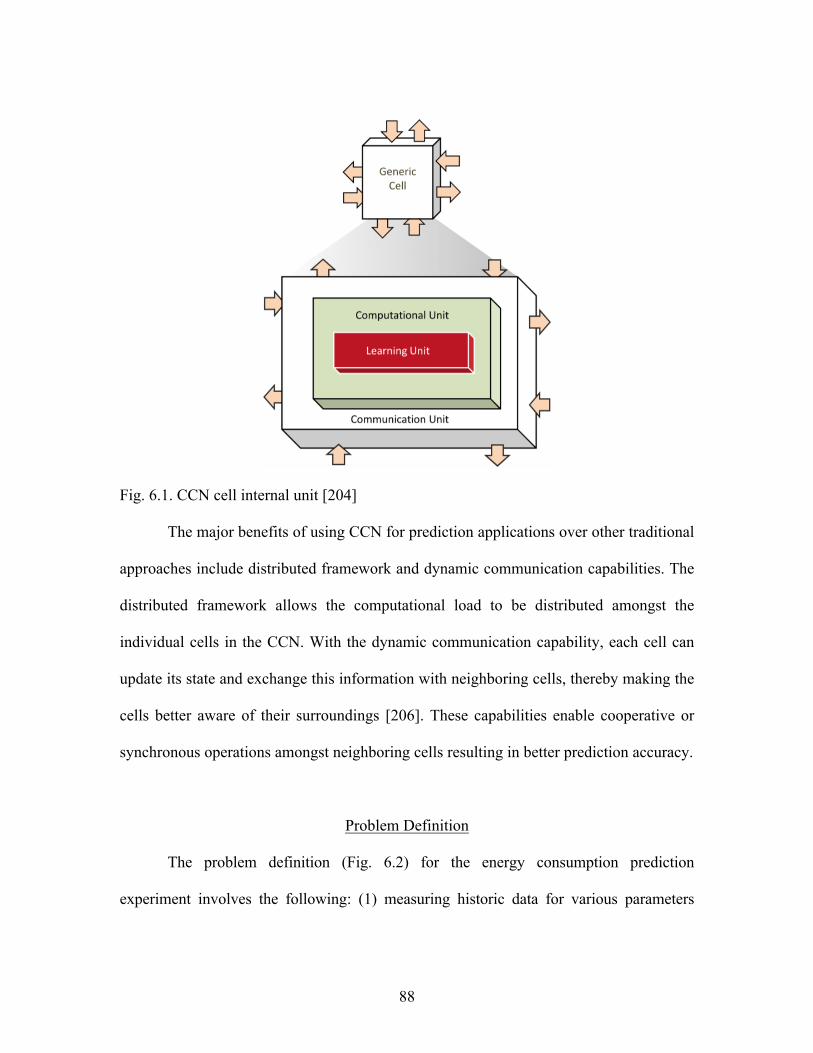
88
Fig. 6.1. CCN cell internal unit [204]
The major benefits of using CCN for prediction applications over other traditional
approaches include distributed framework and dynamic communication capabilities. The
distributed framework allows the computational load to be distributed amongst the
individual cells in the CCN. With the dynamic communication capability, each cell can
update its state and exchange this information with neighboring cells, thereby making the
cells better aware of their surroundings [206]. These capabilities enable cooperative or
synchronous operations amongst neighboring cells resulting in better prediction accuracy.
Problem Definition
The problem definition (Fig. 6.2) for the energy consumption prediction
experiment involves the following: (1) measuring historic data for various parameters
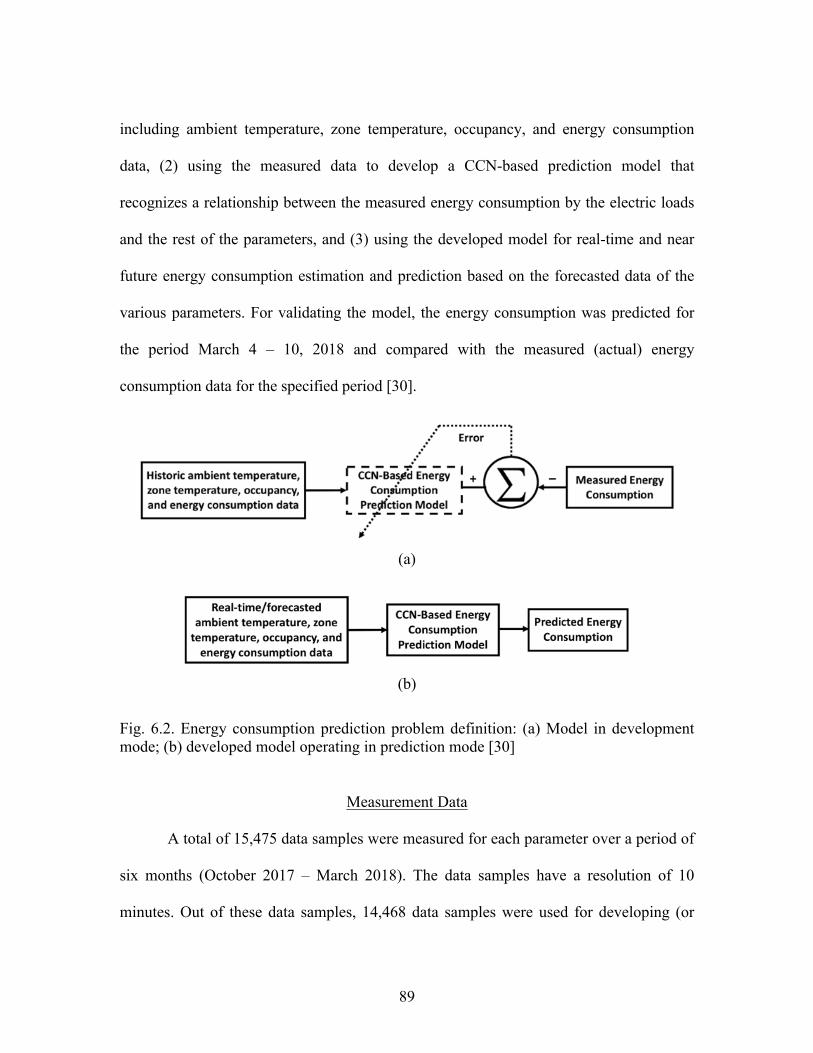
89
including ambient temperature, zone temperature, occupancy, and energy consumption
data, (2) using the measured data to develop a CCN-based prediction model that
recognizes a relationship between the measured energy consumption by the electric loads
and the rest of the parameters, and (3) using the developed model for real-time and near
future energy consumption estimation and prediction based on the forecasted data of the
various parameters. For validating the model, the energy consumption was predicted for
the period March 4 – 10, 2018 and compared with the measured (actual) energy
consumption data for the specified period [30].
(a)
(b)
Fig. 6.2. Energy consumption prediction problem definition: (a) Model in development mode; (b) developed model operating in prediction mode [30]
Measurement Data
A total of 15,475 data samples were measured for each parameter over a period of
six months (October 2017 – March 2018). The data samples have a resolution of 10
minutes. Out of these data samples, 14,468 data samples were used for developing (or

90
training) the CCN prediction model, and the remaining 1007 data samples were used to
test the prediction accuracy of the developed model. Fig. 6.3 shows an example of the
data samples for the different parameters measured over a period of one week (1007 data
samples) [30].
Fig. 6.3. Example of the data samples for (a) ambient and zone temperatures, (b) energy consumption, and (c) occupancy state over a period of one week [30].
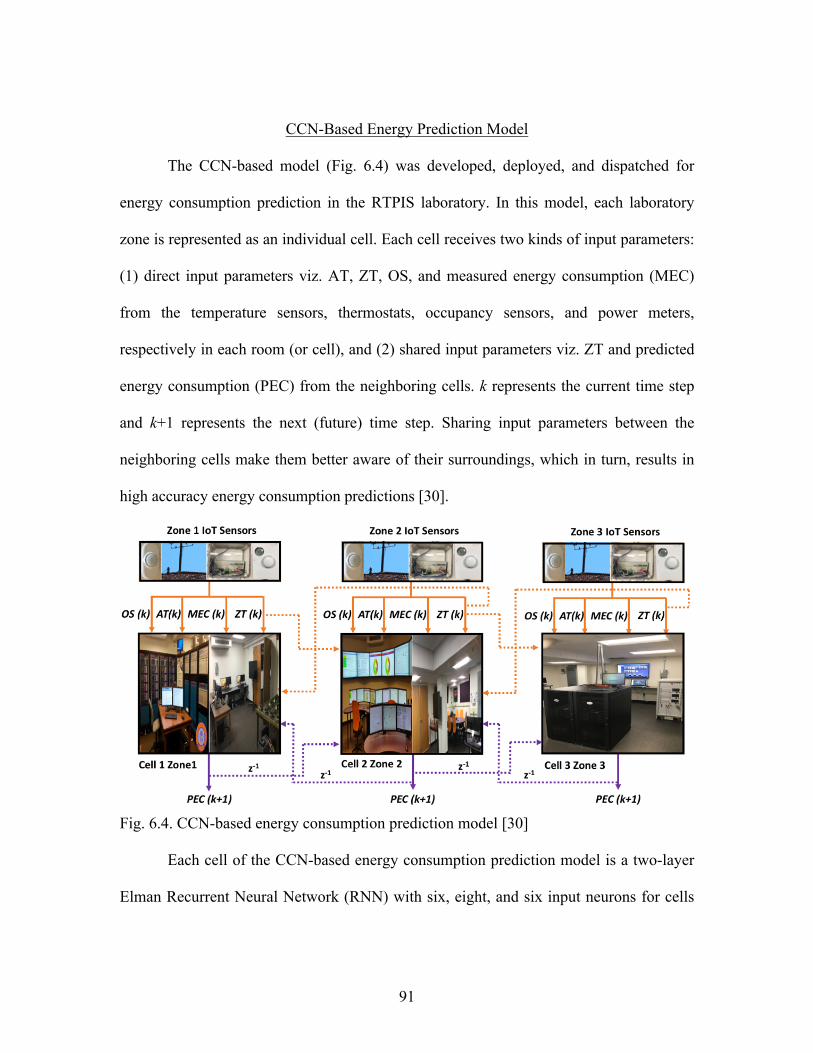
91
CCN-Based Energy Prediction Model
The CCN-based model (Fig. 6.4) was developed, deployed, and dispatched for
energy consumption prediction in the RTPIS laboratory. In this model, each laboratory
zone is represented as an individual cell. Each cell receives two kinds of input parameters:
(1) direct input parameters viz. AT, ZT, OS, and measured energy consumption (MEC)
from the temperature sensors, thermostats, occupancy sensors, and power meters,
respectively in each room (or cell), and (2) shared input parameters viz. ZT and predicted
energy consumption (PEC) from the neighboring cells. k represents the current time step
and k+1 represents the next (future) time step. Sharing input parameters between the
neighboring cells make them better aware of their surroundings, which in turn, results in
high accuracy energy consumption predictions [30].
Fig. 6.4. CCN-based energy consumption prediction model [30]
Each cell of the CCN-based energy consumption prediction model is a two-layer
Elman Recurrent Neural Network (RNN) with six, eight, and six input neurons for cells

92
1, 2, and 3, respectively; ten hidden layer neurons; and one output layer neuron. The
hidden layer output in k-1 time step is fed back as hidden layer input in k time step
providing a short-term memory to the Elman RNN (Fig. 6.5) [184, 185]. Tangent sigmoid
(tansig) and linear (purelin) transfer functions are used for the hidden and output layers,
respectively. Mathematically, tansig and purelin transfer functions are represented using
equations (6.1) and (6.2) [204].
!"#$%& # = ()*+--. − 1 (6.1)
!"#$%&' ' = ' (6.2)
Fig. 6.5. Elman RNN for each CCN cell [30]
Elman RNN is created using the newelm Matlab function [184, 186]. By default,
Nguyen-Widrow layer initialization (initnw) function is used for weights and biases
initialization of each layer, BFGS quasi-Newton backpropagation (trainbfg) function is

93
used for backpropagation training, gradient descent with momentum weight and bias
learning (learngdm) function is used for backpropagation weight/bias learning, and mean
squared normalized error performance (mse) function is used as network performance
metric (equation (3)).
!"# = %& (#(()(*),-
*.% (6.3)
Elman RNN is trained using the train function [184]. The measurement data was
divided into three datasets viz. the input, target, and sample dataset. The input dataset
included AT(k), ZT(k), OS(k), and MEC(k) data; the target dataset included the
MEC(k+1) data; and the sample dataset included the real-time/forecasted input data at
time step (k+d-1) for generating PEC at time step (k+d). To avoid overfitting, the data in
each dataset was randomly divided into three subsets: 70% of the data was used for
training, 15% for validation, and 15% for testing. At each epoch, an input sequence is
presented to the neural network and the corresponding output sequence is calculated. The
output sequence is then compared with a target sequence to generate the error sequence.
This error sequence is then backpropagated to determine performance (perf) derivatives
with respect to the bias and weight variables X, which are subsequently used to update
weights and biases in accordance with equation (4) using the gradient descent with
momentum and adaptive learning rate backpropagation (traingdx) function [184, 177].
!" = $%*!"'()* + ,-*$%* .')(/.0 (6.4)
where,
!"#$%& = previous change to bias or weight

94
!" = momentum constant
!" = learning rate
After each epoch, the network perf is evaluated and the lr is increased or decreased
depending on if the perf decreases towards or increases beyond the goal, respectively.
The developed CCN-based model was used to generate the RTPIS laboratory’s
PEC for the period March 4 – 10, 2018 using the real-time/forecasted AT, ZT, OS, and
MEC data. The predicted values were then compared with the measured energy
consumption values for these days and the %#$$%$ was calculated using (5) [30]. The
results are shown and discussed in the Experiment Results and Discussions section
below.
%#$$%$ = '()-+()+() ,100 (6.5)
Experiment Results and Discussions
The comparison of PEC and MEC values obtained from the CCN model, along
with the % Error values for all three cells from March 4 – 10, 2018 are tabulated in Table
6.1 and plotted in Fig. 6.6. Fig. 6.7 shows both the PEC and MEC waveforms for all three
cells for the week under consideration. From the small % Error values, it can be inferred
that the PEC and MEC values are very similar for all the days. This validates the
developed CCN model and shows that it works really well for the real-time and near
future energy consumption estimation and prediction in an IoT driven building
environment [30].
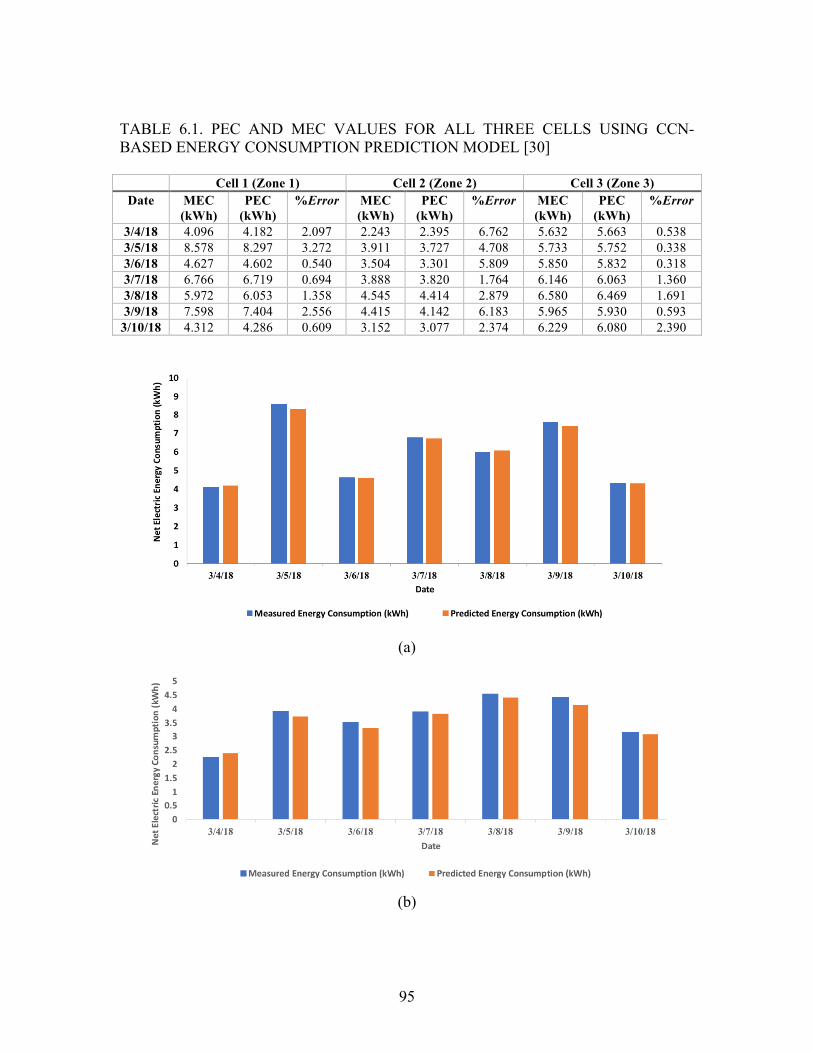
95
TABLE 6.1. PEC AND MEC VALUES FOR ALL THREE CELLS USING CCN-BASED ENERGY CONSUMPTION PREDICTION MODEL [30] Cell 1 (Zone 1) Cell 2 (Zone 2) Cell 3 (Zone 3)
Date MEC (kWh)
PEC (kWh)
%Error MEC (kWh)
PEC (kWh)
%Error MEC (kWh)
PEC (kWh)
%Error
3/4/18 4.096 4.182 2.097 2.243 2.395 6.762 5.632 5.663 0.538 3/5/18 8.578 8.297 3.272 3.911 3.727 4.708 5.733 5.752 0.338 3/6/18 4.627 4.602 0.540 3.504 3.301 5.809 5.850 5.832 0.318 3/7/18 6.766 6.719 0.694 3.888 3.820 1.764 6.146 6.063 1.360 3/8/18 5.972 6.053 1.358 4.545 4.414 2.879 6.580 6.469 1.691 3/9/18 7.598 7.404 2.556 4.415 4.142 6.183 5.965 5.930 0.593
3/10/18 4.312 4.286 0.609 3.152 3.077 2.374 6.229 6.080 2.390
(a)
(b)

96
(c)
Fig. 6.6. PEC and MEC values for (a) cell 1, (b) cell 2, and (c) cell 3 using CCN-based energy consumption prediction model [30]
Cell 1: Zone 1

97
Cell 2: Zone 2

98
Cell 3: Zone 3
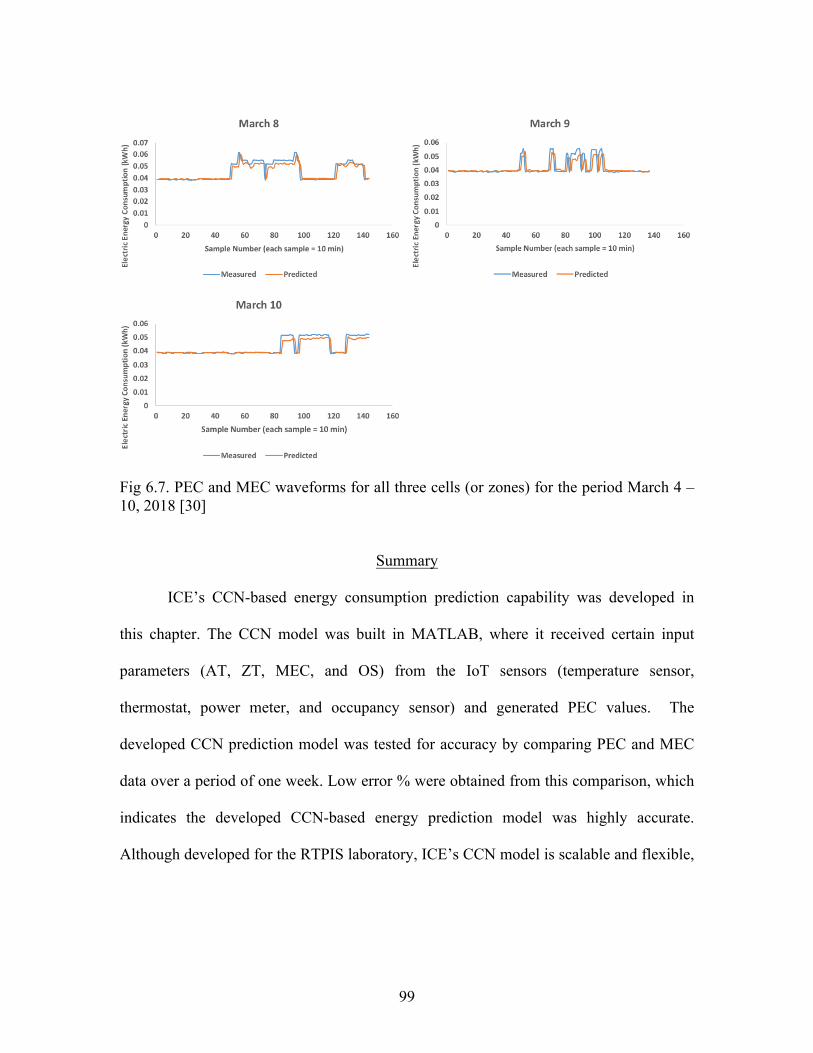
99
Fig 6.7. PEC and MEC waveforms for all three cells (or zones) for the period March 4 – 10, 2018 [30]
Summary
ICE’s CCN-based energy consumption prediction capability was developed in
this chapter. The CCN model was built in MATLAB, where it received certain input
parameters (AT, ZT, MEC, and OS) from the IoT sensors (temperature sensor,
thermostat, power meter, and occupancy sensor) and generated PEC values. The
developed CCN prediction model was tested for accuracy by comparing PEC and MEC
data over a period of one week. Low error % were obtained from this comparison, which
indicates the developed CCN-based energy prediction model was highly accurate.
Although developed for the RTPIS laboratory, ICE’s CCN model is scalable and flexible,

100
providing the capability to adapt this model for usage with any IoT driven building
environment.
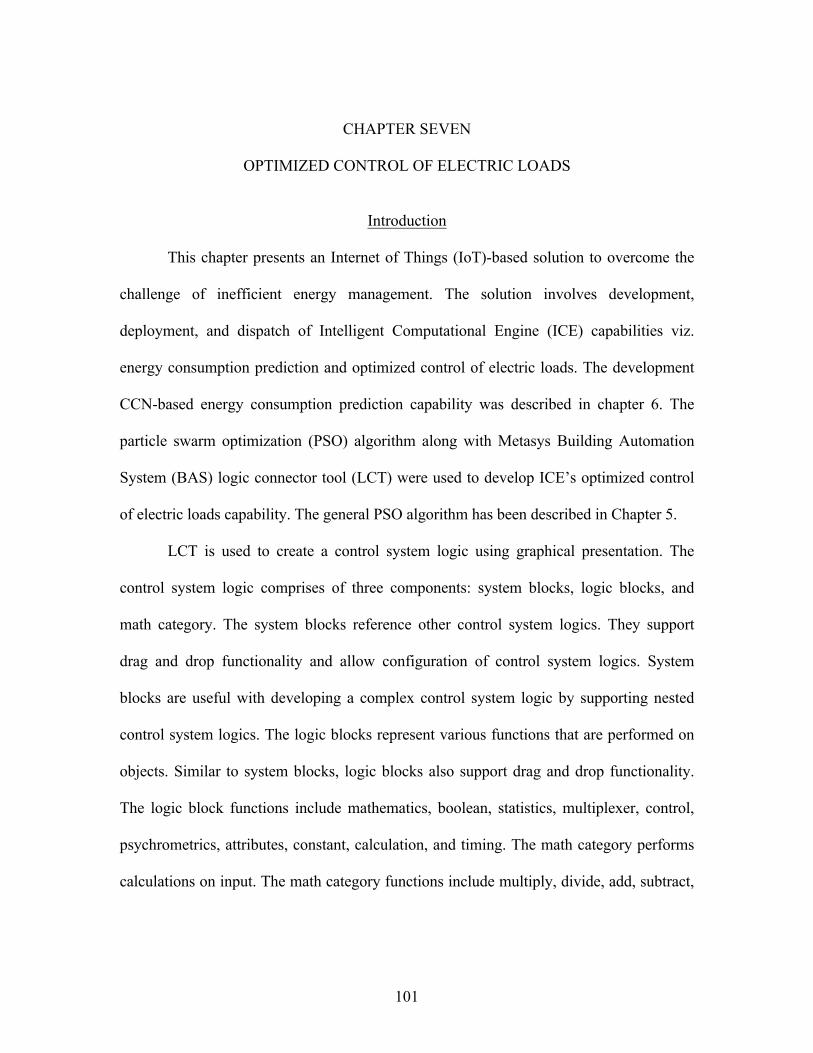
101
CHAPTER SEVEN
OPTIMIZED CONTROL OF ELECTRIC LOADS
Introduction
This chapter presents an Internet of Things (IoT)-based solution to overcome the
challenge of inefficient energy management. The solution involves development,
deployment, and dispatch of Intelligent Computational Engine (ICE) capabilities viz.
energy consumption prediction and optimized control of electric loads. The development
CCN-based energy consumption prediction capability was described in chapter 6. The
particle swarm optimization (PSO) algorithm along with Metasys Building Automation
System (BAS) logic connector tool (LCT) were used to develop ICE’s optimized control
of electric loads capability. The general PSO algorithm has been described in Chapter 5.
LCT is used to create a control system logic using graphical presentation. The
control system logic comprises of three components: system blocks, logic blocks, and
math category. The system blocks reference other control system logics. They support
drag and drop functionality and allow configuration of control system logics. System
blocks are useful with developing a complex control system logic by supporting nested
control system logics. The logic blocks represent various functions that are performed on
objects. Similar to system blocks, logic blocks also support drag and drop functionality.
The logic block functions include mathematics, boolean, statistics, multiplexer, control,
psychrometrics, attributes, constant, calculation, and timing. The math category performs
calculations on input. The math category functions include multiply, divide, add, subtract,
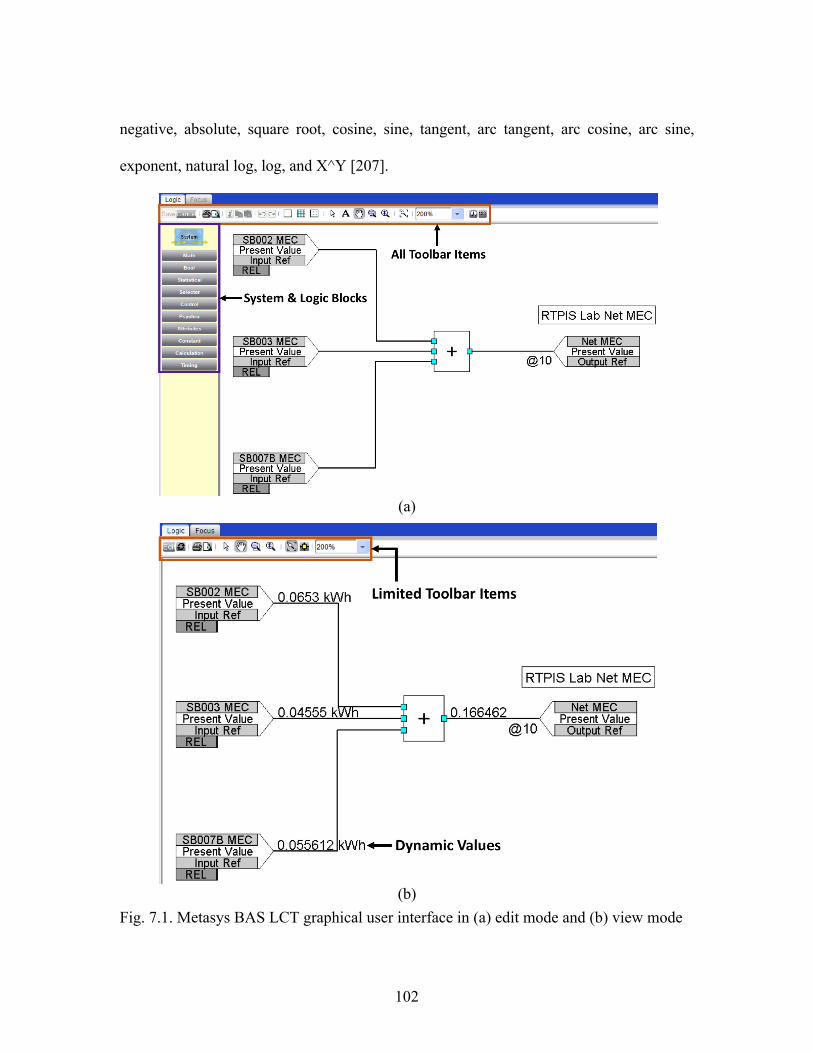
102
negative, absolute, square root, cosine, sine, tangent, arc tangent, arc cosine, arc sine,
exponent, natural log, log, and X^Y [207].
(a)
(b)
Fig. 7.1. Metasys BAS LCT graphical user interface in (a) edit mode and (b) view mode
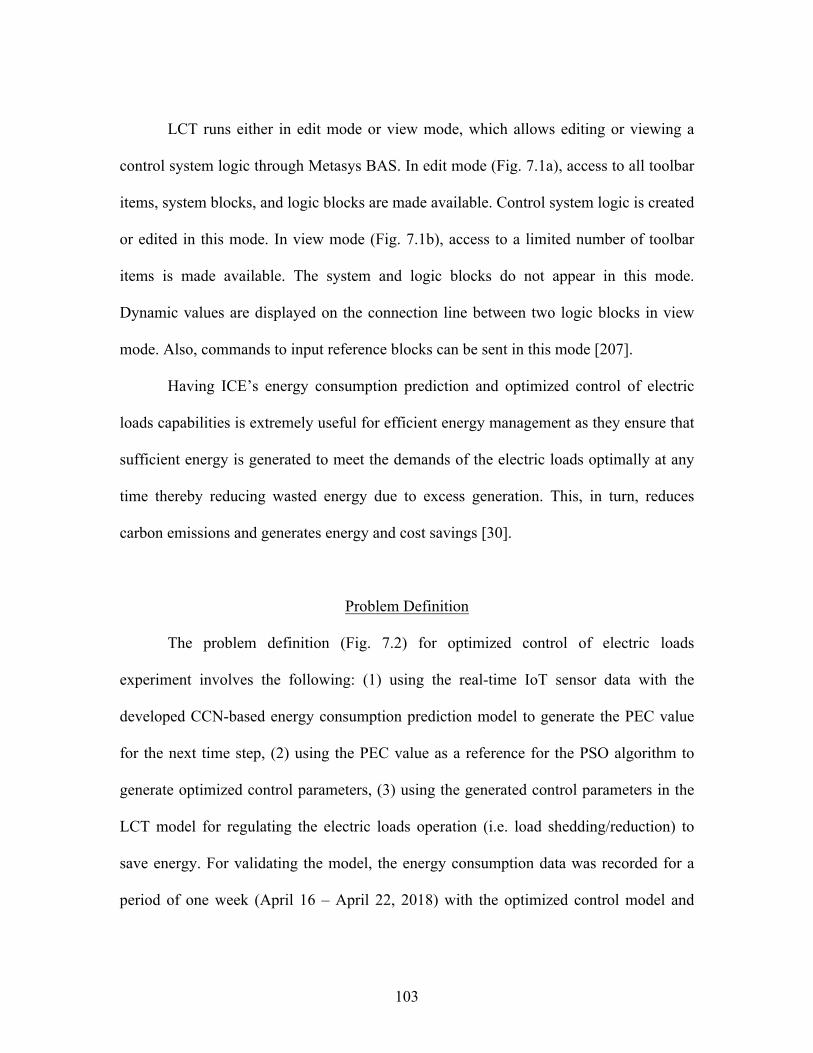
103
LCT runs either in edit mode or view mode, which allows editing or viewing a
control system logic through Metasys BAS. In edit mode (Fig. 7.1a), access to all toolbar
items, system blocks, and logic blocks are made available. Control system logic is created
or edited in this mode. In view mode (Fig. 7.1b), access to a limited number of toolbar
items is made available. The system and logic blocks do not appear in this mode.
Dynamic values are displayed on the connection line between two logic blocks in view
mode. Also, commands to input reference blocks can be sent in this mode [207].
Having ICE’s energy consumption prediction and optimized control of electric
loads capabilities is extremely useful for efficient energy management as they ensure that
sufficient energy is generated to meet the demands of the electric loads optimally at any
time thereby reducing wasted energy due to excess generation. This, in turn, reduces
carbon emissions and generates energy and cost savings [30].
Problem Definition
The problem definition (Fig. 7.2) for optimized control of electric loads
experiment involves the following: (1) using the real-time IoT sensor data with the
developed CCN-based energy consumption prediction model to generate the PEC value
for the next time step, (2) using the PEC value as a reference for the PSO algorithm to
generate optimized control parameters, (3) using the generated control parameters in the
LCT model for regulating the electric loads operation (i.e. load shedding/reduction) to
save energy. For validating the model, the energy consumption data was recorded for a
period of one week (April 16 – April 22, 2018) with the optimized control model and
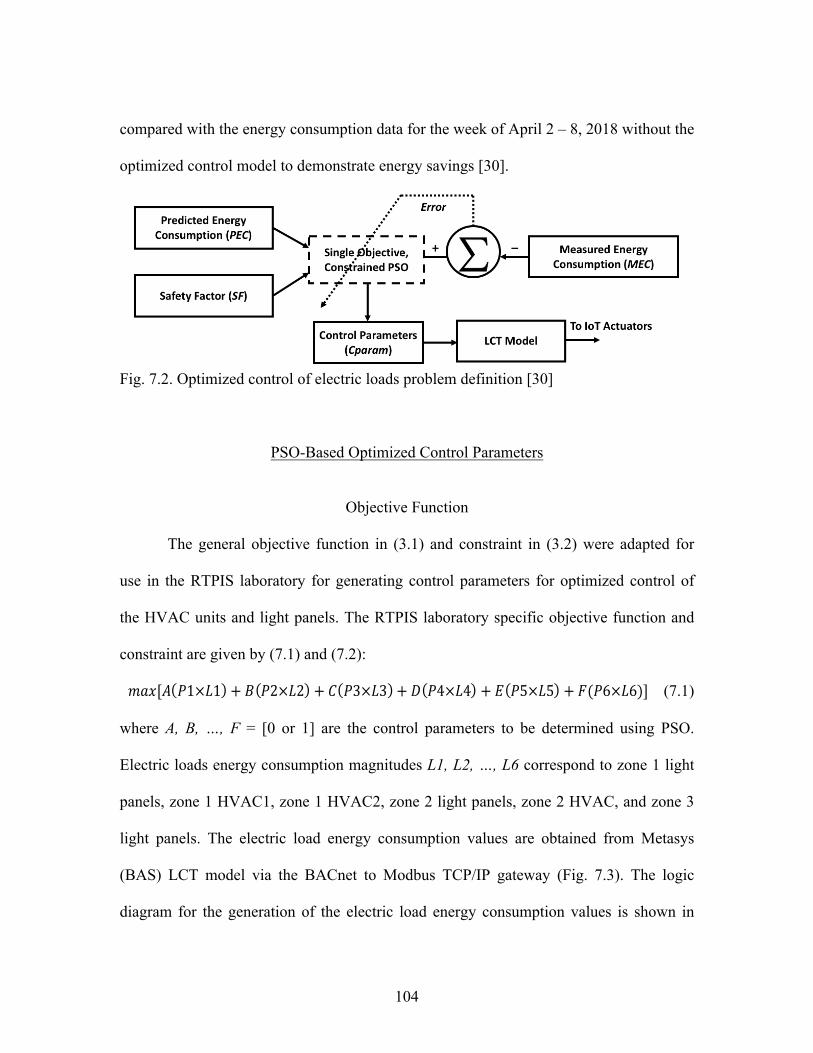
104
compared with the energy consumption data for the week of April 2 – 8, 2018 without the
optimized control model to demonstrate energy savings [30].
Fig. 7.2. Optimized control of electric loads problem definition [30]
PSO-Based Optimized Control Parameters
Objective Function
The general objective function in (3.1) and constraint in (3.2) were adapted for
use in the RTPIS laboratory for generating control parameters for optimized control of
the HVAC units and light panels. The RTPIS laboratory specific objective function and
constraint are given by (7.1) and (7.2):
!"#[% &1×)1 + + &2×)2 + - &3×)3 + / &4×)4 + 1 &5×)5 + 3(&6×)6)] (7.1)
where A, B, …, F = [0 or 1] are the control parameters to be determined using PSO.
Electric loads energy consumption magnitudes L1, L2, …, L6 correspond to zone 1 light
panels, zone 1 HVAC1, zone 1 HVAC2, zone 2 light panels, zone 2 HVAC, and zone 3
light panels. The electric load energy consumption values are obtained from Metasys
(BAS) LCT model via the BACnet to Modbus TCP/IP gateway (Fig. 7.3). The logic
diagram for the generation of the electric load energy consumption values is shown in
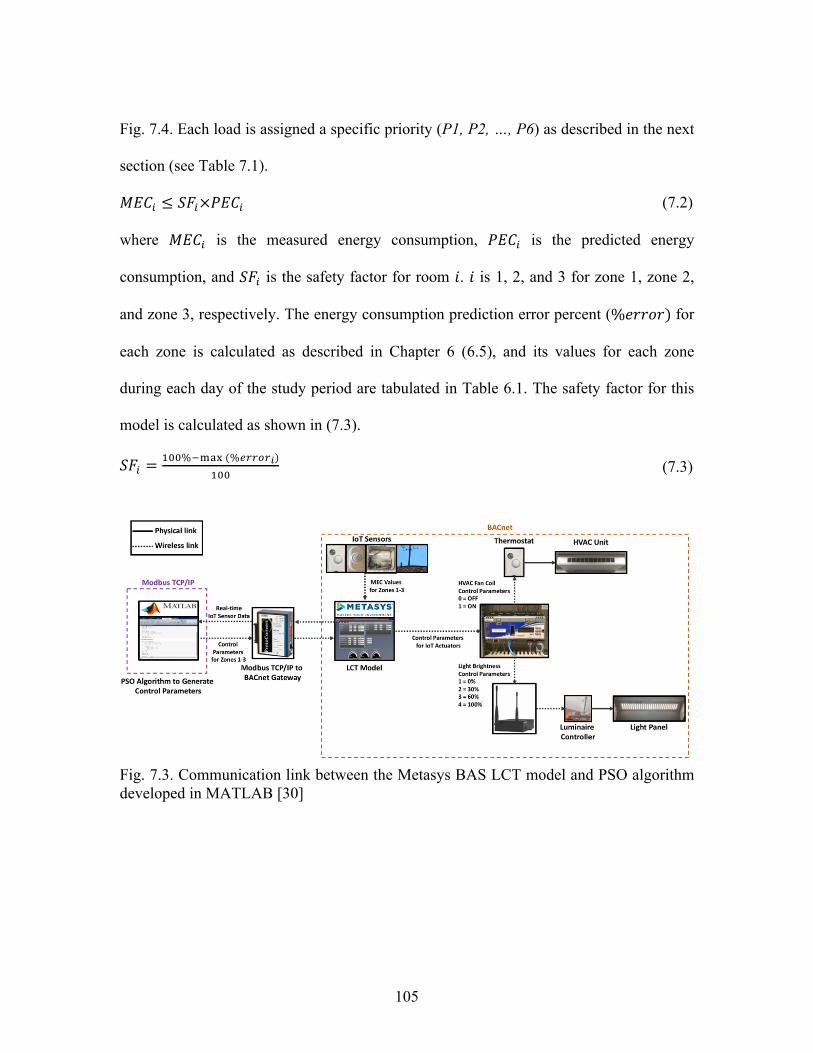
105
Fig. 7.4. Each load is assigned a specific priority (P1, P2, …, P6) as described in the next
section (see Table 7.1).
!"#$ ≤ &'$×)"#$ (7.2)
where !"#$ is the measured energy consumption, !"#$ is the predicted energy
consumption, and !"# is the safety factor for room ! . ! is 1, 2, and 3 for zone 1, zone 2,
and zone 3, respectively. The energy consumption prediction error percent (%"##$#) for
each zone is calculated as described in Chapter 6 (6.5), and its values for each zone
during each day of the study period are tabulated in Table 6.1. The safety factor for this
model is calculated as shown in (7.3).
!"# = %&&%()*+(%.//0/1)%&& (7.3)
Fig. 7.3. Communication link between the Metasys BAS LCT model and PSO algorithm developed in MATLAB [30]
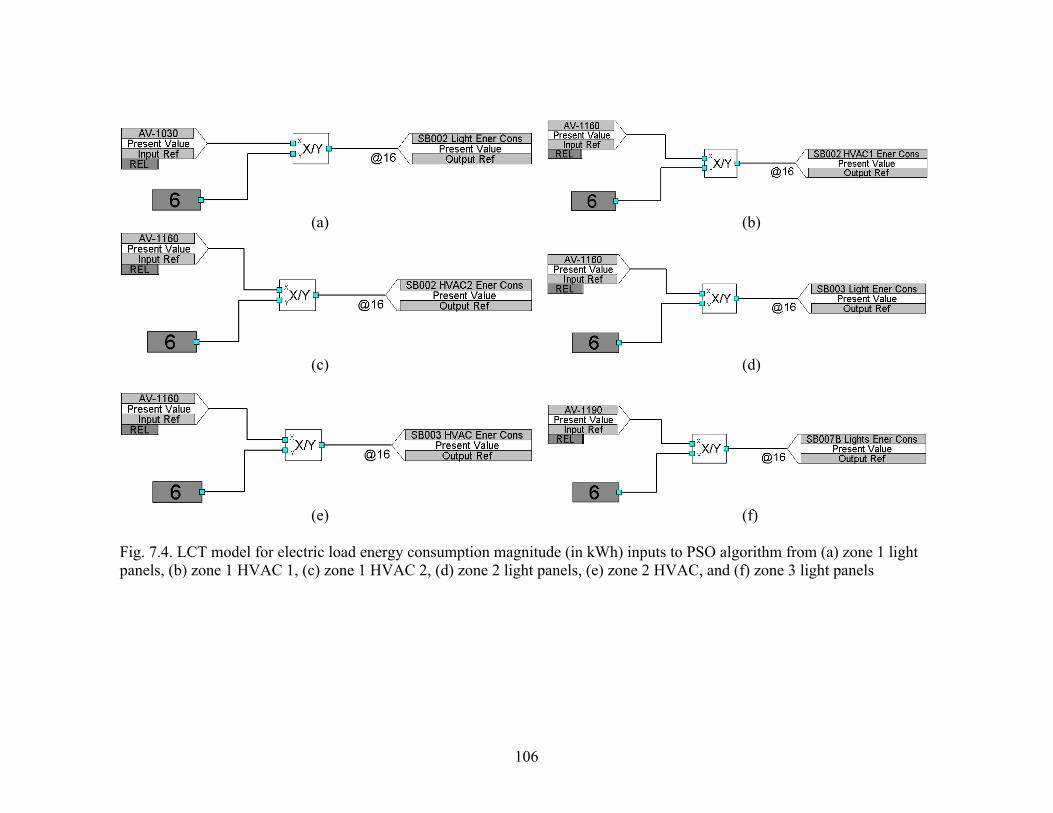
106
(a) (b)
(c) (d)
(e) (f)
Fig. 7.4. LCT model for electric load energy consumption magnitude (in kWh) inputs to PSO algorithm from (a) zone 1 light panels, (b) zone 1 HVAC 1, (c) zone 1 HVAC 2, (d) zone 2 light panels, (e) zone 2 HVAC, and (f) zone 3 light panels

107
Electric Loads and Priority Weighting
The priority weighting for load shedding/reduction was set manually and is shown
in Table 7.1. The electric load zone 1 HVAC1 was given highest priority (priority
weighting = 4) because this area contains large equipment, including real-time digital
simulators and phasor measurement units. It is important to keep this area cool to
maintain the equipment, but it is not a required to keep the load on constantly. The
electric loads zone 1 lights and zone 2 lights were assigned the second highest priority
(priority weighting = 3), and the electric loads zone 1 HVAC 2 and zone 2 HVAC units
were given third highest priority (priority weighting = 2). Since they are the main work
areas and are often occupied, lighting was given the higher priority since it is difficult to
work if there is poor lighting. It is still possible to continue working comfortably if the
HVAC units are temporarily suspended. The electric load zone 3 lights were given lowest
priority (priority weighting = 1) because this area contains a high performance computing
cluster and is not a common work area. It requires constant cooling, but lighting is not a
critical need for this area. Note that the zone 3 HVAC unit is a critical/must load and was
kept on constantly.
TABLE 7.1.�ELECTRIC LOAD MAGNITUDE AND PRIORITIES [30] Electric
Load Zone 1 Lights
Zone 1 HVAC 1
Zone 1 HVAC 2
Zone 2 Lights
Zone 2 HVAC
Zone 3 Lights
Zone 3 HVAC
Case 1: Magnitude
(kWh)
0.0497 0.0118 0.0149 0.0324
0.0132 0.0226 0.0388
Case 2: Magnitude
(kWh)
0.0345 0.0118 0.0153 0.0278 0.0132 0.0161 0.0390
Case 3: Magnitude
(kWh)
0.0345 0.0118 0.0149 0.0068 0.0132 0.0131 0.0387
Priority Weighting
3 4 2 3 2 1 Critical/Must Load

108
Cases 1, 2, and 3 represent three different operational scenarios varying by light intensity
(Case 1: High intensity, Case 2: Medium intensity, and Case 3: Low intensity) for which
the optimized control parameters of the electric loads were generated using the PSO
algorithm. The results are shown in Tables 7.2 and 7.3 in the Experiment Results and
Discussions section.
LCT Model
The LCT model for regulating the electric loads (i.e. load shedding) based on the
optimized control parameters is shown in Fig. 7.5. The optimized control parameter values
obtained using the developed PSO algorithm in MATLAB are transmitted to Metasys
BAS via the Modbus TCP/IP to BACnet gateway (Fig. 7.3). The LCT model uses these
optimized control parameter values as inputs to the IoT actuators (thermostats and
luminaire controllers) to regulate necessary electric loads to reduce the energy
consumption under the set reference (7.2) without violating any operational constraints
(Fig. 7.5). The different control parameters for the thermostats and luminaire controllers
are shown in Fig. 7.3. This saves energy and improves energy efficiency of the RTPIS
laboratory [30].
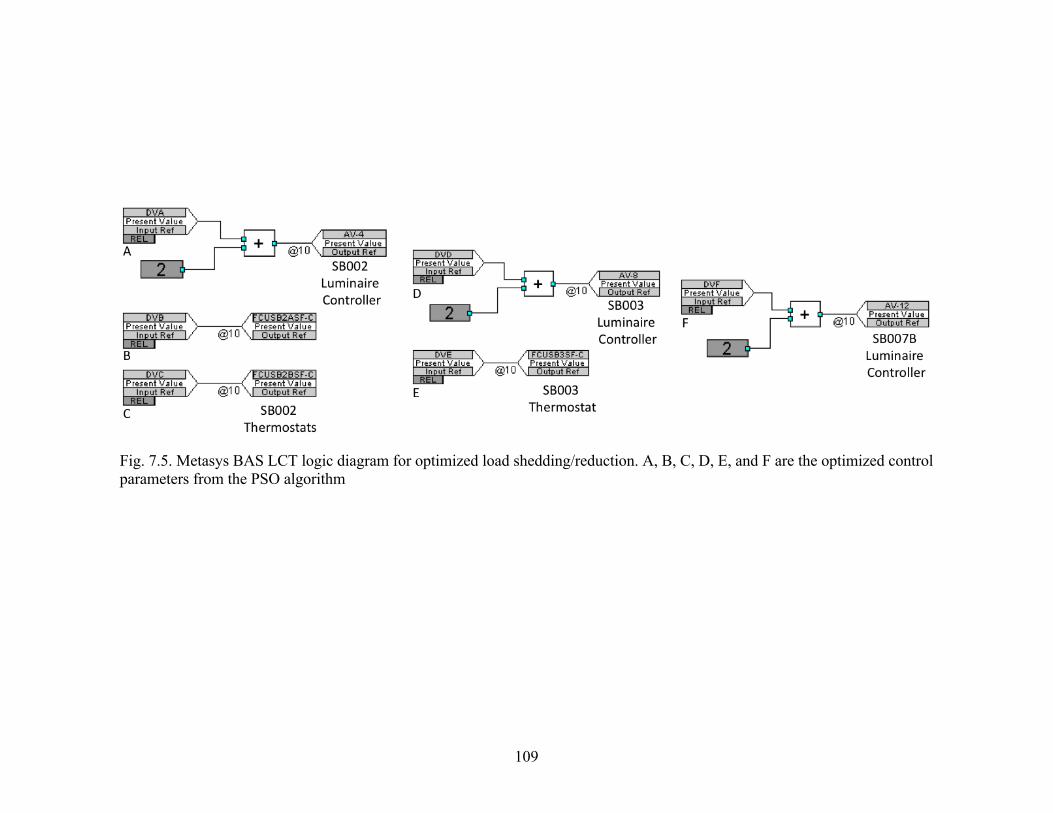
109
Fig. 7.5. Metasys BAS LCT logic diagram for optimized load shedding/reduction. A, B, C, D, E, and F are the optimized control parameters from the PSO algorithm

110
An experiment was conducted in the RTPIS laboratory for a period of two weeks
(April 2 – 8, 2018 and April 16 –22, 2018) to test the optimized control of electric loads
for managing energy efficiently. The selection of the time period for testing the optimized
control model was done such that the input parameters (viz. ambient temperature, zone
temperature, and occupancy state) of the three zones were comparable during the test
period (Fig. 7.6).
(a)
(b)
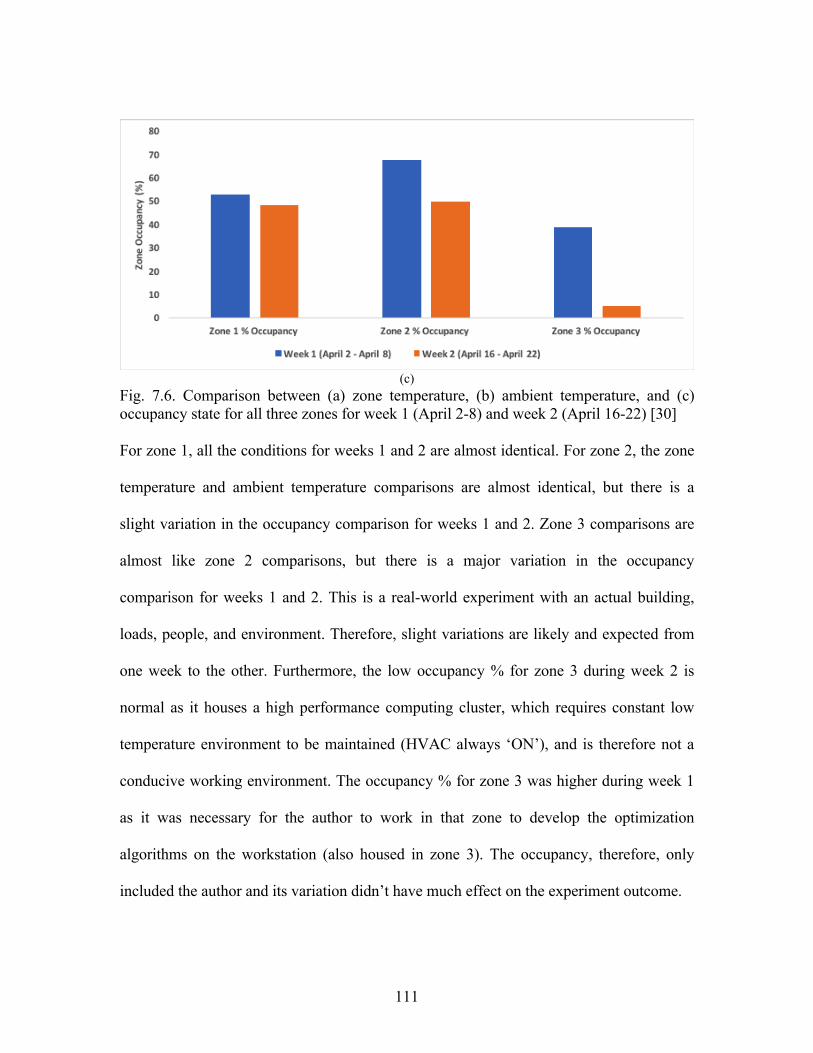
111
(c)
Fig. 7.6. Comparison between (a) zone temperature, (b) ambient temperature, and (c) occupancy state for all three zones for week 1 (April 2-8) and week 2 (April 16-22) [30] For zone 1, all the conditions for weeks 1 and 2 are almost identical. For zone 2, the zone
temperature and ambient temperature comparisons are almost identical, but there is a
slight variation in the occupancy comparison for weeks 1 and 2. Zone 3 comparisons are
almost like zone 2 comparisons, but there is a major variation in the occupancy
comparison for weeks 1 and 2. This is a real-world experiment with an actual building,
loads, people, and environment. Therefore, slight variations are likely and expected from
one week to the other. Furthermore, the low occupancy % for zone 3 during week 2 is
normal as it houses a high performance computing cluster, which requires constant low
temperature environment to be maintained (HVAC always ‘ON’), and is therefore not a
conducive working environment. The occupancy % for zone 3 was higher during week 1
as it was necessary for the author to work in that zone to develop the optimization
algorithms on the workstation (also housed in zone 3). The occupancy, therefore, only
included the author and its variation didn’t have much effect on the experiment outcome.
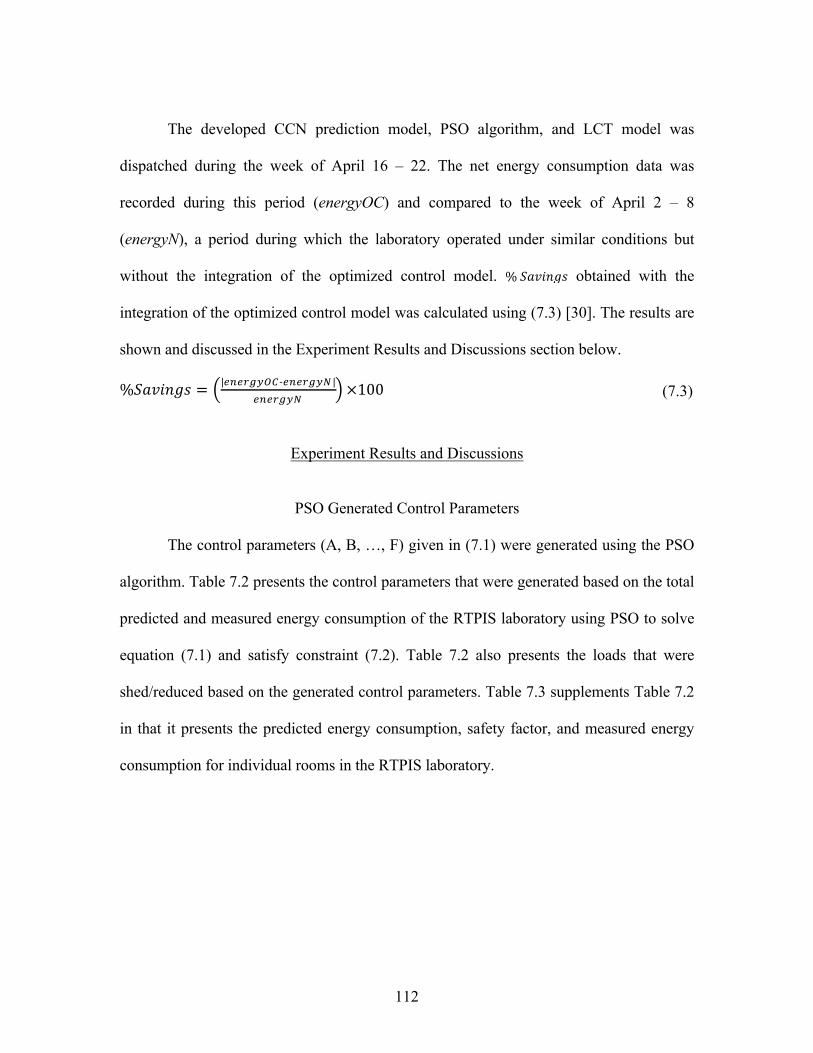
112
The developed CCN prediction model, PSO algorithm, and LCT model was
dispatched during the week of April 16 – 22. The net energy consumption data was
recorded during this period (energyOC) and compared to the week of April 2 – 8
(energyN), a period during which the laboratory operated under similar conditions but
without the integration of the optimized control model. %#$%&'() obtained with the
integration of the optimized control model was calculated using (7.3) [30]. The results are
shown and discussed in the Experiment Results and Discussions section below.
%"#$%&'( = *+*,-./0-*+*,-.2*+*,-.2 ×100 (7.3)
Experiment Results and Discussions
PSO Generated Control Parameters
The control parameters (A, B, …, F) given in (7.1) were generated using the PSO
algorithm. Table 7.2 presents the control parameters that were generated based on the total
predicted and measured energy consumption of the RTPIS laboratory using PSO to solve
equation (7.1) and satisfy constraint (7.2). Table 7.2 also presents the loads that were
shed/reduced based on the generated control parameters. Table 7.3 supplements Table 7.2
in that it presents the predicted energy consumption, safety factor, and measured energy
consumption for individual rooms in the RTPIS laboratory.

113
TABLE 7.2.� CONTROL PARAMETERS GENERATED USING PSO [30] Case Total
!"# (kWh)
Total !"×$%&
(kWh)
Total !"#
(kWh)
*Min. Load
to Shed
(kWh)
PSO Control
Parameters
Loads Shed/Reduced
Comments/Justification
1 0.1381 0.1325 0.1834 0.0509 [1 1 0 1 0 0]
Zone 1 HVAC2, Zone
2 HVAC, Zone 3 Lights
The optimal loads to shed were of the lowest two levels of priority and their magnitude was
equivalent to the amount needed to be shed without any excess
2 0.1482 0.1423 0.1577 0.0154 [1 1 0 1 1 1] Zone 1 HVAC2
If based on priority alone, zone 3 lights
would have been reduced since that is the lowest
priority. But, that would only maximize priority weighting and not the
objective function. Therefore, zone 1
HVAC2 was shed since it maximized the objective function and was of the
second to lowest priority level.
3 0.1305 0.1254 0.1330 0.0076 [1 1 1 0 1 1] Zone 2 Lights
Similar to Case 2, reducing zone 2 lights
maximized the objective function and of was third
in terms of lowest priority
*Values have been rounded to the fourth decimal place, although the devices and software are more precise.
TABLE 7.3.� MEASURED VS. PREDICTED ENERGY CONSUMPTION ALONG WITH THE SAFETY FACTORS FOR EACH ROOM [30]
Case Zone !"# (kWh) !" !"×$%& !"# (kWh)
1 1 0.0418 0.97 0.0405 0.0764 2 0.0367 0.93 0.0341 0.0456 3 0.0596 0.97 0.0578 0.0614
2 1 0.0605 0.97 0.0587 0.0616 2 0.0355 0.93 0.0330 0.0410 3 0.0522 0.97 0.0522 0.0551
3 1 0.0516 0.97 0.0500 0.0612 2 0.0289 0.93 0.0269 0.0200 3 0.0500 0.97 0.0485 0.0518
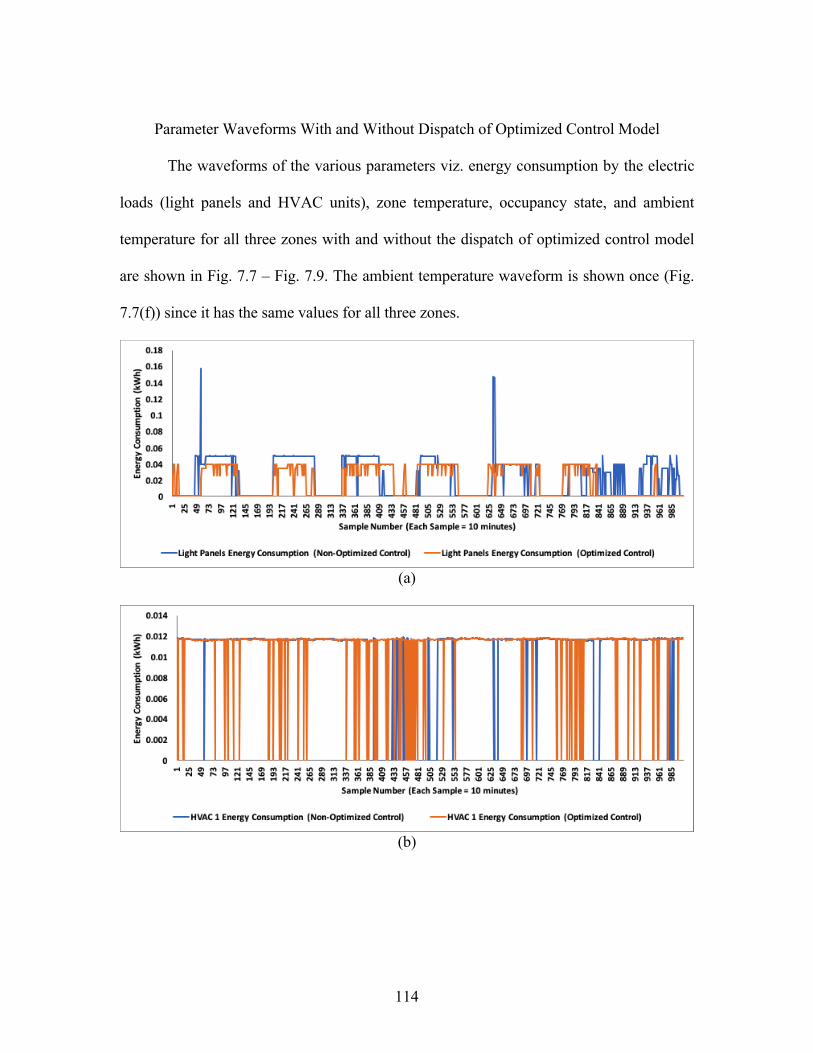
114
Parameter Waveforms With and Without Dispatch of Optimized Control Model
The waveforms of the various parameters viz. energy consumption by the electric
loads (light panels and HVAC units), zone temperature, occupancy state, and ambient
temperature for all three zones with and without the dispatch of optimized control model
are shown in Fig. 7.7 – Fig. 7.9. The ambient temperature waveform is shown once (Fig.
7.7(f)) since it has the same values for all three zones.
(a)
(b)

115
(c)
(d)
(e)
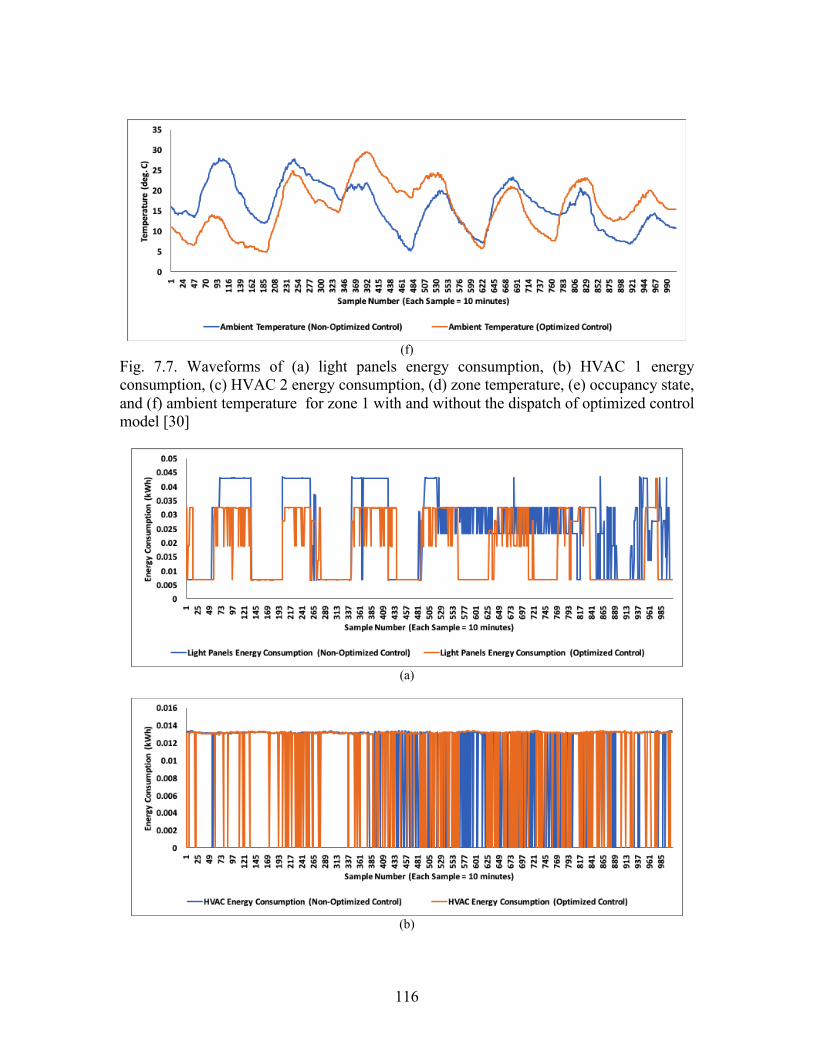
116
(f)
Fig. 7.7. Waveforms of (a) light panels energy consumption, (b) HVAC 1 energy consumption, (c) HVAC 2 energy consumption, (d) zone temperature, (e) occupancy state, and (f) ambient temperature for zone 1 with and without the dispatch of optimized control model [30]
(a)
(b)
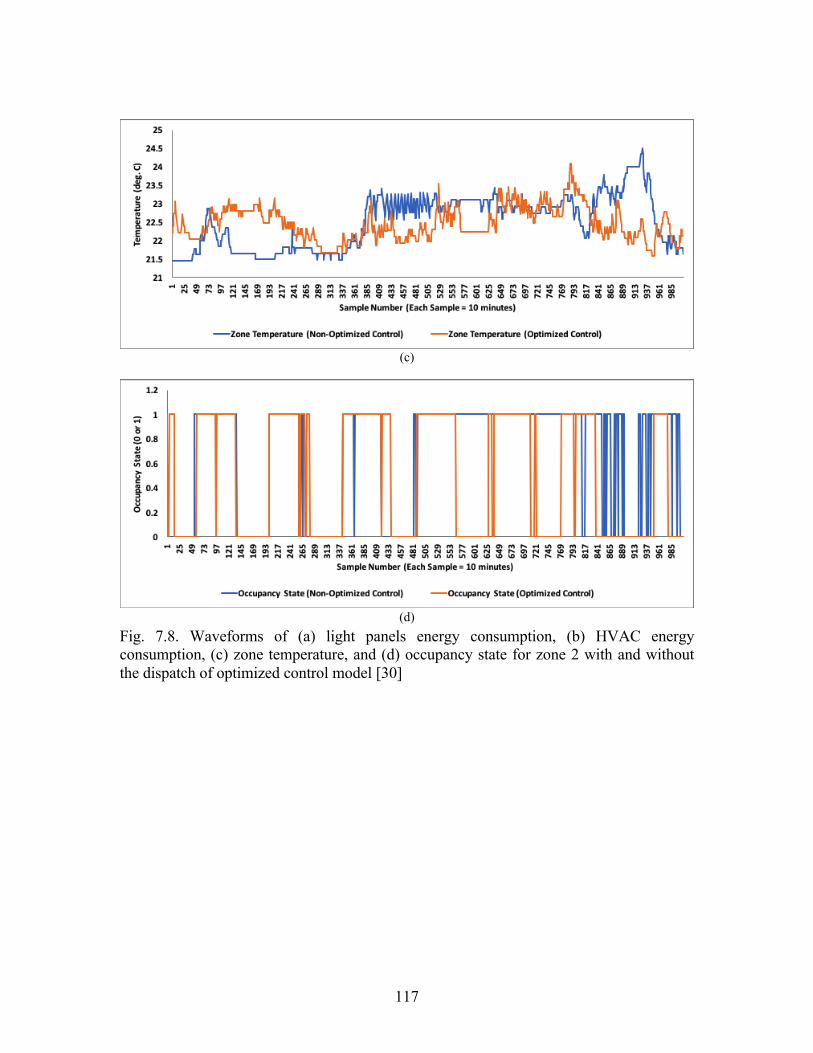
117
(c)
(d)
Fig. 7.8. Waveforms of (a) light panels energy consumption, (b) HVAC energy consumption, (c) zone temperature, and (d) occupancy state for zone 2 with and without the dispatch of optimized control model [30]
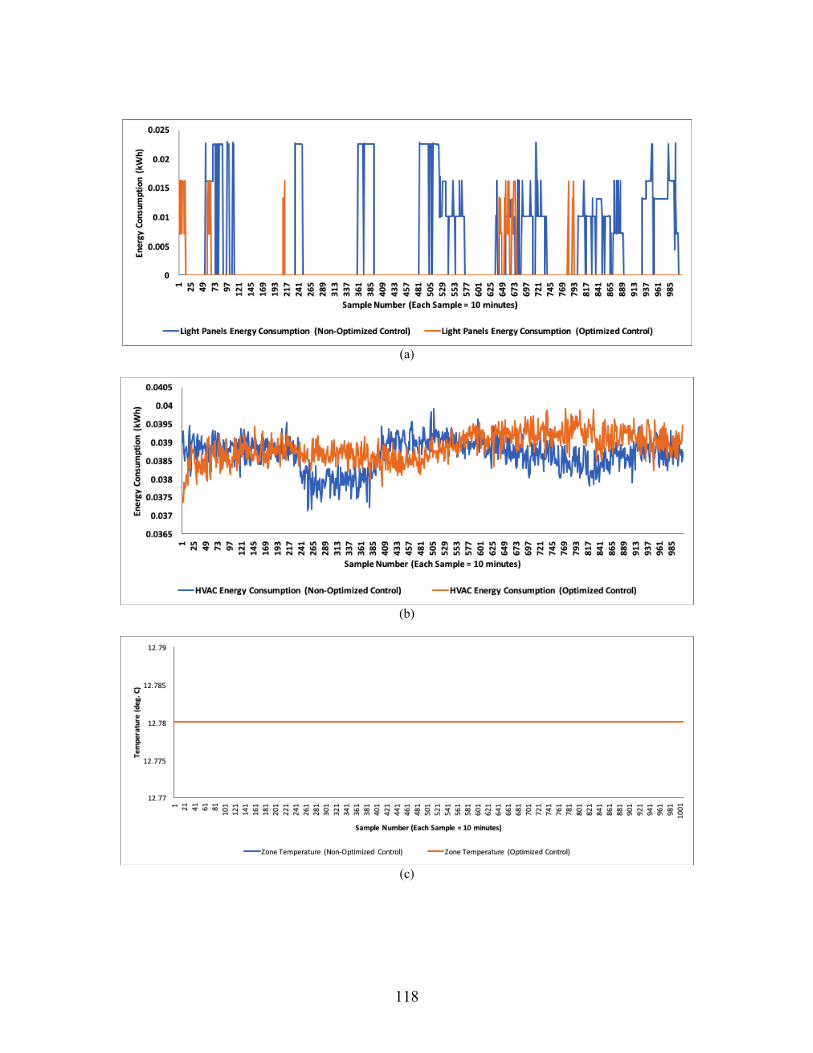
118
(a)
(b)
(c)

119
(d)
Fig. 7.9. Waveforms of (a) light panels energy consumption, (b) HVAC energy consumption, (c) zone temperature, and (d) occupancy state for zone 3 with and without the dispatch of optimized control model [30]
Energy Savings With Dispatch of Optimized Control Model
The comparison of energyOC and energyN values obtained from the optimized
control model, along with the % Savings values for all three zones are tabulated in Table
7.4. Fig. 7.10 shows the net energyOC values for the period April 16 –22, 2018 and the
net energyN values for the period April 2 – 8, 2018 for all three cells (or zones). The
waveforms for the energyOC and energyN values are shown in Fig. 7.11. From the
significant % Savings values obtained from the integration of ICE’s capabilities, it is
successfully demonstrated that the developed optimized control of electric load model and
CCN-based energy consumption prediction model can reduce energy waste and enhance
energy efficiency when dispatched in the RTPIS laboratory. Therefore, the CCN and
optimized control models working together constitute an efficient energy management
system for an IoT driven building environment [30].
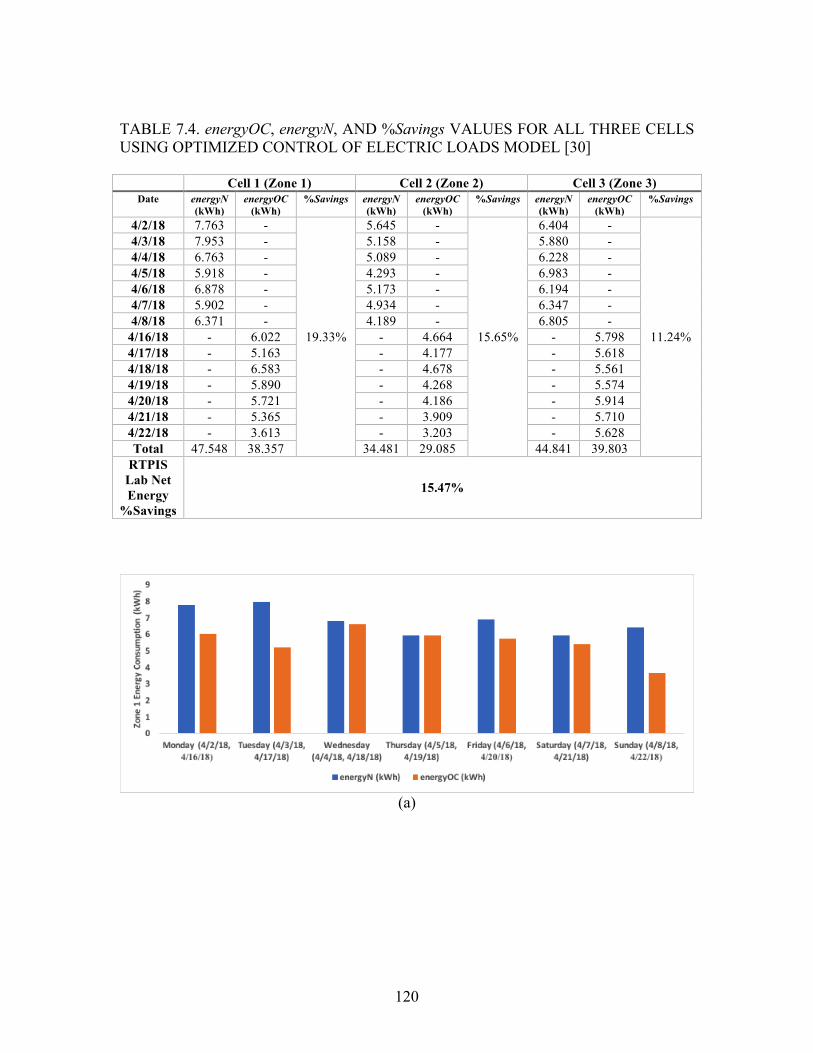
120
TABLE 7.4. energyOC, energyN, AND %Savings VALUES FOR ALL THREE CELLS USING OPTIMIZED CONTROL OF ELECTRIC LOADS MODEL [30]
Cell 1 (Zone 1) Cell 2 (Zone 2) Cell 3 (Zone 3) Date energyN
(kWh) energyOC
(kWh) %Savings energyN
(kWh) energyOC
(kWh) %Savings energyN
(kWh) energyOC
(kWh) %Savings
4/2/18 7.763 -
19.33%
5.645 -
15.65%
6.404 -
11.24%
4/3/18 7.953 - 5.158 - 5.880 - 4/4/18 6.763 - 5.089 - 6.228 - 4/5/18 5.918 - 4.293 - 6.983 - 4/6/18 6.878 - 5.173 - 6.194 - 4/7/18 5.902 - 4.934 - 6.347 - 4/8/18 6.371 - 4.189 - 6.805 -
4/16/18 - 6.022 - 4.664 - 5.798 4/17/18 - 5.163 - 4.177 - 5.618 4/18/18 - 6.583 - 4.678 - 5.561 4/19/18 - 5.890 - 4.268 - 5.574 4/20/18 - 5.721 - 4.186 - 5.914 4/21/18 - 5.365 - 3.909 - 5.710 4/22/18 - 3.613 - 3.203 - 5.628 Total 47.548 38.357 34.481 29.085 44.841 39.803
RTPIS Lab Net Energy
%Savings
15.47%
(a)

121
(b)
(c)
Fig. 7.10. Net energyOC and energyN values for (a) zone 1, (b) zone 2, and (c) zone 3 for the period April 2 – 8, 2018 and April 16 – 22, 2018, respectively [30]
(a)
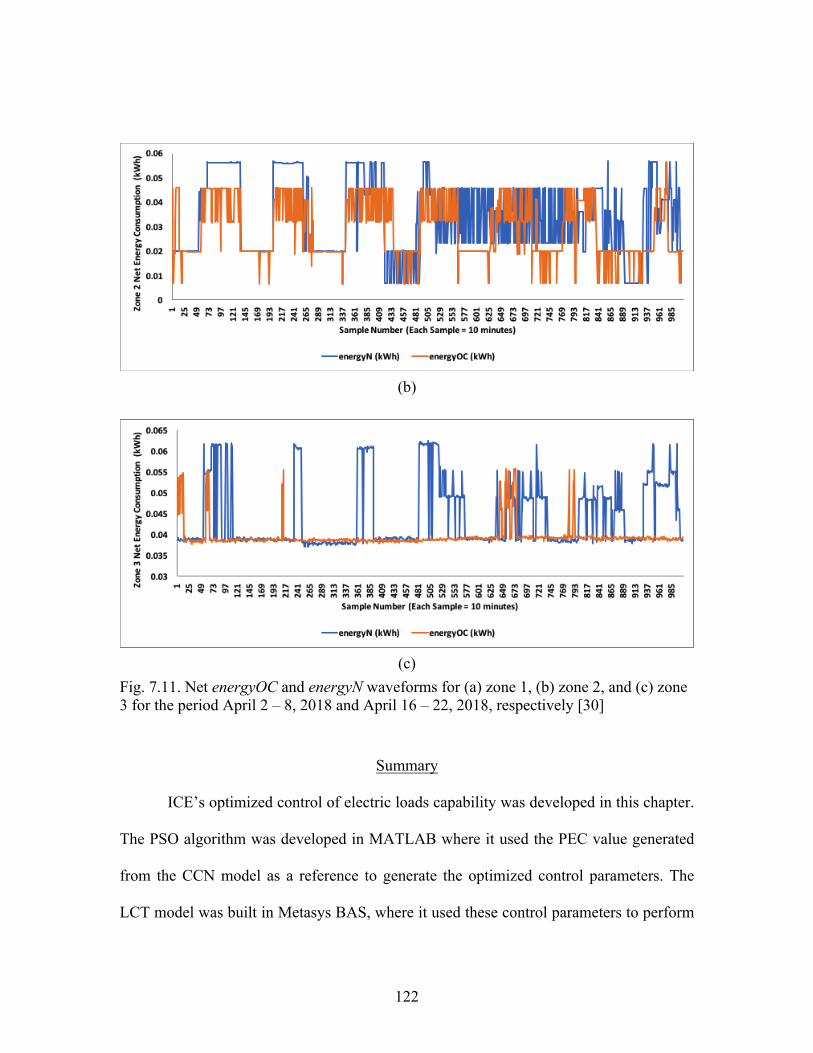
122
(b)
(c)
Fig. 7.11. Net energyOC and energyN waveforms for (a) zone 1, (b) zone 2, and (c) zone 3 for the period April 2 – 8, 2018 and April 16 – 22, 2018, respectively [30]
Summary
ICE’s optimized control of electric loads capability was developed in this chapter.
The PSO algorithm was developed in MATLAB where it used the PEC value generated
from the CCN model as a reference to generate the optimized control parameters. The
LCT model was built in Metasys BAS, where it used these control parameters to perform

123
optimized load shedding of the electric loads without violating any operational
constraints. It was successfully demonstrated that ICE’s CCN prediction and optimized
control models together served as an efficient energy management system that enhanced
the energy efficiency by saving energy in the RTPIS laboratory. Just like ICE’s CCN
model, the optimized control model, although developed for the RTPIS laboratory, is
scalable and flexible, providing the capability to adapt this model for usage with any IoT
driven building environment.

124
CHAPTER EIGHT
CONCLUSIONS
Introduction
This chapter serves as the summary of the entire dissertation. The dissertation
comprises of seven chapters (not including this chapter) that present a detailed review of
IoT for building environments; the development of ICE, an efficient energy management
system for smart buildings; the development of an IoT driven case study environment for
the implementation of ICE; and the development, deployment, and dispatch of ICE’s
energy consumption prediction and optimized control capabilities for reducing energy
waste (improving energy efficiency) when applied to the IoT driven building
environment.
Research Summary
The summary of research work presented in each chapter is enumerated below.
Chapter 1 presented a detailed review of the role of IoT in transforming modern
buildings into energy efficient, smart, and connected buildings. Also presented in this
chapter, were the economic, environmental, and societal impacts of IoT for smart
buildings. Finally, the main objectives and contributions of this dissertation were
enumerated in chapter 1.
Chapter 2 presented a detailed review of the challenges (both technical and non-
technical) and recommended solutions for overcoming these challenges for successfully
implementing IoT in smart buildings. Additionally, recommendations for mixed-methods
125
research design to realize the potential of IoT for transforming modern buildings into
smart buildings were presented in this chapter.
Chapter 3 presented Intelligent Computational Engine (ICE), an efficient energy
management system for IoT driven building environment. The features and impact of
ICE along with a general control framework providing an overview of ICE’s capabilities
were discussed in this chapter.
Chapter 4 provided a description of the development of the building case study
environment (i.e. RTPIS laboratory) for implementing ICE. The various IoT devices and
technologies and software platforms that were deployed in the RTPIS laboratory over the
BACnet protocol were also described in this chapter. Finally, the methodology for
recording measurement data for the research experiment was presented in chapter 4.
Chapter 5 described the development and application of two prediction models
viz. Elman Recurrent Neural Network (RNN) model and exponential model for
predicting energy consumption in the RTPIS lab. The objective of this chapter was to
determine which of the two models was superior in terms of better prediction accuracy
for use in the development of ICE’s Cellular Computational Network (CCN)-based
energy consumption prediction capability. Elman RNN model emerged as the more
accurate energy consumption prediction model of the two.
Chapter 6 described the development, deployment, and dispatch of ICE’s CCN-
based energy consumption prediction capability in the RTPIS laboratory, which resulted
in high accuracy energy consumption predictions.
126
Chapter 7 described the development, deployment, and dispatch of ICE’s
optimized control of electric loads capability in the RTPIS laboratory. It was successfully
demonstrated that ICE’s CCN prediction and optimized control models together served as
an efficient energy management system that enhanced the energy efficiency by reducing
energy waste in the RTPIS laboratory.
The conclusions of this dissertation including the chapterwise research
summaries, recommendations, and future work was presented in Chapter 8.
Main Conclusions
IoT for smart buildings presents an exciting area of innovative growth and
development. This dissertation presented a detailed review of the role, impact, and
challenges and recommended solutions for implementing IoT in building environments.
A solution to overcome the inefficient energy management problem in a building
environment was proposed in this dissertation. The solution involved the development,
deployment, and dispatch of ICE for efficient energy management in an IoT driven
building environment. Several IoT devices and technologies were integrated with the
RTPIS laboratory to transform it into an IoT driven building environment, which served
as the building case study environment for this research. The proposed ICE framework
was deployed and dispatched in the RTPIS laboratory to test for ICE’s effectiveness in
terms of reduction in the amount of energy wasted (or improved energy efficiency).
Energy consumption prediction models viz. exponential model and Elman RNN
model were developed and compared to determine the most accurate model for use in the
development of ICE’s energy consumption prediction capability.

127
The capabilities of ICE that were developed included a CCN-based energy
consumption prediction model and an optimized control of electric loads model using
PSO algorithm and LCT. The CCN model was built in MATLAB, where it received
certain input parameters (AT, ZT, MEC, and OS) from the IoT sensors (temperature
sensor, thermostat, power meter, and occupancy sensor) and generated PEC values. The
developed CCN prediction model was tested for accuracy by comparing PEC and MEC
data over a period of one week. Low error % were obtained from this comparison, which
indicates the developed CCN-based energy prediction model was highly accurate. The
optimized control model was built partly in MATLAB (PSO algorithm) and partly in
Metasys BAS (LCT), where it used the PEC value generated from the CCN model as a
reference. The MEC was compared with the PEC and optimized control parameters were
generated to regulate the electric loads (HVAC units and light panels) without violating
any operational constraints. It was successfully demonstrated that ICE’s CCN and
optimized models together served as an efficient energy management system that
enhanced the energy efficiency by reducing energy waste in the RTPIS laboratory.
Although developed for the RTPIS laboratory, ICE’s CCN and optimized control models
are scalable and flexible, providing the capability to adapt these models for usage with
any IoT driven building environment.
Suggestions for Future Research
The detailed review of the role, impact, and challenges of IoT for smart buildings
presented in this dissertation work will be beneficial for both academic and industrial

128
researchers and engineers getting started in the smart building energy management
domain.
The ICE developed in this dissertation has unique capabilities that can overcome
challenges including inefficient energy management, wasted energy resources, and
potentially expensive energy costs to meet the growing energy demands. The ICE is a
computational systems thinking machine that is flexible, scalable, adaptable, and self-
learning, which makes it convenient to deploy and easy to use in any smart building
scenario.
Recommendations for future work include scaling the developed ICE for use in a
larger building environment and testing the efficiency of its energy management
operation; incorporating privacy and security solutions in ICE to make it more resilient to
attacks; and integrating qualitative methods of data collection and analysis into this
research to explore and understand individual and group behavior, organizational
dynamics, and cultural influences that are necessary to guarantee its uptake and use in
achieving its benefit to society.
Summary
The entire dissertation is summarized in this chapter. Chapterwise summaries,
main conclusions, and recommendations for future research have been highlighted.

129
REFERENCES
[1] “The earth will don an electronic skin”, http://www.businessweek.com/1999/99_35/b3644024.htm, last accessed 10/05/2015.
[2] G. Bedi, G. K. Venayagamoorthy and R. Singh, "Navigating the challenges of Internet of Things (IoT) for power and energy systems," 2016 Clemson University Power Systems Conference (PSC), Clemson, SC, 2016, pp. 1-5
[3] G. Bedi, G. K. Venayagamoorthy, R. Singh, R. R. Brooks and K. C. Wang, "Review of Internet of Things (IoT) in Electric Power and Energy Systems," in IEEE Internet of Things Journal, vol. 5, no. 2, pp. 847-870, April 2018.
[4] “Top 8 Smart Buildings from Around the world,” https://www.comfyapp.com/blog/top-8-smart-buildings-from-around-the-world/, February 21, 2017
[5] T. Malche and P. Maheshwary, "Internet of Things (IoT) for building smart home system," 2017 International Conference on I-SMAC (IoT in Social, Mobile, Analytics and Cloud) (I-SMAC), Palladam, 2017, pp. 65-70.
[6] G. Bedi, G. K. Venayagamoorthy and R. Singh, "Internet of Things (IoT) sensors for smart home electric energy usage management," 2016 IEEE International Conference on Information and Automation for Sustainability (ICIAfS), Galle, Sri Lanka, 2016, pp. 1-6
[7] “Sensors & Security”, http://www.smarthome.com/sensors-security.html, last accessed 06/14/2016
[8] “Wireless Home Sensor Systems”, http://postscapes.com/home-wireless-sensor-systems, last accessed 06/14/2016
[9] W. Lee, S. Cho, P. Chu, H. Vu, S. Helal, W. Song, Y.-S. Jeong, and K. Cho, “Automatic agent generation for IoT-based smart house simulator,” Neurocomputing, Available online 8 June 2016, (http://www.sciencedirect.com/science/article/pii/S092523121630580X)
[10] “The Beginner’s Guide to Motion Sensors,” by SafeWise, 2013, http://www.safewise.com/resources/motion-sensor-guide
[11] “Perimeter Security Sensor Technologies Handbook,” by Defense Advanced Research Projects Agency (DARPA) and The National Institute of Justice (NIJ), July 1998, https://www.ncjrs.gov/pdffiles1/Digitization/206415NCJRS.pdf
130
[12] “The Seven Basic Types of Temperature Sensors,” by Water & Wastes Digest, December 2000, http://www.wwdmag.com/water/seven-basic-types-temperature-sensors
[13] D. K. Roveti, “Choosing a Humidity Sensor: A Review of Three Technologies,” Sensors Online, July 2001, http://www.sensorsmag.com/sensors/humidity-moisture/choosing-a-humidity-sensor-a-review-three-technologies-840
[14] “Water Detection Sensors: Types and Applications,” by Network Technologies Incorporated, September 2013, http://www.networktechinc.com/blog/water-detection-sensors-types-and-applications/303/
[15] “Types of Smoke Alarms and Detectors,” by Grainger, https://www.grainger.com/content/qt-types-smoke-alarms-detectors-366, last accessed 11/04/2016
[16] C. Mathas, “Light Sensors: An Overview,” Digi-Key Electronics, September 2012, http://www.digikey.com/en/articles/techzone/2012/sep/light-sensors-an-overview
[17] “Energy Monitoring,” by Green Step, http://www.greensteptoday.com/energy-monitoring, last accessed 11/04/2016
[18] “The Internet of Things: Mapping The Value Beyond The Hype,” by McKinsey Global Institute, June 2015, https://www.mckinsey.com/business-functions/digital-mckinsey/our-insights/the-internet-of-things-the-value-of-digitizing-the-physical-world
[19] “The Evolution of Wireless Sensor Networks” by Silicon Laboratories, Inc., 2013, http://www.silabs.com/Support%20Documents/TechnicalDocs/evolution-of-wireless-sensor-networks.pdf
[20] “Smart/Intelligent Sensors Market-Global Industry Analysis, Size, Share, Growth, Trends and Forecast 2013-2019” by Transparency Market Research, April 2014
[21] A. Markkanen, “Competitive Edge from Edge Intelligence IoT Analytics Today and in 2020,” ABI Research, May 2015, https://www.thingworx.com/wp-content/uploads/2016/05/WP_abi-research_iot-analytics-today-and-in-2020_EN.pdf
[22] A. Al-Fuqaha, M. Guizani, M. Mohammadi, M. Aledhari and M. Ayyash, "Internet of Things: A Survey on Enabling Technologies, Protocols, and Applications," in IEEE Communications Surveys & Tutorials, vol. 17, no. 4, pp. 2347-2376, Fourthquarter 2015
131
[23] M. Cullinen, “Machine to Machine technologies: Unlocking the potential of a $1 trillion industry”, AT&T Carbon War Room Research Report, February 2013, http://carbonwarroom.com/sites/default/files/reports/M2M%20Technologies%20%28Carbon%20War%20Room%29.pdf
[24] “Clean Power Plan Saves Nearly $40 Billion On Health, Too,” http://cleantechnica.com/2016/07/15/clean-power-plan-saves-nearly-40-billion-health/?utm_source=feedburner&utm_medium=feed&utm_campaign=Feed%3A+IM-cleantechnica+%28CleanTechnica%29, CleanTechnica, July 2016
[25] “The Societal Impact of the Internet of Things”, BCS-OII Forum Report, March 2013 BCS-OII Forum Report, March 2013, https://www.bcs.org/upload/pdf/societal-impact-report-feb13.pdf
[26] “China aims to lead the world in connecting the factory,” http://www.economist.com/news/business/21702487-china-aims-lead-world-connecting-factory-great-convergence, The great convergence | The Economist, July 2016
[27] “Navigant Research Leaderboard Report: Building Energy Management Systems,” https://www.navigantresearch.com/research/navigant-research-leaderboard-report-building-energy-management-systems, Navigant Research, 2016
[28] G. K. Venayagamoorthy, "Dynamic, Stochastic, Computational, and Scalable Technologies for Smart Grids," in IEEE Computational Intelligence Magazine, vol. 6, no. 3, pp. 22-35, Aug. 2011
[29] G. Bedi, G. K. Venayagamoorthy, D.M. Boyer, and R. Singh, “The Societal Impact of Internet of Things (IoT) in Smart Communities,” Elsevier Technology in Society Journal, 2018 (in review)
[30] G. Bedi, G. K. Venayagamoorthy, and R. Singh, “Intelligent Computational Engine for Efficient Energy Management in IoT Driven Building Environment,” IEEE Transactions on Industrial Electronics, 2018 (in review)
[31] G. Bedi, G. K. Venayagamoorthy, and R. Singh, “Development of an IoT Driven Building Environment for Prediction of Electric Energy Consumption,” IEEE Transactions on Consumer Electronics, 2018 (in review)
[32] L. Curry and M. Nunez-Smith, Mixed Methods in Health Sciences Research – A Practical Primer, SAGE Publications, Inc., 2015
132
[33] Electric Power Research Institute (EPRI), “Contributions of Supply and Demand Resources to Required Power System Reliability Services”, May 2015, http://www.epri.com/abstracts/Pages/ProductAbstract.aspx?ProductId=000000003002006400
[34] J. Liu, X. Li, X. Chen, Y. Zhen and L. Zeng, "Applications of Internet of Things on smart grid in China," Advanced Communication Technology (ICACT), 2011 13th International Conference on, Seoul, 2011, pp. 13-17
[35] Jha and S. M C, “Security considerations for Internet of Things”, http://www.lnttechservices.com/media/30090/whitepaper_security-considerations-for-internet-of-things.pdf, L&T Technology Services, 2014
[36] “IC Industry Waking Up To Security”, http://semiengineering.com/ic-industry-waking-up-to-security/, last accessed 06/15/2016
[37] “Cyber Defense: Businesses Need Effective Security Partnerships to Stop Advanced Attacks” Bloomberg Businessweek, July 2016
[38] V. Gazis, "A Survey of Standards for Machine to Machine (M2M) and the Internet of Things (IoT)," in IEEE Communications Surveys & Tutorials, vol.PP, no.99, pp.1-1
[39] ITU-T, Focus Group on M2M Service Layer, ITU-T Std., http://www.itu.int/en/ITU-T/focusgroups/m2m/Pages/default.aspx, last accessed 07/30/2016
[40] ETSI, TS 102 689; Machine-to-Machine communications (M2M); M2M service requirements Release 2, European Telecommunications Standards Institute (ETSI) Std., 2013, http://webapp.etsi.org/workprogram/Report_WorkItem.asp?WKI_ID=38384, last accessed 07/30/2016
[41] oneM2M Partners, oneM2M Partnership Agreement, http://www.onem2m.org/docs/oneM2M_Partnership_Agreement.pdf, Std., July 2012
[42] TIA, TIA-4940.005: Smart Device Communications Reference Architecture, Telecommunications Industry Association Std., 2012, http://global.ihs.com/search_res.cfm?RID=TIA&INPUT_DOC_NUMBER=TIA-4940, last accessed 07/30/2016
[43] ATIS, Assessments and Recommendations, ATIS Std., 2013, http://atis.org/M2M/index.asp, last accessed 07/30/2016
133
[44] T. Dierks and E. Rescorla, “The Transport Layer Security (TLS) Protocol Version 1.2,” RFC 5246 (Proposed Standard), Internet Engineering Task Force, Aug. 2008, updated by RFCs 5746, 5878, 6176, http://www.ietf.org/rfc/rfc5246.txt, last accessed 07/30/2016
[45] E. Rescorla and N. Modadugu, “Datagram Transport Layer Security Version 1.2,” RFC 6347 (Proposed Standard), Internet Engineering Task Force, Jan. 2012, http://www.ietf.org/rfc/rfc6347.txt, last accessed 07/30/2016
[46] P. Thubert, “Objective Function Zero for the Routing Protocol for Low-Power and Lossy Networks (RPL),” RFC 6552 (Proposed Standard), Internet Engineering Task Force, Mar. 2012, http://www.ietf.org/rfc/rfc6552.txt, last accessed 07/30/2016
[47] IEEE 802.24 Vertical Applications TAG, Institute of Electrical and Electronics Engineers (IEEE) Std., 2014, http://www.ieee802.org/24/, last accessed 07/30/2016
[48] OGC, Sensor Web Enablement Architecture, Open Geospatial Consortium Std., http://portal.opengeospatial.org/, last accessed 07/30/2016
[49] OMG, Data Distribution Service (DDS), Object Management Group TS, 2005, http://www.omg.org/spec/DDS/, last accessed 07/30/2016
[50] OASIS, Extensible Resource Identifier (XRI) Version 2.0, OASIS Std., 2005, http://docs.oasis-open.org/xri/xri/V2.0/xri-syntax-V2.0-cd-01.pdf, last accessed 07/30/2016
[51] OASIS, Extensible Resource Descriptor (XRD) Version 1.0, OASIS Std., 2010, http://docs.oasis-open.org/xri/xrd/v1.0/cd02/xrd-1.0-cd02.html, last accessed 07/30/2016
[52] M. R. Palattella et al., "Standardized Protocol Stack for the Internet of (Important) Things," in IEEE Communications Surveys & Tutorials, vol. 15, no. 3, pp. 1389-1406, Third Quarter 2013
[53] M. Agiwal; A. Roy; N. Saxena, "Next Generation 5G Wireless Networks: A Comprehensive Survey," in IEEE Communications Surveys & Tutorials, vol.PP, no.99, pp.1-1
[54] N. Venkatesh, “Ensuring Coexistence of IoT Wireless Protocols Using a Convergence Module to Avoid Contention”, Embedded Innovator, 12th Edition, 2015
134
[55] J. Chase, “The Evolution of the Internet of Things”, http://www.ti.com/lit/ml/swrb028/swrb028.pdf, Texas Instruments, September 2013
[56] H. SHI, R. V. Prasad, E. Onur and I. G. M. M. Niemegeers, "Fairness in Wireless Networks:Issues, Measures and Challenges," in IEEE Communications Surveys & Tutorials, vol. 16, no. 1, pp. 5-24, First Quarter 2014
[57] R. H. Tehrani; S. Vahid; D. Triantafyllopoulou; H. Lee; K. Moessner, "Licensed Spectrum Sharing Schemes for Mobile Operators: A Survey and Outlook," in IEEE Communications Surveys & Tutorials, vol.PP, no.99, pp.1-1
[58] M. L. Ku, W. Li, Y. Chen and K. J. Ray Liu, "Advances in Energy Harvesting Communications: Past, Present, and Future Challenges," in IEEE Communications Surveys & Tutorials, vol. 18, no. 2, pp. 1384-1412, Secondquarter 2016
[59] S. Sudevalayam and P. Kulkarni, "Energy Harvesting Sensor Nodes: Survey and Implications," in IEEE Communications Surveys & Tutorials, vol. 13, no. 3, pp. 443-461, Third Quarter 2011
[60] P. Kamalinejad, C. Mahapatra, Z. Sheng, S. Mirabbasi, V. C. M. Leung, and Y. L. Guan, “Wireless energy harvesting for the internet of things,” IEEE Commun. Mag., vol. 53, no. 6, pp. 102–108, Jun. 2015
[61] A. Sample and J. R. Smith, “Experimental results with two wireless power transfer systems,” Proceedings of the 4th international conference on Radio and wireless symposium, pp. 16-18, Jan. 2009
[62] M. Erol-Kantarci and H. T. Mouftah, "Energy-Efficient Information and Communication Infrastructures in the Smart Grid: A Survey on Interactions and Open Issues," in IEEE Communications Surveys & Tutorials, vol. 17, no. 1, pp. 179-197, Firstquarter 2015
[63] D. Feng, C. Jiang, G. Lim, L. J. Cimini, G. Feng and G. Y. Li, "A survey of energy-efficient wireless communications," in IEEE Communications Surveys & Tutorials, vol. 15, no. 1, pp. 167-178, First Quarter 2013
[64] G. Y. Li et al., "Energy-efficient wireless communications: tutorial, survey, and open issues," in IEEE Wireless Communications, vol. 18, no. 6, pp. 28-35, December 2011
[65] M. A. Marsan, L. Chiaraviglio, D. Ciullo, and M. Meo, “Optimal energy savings in cellular access networks,” in Proc. IEEE ICC Workshops, 2009, pp. 1–5.
135
[66] J. Gong, S. Zhou, Z. Niu, and P. Yang, “Traffic-aware base station sleeping in dense cellular networks,” in Proc. IWQoS, 2010, pp. 1–2.
[67] C. Zhang, T. Zhang, Z. Zeng, L. Cuthbert, and L. Xiao, “Optimal locations of remote radio units in comp systems for energy efficiency,” in Proc. IEEE VTC–Fall, 2010, pp. 1–5.
[68] G. Gur and F. Alagoz, “Green wireless communications via cognitive dimension: An overview,” IEEE Netw., vol. 25, no. 2, pp. 50–56, Mar./Apr. 2011
[69] M. Erol-Kantarci and H. T. Mouftah, “Wireless sensor networks for cost- efficient residential energy management in the smart grid,” IEEE Trans. Smart Grid, vol. 2, no. 2, pp. 314–325, Jun. 2011.
[70] L. Li, X. Hu, C. Ke, and K. He, “The applications of WiFi-based wireless sensor network in Internet of things and smart grid,” in Proc. IEEE ICIEA, Jun. 2011, pp. 789–793
[71] D. Bandyopadhyay and J. Sen, “Internet of Things - Applications and Challenges in Technology and Standardization”, Springer International Journal of Wireless Personal Communications, Vol. 58, No. 1, pp. 49 -- 69, May 2011
[72] X. Lu, P. Wang, D. Niyato, D. I. Kim and Z. Han, "Wireless Networks With RF Energy Harvesting: A Contemporary Survey," in IEEE Communications Surveys & Tutorials, vol. 17, no. 2, pp. 757-789, Secondquarter 2015
[73] M. F. Brejza, L. Li, R. G. Maunder, B. M. Al-Hashimi, C. Berrou and L. Hanzo, "20 Years of Turbo Coding and Energy-Aware Design Guidelines for Energy-Constrained Wireless Applications," in IEEE Communications Surveys & Tutorials, vol. 18, no. 1, pp. 8-28, Firstquarter 2016
[74] H. Sun, A. Nallanathan, and J. Jiang, “Improving the energy efficiency of power line communications by spectrum sensing,” in Proc. Int. Conf. Adv. Comput., Commun. Informat., 2012, pp. 758–762
[75] H. Sun, A. Nallanathan, N. Zhao, and C. Wang, “Green data transmission in power line communications,” in Proc. IEEE GLOBECOM, Dec. 3–7, 2012, pp. 3702, 3706
[76] A. Hamini, J. Baudais, and J. Helard, “Green resource allocation for powerline communications,” in Proc. IEEE ISPLC Appl., Apr. 3–6, 2011, pp. 393, 398
136
[77] HomePlug Green PHY 1.1 Specification, “HomePlug Alliance,” Portland, OR, USA, 2012, http://www.homeplug.org/tech/whitepapers/HomePlug_Green_PHY_whitepaper_121003.pdf, last accessed 07/30/2016
[78] K. Christensen et al., “IEEE 802.3az: the road to energy efficient ether- net,” IEEE Commun. Mag., vol. 48, no. 11, pp. 50–56, Nov. 2010
[79] L. Chiaraviglio, M. Mellia, and F. Neri, “Reducing power consumption in backbone networks,” in Proc. IEEE ICC, Dresden, Germany, Jun. 2009, pp. 1–6
[80] F. Idzikowski, S. Orlowski, C. Raack, H. Woesner, and A. Wolisz, “Saving energy in IP-over-WDM networks by switching off line cards in low-demand scenarios,” in Proc. Conf. ONDM, Kyoto, Japan, Feb. 2010, pp. 1–6
[81] G. Shen and R. S. Tucker, “Energy-minimized design for IP over WDM networks,” IEEE/OSA J. Opt. Commun. Netw., vol. 1, no. 1, pp. 176–186, Jun. 2009
[82] B. Kantarci and H. T. Mouftah, “Greening the availability design of optical WDM networks,” in Proc. IEEE GLOBECOM—Workshop Green Commun., Dec. 2010, pp. 1417–1421
[83] B. G. Bathula and J. M. H. Elmirghani, “Green networks: Energy efficient design for optical networks,” in Proc. IFIP Int. Conf. Wireless Opt. Commun. Netw., Apr. 28–30, 2009, pp. 1–5
[84] N. Naas, B. Kantarci, and H. T. Mouftah, “Energy-efficient realistic design and planning of optical backbone with multi-granular switching,” in Proc. ICTON, Jul. 2012, pp. 1–4
[85] J. Chabarek et al., “Power awareness in network design and routing,” in Proc. IEEE INFOCOM, 2008, pp. 1130–1138
[86] J. Baliga, R. Ayre, K. Hinton, and R. Tucker, “Energy consumption in wired and wireless access networks,” IEEE Commun. Mag., vol. 49, no. 6, pp. 70–77, Jun. 2011
[87] M. Maier, “Fiber-wireless sensor networks (FI-WSNs) for smart grids,” in Proc. 13th IEEE ICTON, Jun. 2011, pp. 1–4.
[88] N. Zaker, B. Kantarci, M. Erol-Kantarci and H. T. Mouftah, "Quality-of-service-aware fiber wireless sensor network gateway design for the smart grid," 2013 IEEE International Conference on Communications Workshops (ICC), Budapest, 2013, pp. 863-867

137
[89] D. P. Van, M. P. I. Dias, K. Kondepu, L. Valcarenghi, P. Castoldi and E. Wong, "Energy-efficient dynamic bandwidth allocation for long-reach passive optical networks," Optical Fibre Technology, 2014 OptoElectronics and Communication Conference and Australian Conference on, Melbourne, VIC, 2014, pp. 999-1001
[90] J. Liu, H. Guo, H. Nishiyama, H. Ujikawa, K. Suzuki and N. Kato, "New Perspectives on Future Smart FiWi Networks: Scalability, Reliability, and Energy Efficiency," in IEEE Communications Surveys & Tutorials, vol. 18, no. 2, pp. 1045-1072, Secondquarter 2016
[91] “The Internet of Things: Opportunities & Challenges”, http://www.ti.com/ww/en/internet_of_things/pdf/14-09-17-IoTforCap.pdf, Texas Instruments
[92] H. Hu, Y. Wen, T. S. Chua and X. Li, "Toward Scalable Systems for Big Data Analytics: A Technology Tutorial," in IEEE Access, vol. 2, no., pp. 652-687, 2014
[93] “Neurons and Synapses,” http://www.human-memory.net/brain_neurons.html, last accessed 09/04/2016
[94] M. Trevathan, “Why the IoT Ecosystem Is Like the Nervous System,” Internet of Things Institute, http://www.ioti.com/iot-strategy/why-iot-ecosystem-nervous-system, July 2016
[95] K. Ashton, “The Internet of Things is Becoming a Nervous System,” https://www.theintelligenceofthings.com/article/the-internet-or-things-is-becoming-a-new-nervous-system/, last accessed 08/04/2016
[96] Markkanen, “Competitive Edge from Edge Intelligence IoT Analytics Today and in 2020,” ABI Research, May 2015, https://www.thingworx.com/wp-content/uploads/2016/05/WP_abi-research_iot-analytics-today-and-in-2020_EN.pdf
[97] S. Sarkar; S. Chatterjee; S. Misra, "Assessment of the Suitability of Fog Computing in the Context of Internet of Things," in IEEE Transactions on Cloud Computing, vol.PP, no.99, pp.1-1
[98] S. K. Datta, C. Bonnet and J. Haerri, "Fog Computing architecture to enable consumer centric Internet of Things services," 2015 International Symposium on Consumer Electronics (ISCE), Madrid, 2015, pp. 1-2
[99] A. Bader, H. Ghazzai, A. Kadri and M. S. Alouini, "Front-end intelligence for large-scale application-oriented internet-of-things," in IEEE Access, vol. 4, no., pp. 3257-3272, 2016
138
[100] M. Yannuzzi, R. Milito, R. Serral-Gracià, D. Montero and M. Nemirovsky, "Key ingredients in an IoT recipe: Fog Computing, Cloud computing, and more Fog Computing," 2014 IEEE 19th International Workshop on Computer Aided Modeling and Design of Communication Links and Networks (CAMAD), Athens, 2014, pp. 325-329
[101] S. Sarkar and S. Misra, "Theoretical modelling of fog computing: a green computing paradigm to support IoT applications," in IET Networks, vol. 5, no. 2, pp. 23-29, 3 2016
[102] “Cisco delivers vision of fog computing to accelerate value from billions of connected devices,” http://newsroom.cisco.com/release/1334100/Cisco-Delivers-Vision-of-Fog-Computing-to-Accelerate-Value-from-Billions-of-Connected-Devices-utm-medium-rss, January 2014
[103] O. Salman, I. Elhajj, A. Kayssi and A. Chehab, "Edge computing enabling the Internet of Things," Internet of Things (WF-IoT), 2015 IEEE 2nd World Forum on, Milan, 2015, pp. 603-608
[104] V. Gazis, A. Leonardi, K. Mathioudakis, K. Sasloglou, P. Kikiras and R. Sudhaakar, "Components of fog computing in an industrial internet of things context," Sensing, Communication, and Networking - Workshops (SECON Workshops), 2015 12th Annual IEEE International Conference on, Seattle, WA, 2015, pp. 1-6
[105] K. Lee, D. Kim, D. Ha, U. Rajput and H. Oh, "On security and privacy issues of fog computing supported Internet of Things environment," Network of the Future (NOF), 2015 6th International Conference on the, Montreal, QC, 2015, pp. 1-3
[106] S. Dey, A. Mukherjee, H. S. Paul and A. Pal, "Challenges of Using Edge Devices in IoT Computation Grids," Parallel and Distributed Systems (ICPADS), 2013 International Conference on, Seoul, 2013, pp. 564-569
[107] C. Puliafito, E. Mingozzi and G. Anastasi, "Fog Computing for the Internet of Mobile Things: Issues and Challenges," 2017 IEEE International Conference on Smart Computing (SMARTCOMP), Hong Kong, 2017, pp. 1-6.
[108] D. R. d. Vasconcelos, R. M. d. C. Andrade and J. N. d. Souza, "Smart Shadow -- An Autonomous Availability Computation Resource Allocation Platform for Internet of Things in the Fog Computing Environment," 2015 International Conference on Distributed Computing in Sensor Systems, Fortaleza, 2015, pp. 216-217

139
[109] W. Zha and G. K. Venayagamoorthy, "Comparison of non-uniform optimal quantizer designs for speech coding with adaptive critics and particle swarm," Fourtieth IAS Annual Meeting. Conference Record of the 2005 Industry Applications Conference, 2005., 2005, pp. 674-679 Vol. 1.
[110] W. Xia, Y. Wen, C. H. Foh, D. Niyato and H. Xie, "A Survey on Software-Defined Networking," in IEEE Communications Surveys & Tutorials, vol. 17, no. 1, pp. 27-51, Firstquarter 2015
[111] B. A. A. Nunes, M. Mendonca, X. N. Nguyen, K. Obraczka and T. Turletti, "A Survey of Software-Defined Networking: Past, Present, and Future of Programmable Networks," in IEEE Communications Surveys & Tutorials, vol. 16, no. 3, pp. 1617-1634, Third Quarter 2014
[112] H. Xie, Y. Yang, A. Krishnamurthy, Y. Liu, and A. Silberschatz, “P4p: Provider portal for applications,” ACM SIGCOMM Comput. Commun. Rev., vol. 38, no. 4, pp. 351–362, Aug. 2008
[113] T.-Y. Huang, N. Handigol, B. Heller, N. McKeown, and R. Johari, “Con- fused, timid, and unstable: Picking a video streaming rate is hard,” in Proc. ACM Conf. Internet Meas. Conf., 2012, pp. 225–238
[114] X. Chen, Z. M. Mao, and J. Van Der Merwe, “ShadowNet: A platform for rapid and safe network evolution,” in Proc. Conf. USENIX Annu. Tech. Conf., 2009, p. 3.
[115] R. Perlman, “Rbridges: Transparent routing,” in Proc. 23rd Annu. Joint Conf. IEEE INFOCOM, 2004, vol. 2, pp. 1211–1218.
[116] R. Perlman, D. Eastlake, III, S. Gai, D. Dutt, and A. Ghanwani, Routing bridges (RBridges): Base Protocol Specification, Jul. 2011, RFC 6325, http://tools.ietf.org/rfc/rfc6325.txt, last accessed 07/30/2016
[117] “Software-defined networking: The new norm for networks,” Palo Alto, CA, USA, White Paper, Apr. 2012, https://www.opennetworking.org/images/stories/downloads/white- papers/wp-sdn-newnorm.pdf, last accessed 07/30/2016
[118] “Vulnerability Analysis of Energy Delivery Control Systems” by Idaho National Laboratory, September 2011, http://energy.gov/sites/prod/files/Vulnerability%20Analysis%20of%20Energy%20Delivery%20Control%20Systems%202011.pdf

140
[119] S. Hilton, “Dyn Analysis Summary of Friday October 21 Attack,” http://dyn.com/blog/dyn-analysis-summary-of-friday-october-21-attack/, October 2016
[120] C. Doctorow, “Proof-of-concept ransomware for smart thermostats demoed at Defcon,” Boingboing, August 2016, http://boingboing.net/2016/08/08/proof-of-concept-ransomware-fo.html
[121] M. Frauenfelder, “75 percent of Bluetooth smart locks can be hacked,” Boingboing, August 2016, http://boingboing.net/2016/08/08/75-percent-of-bluetooth-smart.html
[122] K. Hill, “This guy’s light bulb performed a DoS attack on his entire smart house,” Fusion, March 2015, http://fusion.net/story/55026/this-guys-light-bulb-ddosed-his-entire-smart-house/
[123] “How A Few Words To Siri Unlocked A Man's Front Door And Exposed A Major Security Flaw In Apple's HomeKit,” Forbes, September 2016, http://www.forbes.com/sites/aarontilley/2016/09/21/apple-homekit-siri-security/#f5fa4b6e8a3d
[124] J.D. Howard and T.A. Longstaff, “A Common Language for Computer Security Incidents,” Sandia National Laboratories, October 1998, http://prod.sandia.gov/techlib/access-control.cgi/1998/988667.pdf
[125] W. Stallings, “Network and Internetwork Security,” Prentice Hall, Upper Saddle River, NJ, 1995
[126] R. R. Brooks, Disruptive security technologies with mobile code and peer-to-peer networks, CRC Press, Boca Raton, FLA, 2005
[127] R.R. Brooks, S. Sander, J. Deng, and J. Taiber, “Automotive Security Concerns: Challenges and State of the Art of Automotive System Security,” IEEE Vehicular Technology Magazine, June 2009
[128] C. Beasley, X. Zhong, J. Deng, R. Brooks and G. K. Venayagamoorthy, "A survey of electric power synchrophasor network cyber security," IEEE PES Innovative Smart Grid Technologies, Europe, Istanbul, 2014, pp. 1-5
[129] S. Muthyala, "Communication security for smart grid distribution networks," ISU, Proj. Rep. 2013
141
[130] H. Lin, et al., "A study of communication and power system infrastructure interdependence on PMU-based wide area monitoring and protection," Power and Energy Society General Meeting, San Diego, CA, 2012 IEEE , pp.1-7, 22-26 July 2012
[131] R. Brooks, Introduction to Computer and Network Security Navigating Shades of Gray. Boca Raton: Taylor & Francis Group, LLC, 2014
[132] T. Baumeister, "Literature review on smart grid cyber security." in Proc. University of Hawaii at Manoa, Tech. Rep. December 2010
[133] T. Morris, et al, "Cyber security testing of substation phasor measurement units and phasor data concentrators." in Proc. The 8th Annual ACM Cyber Security and Information Intelligence Research Workshop (CSIIRW), 2011
[134] “Teardrop Attack,” https://security.radware.com/ddos-knowledge-center/ddospedia/teardrop-attack/, last accessed 01/19/2017
[135] I. Ozcelik, Y. Fu, and R. R. Brooks, “DoS detection is easier now," Research and Educational Experiment Workshop (GREE), 2013
[136] “Deflect,” https://equalit.ie/portfolio/deflect, last accessed 09/04/2016
[137] “Defending against Sabotage and Terrorist Attacks,” http://www.ucsusa.org/sites/default/files/legacy/assets/documents/nuclear_power/NPWWch3.pdf, last accessed 01/19/2017
[138] S. Zargar, J. Joshi, and D. Tipper, "A survey of defense mechanisms against distributed denial of service (DDoS) flooding attacks," Communications Surveys & Tutorials, IEEE, vol. 15, no. 4, pp. 2046- 2069, Fourth Quarter 2013
[139] Y. Ye, et al., "A Survey on Cyber Security for Smart Grid Communications," Communications Surveys & Tutorials, IEEE , vol.14, no.4, pp.998-1010, Fourth Quarter 2012
[140] W. F. Boyer, and S. A. McBride, "Study of security attributes of smart grid systems–current cyber security issues," INL, USDOE, Battelle Energy Alliance LLC., Rep INL/EXT-09-15500, Apr. 2009
[141] J. Stewart, et al., "Synchrophasor security practices." in Proc. 14th Annual Georgia Tech Fault and Disturbance Analysis Conf. Atlanta, GA, 2011
[142] S. Siddharth, A. Hahn, and M. Govindarasu. "Cyber–physical system security for the electric power grid." Proceedings of the IEEE, vol. 100, no. 1, pp. 210-224, 2012
142
[143] R. Lemos, “Microsoft warns of hijacked certificates,” CNET Tech Industry, January 2002, https://www.cnet.com/news/microsoft-warns-of-hijacked-certificates/
[144] R. Oppliger, R. Hauser, and D. Basin, "SSL/TLS session-aware user authentication." Computer, vol. 41, no. 3, pp. 59-65, 2008
[145] X. Zhong, A. Ahmadi, R. Brooks, G. K. Venayagamoorthy, L. Yu and Y. Fu, "Side channel analysis of multiple PMU data in electric power systems," Power Systems Conference (PSC), 2015 Clemson University, Clemson, SC, 2015, pp. 1-6
[146] H. Bhanu, et al., "Side-channel analysis for detecting protocol tunneling," Advances in Internet of Things, Vol. 1 No. 2, 2011, pp. 13- 26.
[147] Y. Guan, et al., “Netcamo: camouflaging network traffic for QoS- guaranteed mission critical applications,” Systems, Man and Cybernetics, Part A: Systems and Humans, IEEE Transactions on, vol. 31, no. 4, July 2001, pp. 253-265
[148] C. Beasley, Electric power synchrophasor network cyber security vulnerabilities, MS Dissertation, Dept. of Electrical and Computer Engineering, Clemson University, 2014
[149] F. Callegati, W. Cerroni, and M. Ramilli, "Man-in-the-middle attacks to the HTTPS protocol." Security & Privacy, IEEE, vol. 7, no. 1, pp. 78-81, 2009
[150] S. D'Antonio, L. Coppolino, I. A. Elia, and V. Formicola, "Security issues of a phasor data concentrator for smart grid infrastructure." in Proc. 13th European Workshop on Dependable Computing, Pisa, Italy, ACM, pp. 3, 2011
[151] G. J. W. Halfond, and A. Orso. "AMNESIA: analysis and monitoring for neutralizing SQL-injection attacks." in Proc. 20th IEEE/ACM international Conference on Automated software engineering. ACM, pp. 174, 2005
[152] K. Deltchev, “New Web 2.0 Attacks,” Bachelor’s Thesis, Ruhr-University of Bochum, February 2010, http://www.slideshare.net/test2v/new-web-20-attacks
[153] “Tutorial on Defending Against SQL Injection Attacks,” Oracle, http://download.oracle.com/oll/tutorials/SQLInjection/index.htm, last accessed 01/19/2017
[154] P. Hooimeijer, B. Livshits, D. Molnar, P. Saxena, and M. Veanes, “Fast and Precise Sanitizer Analysis with BEK,” Proceedings of the 20th USENIX conference on Security, SEC’11, pages 1-1, Berkeley, CA, 2011, http://www.msr-waypoint.com/en-us/um/people/livshits/papers/pdf/usenixsec11a.pdf
143
[155] D. Yu, et al., "Short paper: detection of GPS spoofing attacks in power grids," Proceedings of the 2014 ACM conference on Security and privacy in wireless & mobile networks. ACM, 2014.
[156] S. Cui, et al., "Coordinated data-injection attack and detection in the smart grid: A detailed look at enriching detection solutions," Signal Processing Magazine, IEEE, vol.29, no.5, pp.106-115, Sept. 2012
[157] D. P. Shepard, T. E. Humphreys, and A. A. Fansler. "Evaluation of the vulnerability of phasor measurement units to GPS spoofing attacks." International Journal of Critical Infrastructure Protection, vol. 5 issuses 3, 2012, pp. 146-153
[158] M.Lennon and M. Dunlop, Smarter technology means smarter lifestyle choices, Smart Energy GB, April 2016, https://www.google.com/url?sa=t&rct=j&q=&esrc=s&source=web&cd=1&ved=0ahUKEwi71KPfwIHSAhUB9GMKHRPZCSEQFggcMAA&url=https%3A%2F%2Fwww.smartenergygb.org%2Fen%2F~%2Fmedia%2FSmartEnergy%2Fessential-documents%2Fpress-resources%2FDocuments%2FSmarter-technology-means-smarter-lifestyle-choices.ashx&usg=AFQjCNHcp0artL6UPMGbaOgM9ZLAfAwOiw, (accessed 8 February 2017).
[159] The Transtheoretical Model, pro-change Behavior Systems, Inc., http://www.prochange.com/transtheoretical-model-of-behavior-change, (accessed 8 February 2017).
[160] Prochaska and DiClemente, Stages of Change Model/Transtheoretical Model (TTM), http://currentnursing.com/nursing_theory/transtheoretical_model.html, (accessed 8 February 2017).
[161] M.A. Kong, A. Mitsios, H. Ding, and S. Mudgal, Behavioural Aspects of Smart Cities, Energy Research Knowledge Centre (ERKC), European Commission, September 2014, https://setis.ec.europa.eu/energy-research/sites/default/files/library/ERKC_%20TRS_Smart%20_Cities_Behavioural_Aspects.pdf, (accessed 8 February 2017).
[162] N. B.-Ozkan, R. Davidson, M. Bicket, L. Whitmarsh, Social barriers to the adoption of smart homes, Energy Policy, Volume 63, December 2013, Pages 363-374.
[163] J. W. Creswell, V. L. Plano Clark, Designing and Conducting Mixed Methods Research, SAGE Publications, Inc., 2011.

144
[164] G. Bedi, G. K. Venayagamoorthy and R. Singh, " Pattern Recognition for Electric Energy Consumption Prediction in a Laboratory Environment," 2017 IEEE Symposium on Computational Intelligence Applications in Smart Grid (IEEE CIASG'17), 2017
[165] P. Mitra and G. K. Venayagamoorthy, "Implementation of an Intelligent Reconfiguration Algorithm for an Electric Ship's Power System," in IEEE Transactions on Industry Applications, vol. 47, no. 5, pp. 2292-2300, Sept.-Oct. 2011.
[166] Real-Time Power and Intelligent Systems (RTPIS) Laboratory, �http://rtpis.org, last accessed 08/04/2017 ��
[167] Power Patrol, https://www.setra.com/products/power-monitoring/power-patrol-revenue-grade-power-meter, last accessed 08/04/2017
[168] Pneumatic to Direct Digital Control DDC Room Thermostats, http://www.johnsoncontrols.com/buildings/hvac-controls/thermostats/pneumatic-to-direct-digital-control-ddc-room-thermostats, last accessed 08/04/2017
[169] Luminaire Controller, Internal-Mount, http://www.audacywireless.com/audacy/products/lighting-controls/luminaire-controllers/scl-1000.aspx, last accessed 08/04/2017
[170] Scene Switch, http://www.audacywireless.com/audacy/products/lighting-controls/switches/wss-1200.aspx, last accessed 11/08/2017
[171] Ceiling-Mount Motion Sensor, http://www.audacywireless.com/audacy/products/lighting-controls/motion-sensors/vsc-1300.aspx, last accessed 08/04/2017
[172] Gateway, http://www.audacywireless.com/audacy/products/lighting-controls/gateway/gw-1100.aspx, last accessed 08/04/2017
[173] Modbus TCP to BACnet IP Gateway, http://www.protoconvert.com/DirectSolutions/GatewayGrid/ModbusTCPtoBACnetIPGateway%7C%7CModbusTCPtoB.aspx, last accessed 04/09/2018
[174] Network Control Engine Catalog Page, http://cgproducts.johnsoncontrols.com/CAT_PDF/1900455.pdf, last accessed 08/04/2017
145
[175] Metasys Software, http://www.johnsoncontrols.com/buildings/building-management/building-automation-systems-bas/metasys-software-and-servers, last accessed 11/08/2017
[176] Online Audacy Interface, http://www.audacywireless.com/online-interface/, last accessed 11/08/2017
[177] Matlab, https://www.mathworks.com/products/matlab.html, last accessed 11/08/2017
[178] BACnet, http://www.bacnet.org, last accessed 08/04/2017
[179] A. R. Al-Ali, I. A. Zualkernan, M. Rashid, R. Gupta and M. Alikarar, "A smart home energy management system using IoT and big data analytics approach," in IEEE Transactions on Consumer Electronics, vol. 63, no. 4, pp. 426-434, November 2017.
[180] A. C. Luna, N. L. Diaz, M. Graells, J. C. Vasquez and J. M. Guerrero, "Cooperative energy management for a cluster of households prosumers," in IEEE Transactions on Consumer Electronics, vol. 62, no. 3, pp. 235-242, August 2016.
[181] J. Han, C. S. Choi, W. K. Park, I. Lee and S. H. Kim, "Smart home energy management system including renewable energy based on ZigBee and PLC," in IEEE Transactions on Consumer Electronics, vol. 60, no. 2, pp. 198-202, May 2014.
[182] Y. S. Son, T. Pulkkinen, K. D. Moon and C. Kim, "Home energy management system based on power line communication," in IEEE Transactions on Consumer Electronics, vol. 56, no. 3, pp. 1380-1386, Aug. 2010.
[183] A J. L. Elman, Finding Structure in Time, Cognitive Science 14, 179-211, 1990.
[184] Neural Network Toolbox for Use with MATLAB, by H. Demuth and M. Beale, The MathWorks, Inc, 2002.
[185] A Field Guide to Dynamical Recurrent Networks, by J. F. Kolen and S. C. Kremer, The Institute of Electrical and Electronic Engineers, Inc., New York, 2001.
[186] L. Ren, Y. Liu, Z. Rui, H. Li and R. Feng, Application of Elman Neural Network and MATLAB to Load Forecasting, 2009 International Conference on Information Technology and Computer Science, Kiev, 2009, pp. 55-59.

146
[187] R. Eberhart and J. Kennedy, “A new optimizer using particle swarm theory,” in Proc. 6th Int. Symp. Micro Machine and Human Science (MHS), Oct. 1995, pp. 39–43.
[188] R. Eberhart, Y. Shi, and J. Kennedy, Swarm Intelligence. San Mateo, CA: Morgan Kaufmann, 2001
[189] Y. del Valle, G. K. Venayagamoorthy, S. Mohagheghi, J. C. Hernandez and R. G. Harley, "Particle Swarm Optimization: Basic Concepts, Variants and Applications in Power Systems," in IEEE Transactions on Evolutionary Computation, vol. 12, no. 2, pp. 171-195, April 2008.
[190] A. Abraham, C. Grosan, and V. Ramos, “Swarm Intelligence in Data Mining,” Studies in Computational Intelligence, Volume 34, Springer-Verlag Berlin Heidelberg 2006.
[191] P. Suganthan, “Particle Swarm Optimizer with Neighborhood Optimizer,” In Proceedings of the Congress on Evolutionary Computation, pages 1958–1962, 1999.
[192] Y. Shi and A.R. Eberhart, “Modified Particle Swarm Optimizer,” In Proceedings of the IEEE International Conference on Evolutionary Computation, pages 69–73, 1998.
[193] F. Van den Bergh, “An Analysis of Particle Swarm Optimizers,” PhD thesis, Department of Computer Science, University of Pretoria, 2002.
[194] Y. Manjhi and J. Dhar, "Forecasting energy consumption using particle swarm optimization and gravitational search algorithm," 2016 International Conference on Advanced Communication Control and Computing Technologies (ICACCCT), Ramanathapuram, 2016, pp. 417-420.
[195] A. T. Eseye, D. Zheng, J. Zhang and Dan Wei, "Optimal energy management strategy for an isolated industrial microgrid using a Modified Particle Swarm Optimization," 2016 IEEE International Conference on Power and Renewable Energy (ICPRE), Shanghai, 2016, pp. 494-498.
[196] Y. Zhang, S. Zhao and L. Tang, "Energy consumption prediction for steelmaking production using PSO-based BP neural network," 2016 IEEE Congress on Evolutionary Computation (CEC), Vancouver, BC, 2016, pp. 3207-3214.
[197] Liye Xiao and Liyang Xiao, "Combined modeling for electrical load forecasting with particle swarm optimization," 2014 IEEE Workshop on Electronics, Computer and Applications, Ottawa, ON, 2014, pp. 395-400.
147
[198] A M. R-Sierra and C. A. C. Coello, " Multi-Objective Particle Swarm Optimizers: A Survey of the State-of-the-Art," in International Journal of Computational Intelligence Research, vol. 2, no. 3, pp. 287-308, 2006
[199] V. Kumar and S. Minz, “Multi-Objective Particle Swarm Optimization: An Introduction,” Smart Computing Review, vol. 4, no. 5, October 2014
[200] I. Jayawardene and G. K. Venayagamoorthy, "Cellular computational extreme learning machine network based frequency predictions in a power system," 2017 International Joint Conference on Neural Networks (IJCNN), Anchorage, AK, 2017, pp. 3377-3384.
[201] B. Luitel, G. K. Venayagamoorthy, “Cellular computational networks—A scalable architecture for learning the dynamics of large networked systems,” Neural Networks, Volume 50, 2014, Pages 120-123.
[202] M. A. Rahman and G. K. Venayagamoorthy, "Scalable cellular computational network based WLS state estimator for power systems," 2015 Clemson University Power Systems Conference (PSC), Clemson, SC, 2015, pp. 1-6.
[203] Y. Wei, I. Jayawardene, Laboratory and G. K. Venayagamoorthy, "Frequency Prediction of Synchronous Generators in a Multi-Machine Power System with a Photovoltaic Plant Using a Cellular Computational Network," 2015 IEEE Symposium Series on Computational Intelligence, Cape Town, 2015, pp. 673-678.
[204] B. Luitel and G. K. Venayagamoorthy, "Decentralized Asynchronous Learning in Cellular Neural Networks," in IEEE Transactions on Neural Networks and Learning Systems, vol. 23, no. 11, pp. 1755-1766, Nov. 2012.
[205] G. K. Venayagamoorthy, "Situational Awareness / Situational Intelligence System and Method for Analyzing, Monitoring, Predicting and Controlling Electric Power Systems." U.S. Patent 9,778,629, issued October 3, 2017.
[206] M. A. Rahman, Y. Wei and G. K. Venayagamoorthy, "Cellular computational generalized neuron network with cooperative PSO for power systems," 2017 International Joint Conference on Neural Networks (IJCNN), Anchorage, AK, 2017, pp. 4252-4258.
[207] “Metasys SMP Help,” http://cgproducts.johnsoncontrols.com/MET_PDF/1201793.pdf?x=54, pages 420–454, August 2017.

148
BIOGRAPHY
Guneet Bedi, Clemson University
Originally from India, Guneet Bedi is a Ph.D. candidate in the Department of
Electrical and Computer Engineering (ECE) at Clemson University, researching Internet
of Things applications in Electric Power and Energy Systems. Guneet received his B.E.
in Electronics and Telecommunication from University of Pune, India (2011) and his
M.S. in Electrical Engineering from Clemson University (2014). While in the ECE
program, Guneet has worked as a graduate research, teaching, instructional, and grading
assistant as well as a mentor for K-12 and undergraduate science enrichment programs.
Guneet has published several peer-reviewed papers and has presented his research at a
number of conferences. He has also served as a reviewer for IEEE Internet of Things
journal and Elsevier Computers and Security journal. Besides his academic pursuits,
Guneet has served as the President of Graduate Student Government, President of
International Student Association, and the Vice- President of Clemson Indian Students’
Association. Guneet played on Clemson’s water polo club team for two years and is a
graduate student member of the Omicron Delta Kappa national level leadership honor
society and the Institute of Electrical and Electronics Engineers. During his time at
Clemson, Guneet has been honored with awards for his outstanding scholarship,
leadership, teaching, and service.