Embed Size (px)
Citation preview

Internet Addressing andthe RIR system (part 2)
12 February 2004
Phnom Penh, Cambodia
Paul Wilson, APNIC

Overview – Part 2
• Allocation statistics – Asia Pacific Internet Resource statistics– Global Internet Resource statistics– IPv4 lifetime expectation
• More on Addressing policy– How to participate in open policy
processes

APNIC Internet Resource Allocation

Resource Allocation Statistics
• IP addresses mirror Internet growth– Represent deployed infrastructure– Distributed in consistent fashion– APNIC can provide objective, factual info
• Analysis of trends…– Allocation patterns per country over time– Comparison with other regions– Correlation of IP addresses with...
• Population, GDP, etc

IPv4 addresses allocated - annual
0
4
8
12
16
20
24
28
32
36
40
Pre-1996 1996 1997 1998 1999 2000 2001 2002 2003
Mill
ions
Other
TW
THSG
NZ
MY
KRJP
IN
ID
HKCN
AU

IPv4 addresses allocated - total
2002: 1.60
2001: 1.7
2000: 1.24
1999: 0.54
2003: 1.96
1998: 0.27
0
16
32
48
64
80
96
112
128
144
160
Jan-96 Jan-97 Jan-98 Jan-99 Jan-00 Jan-01 Jan-02 Jan-03 Jan-04
Mill
ions 222
221220219218211210203202061060

IPv4 distribution in Asia Pacific
SG1%
NZ1%
TH1%
TW7%
ID1%
KR19%
CN28%
JP32%
Other8%
Other1%
AU3%
HK3%
IN2%
MY1%
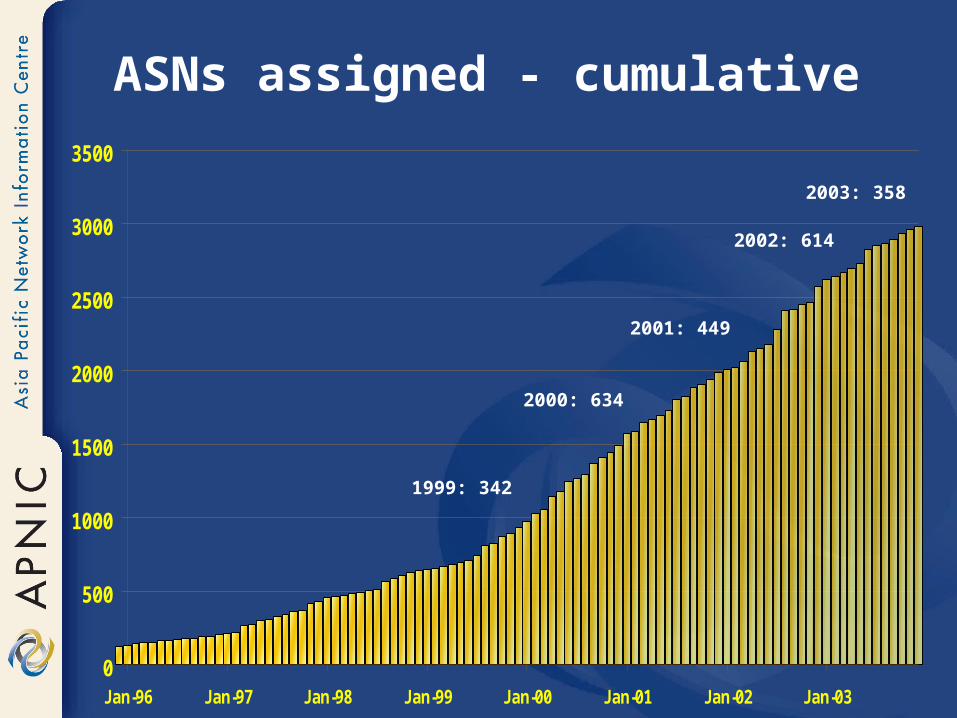
ASNs assigned - cumulative
2003: 358
2001: 449
2000: 634
1999: 342
2002: 614
0
500
1000
1500
2000
2500
3000
3500
Jan-96 Jan-97 Jan-98 Jan-99 Jan-00 Jan-01 Jan-02 Jan-03

ASN distribution in Asia Pacific
KR20%
JP19%
AU17%
HK8%
ID3%
IN3%
SG3%
MY1%
Other13%
Other3%
TH3%
PH3%
CN6%
TW5%
NZ4%
AP1% PK
1%

Global Internet Resource Statistics

IPv4 Address Space Status: /8
Total /8 blocks available: 256
92
16
91
16
16
2
11
12
0 10 20 30 40 50 60 70 80 90 100
Central Registry
Multicast
IANA Reserve
Experimental
ARIN
LACNIC
APNIC
RIPE NCC

IPv4 allocations from RIRs to LIRs/ISPs - Yearly comparison
0.00
0.50
1.00
1.50
2.00
2.50
1999 2000 2001 2002 2003
APNIC
ARIN
LACNIC
RIPE NCC

1 Jan 99 – 31 Dec 03
IPv4 allocations from RIRs to LIRs/ISPs - Cumulative total
RIPE NCC6.82 31%
APNIC7.24 33%
LACNIC0.342%
ARIN7.89 34%

ASN assignments from RIRs to LIRs/ISPs - Yearly comparison
0
500
1,000
1,500
2,000
2,500
3,000
1999 2000 2001 2002 2003
APNIC
ARIN
LACNIC
RIPE NCC

1 Jan 99 – 31 Dec 03
ASN assignments from RIRs to LIRs/ISPs - Cumulative total
ARIN10388 54%
RIPE NCC 563630%
LACNIC5403%
APNIC2371 13%

IPv6 allocations from RIRs to LIRs/ISPs - Yearly comparison
0
20
40
60
80
100
120
140
160
1999 2000 2001 2002 2003
APNICARINLACNICRIPE NCC

IPv6 allocations from RIRs to LIRs/ISPs - Cumulative total
1 Jan 99 – 31 Dec 03
RIPE NCC27956%
ARIN84
16%
LACNIC143% APNIC
12825%

IPv4 Address Lifetime Expectancy
- Are we running out of IPv4 addresses?
Research activityconducted by Geoff Huston
and supported by APNIC

Are We Running Out of IPv4?
• Recent media reports claiming we are running out of IP addresses– Some claim we’ve already run out in some parts
of the world
• But what are the facts?– Is the IPv4 sky falling?
• Geoff Huston, chief scientist in the Internet area at Telstra, has studied the IPv4 consumption rates
http://www.potaroo.net/ispcolumn/2003-07-v4-address-lifetime/ale.pdf

Data Analysed
• Three views to make forward projections:– The rate at which IPv4 number blocks
are passed from IANA to the RIRs– The rate at which RIRs undertake
assignments of IPv4 address blocks to LIRs and end users
– The growth of the number of announced addresses in the BGP routing table

Address Management Process
RIR
ISPA
lloca
tion
ISP
BGP
Ann
ounc
emen
t
IETF
IANA
Del
egat
ion
IANA
RIR
Allo
catio
n

IETF Reserved, 20.1, 8%
Multicast, 16, 6%
IANA Pool, 89, 35%
IANA Allocated, 130.9, 51%
IANA Allocations – Current

IANA Allocations – Historical
0
32
64
96
128
Jan-91 Jan-93 Jan-95 Jan-97 Jan-99 Jan-01 Jan-03

RIR Allocations – Current Status
IETF Reserved, 20.1, 8%
Multicast, 16, 6%
IANA Pool, 89, 35%
RIR Pool, 14, 5%
Assigned, 116.9, 46%Allocated

RIR Allocations – Historical
RIR Assigned IPv4 /8 Address Blocks
0
20
40
60
80
100
120
Jan-83 Jan-85 Jan-87 Jan-89 Jan-91 Jan-93 Jan-95 Jan-97 Jan-99 Jan-01 Jan-03

BGP Routing Table – Current
IETF Reserved, 20.1, 8%
Multicast, 16, 6%
IANA Pool, 89, 35%
RIR Pool, 14, 5%
Assigned, 42.4, 17%
Advertised, 74.5, 29%

BGP Routing Table - AS1221

Another look at that BGP data…Linear Squares Best Fit
58
60
62
64
66
68
70
72
74
Nov-99 Feb-00 May-00 Aug-00 Nov-00 Feb-01 May-01 Aug-01 Nov-01 Feb-02 May-02 Aug-02 Nov-02 Feb-03 May-03 Aug-03

Combined Data (3 years)
0
20
40
60
80
100
120
140
Dec-99 Mar-00 Jun-00 Sep-00 Dec-00 Mar-01 Jun-01 Sep-01 Dec-01 Mar-02 Jun-02 Sep-02 Dec-02 Mar-03 Jun-03
IANARIRBGP

Projection – linear
2047
2031 2037
0
32
64
96
128
160
192
224
Jan-00 Jan-05 Jan-10 Jan-15 Jan-20 Jan-25 Jan-30 Jan-35 Jan-40 Jan-45
IANA
RIR
BGP

Projection – exponential
2020 2022
0
32
64
96
128
160
192
224
Jan-00 Jan-02 Jan-04 Jan-06 Jan-08 Jan-10 Jan-12 Jan-14 Jan-16 Jan-18 Jan-20 Jan-22 Jan-24 Jan-26 Jan-28
IANA
RIR
BGP

Observations
• Extrapolation of current allocation practices and BGP-based demand model
• Derived from 2000-2003 data• Considering
– IANA/RIR unallocated pool– Total address space including allocated but
unannounced
• Assuming exponential growth– Address space lasts until 2025, or up to 2029
• Assuming linear growth– Address space lasts until 2037 - 2047

Issues
• This is just a model - reality will be different!• Will the BGP routing table continue to
reflect allocation rates? • Is the model of the unadvertised pools and
RIR holding pools appropriate?• Externalities…
– What are the underlying growth drivers (applications) and how are these best modeled?
– What forms of disruptive events would alter this model, and to what extent?
– Should address management policies change as a result of these results?

Questions ?

Policy Development in the Asia Pacific
The APNIC Community
&
the Policy Development Process

What is the APNIC community?
Global Internet Community
APNIC Internet Community
IETF
ISOC
Individuals
APNIC Members
APAN PITA
ISP Associations

Policy Development
• Industry self-regulatory processes– Open to all interested parties– Facilitated by RIR staff and volunteers
• Policy implementation– RIR processes– ISPs and other affected parties

Participation in policy processes
• Why should I bother?– Responsibility as an APNIC member
• To be aware of the current policies for managing address space allocated to you
– Business reasons• Policies affect your business operating
environment and are constantly changing• Ensure your ‘needs’ are met
– Educational• Learn and share experiences• Stay abreast with ‘best practices’ in the
Internet
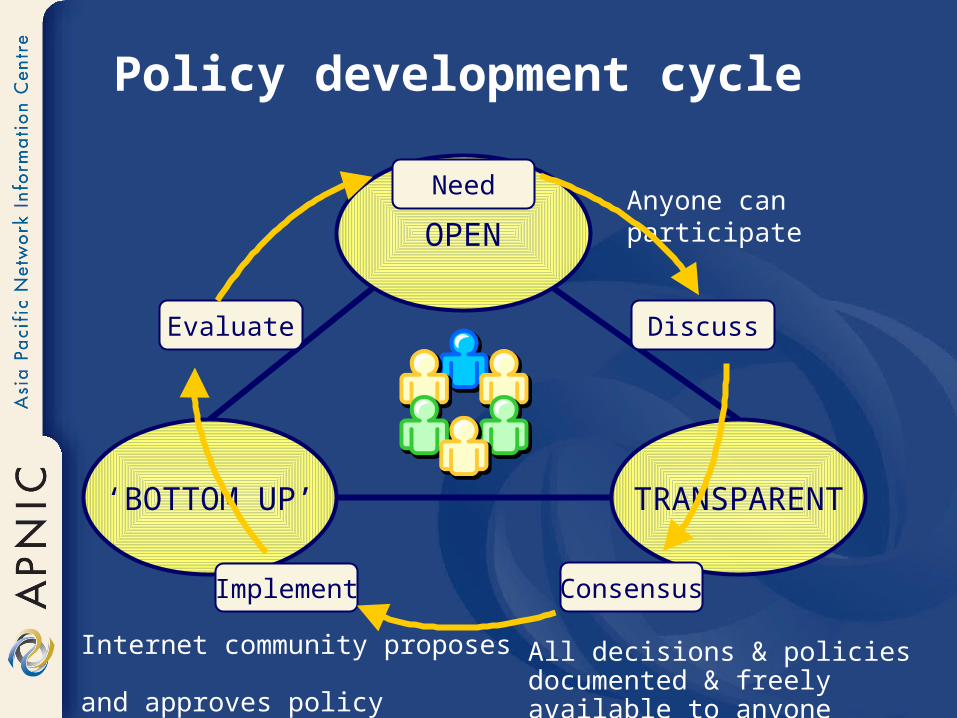
Policy development cycle
OPEN
TRANSPARENT‘BOTTOM UP’
Anyone can participate
All decisions & policies documented & freely available to anyone
Internet community proposes and approves policy
Need
DiscussEvaluate
Implement Consensus

Elements of the process
MemberMeeting
Working Groups
Birds of a Feather
Special InterestGroups
Open Policy Processes
SIGs: Formal groups which discuss broad areas of policy relevant to the APNIC internet community BOFs: Informal meetings to
exchange ideas eg. CA BOF, Network Abuse BOF, Training Need to hold at least one to form new SIG
WGs: semi formal, volunteer group tasked by a SIG to work on a particular project until completed eg. ‘Broadband’
MM: forum specific to APNIC business eg. fee structure, election of executive council & endorsement of policy decisions

Policy development in practice
New policy or amendment proposed
Endorsement by MM?
Report of consensus in SIG to MM
Consensus?
Implementation 3 months
Posted to SIG ML for discussion
Face to face discussions in public open forum (SIGs)
YES
YES
NO
NO

How to make your voice heard
• Contribute on the public mailing lists– http://www.apnic.net/community/lists
• Attend meetings– Or send a representative– Gather input at forums
• Give feedback– Training or seminar events

Come to the APNIC meeting!
Next meeting in conjunction with
APRICOT 2004Kuala Lumpur, Malaysia, 18-27 February 2004
• Participate in policy development• Attend workshops, tutorials & presentations• Exchange knowledge and information with peers• Stay abreast with developments in the Internet• View multicast online• Provide your input in matters important to you
http://www.apnic.net/meetings/

Questions ?