Embed Size (px)
Citation preview

INTERNATIONAL TRADE IN A DIGITAL AGE CHAPTER 7
Asia-Pacific Trade and Investment Report 2016 − 103
7CHAPTER
INTERNATIONAL TRADE IN A DIGITAL AGEDigital technology is shaping the future of global trade and investment. One aspect of the adoption of digital technology by global exporters and importers is the purchase and sale of goods and services online, which is part of what is broadly understood as “e-commerce”. The use of automated data exchange systems, cloud computing, big data and open source operating systems can help businesses run international supply chain management more efficiently. However, the use of digital technology in trade activities can, in fact, go beyond online buying/selling; in this chapter, the term “digital trade” refers to the use of digital technologies to facilitate businesses without limiting it to just online sales or purchases.

104 − Recent Trends and Developments
The impact of digital technology on global trade has attracted public attention worldwide with the discussions mainly focused on online sales. The rising importance of digital trade was already noted by international organizations in the late 1990s. For example, in 1999, UNCTAD stated that “electronic commerce has the potential to be a major engine for trade and development on the global scale” (UNCTAD, 1999, p. 1). WTO work in the same period stated that “the value of electronic commerce has catapulted from virtually zero to a predicted $300 billion in the 10 years up to the turn of the century” (WTO, 1998, p. 1). A decade later, OECD (2012) indicated that more than 95% of all companies in OECD countries use Internet in doing their business. According to the most recent estimates made by UNCTAD (2016a), “e-commerce includes both business-to-business (B2B) and business-to-consumer (B2C), valued respectively at around $19.9 trillion and $2.2 trillion each...This trade is mostly domestic, but is becoming more and more international.”
Despite worldwide recognition of its importance, there are no official statistics on e-commerce or digital trade. Without proper valuation, there is also an absence of systematic discussion that can lend to evidence-based policy formulation in digital trade issues. Existing studies, mainly based on private data sources, are difficult to generalize because the data are often not comparable across countries, and are subject to variation in definitions and collection methods. Relative to the OECD countries, the dearth of data and analysis on digital trade issues is especially evident in developing countries. Without an internationally comparable measurement of digital trade, key questions for proper policy design and regulation remain unanswered. For example, “how large is cross-border e-commerce in comparison with domestic e-commerce?”, “which sectors are involved in digital trade?”, “how is the economy performing under these modern business models?”, or “what does a digital value chain look like?”
Using the official statistics available, this chapter aims to contribute towards closing the knowledge gap by highlighting major trends and policy implications within cross-border digital trade. In doing so, it also focuses on a factual exploration of digital trade at the global and Asia-Pacific levels.
The chapter comprises four sections. Section A provides an overview of how digital technology has affected global trade. Section B highlights issues related to quantitative assessment and proposes an analytical framework that can be used to estimate
relevant indicators for digital trade. Section C applies the framework with international statistics in order to provide a preliminary assessment of digital trade at the global and Asia-Pacific levels. Assuming that digital trade is becoming the mainstream of global trade in the future, section D suggests some recommendations for building supportive environment for the digital age of global trade. Although main policy implications are considered, recommending comprehensive policy actions is beyond the scope of the chapter.
A. BACKGROUND OF DIGITALIZATION OF TRADE
Underlying the rapid growth in digital trade is the revolution in computer and software technology, telecommunications technology and the expansion of Internet access. Since the mid-2000s, Internet access has greatly increased globally. According to the United States International Trade Commission (2013), while only 5.9% of the world’s population had Internet access in 2000, the number had grown to an estimated 34.3% by 2012. Internet access has expanded greatly, both in developed and developing economies. For example, the Internet penetration rate, which is measured by the share of Internet users in total population, more than doubled from 37.3% in Japan and 33.8% in the United States of America to 79.5% and 78.1%, respectively, during 2000 to 2012 (USITC, 2013). However, it is in emerging economies, such as Brazil, China and India, where Internet penetration has rocketed from 2.9%, 1.8%, 0.5%, respectively, to 45.6%, 40.1% and 11.4% (USITC, 2013).
According to the International Telecommunications Union (2013), 2.3 billion people have access to the Internet and this figure is expected to grow to 5 billion by 2020. For Asia and the Pacific, the growth of ICT connectivity over the past decade has been leading the world average. A report prepared by ESCAP (2016a), reveals that more than 52.3% of the global fixed broadband subscribers are in the Asia-Pacific region; however, this impressive number is mainly driven by China and a few countries in East and North-East Asia (ESCAP, 2016).1 Online connectivity has been greatly improved as a result of the increase in mobile telephones and social media activity, and the deployment of national and international fibre-optic networks (UNCTAD, 2015). As Internet accessibility expands, trade transactions are moving from physical interactions between sellers and buyers, to cyberspace – with the marketplace being based on online activities without requiring direct interactions.
INTERNATIONAL TRADE IN A DIGITAL AGE CHAPTER 7
Asia-Pacific Trade and Investment Report 2016 − 105
For example, the virtual marketplace has proliferated in forms of websites and through the use of social media such as eBay and Craigslist. In this process, the widespread lowering cost of mobile phones and tablets has been an important means for digital trade, especially in developing countries (UNCTAD, 2015).
According to OECD (2012), the number of mobile phone subscriptions worldwide has more than doubled since 2005 and tripled in non-OECD countries. According to Ahmed and Andolas (2015, p. 1), mobile devices “will account for four out of five broadband connections by 2016”. The latest statistics, released in June 2016 by ITU, indicate that the global mobile-broadband penetration rate was 49.4% while the penetration rate of fixed broadband was only 11.9%. The expansion of mobile broadband, in particular, is reducing the digital gap for developing economies whose access to fixed-broadband (8.2%) is much more limited than access to mobile broadband (40.9%). Therefore, it is not surprising that a survey by Fedrikkson (2013) found that 90% of online consumers in Latin America use smartphones to do online shopping. In China, “almost half of all online shopping is carried out on smartphones” (Wilson, 2016). Similarly, the survey by USITC (2013, p. 12) showed that “portability and wireless broadband, particularly when accessed via tablets, were key drivers of the increase in United States demand for digital content”.
While the development of ICT hardware and infrastructure contributed greatly to the expansion of digital trade in the past decade, new ways of using technology and the information it generates, including big data, social networking and cloud computing, has increasingly become an important element of digital trade. Social networks, such as Facebook and Twitter, have become a standard means of communication between businesses and consumers.
B. TOWARDS THE QUANTITATIVE ASSESSMENT OF DIGITAL TRADE
1. Problems in measuring digital trade
Apart from the comprehensive quantitative analysis of digital trade in the United States by USITC (2013), there are few studies for other markets. The reasons behind this void in quantitative analysis are linked to limited data on digital trade or even e-commerce specifically. As noted by UNCTAD (2015, p. 12), “only a few countries – mainly developed ones – compile data on e-commerce revenue.” The work on ICT for development done in partnership between UNCTAD
and ITU suggest core indicators of digital trade; however, the indicators that measure the readiness of countries to engage in digital trade do not lend themselves well to measuring the value of such transactions. The problem is compounded when trying to separate domestic and cross-border digital trade. Without official statistics, previous studies have generally been based on private data sources, followed varying methodologies, and have limited geographical coverage (mainly OECD countries).
In trying to measure e-commerce, UNCTAD (2015) categorizes e-commerce into four types based on electronic relationships between governments, enterprises and consumers: (a) B2B (business-to-business); (b) B2C (business-to-consumer); (c) B2G (business-to-government); and C2C (consumer-to-consumer). Among these categories, B2B – which is the digital trade between businesses, such as between a wholesaler to a retailer – is dominant (UNCTAD, 2015; Asian Development Bank, 2015). An estimate of worldwide B2B e-commerce amounted to $19.9 trillion in 2015 and for global B2C about $2.2 trillion (UNCTAD, 2016a), while estimates for the e-commerce of the other categories are not available. The Asian Development Bank estimated that B2B transactions accounted for 90% of total e-commerce transaction value in Asia (ADB, 2015).
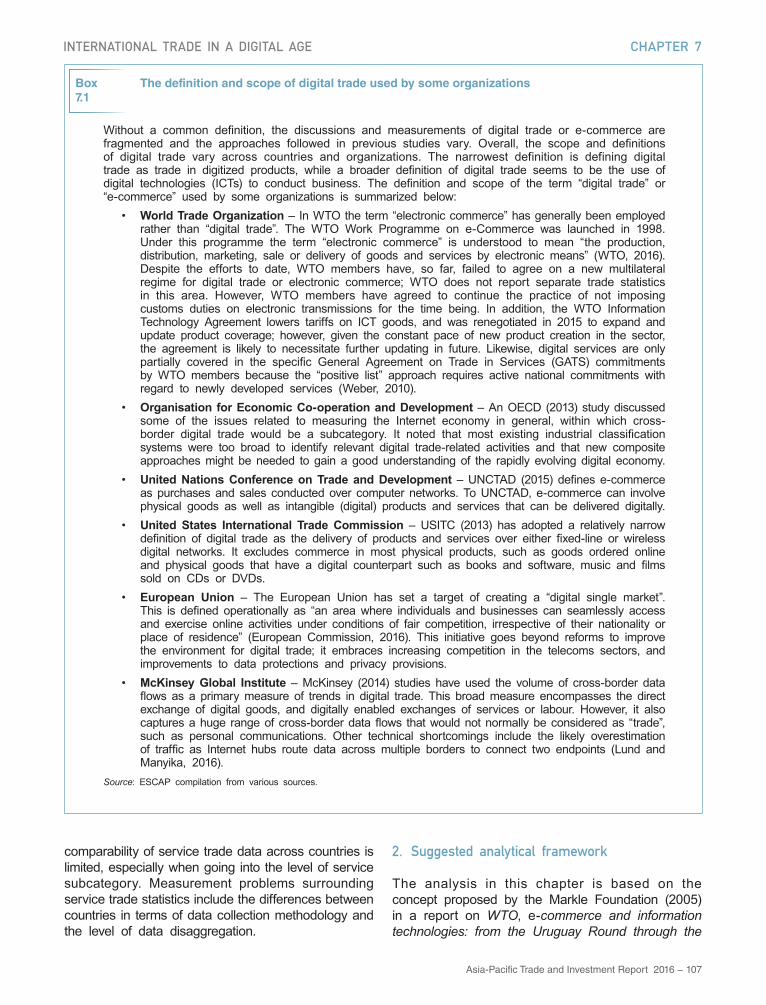
However, these estimates are based on limited data and depend very much on the method of measurement. Despite accounting for a smaller share in total digital trade globally, the previous studies used estimates based on B2C e-commerce statistics (such as online shopping) to discuss trends and developments in digital trade due to the fact that data on B2C are relatively more available. Overall, it is estimated that B2C e-commerce is growing faster than B2B, and with Asia and the Pacific seemingly growing faster than the rest of the world (UNCTAD, 2016b). Figure 7.1 shows the values of the B2C e-commerce index provided by UNCTAD for selected Asia-Pacific countries. It is important to note that indices such as this one measure e-commerce readiness from the capability or infrastructure perspective, and not actual trade flows. Even so, information is useful especially for countries aiming at strengthening their e-commerce enabling infrastructure.
Despite those efforts, there is still no official definition of e-commerce, which makes it difficult to do a cross-country analysis on digital trade (box 7.1). Instead, there are various working definitions of e-commerce, which may result in different value and growth rate estimates. For example, WTO (1998, p. 1) defined

106 − Recent Trends and Developments
Figure7.1
UNCTAD B2C E-commerce Index, 2016
Source: UNCTAD (2016b).
0
10
20
30
40
50
60
70
80
90
100Ja
pan
Rep
ublic
of K
orea
New
Zea
land
Aus
tralia
Sin
gapo
re
Mal
aysi
a
Rus
sian
Fed
erat
ion
Turk
ey
Aze
rbai
jan
Chi
na
Thai
land
Vie
t Nam
Isla
mic
Rep
ublic
of I
ran
Geo
rgia
Arm
enia
Kaz
akhs
tan
Phi
lippi
nes
Indi
a
Sri
Lank
a
Indo
nesi
a
Mon
golia
Bhu
tan
Pak
ista
n
Uzb
ekis
tan
Kyr
gyzs
tan
Lao
PD
R
Nep
al
Cam
bodi
a
Ban
glad
esh
Afg
hani
stan
Mya
nmar
e-commerce as “the production, advertising, sale and distribution of products via telecommunication networks”. OECD (2013) defined e-commerce as “the sale or purchase of goods or services, conducted over computer networks specifically designed for the purpose of receiving or placing of order. The goods or services are ordered by those methods, but the payment and the ultimate delivery of the goods or services do not have to be conducted online”. UNCTAD (2015, p. 3) defined e-commerce as “purchases and sales conducted over computer networks, using multiple formats and devices, including the web and electronic data interchange, using personal computers, laptops, tablets and mobile phones of varying levels of sophistication. E-commerce can involve physical goods as well as intangible (digital) products and services that can be delivered digitally”.
Digital trade also has implications for the improvement of existing systems of international trade statistics. One aspect of this is the need for the improvement of trade statistics to catch up with the fundamental changes in trade. The growing digitalization of trade is blurring the boundary between trade in goods and trade in services. For example, the digital purchase and delivery of books, films or music have increasingly replaced physical transactions. In some manufacturing industries, 3-D printing is transforming the shipment of physical goods into the online transfer of a digital
file that can be used to produce the good at its point of consumption. Digitization in trade has also turned part of non-tradeable services to become tradeable. For example, most of the medical and educational services were previously seen as difficult to trade across borders but today are almost a standard part of tradeables taking the form of Telehealth or online courses.
Current international trade statistics has not been able to track digital trade properly. The need for service trade statistics at the disaggregated level has become greater than ever. For example, trade in products that can be digitized is increasingly shifting from trade in physical products such as DVD books or films to trade in services such as in the subcategory of personal and recreational services. In addition, conducting digital trade depends on inputs from computer and information services, telecommunications services, and professional services such as web design, data engineers, IT professionals etc. Unfortunately, tracking trade in services is highly limited due to the lack of comprehensive data. For example, unlike statistics on trade in goods, there are still no official statistics providing bilateral trade in services. Data on international trade in services is available for broad categories under the sixth edition of the IMF Balance of Payments and International Investment Position Manual (BPM6) from the WTO database.2 However,
INTERNATIONAL TRADE IN A DIGITAL AGE CHAPTER 7
Asia-Pacific Trade and Investment Report 2016 − 107
comparability of service trade data across countries is limited, especially when going into the level of service subcategory. Measurement problems surrounding service trade statistics include the differences between countries in terms of data collection methodology and the level of data disaggregation.
Box7.1
The definition and scope of digital trade used by some organizations
Without a common definition, the discussions and measurements of digital trade or e-commerce are fragmented and the approaches followed in previous studies vary. Overall, the scope and definitions of digital trade vary across countries and organizations. The narrowest definition is defining digital trade as trade in digitized products, while a broader definition of digital trade seems to be the use of digital technologies (ICTs) to conduct business. The definition and scope of the term “digital trade” or “e-commerce” used by some organizations is summarized below:
• World Trade Organization – In WTO the term “electronic commerce” has generally been employed rather than “digital trade”. The WTO Work Programme on e-Commerce was launched in 1998. Under this programme the term “electronic commerce” is understood to mean “the production, distribution, marketing, sale or delivery of goods and services by electronic means” (WTO, 2016). Despite the efforts to date, WTO members have, so far, failed to agree on a new multilateral regime for digital trade or electronic commerce; WTO does not report separate trade statistics in this area. However, WTO members have agreed to continue the practice of not imposing customs duties on electronic transmissions for the time being. In addition, the WTO Information Technology Agreement lowers tariffs on ICT goods, and was renegotiated in 2015 to expand and update product coverage; however, given the constant pace of new product creation in the sector, the agreement is likely to necessitate further updating in future. Likewise, digital services are only partially covered in the specific General Agreement on Trade in Services (GATS) commitments by WTO members because the “positive list” approach requires active national commitments with regard to newly developed services (Weber, 2010).
• Organisation for Economic Co-operation and Development – An OECD (2013) study discussed some of the issues related to measuring the Internet economy in general, within which cross-border digital trade would be a subcategory. It noted that most existing industrial classification systems were too broad to identify relevant digital trade-related activities and that new composite approaches might be needed to gain a good understanding of the rapidly evolving digital economy.
• United Nations Conference on Trade and Development – UNCTAD (2015) defines e-commerce as purchases and sales conducted over computer networks. To UNCTAD, e-commerce can involve physical goods as well as intangible (digital) products and services that can be delivered digitally.
• United States International Trade Commission – USITC (2013) has adopted a relatively narrow definition of digital trade as the delivery of products and services over either fixed-line or wireless digital networks. It excludes commerce in most physical products, such as goods ordered online and physical goods that have a digital counterpart such as books and software, music and films sold on CDs or DVDs.
• European Union – The European Union has set a target of creating a “digital single market”. This is defined operationally as “an area where individuals and businesses can seamlessly access and exercise online activities under conditions of fair competition, irrespective of their nationality or place of residence” (European Commission, 2016). This initiative goes beyond reforms to improve the environment for digital trade; it embraces increasing competition in the telecoms sectors, and improvements to data protections and privacy provisions.
• McKinsey Global Institute – McKinsey (2014) studies have used the volume of cross-border data flows as a primary measure of trends in digital trade. This broad measure encompasses the direct exchange of digital goods, and digitally enabled exchanges of services or labour. However, it also captures a huge range of cross-border data flows that would not normally be considered as “trade”, such as personal communications. Other technical shortcomings include the likely overestimation of traffic as Internet hubs route data across multiple borders to connect two endpoints (Lund and Manyika, 2016).
Source: ESCAP compilation from various sources.
2. Suggested analytical framework
The analysis in this chapter is based on the concept proposed by the Markle Foundation (2005) in a report on WTO, e-commerce and information technologies: from the Uruguay Round through the

108 − Recent Trends and Developments
Doha Development Agenda, prepared for the United Nations ICT Task Force. The report, which gives an overview and discusses how WTO members can apply the WTO rules-based trading system to promote the development of the physical, human and legal infrastructure for e-commerce, suggests that discussions on policy issues in digital trade should consider four groups:
(a) Group 1 – Digital-infrastructure goods, i.e. IT goods providing hardware to conduct digital trade. Examples include computers, network devices, mobile phones, etc. that are the part of physical infrastructure needed to conduct digital trade. The Markle Foundation (2005) suggests that products under the Information Technology Agreement (ITA) can be a representation of this group;
(b) Group 2 – Digital-infrastructure services, i.e. services providing virtual infrastructure for conducting digital trade. According to the Markle Foundation (2005), these include basic and value-added telecommunications services, and computer and related services;
(c) Group 3 Digitized products – “Content” products, such as software, books, music, films and games that can be traded in a physical form on a carrier medium such as video tape or CDs, but are now traded electronically via the Internet and which may then fall into the services category, such as personal cultural and recreational services.3
(d) Group 4 – Electronically enabled service, which cover services that have adopted digital technologies to sell e-services. This is a large category because most services nowadays have adopted digital technologies and are selling e-services to varying degrees.4
The data analysis in this chapter follows the framework shown in figure 7.2. The first part of the quantitative analysis is looking at the digital intensity of exports at the global and Asia-Pacific levels. As there is no direct measure of this intensity, this chapter uses the share of services that are digital infrastructure (computer and related services, and telecommunication services) embedded in exports of a country as a proxy.5 These services are highly relevant to digital technology and digital trade. For example, the emergence of Internet telephone and other Internet services such as e-mail, video conferencing etc., in particular, have enhanced and accelerated the developments of digital trade. Voice-over Internet Protocol (VoIP) has generated a surge in global cross-border telephone calls. Cross-border computer-to-computer Skype-calling has generated a torrent of cross-border data flows. People and companies are using digital and mobile connections to share ideas, collaborate and make social connections. These platforms range from e-commerce sites, including Amazon, Alibaba and Airbnb, to the G-Cloud of the Government of the United Kingdom, which provide electronic channels of distribution to small businesses providers of goods and service.
This analysis relies on an input-output approach to the classification of the analytical framework (figure 7.2). The data source is the OECD-WTO Trade in Value-Added (TiVA) database (October 2015 version).6 Where relevant, international statistics on trade in services and goods have been used. Data on international trade in services are from the WTO database under the sixth edition of the IMF Balance of Payments and International Investment Position Manual (BPM6).7 Data on trade in goods are based on HS classifications from the United Nations COMTRADE database which are available from the World Bank World Integrated Trade Solution (WITS) platform.
Figure7.2
Analytical framework
11
C. PRELIMINARY ESTIMATES OF ELECTRONIC CONTENT IN EXPORTS BY
ASIA AND THE PACIFIC
1. Digital technology used by Asia-Pacific exporters
Measured by the share of telecommunications8 and computer-related services embedded in total
exports there is a rise in digital intensity in total exports at the global and Asia-Pacific levels.
The value added by telecommunications and computer-related services in world exports grew
by 8.8% annually from 1995 to 2011.9 The growth rate is higher than the growth of world gross
exports of 7.6% during the same period, causing the share of value-added by
telecommunications and computer-related services in total export value to increase from 2.7%
in 1995 to 3.3% in 2011. Similar to the global trend, the share of value added by
telecommunications and computer-related services in total exports of Asia and the Pacific
economies increased from 2.1% in 1995 to 2.6% in 2011.10 The smaller share in the Asia-
Pacific region’s exports compared with world exports, which may also be related to the lack of
ICT infrastructure in the region as pointed out in ESCAP (2016b). It indicates that the region
still has a great deal of latent potential for expanding the use of digital technology. Although
developing Asia-Pacific economies are still considered to be latecomers to digital trade, they
are catching up rapidly. The value of telecommunications and computer-related services rooted
in total exports by the Asia-Pacific region grew by 11.1% annually from 1995 to 2011, while
that of non-Asia-Pacific exporters was only 7.9%. Specifically, the use of computer technology
Overview of digital intensity of global and Asia-‐Pacific exporters
Digital-‐intensity of exports is proxied by the share of IT infrastructure services in exports
Key data: value-‐added by telecomunicaBon services and computer-‐related services in
exports
Trade enabled by digital technology
Trade enabled by digital technology includes trade in products that can be digiBzed and trade in electronically enabled services
Key data: trade in goods and services related to soDware and media products
Trade in digital infrastructure goods and services
Trade in digital infrastructure covers trade in IT goods and services
Key data : trade in goods under ITA and trade in value-‐added of telecommunicaBon services and
computer-‐related services

INTERNATIONAL TRADE IN A DIGITAL AGE CHAPTER 7
Asia-Pacific Trade and Investment Report 2016 − 109
C. PRELIMINARY ESTIMATES OF ELECTRONIC CONTENT IN EXPORTS BY ASIA AND THE PACIFIC
1. Digital technology used by Asia-Pacific exporters
Measured by the share of telecommunications8 and computer-related services embedded in total exports there is a rise in digital intensity in total exports at the global and Asia-Pacific levels. The value added by telecommunications and computer-related services in world exports grew by 8.8% annually from 1995 to 2011.9 The growth rate is higher than the growth of world gross exports of 7.6% during the same period, causing the share of value-added by telecommunications and computer-related services in total export value to increase from 2.7% in 1995 to 3.3% in 2011. Similar to the global trend, the share of value added by telecommunications and computer-related services in total exports of Asia and the Pacific economies increased from 2.1% in 1995 to 2.6% in 2011.10 The smaller share in the Asia-Pacific region’s exports compared with world exports, which may also be related to the lack of ICT infrastructure in the region as pointed out in ESCAP (2016b). It indicates that the region still has a great deal of latent potential for expanding the use of digital technology. Although developing Asia-Pacific economies are still considered to be latecomers to digital trade, they are catching up rapidly. The value of telecommunications and computer-related services rooted in total exports by the Asia-Pacific region grew by 11.1% annually from 1995 to 2011, while that of
Figure7.3
World exports of goods that can be digitized, 1996-2014
Source: ESCAP calculation using data from United Nations COMTRADE downloaded from WITS, accessed August 2016.
non-Asia-Pacific exporters was only 7.9%. Specifically, the use of computer technology by exporters in the Asia-Pacific region grew quickly at 14.6% per year, while the growth rate was only 11.1% for exports by the rest of the world.
2. Trade enabled by digital technology
The advancement of Internet and computer technologies has directly transformed the patterns of trade in goods that can be digitized. Goods that can be digitized are essentially software and media products, including films, various types of printed materials, video games and various types of recorded information on carrier media.11 Cross-border merchandise trade in products that can be digitized was equivalent to 0.3% of world merchandise trade in 2014. Exports of printed books accounted for nearly half of this number (figure 7.3). Based on merchandise trade data, exports by Asia-Pacific economies account for about 30% of world exports of products that can be digitized. China dominates the region’s exports of games and printed books, while Singapore leads the region’s exports of software and sound media. The major Asia-Pacific exporter of films is Japan, followed by the Republic of Korea.
However, part of the declining merchandise trade value of goods that can be digitized after the peak in 2008 was replaced by the potential growth of trade in their digital counterparts. Digital downloads of these products (films, sound media, software etc.) may be classified as part of trade in services,
-
10
20
30
40
50
60
70
80
1996
1997
1998
1999
2000
2001
2002
2003
2004
2005
2006
2007
2008
2009
2010
2011
2012
2013
2014
Bill
ions
of U
nite
d S
tate
s do
llars
Films Games Software Sound media Printed materials
110 − Recent Trends and Developments
such as under the personal and recreational service subcategory. The change in trade classification has led to the interpretation of merchandise trade data for those products to potentially be misleading. For example, software trade has not been reported under merchandise trade for many countries since 2006. In addition, switching towards digital downloads may be a factor in explaining why merchandise exports of films by Japan were three times larger than the export of the same item from the United States (considering its strong motion picture industry) in 2014.
Using statistics on trade in services shows that the value of world exports of personal and recreational services increased steadily from $25 billion to $40 billion between 2006 and 2015. This suggests that the underestimation of trade in products that can be digitized is far beyond 50% of the value based on the merchandise statistics above.
Yet analysis using trade statistics for services is not fully possible due to complicated issues in recording those transactions. For example, an intuitive way of thinking about digital trade in books, films or music tends to be in terms of transactions that an individual might make in purchasing an e-book, film or sound recording from an online store or in subscribing to a service that provides on-demand access to a catalogue of printed materials, films or music. However, those types of transactions may not be registered as cross-border transactions due to the geographically-specific intellectual property rights protection of the content. There will only be the exchange of money from a firm in the importing country to a firm in the exporting country for the right to sell content that is protected by intellectual property laws in a given geographical area, but not the value of the e-product delivered to consumers in the importing countries. Furthermore, services trade statistics appear to be patchy across countries. For example, some countries report trade in computer-related information and telecommunication services while a number of countries still report only business services in general but not the data on those service subcategories.
Digital technology does not only affect trade in personal, cultural and recreational services; the supply of most services has also been affected. For example, in the tourism industry, booking and payment for airline tickets, hotels, tours etc. are increasingly carried out over the Internet. Electronic banking and online insurance provision have taken an important share of the financial and insurance services. Professional services, such as accounting, legal or medical, are
increasingly based on Internet-based communications; news services transmitted by digital networks, together with Internet telephone, e-mail, voice mail etc., constitute a majority of the communication services provided. Furthermore, in the sectors where the supply of certain services across borders appear to be unfeasible, digital technology has allowed new forms of supply, such as Telehealth.12 As the scope of Internet-enabled services is large, it then follows that cross-border trade in these sectors accounts for 88% or more of total world trade in commercial services. Digital technology is having an increasing impact on those services, but measuring it remains difficult. As explained above, the best that can be achieved is some estimation or approximation of the digital intensity of exports by using the proxy based on trade in value-added data. Therefore, any impact analysis is bound to be biased by having no exact data on the digital content in overall trade flows.
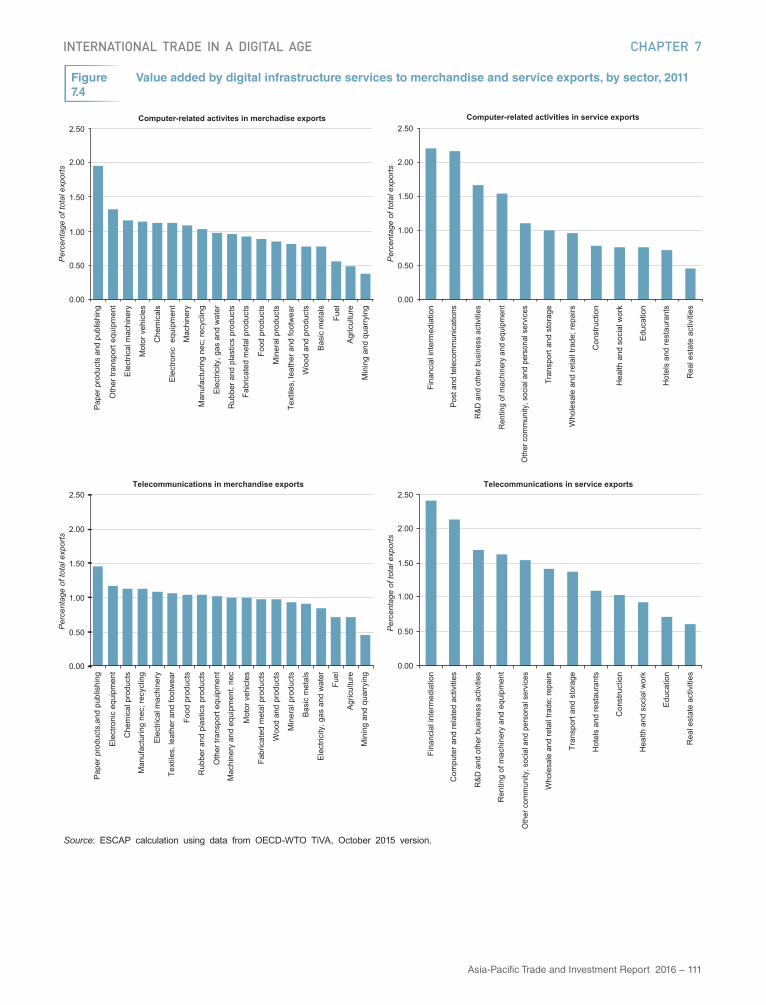
Trade in value-added data indicates that the growth of digital trade has a relatively stronger impact on service trade than merchandise trade. Measured by the use of computers and telecommunication services in export value addition, digital technology in general plays a larger role in the export of services than in the export of goods (figure 7.4). Among others, the sectors with high digital intensity include financial services (for example, Internet banking, although it is not possible to say how much of it is cross-border), telecommunication services, research and development and business services, and renting of machinery and equipment (car rental services etc.). In the case of exports of goods, the publishing industry – which involves digital trade of e-books, e-magazines, online newspapers etc. – has the highest degree of digital intensity. It is followed by relatively high-tech industries that use digital and telecommunication technologies to facilitate their operations and participation in global value chains (e.g. chemical products, computer equipment, and electrical machinery and transport machinery.
Education services lead the way in terms of the speed of growth of digital content in the exports by Asia and the Pacific. The increase of digital content in educational exports by Asia and the Pacific was nearly 200% from 1995 to 2011 (figure 7.5). Overall, there are 11 Asia-Pacific industries where the digital content in exports more than doubled from 1995 to 2011. For non-Asia-Pacific economies, it appears that the rate of digitization is relatively slower except in the case of printing, telecommunications and machinery-renting businesses.
INTERNATIONAL TRADE IN A DIGITAL AGE CHAPTER 7
Asia-Pacific Trade and Investment Report 2016 − 111
Figure7.4
Value added by digital infrastructure services to merchandise and service exports, by sector, 2011
Source: ESCAP calculation using data from OECD-WTO TiVA, October 2015 version.
0.00
0.50
1.00
1.50
2.00
2.50
Pape
r pro
duct
s an
d pu
blis
hing
Oth
er tr
ansp
ort e
quip
men
t
Ele
ctric
al m
achi
nery
Mot
or v
ehic
les
Che
mic
als
Ele
ctro
nic
equ
ipm
ent
Mac
hine
ry
Man
ufac
turin
g ne
c; re
cycl
ing
Ele
ctric
ity, g
as a
nd w
ater
Rub
ber a
nd p
last
ics
prod
ucts
Fabr
icat
ed m
etal
pro
duct
s
Food
pro
duct
s
Min
eral
pro
duct
s
Text
iles,
leat
her a
nd fo
otw
ear
Woo
d an
d pr
oduc
ts
Bas
ic m
etal
s
Fuel
Agr
icul
ture
Min
ing
and
quar
ryin
g
Computer-related activites in merchadise exports
0.00
0.50
1.00
1.50
2.00
2.50
Fina
ncia
l int
erm
edia
tion
Post
and
tele
com
mun
icat
ions
R&D
and
oth
er b
usin
ess
activ
ities
Ren
ting
of m
achi
nery
and
equ
ipm
ent
Oth
er c
omm
unity
, soc
ial a
nd p
erso
nal s
ervi
ces
Tran
spor
t and
sto
rage
Who
lesa
le a
nd re
tail
trade
; rep
airs
Con
stru
ctio
n
Hea
lth a
nd s
ocia
l wor
k
Edu
catio
n
Hot
els
and
rest
aura
nts
Rea
l est
ate
activ
ities
Computer-related activities in service exports
0.00
0.50
1.00
1.50
2.00
2.50
Pap
er p
rodu
cts,
and
publ
ishi
ng
Ele
ctro
nic
equi
pmen
t
Che
mic
al p
rodu
cts
Man
ufac
turin
g ne
c; re
cycl
ing
Ele
ctric
al m
achi
nery
Text
iles,
leat
her a
nd fo
otw
ear
Food
pro
duct
s
Rub
ber a
nd p
last
ics
prod
ucts
Oth
er tr
ansp
ort e
quip
men
t
Mac
hine
ry a
nd e
quip
men
t, ne
c
Mot
or v
ehic
les
Fabr
icat
ed m
etal
pro
duct
s
Woo
d an
d pr
oduc
ts
Min
eral
pro
duct
s
Bas
ic m
etal
s
Ele
ctric
ity, g
as a
nd w
ater
Fuel
Agr
icul
ture
Min
ing
and
quar
ryin
g
Telecommunications in merchandise exports
0.00
0.50
1.00
1.50
2.00
2.50
Fina
ncia
l int
erm
edia
tion
Com
pute
r and
rela
ted
activ
ities
R&D
and
oth
er b
usin
ess
activ
ities
Ren
ting
of m
achi
nery
and
equ
ipm
ent
Oth
er c
omm
unity
, soc
ial a
nd p
erso
nal s
ervi
ces
Who
lesa
le a
nd re
tail
trade
; rep
airs
Tran
spor
t and
sto
rage
Hot
els
and
rest
aura
nts
Con
stru
ctio
n
Hea
lth a
nd s
ocia
l wor
k
Edu
catio
n
Rea
l est
ate
activ
ities
Telecommunications in service exports
Per
cent
age
of to
tal e
xpor
tsP
erce
ntag
e of
tota
l exp
orts
Per
cent
age
of to
tal e
xpor
tsP
erce
ntag
e of
tota
l exp
orts
0.00
0.50
1.00
1.50
2.00
2.50
Pape
r pro
duct
s an
d pu
blis
hing
Oth
er tr
ansp
ort e
quip
men
t
Ele
ctric
al m
achi
nery
Mot
or v
ehic
les
Che
mic
als
Ele
ctro
nic
equ
ipm
ent
Mac
hine
ry
Man
ufac
turin
g ne
c; re
cycl
ing
Ele
ctric
ity, g
as a
nd w
ater
Rub
ber a
nd p
last
ics
prod
ucts
Fabr
icat
ed m
etal
pro
duct
s
Food
pro
duct
s
Min
eral
pro
duct
s
Text
iles,
leat
her a
nd fo
otw
ear
Woo
d an
d pr
oduc
ts
Bas
ic m
etal
s
Fuel
Agr
icul
ture
Min
ing
and
quar
ryin
g
Computer-related activites in merchadise exports
0.00
0.50
1.00
1.50
2.00
2.50
Fina
ncia
l int
erm
edia
tion
Post
and
tele
com
mun
icat
ions
R&D
and
oth
er b
usin
ess
activ
ities
Ren
ting
of m
achi
nery
and
equ
ipm
ent
Oth
er c
omm
unity
, soc
ial a
nd p
erso
nal s
ervi
ces
Tran
spor
t and
sto
rage
Who
lesa
le a
nd re
tail
trade
; rep
airs
Con
stru
ctio
n
Hea
lth a
nd s
ocia
l wor
k
Edu
catio
n
Hot
els
and
rest
aura
nts
Rea
l est
ate
activ
ities
Computer-related activities in service exports
0.00
0.50
1.00
1.50
2.00
2.50
Pap
er p
rodu
cts,
and
publ
ishi
ng
Ele
ctro
nic
equi
pmen
t
Che
mic
al p
rodu
cts
Man
ufac
turin
g ne
c; re
cycl
ing
Ele
ctric
al m
achi
nery
Text
iles,
leat
her a
nd fo
otw
ear
Food
pro
duct
s
Rub
ber a
nd p
last
ics
prod
ucts
Oth
er tr
ansp
ort e
quip
men
t
Mac
hine
ry a
nd e
quip
men
t, ne
c
Mot
or v
ehic
les
Fabr
icat
ed m
etal
pro
duct
s
Woo
d an
d pr
oduc
ts
Min
eral
pro
duct
s
Bas
ic m
etal
s
Ele
ctric
ity, g
as a
nd w
ater
Fuel
Agr
icul
ture
Min
ing
and
quar
ryin
g
Telecommunications in merchandise exports
0.00
0.50
1.00
1.50
2.00
2.50
Fina
ncia
l int
erm
edia
tion
Com
pute
r and
rela
ted
activ
ities
R&D
and
oth
er b
usin
ess
activ
ities
Ren
ting
of m
achi
nery
and
equ
ipm
ent
Oth
er c
omm
unity
, soc
ial a
nd p
erso
nal s
ervi
ces
Who
lesa
le a
nd re
tail
trade
; rep
airs
Tran
spor
t and
sto
rage
Hot
els
and
rest
aura
nts
Con
stru
ctio
n
Hea
lth a
nd s
ocia
l wor
k
Edu
catio
n
Rea
l est
ate
activ
ities
Telecommunications in service exports
Per
cent
age
of to
tal e
xpor
tsP
erce
ntag
e of
tota
l exp
orts
Per
cent
age
of to
tal e
xpor
tsP
erce
ntag
e of
tota
l exp
orts

112 − Recent Trends and Developments
Figure7.5
Change in the share of digital content in exports, by sector, 1995 to 2011
Source: ESCAP calculation using data from OECD-WTO TiVA, October 2015 version.Note: Digital content in exports is proxied by the share of value-added by computer and related services.
0.0
50.0
100.0
150.0
200.0
250.0E
duca
tion
Pul
p, p
aper
, pap
er p
rodu
cts,
...
Text
iles,
text
ile p
rodu
cts,
...
Woo
d an
d pr
oduc
ts o
f woo
d...
Rea
l est
ate
activ
ities
Rub
ber a
nd p
last
ics
prod
ucts
Oth
er n
on-m
etal
lic m
iner
al...
Ren
ting
of m
achi
nery
and
...
Mot
or v
ehic
les,
trai
lers
and
...
Hot
els
and
rest
aura
nts
Food
pro
duct
s, b
ever
ages
and
...
Min
ing
and
quar
ryin
g
Pos
t and
tele
com
mun
icat
ions
Con
stru
ctio
n
Agr
icul
ture
, hun
ting,
fore
stry
...
Who
lesa
le a
nd re
tail
trade
;...
Oth
er tr
ansp
ort e
quip
men
t
Fabr
icat
ed m
etal
pro
duct
s
Mac
hine
ry a
nd e
quip
men
t, ne
c
Tran
spor
t and
sto
rage
Bas
ic m
etal
s
Ele
ctric
al m
achi
nery
and
...
Che
mic
als
and
chem
ical
Oth
er c
omm
unity
, soc
ial a
nd...
Com
pute
r, E
lect
roni
c an
d...
R&
D a
nd o
ther
bus
ines
s
Ele
ctric
ity, g
as a
nd w
ater
Man
ufac
turin
g ne
c; re
cycl
ing
Fina
ncia
l int
erm
edia
tion
Com
pute
r and
rela
ted
activ
ities
Hea
lth a
nd s
ocia
l wor
k
Asia-Pacific
Per
cent
age
0.0
50.0
100.0
150.0
200.0
250.0
Pul
p, p
aper
, pap
er p
rodu
cts,
...
Pos
t and
tele
com
mun
icat
ions
Ren
ting
of m
achi
nery
and
...
Woo
d an
d pr
oduc
ts o
f woo
d an
d...
Man
ufac
turin
g ne
c; re
cycl
ing
Text
iles,
text
ile p
rodu
cts,
leat
her..
.
Ele
ctric
al m
achi
nery
and
...
Hea
lth a
nd s
ocia
l wor
k
Rea
l est
ate
activ
ities
Food
pro
duct
s, b
ever
ages
and
...
Rub
ber a
nd p
last
ics
prod
ucts
Oth
er n
on-m
etal
lic m
iner
al...
Hot
els
and
rest
aura
nts
Oth
er tr
ansp
ort e
quip
men
t
Mac
hine
ry a
nd e
quip
men
t, ne
c
Mot
or v
ehic
les,
trai
lers
and
sem
i-...
Che
mic
als
and
chem
ical
pro
duct
s
Oth
er c
omm
unity
, soc
ial a
nd...
Who
lesa
le a
nd re
tail
trade
;
Fina
ncia
l int
erm
edia
tion
Fabr
icat
ed m
etal
pro
duct
s
Edu
catio
n
R&
D a
nd o
ther
bus
ines
s ac
tiviti
es
Agr
icul
ture
, hun
ting,
fore
stry
and
...
Bas
ic m
etal
s
Con
stru
ctio
n
Com
pute
r, E
lect
roni
c an
d op
tical
...
Tran
spor
t and
sto
rage
Min
ing
and
quar
ryin
g
Ele
ctric
ity, g
as a
nd w
ater
sup
ply
Cok
e, re
fined
pet
role
um p
rodu
cts.
..
Non-Asia-Pacific
Per
cent
age

INTERNATIONAL TRADE IN A DIGITAL AGE CHAPTER 7
Asia-Pacific Trade and Investment Report 2016 − 113
3. Trade in infrastructure goods and services
The availability of digital infrastructure is important for the development of digital trade. Part of the investment in digital infrastructure is the import of infrastructure-related IT goods and services; however, the import intensity in each country differs, depending on various factors including domestic capacity to produce the digital infrastructure-related goods and services, and trade policy. Trade in value-added shows that the import share of digital infrastructure services in total exports globally increased from 14% in 1995 to 22% in 2011. In the case of Asia-Pacific exporters, the import share is higher than the world average. Since 1995, the share of imported telecommunication services has been 21% while the import intensity of computer and related services gradually increased from 23% in1995 to 25% in 2011. The growing significance of digital infrastructure-related imports implies that there is a need for an open trade environment for the sake of
Figure7.6
Sources of computer-related services used in exports, Asia-Pacific and rest of the world, 1995 and 2011
Source: ESCAP calculation using data from OECD-WTO TiVA, October 2015 version.
digital-trade development.
In addition, intraregional trade is growing together with the rising importance of digital trade, especially intraregional trade in computer and related services. From 1995 to 2011, intraregional imports of digital-infrastructure services grew faster than the imports from non-regional partners and domestic sourcing. As a result, the share of intraregional imports grew from 9% to 11% during those years (figure 7.6). In contrast, non-regional economies only source 2%-3% of the services from Asia and the Pacific.
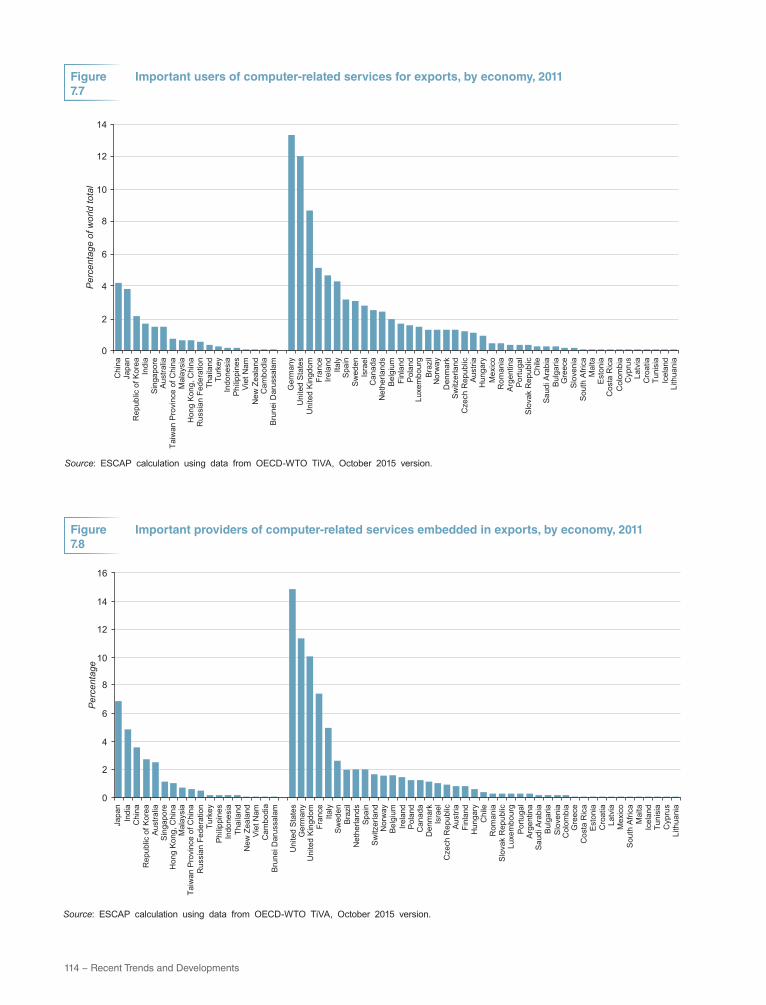
While intraregional trade opportunity is growing, the major markets for digital-infrastructure services remain outside the region. At the global level, the United States is the largest user of computer technologies in terms of facilitating its exports, followed by Germany, the United Kingdom, France, Ireland and Italy (figure 7.7). China, the largest Asia-Pacific user of computer
Domestic77%
Asia-Pacific9%
Non-Asia Pacific14%
Asia-Pacific (1995)
Domestic75%
Asia-Pacific11%
Non-Asia-Pacific14%
Asia-Pacific (2011)
Domestic85%
Asia-Pacific2%
Non-Asia-Pacific13%
Non-Asia-Pacific (1995)
Domestic79%
Asia-Pacific3%
Non-Asia-Pacific18%
Non-Asia-Pacific (2011)
Domestic77%
Asia-Pacific9%
Non-Asia Pacific14%
Asia-Pacific (1995)
Domestic75%
Asia-Pacific11%
Non-Asia-Pacific14%
Asia-Pacific (2011)
Domestic85%
Asia-Pacific2%
Non-Asia-Pacific13%
Non-Asia-Pacific (1995)
Domestic79%
Asia-Pacific3%
Non-Asia-Pacific18%
Non-Asia-Pacific (2011)
Domestic77%
Asia-Pacific9%
Non-Asia Pacific14%
Asia-Pacific (1995)
Domestic75%
Asia-Pacific11%
Non-Asia-Pacific14%
Asia-Pacific (2011)
Domestic85%
Asia-Pacific2%
Non-Asia-Pacific13%
Non-Asia-Pacific (1995)
Domestic79%
Asia-Pacific3%
Non-Asia-Pacific18%
Non-Asia-Pacific (2011)
Domestic77%
Asia-Pacific9%
Non-Asia Pacific14%
Asia-Pacific (1995)
Domestic75%
Asia-Pacific11%
Non-Asia-Pacific14%
Asia-Pacific (2011)
Domestic85%
Asia-Pacific2%
Non-Asia-Pacific13%
Non-Asia-Pacific (1995)
Domestic79%
Asia-Pacific3%
Non-Asia-Pacific18%
Non-Asia-Pacific (2011)
114 − Recent Trends and Developments
Figure7.7
Figure7.8
Important users of computer-related services for exports, by economy, 2011
Important providers of computer-related services embedded in exports, by economy, 2011
Source: ESCAP calculation using data from OECD-WTO TiVA, October 2015 version.
Source: ESCAP calculation using data from OECD-WTO TiVA, October 2015 version.
0
2
4
6
8
10
12
14C
hina
Japa
nR
epub
lic o
f Kor
eaIn
dia
Sin
gapo
reA
ustra
liaTa
iwan
Pro
vinc
e of
Chi
naM
alay
sia
Hon
g K
ong,
Chi
naR
ussi
an F
eder
atio
nTh
aila
ndTu
rkey
Indo
nesi
aP
hilip
pine
sV
iet N
amN
ew Z
eala
ndC
ambo
dia
Bru
nei D
arus
sala
m
Ger
man
yU
nite
d S
tate
sU
nite
d K
ingd
omFr
ance
Irela
ndIta
lyS
pain
Sw
eden
Isra
elC
anad
aN
ethe
rland
sB
elgi
umFi
nlan
dP
olan
dLu
xem
bour
gB
razi
lN
orw
ayD
enm
ark
Sw
itzer
land
Cze
ch R
epub
licA
ustri
aH
unga
ryM
exic
oR
oman
iaA
rgen
tina
Por
tuga
lS
lova
k R
epub
licC
hile
Sau
di A
rabi
aB
ulga
riaG
reec
eS
love
nia
Sou
th A
frica
Mal
taE
ston
iaC
osta
Ric
aC
olom
bia
Cyp
rus
Latv
iaC
roat
iaTu
nisi
aIc
elan
dLi
thua
nia
Per
cent
age
of w
orld
tota
l
0
2
4
6
8
10
12
14
16
Japa
nIn
dia
Chi
naR
epub
lic o
f Kor
eaA
ustra
liaS
inga
pore
Hon
g K
ong,
Chi
naM
alay
sia
Taiw
an P
rovi
nce
of C
hina
Rus
sian
Fed
erat
ion
Turk
eyP
hilip
pine
sIn
done
sia
Thai
land
New
Zea
land
Vie
t Nam
Cam
bodi
aB
rune
i Dar
ussa
lam
Uni
ted
Sta
tes
Ger
man
yU
nite
d K
ingd
omFr
ance
Italy
Sw
eden
Bra
zil
Net
herla
nds
Spa
inS
witz
erla
ndN
orw
ayB
elgi
umIre
land
Pol
and
Can
ada
Den
mar
kIs
rael
Cze
ch R
epub
licA
ustri
aFi
nlan
dH
unga
ryC
hile
Rom
ania
Slo
vak
Rep
ublic
Luxe
mbo
urg
Por
tuga
lA
rgen
tina
Sau
di A
rabi
aB
ulga
riaS
love
nia
Col
ombi
aG
reec
eC
osta
Ric
aE
ston
iaC
roat
iaLa
tvia
Mex
ico
Sou
th A
frica
Mal
taIc
elan
dTu
nisi
aC
ypru
sLi
thua
nia
Per
cent
age

INTERNATIONAL TRADE IN A DIGITAL AGE CHAPTER 7
Asia-Pacific Trade and Investment Report 2016 − 115
technologies in export processing, comes after Italy and is followed by Japan. The countries listed as the major users of computer technologies in their exports are also the major exporters of the computer-related services (figure 7.8). Thus, the figures indicate that an economy’s competitiveness in digital-infrastructure services may be an important factor in export competiveness in the modern trade environment, where the Internet network has become an important platform of global trade.
For telecommunication services, the share of intraregional imports of telecommunications by Asia and the Pacific decreased from 8% in 1995 to 4% in 2011 (figure 7.9). On the one hand, this decreasing share of intraregional imports may indicate that Asia-Pacific economies still have limited capacity to compete with global service providers in telecommunications. On the other hand, the trend of digital technology has allowed consumers to order goods or services
Figure7.9
Sources of telecommunications services used in exports, Asia-Pacific and rest of the world, 1995 and 2011
Source: ESCAP calculation using data from OECD-WTO TiVA, October 2015 version.
from suppliers operating outside the region, and thus cross-regional telecommunications is an important part of facilitating those cross-regional transactions.
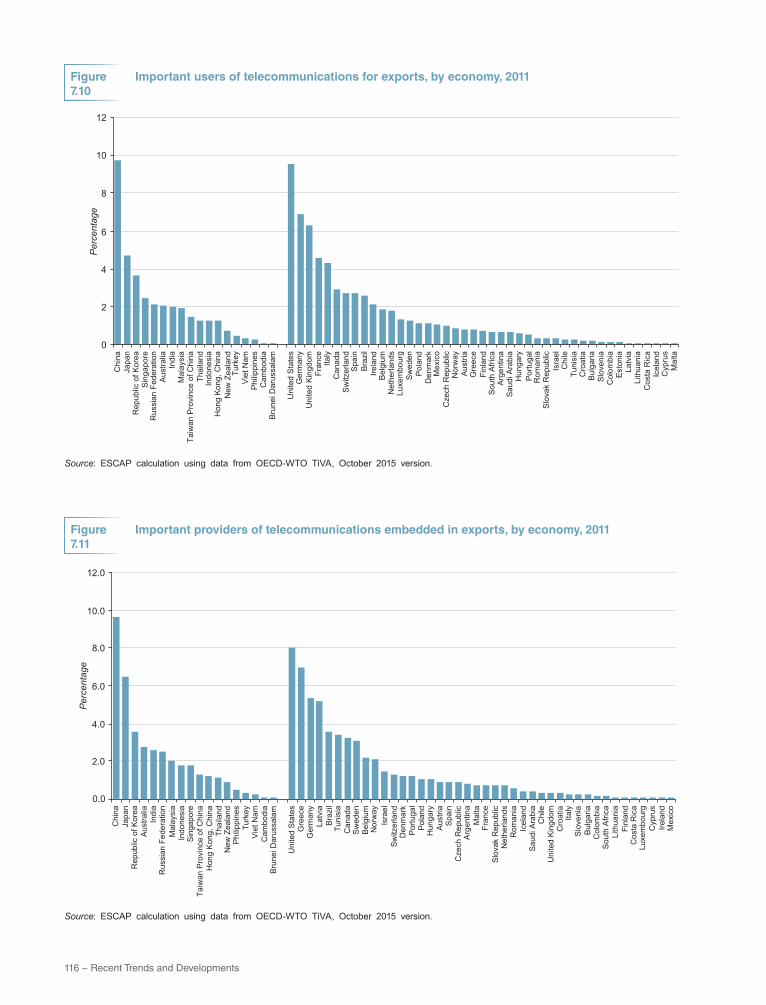
However, the minimal share in overall telecommunication services of the Asia-Pacific region masks the distinct performance of China in comparison to other Asia-Pacific economies. In fact, China has caught up with the United States as an important user of telecommunication services to facilitate its export activities (figure 7.10). In addition, China has been the world number one in terms of indirectly exporting telecommunication services. This may indicate that the inputs from telecommunication services have contributed to the success story of China’s exports during the past decade.
With regard to digital-infrastructure goods, based on the list of ITA products digital-infrastructure-related merchandise exports amounted to $1,600 billion in
Domestic83%
Asia-Pacific8%
Non-Asia-Pacific9%
Asia-Pacific (1995)
Domestic79%
Asia-Pacific4%
Non-Asia-Pacific17%
Asia-Pacific (2011)
Domestic84%
Asia-Pacific2%
Non-Asia-Pacific14%
Non-Asia-Pacific (1995)
Domestic79%
Asia-Pacific4%
Non-Asia-Pacific17%
Non-Asia-Pacific (2011)
Domestic83%
Asia-Pacific8%
Non-Asia-Pacific9%
Asia-Pacific (1995)
Domestic79%
Asia-Pacific4%
Non-Asia-Pacific17%
Asia-Pacific (2011)
Domestic84%
Asia-Pacific2%
Non-Asia-Pacific14%
Non-Asia-Pacific (1995)
Domestic79%
Asia-Pacific4%
Non-Asia-Pacific17%
Non-Asia-Pacific (2011)
Domestic83%
Asia-Pacific8%
Non-Asia-Pacific9%
Asia-Pacific (1995)
Domestic79%
Asia-Pacific4%
Non-Asia-Pacific17%
Asia-Pacific (2011)
Domestic84%
Asia-Pacific2%
Non-Asia-Pacific14%
Non-Asia-Pacific (1995)
Domestic79%
Asia-Pacific4%
Non-Asia-Pacific17%
Non-Asia-Pacific (2011)
Domestic83%
Asia-Pacific8%
Non-Asia-Pacific9%
Asia-Pacific (1995)
Domestic79%
Asia-Pacific4%
Non-Asia-Pacific17%
Asia-Pacific (2011)
Domestic84%
Asia-Pacific2%
Non-Asia-Pacific14%
Non-Asia-Pacific (1995)
Domestic79%
Asia-Pacific4%
Non-Asia-Pacific17%
Non-Asia-Pacific (2011)
116 − Recent Trends and Developments
Figure7.10
Important users of telecommunications for exports, by economy, 2011
Figure7.11
Important providers of telecommunications embedded in exports, by economy, 2011
Source: ESCAP calculation using data from OECD-WTO TiVA, October 2015 version.
Source: ESCAP calculation using data from OECD-WTO TiVA, October 2015 version.
Per
cent
age
0
2
4
6
8
10
12C
hina
Japa
nR
epub
lic o
f Kor
eaS
inga
pore
Rus
sian
Fed
erat
ion
Aus
tralia
Indi
aM
alay
sia
Taiw
an P
rovi
nce
of C
hina
Thai
land
Indo
nesi
aH
ong
Kon
g, C
hina
New
Zea
land
Turk
eyV
iet N
amP
hilip
pine
sC
ambo
dia
Bru
nei D
arus
sala
m
Uni
ted
Sta
tes
Ger
man
yU
nite
d K
ingd
omFr
ance
Italy
Can
ada
Sw
itzer
land
Spa
inB
razi
lIre
land
Bel
gium
Net
herla
nds
Luxe
mbo
urg
Sw
eden
Pol
and
Den
mar
kM
exic
oC
zech
Rep
ublic
Nor
way
Aus
tria
Gre
ece
Finl
and
Sou
th A
frica
Arg
entin
aS
audi
Ara
bia
Hun
gary
Por
tuga
lR
oman
iaS
lova
k R
epub
licIs
rael
Chi
leTu
nisi
aC
roat
iaB
ulga
riaS
love
nia
Col
ombi
aE
ston
iaLa
tvia
Lith
uani
aC
osta
Ric
aIc
elan
dC
ypru
sM
alta
0.0
2.0
4.0
6.0
8.0
10.0
12.0
Chi
naJa
pan
Rep
ublic
of K
orea
Aus
tralia
Indi
aR
ussi
an F
eder
atio
nM
alay
sia
Indo
nesi
aS
inga
pore
Taiw
an P
rovi
nce
of C
hina
Hon
g K
ong,
Chi
naTh
aila
ndN
ew Z
eala
ndP
hilip
pine
sTu
rkey
Vie
t Nam
Cam
bodi
a
Uni
ted
Sta
tes
Gre
ece
Ger
man
yLa
tvia
Bra
zil
Tuni
sia
Can
ada
Sw
eden
Bel
gium
Nor
way
Isra
elS
witz
erla
ndD
enm
ark
Por
tuga
lP
olan
dH
unga
ryA
ustri
aS
pain
Cze
ch R
epub
licA
rgen
tina
Mal
taFr
ance
Slo
vak
Rep
ublic
Net
herla
nds
Rom
ania
Icel
and
Sau
di A
rabi
aC
hile
Uni
ted
Kin
gdom
Cro
atia
Italy
Slo
veni
aB
ulga
riaC
olom
bia
Sou
th A
frica
Lith
uani
aFi
nlan
dC
osta
Ric
aLu
xem
bour
gC
ypru
sIre
land
Mex
ico
Bru
nei D
arus
sala
m
Per
cent
age

INTERNATIONAL TRADE IN A DIGITAL AGE CHAPTER 7
Asia-Pacific Trade and Investment Report 2016 − 117
Figure7.12
World exports of digital-infrastructure goods
Source: ESCAP compilation, using data from United Nations COMTRADE, downloaded from WITS.Note: Only product items that are identified in terms of HS are covered.
2014, which was equivalent to 9.2% of world exports. The extension of the ITA product list agreed upon in July 2016, covering the new generation of information technology equipment, will double the trade coverage of ITA (figure 7.12). Based on the share in 2014, the coverage of ITA will reach 18% of world merchandise exports if 201 new products of the ITA extension are included.
With the dominance of exports from China and East Asian economies, the Asia-Pacific region accounts for more than 64% of the world exports on the original ITA product list. The region represents slightly less for the new generation products, of which the technology is still new and owned by developed economies. However, the region is an important exporter, at least as a final assembler, with a share of 57.5% of world exports of products covered by the extension of ITA.
D. CONCLUSION
The growing digital intensity has caused fundamental changes in trade; as a result, there is the need for the improvement of trade statistics to catch up with this process. Official and market research on cross-
border digital trade is starting to emerge; however, of particular concern with regard to measuring digital trade is the quality, methodology and transparency differences that inhibit cross-country benchmarking. The case studies tend to overstate the perception of B2C e-commerce, which in fact is not a good representation of cross-border digital trade in goods and services whereas B2B e-commerce is likely to be much more significant. Although cross-border data flows have been seen as an attractive proxy, they suffer from the same issues as any web-based indicators – the fact that not all data transfers are the result of digital trade. In addition, a number of other technical issues and regulations complicate comparability and ability to map the flows of data with regard to sources and destinations of international trade goods and services.
As discussed in this chapter, requirements for analyses of digital trade issues need a combination of data on trade in services, input-output linkages and merchandise statistics at the most detailed level that is comparable across countries. Without a unified definition, proper conceptual framework and systematic data collections, key questions concerning policy design and regulation remain inadequately answered.
-
500.00
1 000.00
1 500.00
2 000.00
2 500.00
3 000.00
3 500.00
1996
1997
1998
1999
2000
2001
2002
2003
2004
2005
2006
2007
2008
2009
2010
2011
2012
2013
2014
Bill
ions
of U
nite
d S
tate
s do
llars
ITA Extension (effective after 2016)Parts and accessories of IT equipmentData storage media and software provided on physical mediaTelecommunication equipment
Instruments and apparatusSeminconductor manufacturing equipmentSemiconductorsComputers

118 − Recent Trends and Developments
Using the available official statistics, this chapter is aimed at contributing to closing the knowledge gap by suggesting proxies and a conceptual framework that can be indicative for highlighting major trends related to cross-border digital trade. The chapter focuses on a factual exploration of digital trade at the global and Asia-Pacific levels. In considering the use of digital technology and services in international trade in goods and services transactions as an attractive proxy, the study reveals that exporters in the Asia-Pacific region are rapidly increasing the use of digital technology to support their export activities, both directly and indirectly. The growth of digital trade is having a relatively stronger impact on service trade than on merchandise trade. The digital-intensive industries are relatively high-tech or high value-added. Digital-intensive services sectors include financial services (for example, Internet banking), telecommunication services, R&D and business services, and the renting of machinery and equipment (car rental services etc.). In the case of manufacturing, the publishing industry, chemical products, computer equipment, and electrical machinery and transport machinery are among the sectors with high digital intensity.
The availability of digital infrastructure is important to the development of digital trade. Imports of telecommunications and computer equipment play an important role in digital trade, especially that of Asia and the Pacific. This has opened intraregional trade opportunities as intraregional sourcing for those digital infrastructure products has been growing in recent years. However, the export opportunities are mainly clustered in large economies, especially China, Japan, India and the Republic of Korea.
The trends and developments discussed can shed light on a broader policy framework. The digitalization of international trade brings about a greater need for an open trade environment and international cooperation. Non-discriminatory principles and international harmonization of rules and regulation are essential. The concept of an open environment is not new; however, what is added is the fact that “openness” in the world of digital trade does not only mean free flows of goods or services, but also the need for the free flow of data across national borders. In addition, the growing importance of digital trade brings to the fore a greater need for international cooperation, as a supportive environment for digital trade is more dependent on multilaterally agreed policies than on unilateral ones.
Endnotes1 The report indicates that more than half of the broadband
subscriptions in the Asia-Pacific region were registered in China, while broadband access is still largely unavailable and unaffordable in one third of the countries in the rest of the Asia-Pacific region, especially in least developed countries, landlocked developing countries and small island developing States.
2 As per BPM6 definitions, telecommunication services encompass the broadcasting or transmission of sound, images, data or other information by telephone, telex, telegram, radio and television cable transmission, radio and television satellite, electronic mail, facsimile and so forth, including business network services, teleconferencing and support services. Computer-related services comprise hardware- and software-related services and data-processing services. (Data at the country and world levels, available from http://stat.wto.org/StatisticalProgram/WSDBStatProgramSeries.aspx?Language=E&subtopic=bp;bc).
3 Hellerstein (2002), Makoni, Tsikirayi and Mandizha (2013), Ruffle (2001), Schuknecht and Pérez-Esteve (1999), and Teltscher (2001) identify products that can be digitized in a relatively consistent manner. The analysis detailed in this chapter used a combined list of electronically-enabled goods as shown in annex 7.1.
4 Annex 7.2 provides the lists of electronically-enabled services based on BPM6.
5 Although IT goods are part of the e-commerce infrastructure, this study does not include the value-added by IT goods in total exports as part of the e-commerce intensity. This is because most exporters use computers and electronics equipment in everyday business even if digital trade is not involved.
6 The database contains useful estimates on the value of inputs used in producing exports globally that can be broken down into 62 economies (61 economies and an aggregate for the rest of the world). These 61 economies cover nearly 95% of world trade. The annual coverage includes 1995, 2000, 2005, 2008, 2009, 2010 and 2011. Of the 61 economies, 18 are located in Asia and the Pacific (Australia; Brunei Darussalam; Cambodia; China; India; Indonesia; Japan; Republic of Korea; Malaysia; New Zealand; Philippines; Russian Federation; Singapore; Thailand; Turkey; Viet Nam; Hong Kong, China; and Taiwan Province of China). As these 18 economies accounted for 97% of merchandise exports and imports by Asia-Pacific economies they are taken as a representative sample of the Asia-Pacific region. Data are available at the country level for 34 industries

INTERNATIONAL TRADE IN A DIGITAL AGE CHAPTER 7
Asia-Pacific Trade and Investment Report 2016 − 119
classified under 2 digit-ISIC Revision 3, including 19 merchandise sectors (agriculture, mining, food products, textiles and apparel, wood, paper and publishing, fuel, chemicals, rubber and plastic, non-metallic minerals, basic metals, fabricated metals, machinery, computers and electronics, electrical machinery, motor vehicles, transport equipment, other manufactures and utilities) and 16 service sectors (construction, wholesale and retail, hotels and restaurants, transport and storage, post and telecommunications, finance and insurance, real estate activities, renting machinery and equipment, computer-related activities, research and development, other business services, public administrative services, education, health and social work, personal services and private household services). In the analysis of e-commerce services in this chapter, the focus is on digital trade in commercial services. Therefore, the results represented in this chapter do not include public administration services.
7 As per BPM6 definitions, telecommunication services encompass the broadcasting or transmission of sound, images, data or other information by telephone, telex, telegram, radio and television cable transmission, radio and television satellite, electronic mail, facsimile and so forth, including business network services, teleconferencing, and support services. Computer-related services consist of hardware- and software-related services and data-processing services (Data at the country and world levels, available from http://stat.wto.org/StatisticalProgram/WSDBStatProgramSeries.aspx?Language=E&subtopic=bp;bc).
8 Telecommunication services are the main carrier used for digital trade. The current version of OECD-WTO TiVA lists post and telecommunications as one industry. While it is not possible to separate them, this study assumes that telecommunication trends dominate. In addition, ADB (2015) indicated that postal service was important for conducting e-commerce, especially for B2C.
9 The number is based on compound annual growth rates.
10 The October 2015 version of the OECD-WTO TiVA database contains data for 17 regional members of ESCAP, including: Australia; Brunei Darussalam; Cambodia; China; India; Indonesia; Japan; the Republic of Korea; Malaysia; New Zealand; the Philippines; the Russian Federation; Singapore; Thailand; Turkey; Viet Nam; and Hong Kong, China. The database also includes Taiwan Province of China, which is not a member of ESCAP. These economies, including Taiwan Province of China, accounted for more than 97% of merchandise exports and imports by the Asia-Pacific region. Therefore, they are taken as a representative sample of Asia and the Pacific.
11 Newer items entering trade on an increasingly systematic basis, such as software, have been progressively included in the categorization list under a number of previously existing codes, in particular under recorder media (HS 8524).
12 For more information, see UNCTAD-WHO, 1998.

120 − Recent Trends and Developments
REFERENCESAsian Development Bank (2015). Aid for Trade in Asia and the Pacific: Thinking forward about Trade Costs and the Digital Economy. Manila. Available from https://www.adb.org/sites/default/files/publication/167344/aft-report-2015.pdf
Ahmed, U., and G. Andolas (2015). Addressing barriers to digital trade. E15 initiative. Geneva: International Centre for Trade and Sustainable Development and World Economic Forum. Available from http://e15initiative.org/wp- content/uploads/2015/09/E15-Digital-Economy-Ahmed-and-Aldonas-FINAL-2.pdf
Bernier, I. (2012). Local content requirements for film, radio, and television as a means of protecting cultural diversity: theory and reality. Available from www.diversite-culturelle.qc.ca/fileadmin/documents/pdf/update031112section1.pdf.
Cimino-Isaacs, C., and J. Zilinsky (2016). Local content requirements: backdoor protectionism spreading under the radar. Trade and Investment Policy Watch, 22 July. Washington D.C.: Peterson Institute for International Economics. Available from https://piie.com/blogs/trade-investment-policy-watch/local-content-requirements-backdoor- protectionism-spreading
Economic and Social Commission for Asia and the Pacific (2016a). State of ICT in Asia and the Pacific 2016: uncovering the widening broadband divide. Technical Paper by the Information and Communications Technology and Disaster Risk Reduction Division. Bangkok: ESCAP. Available from www.unescap.org/resources/state-ict-asia- and-pacific-2016-uncovering-widening-broadband-divide.
(2016b). Harnessing Science, Technology and Innovation for Inclusive and Sustainable Development in Asia and the Pacific. Sales No. E.16.II.F.12.
European Commission (2016). Digital Single Market website. Available from https://ec.europa.eu/digital-single-market/en/ digital-single-market.
Fredriksson, T. (2013). E-commerce and development: key trends and issues. Presentation at the Workshop on E-Commerce, Development and SMEs, WTO, Geneva, 8-9 April. Available from https://www.wto.org/english/ tratop_e/devel_e/wkshop_apr13_e/fredriksson_ecommerce_e.pdf .
Hellerstein, W. (2002). Electronic commerce and the challenge for tax administration. Paper prepared for the Seminar on Revenue Implications of E-Commerce for Development, Geneva, 22 April. World Trade Organization, Committee on Trade and Development, Geneva.
International Chamber of Commerce (2015). Global baseline de minimis value thresholds: policy statement. February. Paris.
International Telecommunications Union (2013). Measuring the Information Society Report. Geneva. Available from www.itu.int/en/ITU-D/Statistics/Pages/publications/mis2013.aspx .
Lund, S., and J. Manyika (2016). How digital trade is transforming globalisation. E15 Initiative. Geneva: International Centre for Trade and Sustainable Development and World Economic Forum.
Makoni, E., C.M. Tsikirayi and E. Mandizha (2013). To charge or not to charge customs excise duty on digitized products: an assessment of the Zimbabwe Revenue Authority (ZIMRA) potential revenue losses through duty exemption on digitized goods. International Journal of Education and Research, vol. 1, No. 8.
McKinsey Global Institute (2014). Global Flows in a Digital Age: How Trade, Finance, People, and Data Connect the World Economy. Brussels, San Francisco and Shanghai: McKinsey and Company.
Markle Foundation (2005). WTO, e-commerce and information technologies: from the Uruguay Round to Doha Development Agenda – a report for the United Nations ICT Taskforce. New York. Available from https://www. wto.org/english/tratop_e/serv_e/sym_april05_e/wunschvincent_e.pdf
National Association of Citizens Advice Bureaux (2015). Personal Data Empowerment: Time for a Fairer Data Deal? London. Available from http://bit.ly/1XtrIBG
Organisation for Economic Co-operation and Development (2013). OECD Glossary of Statistical Terms. Paris. Available from https://stats.oecd.org/glossary/
(2012). OECD Internet Economy Outlook 2012. Paris. Available from www.oecd.org/sti/ieconomy/oecd-internet- economy-outlook-2012-9789264086463-en.htm
Ruffle, D. (2001). Cross-border electronic commerce and international trade statistics. STD/NA/ITS (2001)1. Statistics Directorate. Paris: OECD. Available from www.oecd.org/std/its/2536014.pdf .
Schuknecht, L., and R. Pérez-Esteve (1999). A quantitative assessment of electronic commerce. Staff Working Paper ERAD-99-01. Geneva: World Trade Organization.
Teltscher, S. (2001). The impact of electronic goods trading on customs revenue. Paper prepared for the 14th Bled Electronic Commerce Conference, Bled, Slovenia,25-26 June. Available from https://domino.fov.uni-mb.si/proceedings. nsf/0/d7267a8c1b1a8799c1256e9f003130d5/$FILE/34_Telscher.pdf

INTERNATIONAL TRADE IN A DIGITAL AGE CHAPTER 7
Asia-Pacific Trade and Investment Report 2016 − 121
United Nations Conference on Trade and Development (1999). Can electric commerce be an engine for global growth? Electric commerce and the integration of developing countries and countries with economies in transition in international trade – Note by the UNCTAD secretariat. Trade and Development Board, 1 June. TD/B/COM.3/23. Available from http://unctad.org/en/Docs/c3d23.pdf .
(2015). Information Economy Report: Unlocking the Potential of E-commerce for Developing Countries. Sales No. E.15.II.D.1. Available from http://unctad.org/en/PublicationsLibrary/ier2015_en.pdf .
(2016a). New initiative to help developing countries grasp $22 trillion e-commerce opportunity. UNCTAD News, 19 July. Geneva. Available from http://unctad.org/en/pages/newsdetails.aspx?OriginalVersionID=1281
(2016b). UNCTAD B2C E-commerce Index 2016. UNCTAD Technical Notes on ICT for Development, No. 7. Geneva. Available from http://unctad.org/en/PublicationsLibrary/tn_unctad_ict4d07_en.pdf .
(2016c). Data Protection Regulations and International Data Flows: Implications for Trade and Development. Geneva. Available from http://unctad.org/en/PublicationsLibrary/dtlstict2016d1_en.pdf.
UNCTAD-WHO (1998). International trade in health services: a development perspective. Geneva. UNCTAD/ITCD/ TSB/5 – WHO/TFHE/98.1. Available from http://apps.who.int/iris/bitstream/10665/63939/2/UNCTAD_ITCD_TSB_5_ PartI.pdf
United States International Trade Commission (2013). Digital Trade in the U.S. and Global Economies, Part 1. USITC Publication 4415. Washington D.C. Available from https://www.usitc.gov/publications/332/pub4415.pdf .
United States, Office of the United States Trade Representative (2016). Fact sheet: key barriers to digital trade. March. Washington, D.C.
Van der Marel, E. (2015). Disentangling the flows of data: inside or outside the multinational company? ECIPE Occasional Paper 07/2015. Brussels: European Centre for International Political Economy. Available from http:// ecipe.org/app/uploads/2015/07/ECIPE-Data-Flows-final.pdf.
Weber, R. (2010). Digital trade in WTO law – taking stock and looking ahead. Asian Journal of WTO & International Health Law and Policy, vol. 5, No. 1, pp. 1-24, March.
Wilson, K. (2016). Smartphones drive e-commerce explosion. China Daily Asia, 10 June.
World Trade Organization (1998). Electronic Commerce and the Role of WTO. WTO Special Studies, No.2. Geneva. Available from https://www.wto.org/english/res_e/publications_e/special_studies2_e.htm.
(2016) Electronic Commerce website. Geneva. Available from https://www.wto.org/english/tratop_e/ecom_e/ecom_e. htm.
ONLINE DATABASESOECD-WTO Trade in Value-added (TivA) Database, October 2015. Available from https://stats.oecd.org/index. aspx?queryid=66237
United Nations Statistics Division, Department of Economic and Social Affairs. United Nations COMTRADE database. Available from www.comtrade.un.org.
World Bank. World Integrated Trade Solution (WITS). Available from http://wits.worldbank.org/ .
World Trade Organization. International Services Trade Statistics. Available from http://stat.wto.org/StatisticalProgram/ WSDBStatProgramSeries.aspx?Language=E&subtopic=bp;bc.
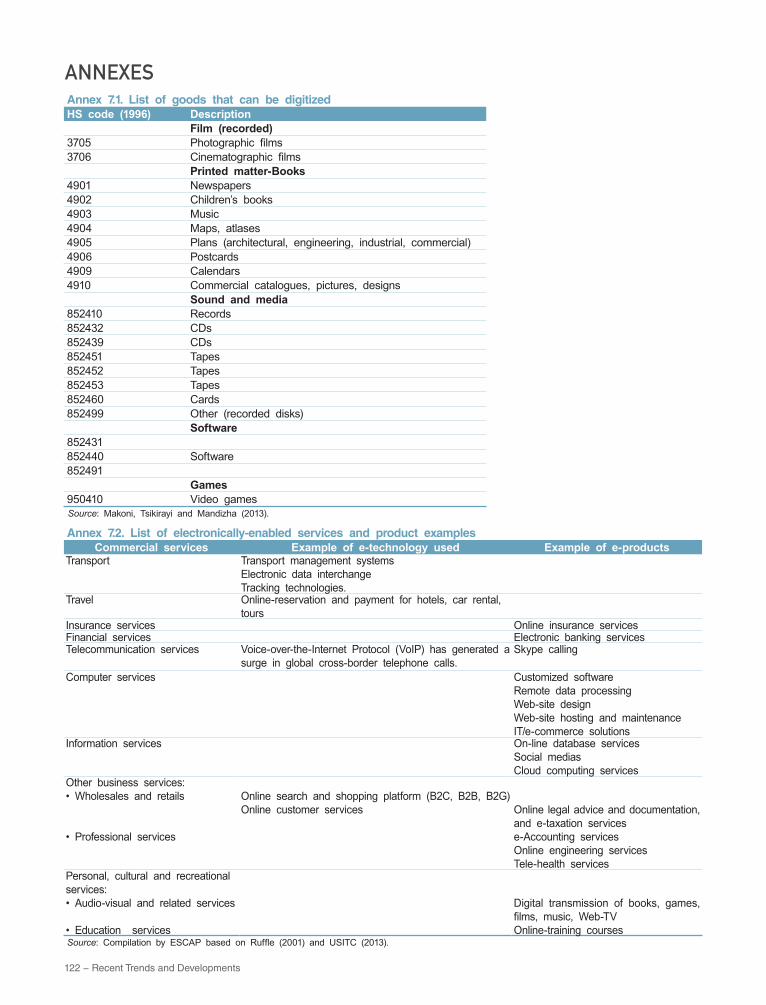
122 − Recent Trends and Developments
Annex 7.1. List of goods that can be digitizedHS code (1996) Description Film (recorded)3705 Photographic films3706 Cinematographic films Printed matter-Books4901 Newspapers4902 Children’s books4903 Music4904 Maps, atlases4905 Plans (architectural, engineering, industrial, commercial)4906 Postcards4909 Calendars4910 Commercial catalogues, pictures, designs Sound and media852410 Records852432 CDs852439 CDs852451 Tapes852452 Tapes852453 Tapes852460 Cards852499 Other (recorded disks) Software852431 852440 Software852491 Games950410 Video gamesSource: Makoni, Tsikirayi and Mandizha (2013).
ANNEXES
Annex 7.2. List of electronically-enabled services and product examplesCommercial services Example of e-technology used Example of e-products
Transport Transport management systems Electronic data interchange Tracking technologies.
Travel Online-reservation and payment for hotels, car rental, tours
Insurance services Online insurance servicesFinancial services Electronic banking servicesTelecommunication services Voice-over-the-Internet Protocol (VoIP) has generated a
surge in global cross-border telephone calls.Skype calling
Computer services Customized software Remote data processing Web-site design Web-site hosting and maintenance IT/e-commerce solutions
Information services On-line database services Social medias Cloud computing services
Other business services: • Wholesales and retails
• Professional services
Online search and shopping platform (B2C, B2B, B2G) Online customer services Online legal advice and documentation,
and e-taxation services e-Accounting services Online engineering services Tele-health services
Personal, cultural and recreational services:• Audio-visual and related services
• Education services
Digital transmission of books, games, films, music, Web-TVOnline-training courses
Source: Compilation by ESCAP based on Ruffle (2001) and USITC (2013).

READERSHIP SURVEY
Asia-Pacific Trade and Investment Report 2016
The Trade, Investment and Innovation Division of ESCAP is undertaking an evaluation of the above publication with a view to improving its quality and usefulness. We would appreciate it if you could complete this questionnaire and return it to us, at the address printed below.
QUESTIONNAIRERating for quality and usefulness (please circle) Excellent Very good Good Poor
1. How useful is this publication for your work?• Provision of information 4 3 2 1• Clarification of issues 4 3 2 1• Findings 4 3 2 1• Policy suggestions 4 3 2 1• Overall usefulness 4 3 2 1
2. Please indicate your assessment of the quality of this publication with respect to:• Presentation/format 4 3 2 1• Readability 4 3 2 1• Coverage of subject matter 4 3 2 1• Timeliness of information 4 3 2 1• Overall quality 4 3 2 1
3. Please give examples of how this publication has contributed to your work: ......................................................................................................................................................................................... ......................................................................................................................................................................................... ......................................................................................................................................................................................... .........................................................................................................................................................................................4. Your background information, please:Name: ..........................................................................................................................................................................Title/position: ...............................................................................................................................................................Institution: ....................................................................................................................................................................Office address: .........................................................................................................................................................Tel: ..................................................................... Fax: ..............................................................................................Email: ...........................................................................................................................................................................
Please return this questionnaire to:
DirectorTrade, Investment and Innovation Division ESCAPUnited Nations BuildingRajadamnern Nok AvenueBangkok 10200THAILANDFax: (66 2) 288 1027, 288 3066e-mail: [email protected]
Thank you for your cooperation.

124 − Recent Trends and Developments