Embed Size (px)
Citation preview


This report is a joint product of the members of the Inter-agency Task Force on Financing for Devel-opment (a full list of members can be found on page x). The Financing for Sustainable Development Office of the United Nations Department of Economic and Social Affairs serves as the coordinator and substantive editor of the Financing for Sustainable Development report.
The online annex of the Task Force (http://developmentfinance.un.org) comprehensively monitors progress in implementation of the Financing for Development outcomes, including the Addis Ababa Action Agenda and relevant means of implementation targets of the Sustainable Development Goals. It provides the complete evidence base for the Task Force’s annual report on progress in the seven action areas of the Addis Agenda (chapters III.A–III.G). The report is by necessity more concise and selective and should thus be read in conjunction with the online annex.
The online annex also covers several key cross-cutting initiatives that build on the synergies of the Sustainable Development Goals:
� Delivering social protection and essential public services� Ending hunger and malnutrition� Closing the infrastructure gap� Promoting inclusive and sustainable industrialization� Generating full and productive employment for all� Protecting ecosystems� Promoting peaceful and inclusive societies� Gender equality� Investing in children and youth� Addressing the diverse needs and challenges faced by countries in special situations� Global partnership
Inquiries about the Task Force or its report and online annex can be sent to:
Financing for Sustainable Development Office Department of Economic and Social Affairs 2 United Nations Plaza (DC2- 2170) New York, N.Y. 10017 United States of America +1-212-963-6518
http://developmentfinance.un.org
How to cite this report: United Nations, Inter-agency Task Force on Financing for Development, Financing for Sustainable Development Report 2019 (New York: United Nations, 2019), available from: https://developmentfinance.un.org/fsdr2019.
Photo credits: UN Photo, World Bank Photo Collection.
United Nations publicationSales No. E.19.I.7ISBN 978-92-1-101404-4Print ISSN: 2520-680XOnline ISSN: 2617-3743
Copyright © United Nations, 2019All rights reserved

INTE
RNAT
ION
AL T
RAD
E A
S AN
EN
GIN
E FO
R D
EVEL
OPM
ENT

Chapter III.D
99
International trade as an engine for development1. Key messages and recommendations
The multilateral trading system has made a significant contribution to economic growth and development. Despite this con-
tribution, the system is facing serious challenges. Following the positive trade momentum over the last two years, 2018 saw growing trade tensions and increasing threats to the functioning of the World Trade Organization (WTO) and its dispute settle-ment system. Trade growth is expected to slow in 2019 with significant downside risks associated with escalating trade tensions. These challenges present an opportunity to make the system work better, by finding solutions within the multilateral trading system, updating the WTO and revamp-ing the trading system for a new century. In their communiqué at the Group of Twenty (G20) sum-mit in Argentina, G20 leaders recognized the contribution of the multilateral trading system and committed to support the necessary reform of the WTO to improve its functioning. Govern-ments can use appropriate intergovernmental meetings to accelerate progress on WTO reform. In addition, it is hoped that WTO members will complete long-standing work on the development agenda.
Strengthening trade’s contribution as an engine for inclusive economic growth and pov-erty reduction is particularly important to least developed countries (LDCs), which remain far below the target of doubling their share of global exports by 2020. With a view to continually im-proving market access for LDC exports, WTO members should expeditiously implement the Ministerial Decisions on preferential rules of origin for LDCs and on preferential treatment of LDC services exports.
Trade has income distributional effects, under-scoring the importance of trade and supporting policies aimed at reducing inequality and empow-
ering women, in both developed and developing countries. For example, trade patterns and chal-lenges tend to present gender-based differences. New and existing trade and investment agree-ments are encouraged to address synergistic linkages between trade, investment and socio-economic and environmental policy (e.g., finance, taxation, competition, labour, gender, and tech-nology) in order to enhance trade’s contribution to the Sustainable Development Goals (SDGs).
Actions are also required to allow micro, small and medium-sized enterprises (MSMEs) to better tap trade opportunities and integrate into interna-tional value chains. The persisting trade finance gap continues to affect them disproportionally. The increase in multilateral development bank (MDBs) provision of trade financing and guaran-tees is timely, but would need to be complemented by greater private finance, as well as potentially by national development banks. A greater focus needs to be placed on financial techniques that are less document intensive as well as on digital plat-forms and fintech that can help strengthen trade financing for MSMEs, including by reversing the decline in correspondent banking, which is partly responsible for the trade finance gap.
E-commerce opens new trade opportunitiesfor MSMEs. However, many developing countries, particularly in Africa, remain relatively under-connected to the internet and thus to e-commerce platforms. This underlines the importance of increasing investment in information and com-munication technology (ICT). The upcoming plurilateral negotiations on e-commerce at WTO should address the need for resources to enhance e-commerce readiness of MSMEs in developingcountries.
Improving trade facilitation, including improv-ing efficiency in customs revenue collection and
2019 FINANCING FOR SUSTAINABLE DEVELOPMENT REPORT
100
sustainable and climate-resilient transport, presents im-mense potential in reducing trade cost and increasing pubic revenue. International assistance remains critical to making progress in these areas, notably through Aid for Trade.
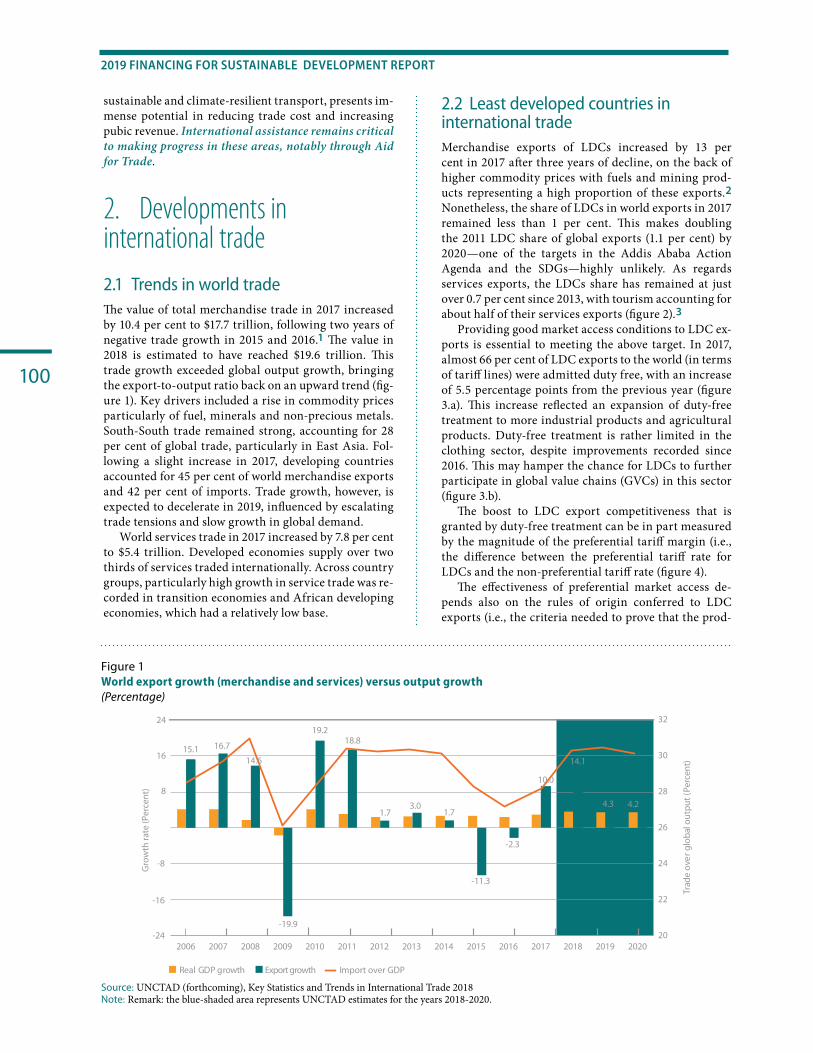
2. Developments in international trade2 .1 Trends in world tradeThe value of total merchandise trade in 2017 increased by 10.4 per cent to $17.7 trillion, following two years of negative trade growth in 2015 and 2016.1 The value in 2018 is estimated to have reached $19.6 trillion. This trade growth exceeded global output growth, bringing the export-to-output ratio back on an upward trend (fig-ure 1). Key drivers included a rise in commodity prices particularly of fuel, minerals and non-precious metals. South-South trade remained strong, accounting for 28 per cent of global trade, particularly in East Asia. Fol-lowing a slight increase in 2017, developing countries accounted for 45 per cent of world merchandise exports and 42 per cent of imports. Trade growth, however, is expected to decelerate in 2019, influenced by escalating trade tensions and slow growth in global demand.
World services trade in 2017 increased by 7.8 per cent to $5.4 trillion. Developed economies supply over two thirds of services traded internationally. Across country groups, particularly high growth in service trade was re-corded in transition economies and African developing economies, which had a relatively low base.
2 .2 Least developed countries in international tradeMerchandise exports of LDCs increased by 13 per cent in 2017 after three years of decline, on the back of higher commodity prices with fuels and mining prod-ucts representing a high proportion of these exports.2 Nonetheless, the share of LDCs in world exports in 2017 remained less than 1 per cent. This makes doubling the 2011 LDC share of global exports (1.1 per cent) by 2020—one of the targets in the Addis Ababa Action Agenda and the SDGs—highly unlikely. As regards services exports, the LDCs share has remained at just over 0.7 per cent since 2013, with tourism accounting for about half of their services exports (figure 2).3
Providing good market access conditions to LDC ex-ports is essential to meeting the above target. In 2017, almost 66 per cent of LDC exports to the world (in terms of tariff lines) were admitted duty free, with an increase of 5.5 percentage points from the previous year (figure 3.a). This increase reflected an expansion of duty-free treatment to more industrial products and agricultural products. Duty-free treatment is rather limited in the clothing sector, despite improvements recorded since 2016. This may hamper the chance for LDCs to further participate in global value chains (GVCs) in this sector (figure 3.b).
The boost to LDC export competitiveness that is granted by duty-free treatment can be in part measured by the magnitude of the preferential tariff margin (i.e., the difference between the preferential tariff rate for LDCs and the non-preferential tariff rate (figure 4).
The effectiveness of preferential market access de-pends also on the rules of origin conferred to LDC exports (i.e., the criteria needed to prove that the prod-
Figure 1World export growth (merchandise and services) versus output growth(Percentage)
2006 2007 2008 2009 2010 2011 2012 2013 2014 2015 2016 2017 2018 2019 2020
Real GDP growth Export growth Import over GDP
20
22
24
26
28
30
32
Trad
e ov
er g
loba
l out
put (
Perc
ent)
-16
-24
-8
15.1 16.7
8
16
24
Gro
wth
rate
(Per
cent
)
14.6
18.8
1.73.0
1.7
-11.3
-2.3
10.0
14.1
4.2 4.3
19.2
-19.9
Source: UNCTAD (forthcoming), Key Statistics and Trends in International Trade 2018 Note: Remark: the blue-shaded area represents UNCTAD estimates for the years 2018-2020.

INTERNATIONAL TRADE AS AN ENGINE FOR DEVELOPMENT
101
ucts were sourced in LDCs). Certain preferential rules of origin remain restrictive by requiring a “substantial” de-gree of transformation of a product to take place within an LDCs. This may reduce the usefulness of preferential market access, particularly for products manufactured by LDCs. According to International Trade Centre (ITC) studies on non-tariff measures (NTMs) in over 60 countries, rules of origin and related certification re-quirements remain among the most recurring obstacles
to trade faced by MSMEs.4 With a view to improving transparency in preferential rules of origin, ITC, World Customs Organization and WTO launched the Rules of Origin Facilitator, which provides information on prod-uct-specific criteria, origin certification, cumulation, and other provisions that can allow businesses to reap the benefits of preferential treatment. 5
In addition to preferential tariff treatment, NTMs such as product-labelling standards and sanitary and phytosani-
Figure 2Share of LDCs and developing countries in World Trade, 2017(Percentage)
24
28
32
36
40
44
48
0.4
0.6
0.8
1.0
1.2
1.4
1.6
Dev
elop
ing
regi
ons
Leas
t dev
elop
ed c
oun
trie
s (L
DC
s)
Least developed countries (LDCs)
In merchandise export
Developing regions
2000 2002 2004 2006 2008 2010 2012 2014 2016
In service exports
20
27
34
41
0.4
0.9
1.4
1.9
Dev
elop
ing
regi
ons
Leas
t dev
elop
ed c
oun
trie
s (L
DC
s)
Least developed countries (LDCs)Developing regions
2000 2002 2004 2006 2008 2010 2012 2014 2016
Source: ITC/UNCTAD/WTO.
Figure 3 Share of least developed countries exports receiving duty-free treatment(Percentage)
30
40
50
60
70
2005 2010 2015 2016 2017
Developing regions
Least developed countries
(a) Share of LDC exports (tariff lines) admitted duty free, by year
0
2
4
6
8
0
20
40
60
80
Perc
ent
chan
ge b
etw
een
(20
16 -
2017
)
Shar
e of
tari
ff l
ines
2017 Growth 2016-2017
(b) Share of LDC exports (tariff lines) admitted duty free, by product sectors
All pro
ducts
Clothing
Textiles
Agricultu
re
products
Industrial
Source: ITC/UNCTAD/WTO.

2019 FINANCING FOR SUSTAINABLE DEVELOPMENT REPORT
102
tary (SPS) measures exert a significant impact upon market access conditions facing LDCs. Technical assistance from development partners and value-chain managers to im-prove infrastructural, organizational, administrative and technical capabilities of LDCs would help them overcome the market restrictive impact of NTMs on their exports.
2 .3 Trade restricting and facilitating measuresWTO members implemented an increasing number of trade restrictive measures (totaling 137 new measures, equating to 11 new measures a month) from October 2017 to October 2018.6 Restrictive measures include tar-iff increases, quotas, import taxes and stricter customs regulations. The proliferation of trade-restrictive ac-tions and the uncertainty created by such actions could place economic recovery in jeopardy. Further escalation would carry potentially large risks for global trade, with knock-on effects for economic growth, jobs and con-sumer prices around the world.
While WTO members implemented 162 measures aimed at facilitating trade during the period, the esti-mated trade coverage of import-facilitating measures ($295.6 billion) is half that of trade-restrictive measures, which amounts to US$ 588.3 billion—more than seven times larger than that recorded a year ago.
There is a similar trend in initiations and termina-tions of trade remedy investigations by WTO members. Trade remedy measures cover (i) actions taken against dumping; (ii) subsidies and “countervailing” measures to offset subsidies; and (iii) emergency measures to limit imports temporarily, designed to “safeguard” do-mestic industries.7 They continued to be an important
trade policy tool for members accounting for about 63 per cent of all trade measures captured in the annual report by the WTO Director General.8 Initiations of anti-dumping investigations continue to be the most frequent trade remedy action. The recorded trade cov-erage of trade remedy initiations and terminations is estimated at $93.6 billion ($17 billion more than a year ago) and $18.3 billion ($6 billion more), respectively.Figure 4
Preferential tariff margins for LDC exports in devel-oped-country markets(Percentage)
0%
1%
2%
3%
4%
5%
6%
7%
8%
2000 2005 2010 2011 2012 2013 2014 2015 2016 2017
Perc
enta
ge p
oint
s
Agricultural preferential margin
Clothing preferential marginIndustrial preferential margin
Textile preferential margin
Source: ITC.
Figure 6Trade coverage of import-restrictive and import-facili-tating measures(Billions of United States dollars)
0
100
200
300
400
500
600
Import-restrictive Import-facilitating
mid-Oct 14 mid-Oct 15 mid-Oct 16 mid-Oct 17mid-Oct 15 mid-Oct 16 mid-Oct 17 mid-Oct 18
Source: WTO Secretariat. Note: Values are rounded. Changes to averages of previous years reflect continuing fine tuning of, and update to, the Trade Monitoring Database.
Figure 5 Trade-restrictive and trade-facilitating measures, excluding trade remedies 2012-2018(Average number per month)
0
5
10
15
20
25
2012 2013 2014 2015 2016 2017 mid-Oct16
to mid-
Oct17
mid-Oct17
to mid-
Oct18
Facilitating Restrictive
14 15 14
19
1210 9 11
17
12
16
21
16
1211
14
Source: WTO Secretariat. Note: Values are rounded. Changes to averages of previous years reflect continuing fine tuning of, and update to, the Trade Monitoring Database.
INTERNATIONAL TRADE AS AN ENGINE FOR DEVELOPMENT
103
3. The multilateral tradingsystemThe multilateral trading system provides the constitu-tion for global trade, establishing shared principles which underpin trading practices around the world. It provides a global forum for discussion and debate on trade issues, along with mechanisms for countries to monitor and review each other’s trade policies and the means to settle disputes when they arise. Its current crisis put trade prospects at risk but presents an oppor-tunity to emerge with a strengthened and reinforced system.
3 .1 The multilateral trading system in crisisThe year 2018 cast doubt over the future of a sound mul-tilateral trading system under WTO. The world faces a potential trade war among large economies. The fact that China and the United States of America agreed in December 2018 to halt their reciprocal tariff increase for 90 days is good news but falls short of eliminating the risk of a trade war. A continued escalation would risk a major economic impact, threatening jobs and growth in all countries, as well as the attainment of the SDGs. Just for Asia and the Pacific alone, estimates of the United Nations Economic and Social Commission for Asia and the Pacific (ESCAP) show that, at a minimum, the region will face a net loss of 2.7 million jobs if the trade tensions are not resolved, with employment losses 66 per cent higher for unskilled workers than for skilled workers.9
Nonetheless, the current situation is putting a new focus on the multilateral trading system as a place where solutions may be found. Business associations are call-ing on Governments to refrain from putting up new barriers. A high-level conversation about WTO reform or modernization is beginning to emerge, which can address some of the trade problems that some members have identified. However, a conversation focused on technical issues is not going to provide a way out of the current political crises. A solution would require a po-litical commitment and may require hard compromises.
As WTO members discuss these challenges, they will also have to address the threat to the dispute settle-ment system of the WTO. This system is the mechanism through which members hold each other to account for perceived infractions, and preventing trade disputes from escalating into more serious confrontations. Many disputes are resolved before they reach the litigation stage, in part because the rules and precedents of the dispute settlement system provide a framework within which parties can shape agreements. When disputes do proceed to the settlement system, compliance with rul-ings is very high, with about 90 per cent of the rulings already fully implemented.
Despite being effective and in high demand, the dispute settlement system may soon be paralyzed. The appointment process for the Appellate Body—the body
of adjudicators which hears appeals to dispute cases—is currently blocked. As some of the Appellate Body judge’s terms come to an end, the number of judges will soon fall below the minimum of three judges needed to hear an appeal.
These threads must come together in the conversa-tions ahead about improving the WTO. The world needs the WTO and the multilateral trading system that it underpins. Members must use this moment of crisis to strengthen global cooperation on trade, which ultimate-ly is in the interest of all and remains a crucial element in the attainment of the 2030 Agenda for Sustainable Development.
3 .2 Progress on multilateral trade negotiationsWhile progress in many areas of trade negotiations has been slow, some major deals have been reached in recent years under the WTO, including the Trade Facilitation Agreement; the abolition of agricultural export subsi-dies; and the expansion of the Information Technology Agreement to cover additional products, for which trade is valued at over $1.3 trillion per year.10 Acknowledg-ing the importance of gender-responsive policies, WTO members and observers also endorsed in 2017 a collec-tive initiative to increase the participation of women in trade - the Buenos Aires Declaration on Trade and Women’s Economic Empowerment, which expresses ways of collaborating among countries to make trade and development policies more gender-responsive.
Nonetheless, the WTO Ministerial Conference in Buenos Aires in 2017 highlighted fundamental differ-ences and divisions among the members, notably on certain issues under the agricultural negotiation pillar. Renewed efforts are required to move beyond these dif-ferences and make progress on a range of issues vital for growth and development.
In agriculture, a new model for advancing negotia-tions has been proposed, following a series of thematic sessions held in the second half of 2018, with the estab-lishment of seven working groups for a trial period from January to April 2019. These working groups are expect-ed to address Domestic Support, Public Stockholding for Food Security purposes, Cotton, Market Access, Special Safeguard Mechanism, Export Competition and Export Restrictions. An outcome in agriculture negotia-tions would notably contribute to SDG 2 (zero hunger) and SDG 17 (partnerships for the goals).
In negotiations on fisheries subsidies, three consecu-tive work programmes covering work from May 2018 to July 2019 were established. These aim at putting mem-bers in a position to meet the deadline of end-2019 as set out in target 14.6 of the SDGs and reaffirmed at the Min-isterial Conference in Buenos Aires. This will require full engagement of all delegations and should contribute to SDG 14 (life below water) by reaching an agreement that prohibits certain forms of fisheries subsidies that contribute to overcapacity and overfishing and elimi-nates subsidies that contribute to illegal, unreported and

2019 FINANCING FOR SUSTAINABLE DEVELOPMENT REPORT
104
unregulated-fishing with appropriate and effective spe-cial and differential treatment for developing-country members and LDC members.
4. Bilateral and regional trade and investment agreements4 .1 Regional trade agreementsThe slow progress in multilateral negotiations is partly responsible for the proliferation of bilateral, regional and interregional free trade and investment agreements, which have increased since the early 1990s. As of Janu-ary 2019, 291 regional trade agreements are in force.11
Trade tensions and uncertainties about the mul-tilateral system have given a new impetus to regional integration initiatives. For example, there is a clear trend in China and other Asian economies that appear to speed up the negotiation and implementation of trade deals with each other.12 A number of trade agreements among major economies recently entered into force, such as the Comprehensive and Progressive Agreement for Trans-Pacific Partnership (CPTPP) (on 30 December 2018), the EU-Canada Comprehensive Trade Agreement (CETA) (provisionally on 21 September 2017), and the EU-Japan Economic Partnership Agreement (1 Febru-ary 2019). Recently concluded negotiations include the African Continental Free Trade Area (AfCFTA) (21 March 2018) and the United States-Mexico-Canada Agreement (USMCA) (30 November 2018).
Regional and bilateral trade agreements can be aligned with sustainable development, including the environment, climate change, labour rights and gender (box 1).
4 .2 Investment agreementsInternational investment agreements (IIAs) are origi-nally meant to promote investment by reinforcing investor confidence through increased stability, pre-dictability and transparency of host country regulatory actions.
By reducing investors’ risks—for example by offering international arbitration for the purpose of investor-State dispute settlement (ISDS)—IIAs aim to increase investment, especially in countries without strong rule of law. The most common type of these agreements is bilateral investment treaty (BIT), with close to 3,000 signed so far.13
As the increase in the number of ISDS cases during the last 15 years shows, there has been a concern that IIAs could restrict the regulatory space of Governments, including social and environmental regulation neces-sary to achieve the SDGs. Against this background, in the Addis Agenda, Member States committed to “…en-deavour to craft trade and investment agreements with appropriate safeguards so as not to constrain domestic policies and regulation in the public interest”.14
Recently, the pace of agreeing on a new investment treaty has been reduced, which may signal a period of reflection and review of international investment poli-cies.15
Change is also underway regarding the treaty con-tent. Since 2012, over 150 countries have undertaken at least one action in the pursuit of sustainable de-velopment–oriented treaty making, as set out in the UNCTAD Investment Policy Framework for Sustain-able Development and its updated Reform Package for the International Investment Regime.16 The Reform Package proposes three phases of reforms.
Box 1
Gender and regional trade agreementsRegional trade agreements (RTAs) may ignite new trade flows, which can affect women’s well-being and empowerment in their various economic roles as workers, producers, entrepreneurs, consumers and taxpayers. Recent United Nations Conference on Trade and Development (UNCTAD) studies on South-South RTAs found that the reduction of in-traregional tariffs led to a “feminization of labour”, i.e., an overall increase in women’s employment share in manufacturing firms, but only for produc-tion (or manufacturing) workers, which tend to be lower-skilled and lower-paid than workers per-forming administrative or managerial tasks.a
These findings reconfirm the need to reflect gender specific impacts in RTAs. Today, an increas-
ing number of RTAs contain chapters addressing the importance of gender mainstreaming in trade policy and the scope of gender-related provisions has expanded significantly (e.g., Chile-Uruguay and Chile-Canada free trade agreement). In 2018, the European Parliament adopted a resolution aimed at better accounting for gender equality in its trade agreements. It is also important to ensure the enforcement of gender-related provisions. The Canada-Israel Free Trade Amending Protocol, signed in 2018, makes the gender chapter subject to a dispute settlement mechanism, which increases its enforceability.a UNCTAD country case studies include Angola, Bhutan, Cape Verde, Gambia, Lesotho, Rwanda and Uruguay. Regional studies include the Common Market for Eastern and Southern Africa (COMESA), EAC, SADC and Mercosur in Latin America. See East African Community Regional Integration: Trade and Gender Implications (UNCTAD/DITC/2017/2) and Teaching Material on Trade and Gender Volume 1: Unfolding the links, Module 4b: Trade and Gender Linkages: An Analysis of Southern African Development Community (UNCTAD/DITC/2018/1) for more detail.

INTERNATIONAL TRADE AS AN ENGINE FOR DEVELOPMENT
105
Phase I: Improving approaches to new IIAsCountries have started to negotiate new and modern IIAs. These agreements typically include a sustainable devel-opment orientation (e.g., clarifying that IIAs should also aim to foster investment for sustainable development), preservation of regulatory space (e.g., including public policy exceptions) and improvements to or omissions of ISDS. This is in striking contrast to treaty making at the turn of the millennium. A comparison between 13 IIAs concluded in 2017 and a sample of 13 IIAs concluded in 2000 shows remarkable differences, as seen in figure 8.
In addition to the reform-oriented elements pre-sented in figure 8, some recent IIAs contain innovative features that were rarely encountered before. These new features can help strengthen the SDG contribution of the investment protected under the treaty. These include
� Conditioning treaty coverage on investors’ contri-bution to sustainable development, requiring thatcovered investment contribute to the host state’s econ-omy or sustainable development;17
� Fostering responsible investment, including a “bestefforts” obligation for investors to respect the humanrights of the people involved in investment activitiesand promote the building of local capacity and human capital (e.g., Intra-MERCOSUR Investment Facilita-tion Protocol 2017);
� Facilitating counterclaims by the respondent partyagainst the claimant investor, for instance by request-
ing the investor’s consent for counterclaims when it submits a claim for dispute resolution (e.g., Colombia-United Arab Emirates BIT 2017).
Phase II: Modernizing the existing stock of IIAsAn increasing number of countries have also embarked on the second phase of IIA reform, shifting policy at-tention towards comprehensively modernizing the stock of outdated first-generation treaties. The UNCTAD Reform Package sets out 10 policy actions to this end. Examples include
� Jointly interpreting treaty provisions to clarify the con-tent and narrow the scope of interpretative discretion of tribunals. Countries have not only developed and some-times adopted joint interpretative statements of existing IIAs (e.g., Bangladesh and India Joint InterpretativeNotes 2017), but have also strengthened the basis forbinding interpretations in recently concluded treaties;18
� Amending treaty provisions: Although amendmentswere used relatively sparingly in the bilateral context,they were used in important regional IIAs. For exam-ple, in the CPTPP, individual parties agreed throughbilateral side letters to terminate existing BITs, exclude the application of ISDS provisions or provide for tai-lored ISDS provisions;
� Replacing outdated treaties: Since 2012, some 30 out-dated IIAs have been replaced by more modern treaties (e.g., in 2018, Turkey replaced three outdated BITs
Figure 7 Number of signed international investment agreements (IIAs), 1980-2018(Number of IIAs)
0
800
1600
2400
3200
4000
0
50
100
150
200
250
1980 1982 1984 1986 1988 1990 1992 1994 1996 1998 2000 2002 2004 2006 2008 2010 2012 2014 2016 2018
Cumulative number of IIAsAnnual number of IIAs
Annual BITs Annual TIPs Cumulative all IIAs
Source: IIA Navigator, UNCTAD (2018) (BIT stands for Bilateral investment treaties and TIPs for Treaties with investment provisions).Note: Preliminary data for 2018. The cumulative number of all signed IIAs, independently of whether they have entered into force, is 3,339. IIAs for which termination has entered into effect are not included.

2019 FINANCING FOR SUSTAINABLE DEVELOPMENT REPORT
106
Sele
cted
asp
ects
of I
IAs
1. R
efer
ence
s to
the
prot
ectio
n of
hea
lth a
nd sa
fety
, lab
our r
ight
s, en
viro
nmen
t or s
us-
tain
able
dev
elop
men
t in
the t
reat
y pr
eam
ble
2. R
efine
d de
finiti
on o
f inv
estm
ent (
e.g. r
efer
ence
to c
harc
ter o
f inv
estm
ent;
exc
lusio
n of
por
tfolio
inve
stm
ent,
sove
reig
n de
bt o
blig
atio
ns o
r cla
ims t
o m
oney
ari
sing
sole
ly
from
com
mer
cial
cont
ract
s)3.
Circ
umsc
ribed
fai
r an
d eq
uita
ble
trea
tmen
t (w
ith r
efer
ence
to
cust
omar
y in
tern
a-tio
nal l
aw (C
IL),
equa
ted
to th
e m
inim
um st
anda
rd o
f tre
atm
ent o
f alie
ns u
nder
CIL
or
clar
ified
with
a lis
t Sta
te o
blig
atio
ns4.
Cla
rific
atio
n of
wha
t doe
s and
doe
s not
cons
titut
e an
indi
rect
expr
opria
tion
5. D
etai
led
exce
ptio
ns fr
om th
e fre
e-tr
ansfe
r-of
-fund
s obl
igat
ion,
incl
udin
g ba
lanc
e-of
-pa
ymen
ts d
ifficu
lties
and
/or e
nfor
cem
ent o
f nat
iona
l law
s
6. O
miss
ion
of th
e so-
calle
d “u
mbr
ella
” cla
use
7. G
ener
al ex
cept
ions
, e.g
. for
the p
rote
ctio
n of
hum
an, a
nim
al o
r pla
nt li
fe o
r hea
lth; o
r th
e con
serv
atio
n of
exha
ustib
le n
atur
al re
sour
ces
8. E
xplic
it re
cogn
ition
tha
t pa
rtie
s sh
ould
not
rel
ax h
ealth
, saf
ety
or e
nviro
nmen
tal
stan
dard
s to
attr
act i
nves
tmen
t9.
Pro
mot
ion
of c
orpo
rate
and
soci
al re
spon
sibili
ty st
anda
rds b
y in
corp
orat
ing
a se
pa-
rate
pro
visio
n in
to th
e IIA
or a
s a g
ener
al re
fere
nce i
n th
e tre
aty
prea
mbl
e10
. Lim
iting
acce
ss to
ISD
S (e
.g. li
miti
ng tr
eaty
pro
visio
ns su
bjec
t to
ISD
S, ex
cludi
ng p
olic
y ar
eas f
rom
ISD
S, li
miti
ng ti
me p
erio
d to
subm
it cla
ims,
omitt
ing a
n IS
DS m
echa
nism
)11
. Spe
cific
pro
activ
e pro
visio
ns o
n in
vest
men
t pro
mot
ion
and/
or fa
cilit
atio
n.
Sour
ce: U
NC
TAD
.N
ote:
BIT
s list
ed fo
r 200
0 ar
e a sa
mpl
e of I
IAs s
igne
d in
that
year
. IIA
s list
ed fo
r 201
7 ar
e tho
se co
nclu
ded
in th
at ye
ar fo
r whi
ch te
xts a
re av
aila
ble;
this
list d
oes n
ot in
clud
e “fr
amew
ork
agre
emen
ts” th
at la
ck su
bsta
ntiv
e in
vest
men
t pro
visio
ns. A
vaila
ble
IIA te
xts c
an b
e ac
cess
ed at
UN
CTA
D’s
IIA N
avig
ator
at h
ttp://
inve
stm
entp
olic
yhub
.unc
tad.
org/
IIA.
The
scop
e an
d de
pth
of c
omm
itmen
ts in
eac
h pr
ovis
ion
varie
s fr
om o
ne II
A to
ano
ther
.
Figu
re 8
Refo
rm-o
rien
ted
prov
isio
ns in
IIA
s con
clud
ed in
200
0 an
d in
201
7
12
34
56
78
910
11
Arg
entin
a–Ch
ile F
TA
ASE
AN
–Hon
g-Ko
ng, C
hina
Inve
stm
ent A
gree
men
t
Buru
ndi–
Turk
ey B
IT
Chin
a–H
ong
Kong
, Chi
na In
vest
men
t Agr
eem
ent
Colo
mbi
a–U
nite
d A
rab
Emira
tes
BIT
Intr
a-M
ERCO
SUR
Inve
stm
ent F
acili
tatio
n Pr
otoc
ol
Isra
el–J
apan
BIT
Jord
an–S
audi
Ara
bia
BIT
Moz
ambi
que–
Turk
ey B
IT
Paci
�c A
gree
men
t on
Clos
er E
cono
mic
Rel
atio
ns P
lus
Rwan
da–U
nite
d A
rab
Emira
tes
BIT
Turk
ey–U
krai
ne B
IT
Turk
ey–U
zbek
ista
n BI
T
Yes
No
Not
app
licab
leYe
sN
oN
ot a
pplic
able
2000
2017
12
34
56
78
910
11
Aus
tria
–Ban
glad
esh
BIT
Bela
rus–
Sing
apor
e BI
T
Brun
ei D
arus
sala
m–C
hina
BIT
Chile
–Dom
inic
an R
epub
lic B
IT
Cuba
–Par
agua
y BI
T
Ethi
opia
–Tur
key
BIT
Gre
ece–
Mex
ico
BIT
Indi
a–La
o Pe
ople
’s D
emoc
ratic
Re
publ
ic B
IT
Italy
–Lib
ya B
IT
Mal
aysi
a–Sa
udi A
rabi
a BI
T
Mon
golia
–Phi
lippi
nes
BIT
Nig
eria
–Sw
itzer
land
BIT
Rwan
da–S
outh
Afr
ica
BIT

INTERNATIONAL TRADE AS AN ENGINE FOR DEVELOPMENT
107
with Kyrgyzstan, Lithuania and Serbia). A prominent example is the USMCA, replacing the North American Free Trade Agreement (NAFTA) with some changes (e.g., ISDS will be available only between Mexico and the United States with limited grounds for bringing claims and the necessity to resort first to local rem-edies and with time limitations applicable to it) and additions (e.g., a corporate social responsibility clause that recognizes the importance of promoting respon-sible business conduct);
� Referencing global standards: At least nine recent IIAs refer to specific global standards such as the SDGs(e.g., Morocco-Nigeria BIT 2016). Such referencingcan help shape the spirit of the treaty and influenceinterpretation by arbitral tribunals. However, this does not necessarily create legal clarity;
� Engaging multilaterally: There are several multilat-eral discussions on investment ongoing. Some havean IIA reform dimension, including the InternationalCentre for Settlement of Investment Disputes (ICSID) proposal for amendment of its Rules,19 the UnitedNations Commission on International Trade and Law(UNCITRAL) Working Group III Discussions on Pos-sible Reform of ISDS,20 and the Fourth Open-EndedIntergovernmental Working Group on TransnationalCorporations and the Business Enterprises withRespect to Human Rights.
Phase III: Ensuring investment policy coherence and synergiesStriving for policy coherence does not necessarily imply legal uniformity. Inconsistencies and divergence may be intended. However, different policy areas and legal instruments should work in synergy. The UNCTAD Reform Package offers three prongs of action for im-proving overall policy coherence:
� Enhancing coherence within national IIA networks;
� Maximizing synergies between the IIA regime and the national legal framework for investment;
� Managing the interaction between IIAs and otherbodies of international law that affect investment.
Investment policy makers have been sharing experiences and building consensus on sustainable development-oriented IIA reform at the UNCTAD Annual High-level IIA Conferences.
5. Facilitating internationaltrade5 .1 Trade financeAccess to trade finance is a key enabler of international trade, with about 80 per cent of trade requiring short-
term credit or a guarantee. This would imply that $14 trillion in trade finance is needed to finance $18 trillion in annual trade flows. The most well-known instru-ment, the letter of credit, typically serves to mitigate risks for both exporter and importer—for example, by guaranteeing that goods are shipped before the payment is processed. However, there has been a gradual shift in the conduct of international trade finance activity away from using paper-intensive products to payment and financing on open account terms. In this context, buyer and seller agree to payment at a specific stage in the trade transaction without verification of the docu-ments involved in a documentary credit transaction. This has led to the development of what is referred as supply chain finance solutions. According to a survey of market participants, traditional trade finance, such as letters of credit, still represents the lion’s share of re-spondent activities in this area—85 per cent versus 15 per cent in supply chain finance.21
Among supply chain finance solutions, the fast-est-growing techniques is payables finance, whereby suppliers, often strategic, are asked to accept extended payment terms. At the same time, they are invited to participate in a payables finance programme and offered the option to secure immediate payment by discounting outstanding invoices at rates based on the credit stand-ing of the large buyer; therefore the cost of finance is significantly less expensive than what the supplier could normally arrange. Payable finance is thus a promising option for making affordable trade financing available to small and medium-sized enterprises (SMEs).
Technology has facilitated the transformation in trade financing away from paper-intensive products, through data analytics and platform-based auction-ing for instance. However, technology has yet to deliver its full potential to digitalize trade finance operations. For example, only 9 per cent of banks reported that the technology solutions implemented have so far led to a re-duction of time and costs in trade finance transactions.22
The evolution of trade finance is timely. It is estimat-ed that, as of 2017, the global trade finance gap is about $1.5 trillion.23 This represents the amount of trade fi-nance that was requested by importers and exporters but rejected. A significant share of existing trade finance is served by banks (about $9 trillion) the remainder is intercompany lending. In many developing countries, the alternatives to bank financing are scarce, so when rejected by banks, trade transactions are often aban-doned.
The gap in trade finance has increased since the glob-al financial crisis, as large banks traditionally active in trade finance reduced lending after the crisis and also cut their networks of correspondent bank relationships, particularly in developing countries (due in part to anti-money laundering regulations in a phenomenon called de-risking, discussed in chapter III.F). This severely af-fects the provision of trade finance in certain regions, such as some sub-regions of Africa, the Caribbean, Cen-tral and developing East Asia, the Middle East, and the Pacific Islands.

2019 FINANCING FOR SUSTAINABLE DEVELOPMENT REPORT
108
Trade finance gaps also disproportionately affect SMEs: 60 per cent of trade finance requests by SMEs are rejected, against only 7 per cent for multinational companies. Similarly, woman-owned firms face more frequent rejection for their trade finance proposals.24 A survey of nearly 15,000 business executives in 141 econ-omies indicates that lack of trade finance is among the top three obstacles to exporting for half of the countries in the world.25
To fill these gaps, WTO has led multilateral efforts to mobilize resources for trade finance and advocated in favour of larger support by MDBs, which have increased their activity in trade finance by almost 50 per cent in two years—up to $30 billion. However, this amount re-mains small relative to the estimated financing gap of $1.5 trillion. These efforts have benefited SMEs; for ex-ample, the Asian Development Bank supported trade transactions from more than 2,800 SMEs in 2017.
Trade finance facilitation programmes mostly pro-vide risk mitigation capacity (guarantees) to both issuing and confirming banks, and allow for rapid endorsement of letters of credit. The MDB guarantee ensures that the bank (typically the bank of the exporter) agreeing to confirm a letter of credit (typically issued by the bank of the importer) will be paid even if the issuer defaults. Such guarantees are rarely activated but are valuable because they reduce the risk of conducting trade opera-tions in low-income countries.
However, the long-term solution to filling trade fi-nance gaps is to bring the private sector back into more challenging markets. One barrier to increased trade fi-nance is the relatively high cost of capital on trade finance in Basel capital requirements for commercial banks. This in part reflects incomplete and limited data in the asset class, particularly for some countries in Af-rica, Central and South America, and the Middle East. Nonetheless, available data shows that default rates on trade finance are generally below defaults in other asset
classes. Available data shows that the default rate on let-ters of credit is relatively stable over time, at 0.2 per cent, the majority of which is recovered through the sale of the underlying asset. Such a default rate is one of the lowest in the financial industry. While the average de-fault rate on short-term import and export loans was 0.8 per cent, about four times as high as letters of credit, this rate is still lower than the average default rate on corpo-rate loans. Further improving data on trade finance credit risks could help make it possible to lower the cap-ital charge for these products.
To address capital requirement issues, one option that is also gaining traction is for trade finance banks to sell off assets, including trade loans, to create capacity to un-derwrite new business. Although this asset distribution market has historically been a bank-to-bank market, with financial institutions selling their loans or loan portfolios to other banks, recent years have reflected a steadily growing interest among non-banks in buying or investing in trade finance assets. Some non-banks, like hedge funds, have created pools of capital specifi-cally aimed at investing in trade financing activity, thus
Table 2Risk characteristics of short-term trade finance products, 2008-2017
CATEGORYDefault
Rate
Implied maturity
(days)
Recovery Rate
Import and export letters of credit 0.22% 80 71%Loans for import/export 0.8% 120 45%Performance guarantees 0.36% 110 18%Total 0.46% 90 52%Source: WTO based on ICC Trade Register Reports’ averages (2013, 2015, 2017)
Table 1 Overview of the main trade facilitation programs (end 2017)
EBRD IFC IDB Invest ADB ITFC AfDB
Program title Trade Facilitation Program (TFP)
Global Trade Finance program (GTFP)+other programs
Trade Finance Facilitation Program (TFFP)
Trade Finance Program (TFP)
Trade Finance Program (TFP)
Trade Finance Program (TFP)
Number of countries in operation
26 85 21 22 51 49
Program commencement 1999 2005 2005 2004 2008 2013Number of transactions since commencement
21,000 57,000 1,770 16,700 602 1,650
Value of transactions/Trade Supported in 2017
$ 2.3 billion $14 billion $1 billion $4.5 billion $4.9 billion $ 1.8 billion
Number of confirming banks 800+ 1,400 100+ 240 NA 14Claims to date 2 – no losses Zero zero zero zero 1Source: Information collected by the WTO from partner institutions and from reports of the International Chamber of Commerce (notably the 2017 ICC Global Survey on Trade and Finance, ICC Banking Commission, Geneva). Note: ADB = Asian Development Bank, AfDB = African Development Bank, EBRD= European Bank for Reconstruction and Development, IDB = Inter-American Development Bank, IFC = International Finance Corporation, ITFC = International Islamic Trade Finance Corporation.

INTERNATIONAL TRADE AS AN ENGINE FOR DEVELOPMENT
109
creating new global capacity to finance international commerce. However, the evolution of trade finance as an asset class is still in a relatively nascent state.
A second impediment to trade finance is the collapse in correspondent banking due to global de-risking, which can be attributed in part to the cost of know-thy-customer (KYC) and other anti-money laundering rules. For example, failure to complete adequate KYC and KYCC (know your customer’s customer) checks was quoted as the reason for a drop in the provision of trade financing by 18 per cent of respondents to an international survey, while about 90 per cent of them mentioned regulatory and compliance requirements as a major obstacle to trade finance growth.26
Improving the capacity of local banks to comply with international norms could help address this and fill the trade finance gap. MDBs are committed to this objective, and trained nearly 2,600 professionals in 2017 across 85 countries. Efforts are also underway to see how to promote the standardization of KYC information in the trade finance space. Trade financing can be fur-thered with digitization and automation of transactions and due diligence. Electronic transactions can infuse efficiency, promote transparency, support better data collection, and enhance efforts to build security around data. Digital platforms and fintech can also reduce costs of due diligence and KYC processes, thus helping to re-verse the decline in correspondent banking. WTO, the International Finance Corporation and the Financial Stability Board are working together to promote the use of tools, at the national level, to reduce the cost of compliance for trade finance providers and minimize negative effects—particularly those impacting develop-ing and least developed countries and SMEs.
5 .2 Implementation of WTO Agreement on Trade FacilitationIn December 2013, WTO members concluded negotia-tions on a Trade Facilitation Agreement (TFA) at the Bali Ministerial Conference. The Agreement entered into force in February 2017 following its ratification by two thirds of the WTO membership. It contains provisions for expediting the movement, release and clearance of goods, including goods in transit. It also sets out mea-sures for effective cooperation between customs.
The Agreement includes unique special and differ-ential treatment measures that link implementation modalities for developing and least developed countries to their respective capacities. As such, these countries have the possibility to self-select implementation dates and to indicate needs for technical assistance support for capacity-building.
The Agreement also recognizes the need for donor members to provide assistance and support for capac-ity-building to help developing and least developed countries comply with their commitments. Examples of such assistance include the World Bank Trade Fa-cilitation Support Program and UNCTAD support for
setting up Trade Information Portals and for building the capacity of National Trade Facilitation Committees (NTFCs), which are responsible for monitoring the im-plementation of TFA provisions. Gender consideration could be further mainstreamed into initiatives and structures related to TFA implementation as the inten-sity of trade barriers differs between men and women.
To date, there is a 60.5 per cent rate of implementation of commitments under the TFA. This figure represents all developed-country members commitments as well as commitments from developing-country members and LDCs already due for implementation.
Box 2
Reducing trade costs through digital trade facilitation in Asia and the PacificIn Asia and the Pacific, trade facilitation and the digitalization of trade procedures have gained trac-tion. There has been progress in the implementation of the World Trade Organization (WTO) Trade Fa-cilitation Agreement (TFA), as well as a growing number of regional and subregional initiatives for facilitating the electronic exchange of information along international supply chains, including the ASEAN Single Window initiative and the Frame-work Agreement on Facilitation of Cross-border Paperless Trade in Asia and the Pacific.
Studies have found that full implementation of binding provisions under the WTO TFA would re-sult in a trade cost reduction of about 9 per cent, while implementation of both binding and non-binding TFA measures would reduce trade costs by about 15 per cent. When digital trade facilitation is fully implemented, covering all measures of TFA and those concerning paperless trade, the average trade costs reduction across countries in Asia and the Pacific increases to 26.2 per cent. This highlights the need for countries to be as ambitious as possible in trade facilitation reform.a
Cross-border paperless trade offers immense potential for enhancing trade facilitation and further reduction of trade costs. Digitizing trade processes towards paperless trade would not only improve transparency, streamline formalities, support trade finance, and facilitate institutional cooperation and coordination among different do-mestic government agencies, but would also build the foundation for effecting cross-border paperless trade within the region and beyond.Source: ESCAP. a United Nations Economic and Social Commission for Asia and the Pacific, “Digital Trade Facilitation in Asia and the Pacific”, Studies in Trade, Investment and Innovation No. 87 (Bangkok, 2017).

2019 FINANCING FOR SUSTAINABLE DEVELOPMENT REPORT
110
5 .3 Information and Communication Technology and E-commerceInformation and communications technology (ICT) have been rapidly changing the way firms do business. E-commerce (i.e., commercial transactions conducted electronically on the Internet) has been growing as part of the broader digital economy. Worldwide e-commerce sales in 2016 reached $25.7 trillion, about 90 per cent of which were in the form of business-to-business (B2B) e-commerce and 10 per cent in the form of business-to-consumer (B2C) sales.27 Cross-border B2C e-commerce in 2015 amounted to $189 billion, with some 380 million consumers making purchases on overseas websites.28
While these figures point to broad trends, e-com-merce remains hard to measure, and few developing countries collect relevant e-commerce statistics. One tool for monitoring the evolution of e-commerce is the UNCTAD B2C E-commerce Index. The Index, which measures an economy’s preparedness to engage in e-commerce,29 finds that all but one of the top ten de-veloping countries are from East or West Asia, and all are upper-middle-income or high-income economies. In Africa, the highest ranked country was Mauritius (fifty-fourth in the Index). Nine of the bottom ten countries in the ranking are African countries, reflecting the relative weakness of Africa in terms of e-commerce readiness.30 UNCTAD e-trade readiness assessments of seven Afri-can countries finds that the main challenges for these countries are (i) the persisting infrastructure gap and digital divide; (ii) inadequate regulatory and institu-tional frameworks; (iii) a weak enabling environment; and (iv) limited skills of both producers and consumers of digital products. These challenges particularly affect the ability of MSMEs to effectively participate in inter-national trade. Research by ITC in 2018 highlighted the need for an ecosystem with institutions that provide business support and skills training that allow MSMEs to benefit from technological changes.31
External support is needed to address these challenges. Currently, only 1 per cent of all funding provided by Aid
for Trade is allocated to ICT solutions. MDBs are invest-ing just 1 per cent of their total spending on ICT projects, with only about 4 per cent of this limited investment being spent on policy development.32 Improving e-commerce readiness could attract additional investments. Several of the top ten developing countries in the Index saw inflows of foreign direct investment into their e-commerce sec-tors in 2017, amounting to at least $1.7 billion.
On 25 January 2019, forty-nine WTO members, in-cluding many developing countries, declared that they would start a plurilateral negotiation on e-commerce.33 It is hoped that the negotiation, expected to commence in March 2019, will address issues important for en-hancing equitable participation of developing-country businesses, particularly MSMEs, and woman to global e-commerce.34
5 .4 Aid for TradeIn 2016, the most recent year for which data is available, Aid for Trade showed a slight decrease both in disburse-ments and in commitments, although the level is still significantly above the level in the base year of 2006. As called for in SDG (target 8.a), it is important to increase Aid for Trade support.for developing countries, in par-ticular least developed countries.
The objective of the Aid for Trade initiative is to help developing countries, and in particular LDCs, build the supply-side capacity and trade-related infrastructure they need to implement and benefit from WTO agree-ments, and to expand their trade.
The Aid for Trade Work Programme for 2018-2019 seeks to further develop analysis on how trade can con-tribute to economic diversification and empowerment, with a focus on eliminating extreme poverty, particu-larly through the effective participation of women and youth. It addresses how Aid for Trade can contribute to these objectives by addressing supply-side capacity and trade-related infrastructure constraints, including for MSMEs, particularly in rural areas. Other issues to be developed during the Work Programme will include
Box 3
Sustainable and climate-resilient infrastructure for maritime transportRising sea levels and extreme weather will affect maritime transport, an artery of international trade carrying over 80 per cent of merchandise trade volume. Small island developing States are at immediate risk.a Coastal transport infrastructure are critical lifelines to them, facilitating imports of essential goods and tourism. According to a survey conducted by UNCTAD, hazardous impact of climate change has already been felt by many ports.b With respect to adaptation measures, many ports identified hard engineering measures rather than soft adaptation responses as the main course of action. But the cost of developing measures for ‘climate proofing’ a port could be as high as $500 million. Few respondents to the survey had received any financial assistance in the implementation of adaptation measures. This suggests a need for more external assistance in this area.Source: UNCTAD.a Isavela Monioudi and others, “Climate change impacts on critical international transportation assets of Caribbean SIDS: The case of Jamaica and Saint Lucia”, Regional Environmental Change, 18:2211–2225 (2018).b United Nations Conference on Trade and Development, “Port Industry Survey on Climate Change Impacts and Adaptation”, UNCTAD Research Paper No. 18 UNCTAD/SER.RP/2017/18 (Geneva, 2017).

INTERNATIONAL TRADE AS AN ENGINE FOR DEVELOPMENT
111
industrialization and structural transformation, digital connectivity and skills, as well as sustainable develop-ment and access to energy. In addition to addressing persistent challenges, aid for trade needs to address emerging challenges to developing countries, such as strengthening climate-resilient infrastructure for mari-time transport (box 3).
The centrepiece of the Work Programme will be the Aid for Trade Global Review in July 2019, the results of which will be reported to the General Council and later on to the WTO Ministerial Conference.35
5 .5 Trade as a source of public revenueTaxes on international trade, such as customs duties and export taxes, are a direct linkage between trade and a country’s development financing capacity. Income from trade taxes remains an important contributor to public revenue in countries such as LDCs and small island de-veloping States (SIDS). Figure 9 presents a three-year average of taxes on international trade as a share of pub-lic revenue between 2014 and 2016. While taxes on international trade on average account for less than 4 per cent of public revenue globally, they account for 10 per cent in LDCs and about 15 per cent in SIDS. Trade taxes are most significant in some SIDS. For the Caribbean States, for example, trade-related taxes accounted for well over 25 per cent of total public revenue.
Raising taxes on trade to increase public revenue how-ever can be distortional to domestic economies. Higher import tax, for example, lowers consumer welfare and export competitiveness. The focus thus has been placed not on raising trade taxes but on improving efficiency in customs duty collection. Many countries have improved custom efficiency by using the UNCTAD Automated System for Customs Data, or ASYCUDA. For example, Jamaica collected 17 per cent more revenues from the previous year, upon the full ins talment of ASYCUDA in 2016.36 The customs revenue of Solomon Islands ex-ceeded $1 billion for the first time in 2017, three years
after installing ASYCUDA.37 After 13 years of gradual roll-out of ASYCUDA in Afghan customs, the system covered more than 90 percent of international trade in 2018, and contributed to the increase in Afghanistan’s an-nual customs revenue from $50 million in 2005 to almost $1 billion by 2018. Over 100 developing countries have installed ASYCUDA, which has brought transparency in customs management information, increased customs revenues and reduced trade costs facing the private sector (see box 3 on ASYCUDA in chapter III.G for more detail).
6. Promoting trade and investment in a manner consistent with the SDGsTrade is an important means to achieving a range of SDGs.
6 .1 Trade, economic growth, labour markets and poverty reductionOver the last decades, economic growth has been ac-companied by even faster growth in global trade, which enables more efficient resources allocation and supports the exchange of ideas and innovation. Countries with faster GDP per capita growth tend to have a high aver-age annual growth in merchandise exports as a share of GDP (figure 10).38 However, the correlation is less sig-nificant in countries whose average export growth as a percentage of GDP was below 2 per cent, including most countries in Africa and many in South America.
Figure 9 Taxes on international trade (3-year average, 2014-2016)(Percentage of revenue)
Small island developing states
Least developed countries
World
0 2 4 6 8 10 12 14 16
Source: UNCTAD calculation based on World Bank Databank.Note: World (2-year average: 2014-2015). Taxes on international trade include import duties, export duties, profits of export or import monopolies, exchange profits, and exchange taxes.
Figure 10 Growth of GDP and trade, 1945 to 2014(Average annual change in merchandise exports as share of GDP versus average annual change in real GDP per capita)
-3%
-2%
-1%
0%
1%
2%
3%
4%
5%
6%
7%
-2% - 1% 0% 1% 2% 3% 4% 5% 6%
Ave
rag
e an
nu
al c
han
ge
in m
erch
and
ise
exp
orts
as
shar
e of
GD
P
Average annual change in real GDP per capita (2011US$)
AfricaAsiaEuropeNorth AmericaOceaniaSouth America
Source: UN/DESA calculations based on data from the Maddison Project Database.

2019 FINANCING FOR SUSTAINABLE DEVELOPMENT REPORT
112
Historically, trade has proven to be an engine for developing countries’ economic growth, development and poverty reduction. Higher demand for commodi-ties, such as minerals, ores and fuels, resulted in higher prices in the 2000s, consequently boosting incomes in resource-exporting developing countries, including many LDCs. This rapid growth, fuelled in part by trade, contributed to an unprecedented reduction of poverty levels. Similarly, participating in apparel and textile GVCs has driven trade growth and job creation in many developing countries, including a number of LDCs such as Bangladesh, Cambodia and Lesotho.
Changes in trade and trade policy generate signifi-cant impact upon labour market and gender. There have been numerous efforts to delineate such impacts and to recommend policy option. The UNCTAD diagnostic tool is designed for assessing the impact of trade policy upon labour markets, while accounting for informal employment, a common and important phenomenon in developing countries that particularly affects women. ITC and the International Labour Organization (ILO) have used the ITC export potential assessment method-ology to estimate the job-creating impact of a country’s untapped export potential. Preliminary findings from five countries (i.e., Ethiopia, Jordan, Morocco, Lao People’s Democratic Republic and the Untied Republic of Tanzania) showed that for $22.7 billion of addition-al exports, 25.3 million of new jobs could be created. UNCTAD has developed the Trade and Gender Tool-box for an ex-ante gender impact assessment of trade reforms, which has been adopted in Sustainable Impact Assessment of the European Commission (box 4). Gen-der equality and women’s empowerment are critical for economic growth and development.
6 .2 Trade and inequalityWhile trade and economic growth have followed similar trajectories, there is a growing perception that benefits from international trade have not been shared equita-
bly and have required costly adjustments from some groups of workers. While manufacturing jobs in de-veloped countries grew in aggregate, specific sectors or regions lost jobs without sufficient policies to speed adjustment and cushion shocks, as some manufactur-ing facilities and jobs moved away from some regions and other jobs were created in other regions. This was perceived as leading to higher inequality in some devel-oped countries and fuelled criticism against the current multilateral trading system. Evidence on the impact of trade on a country’s aggregate labour markets indi-cates that trade tends to increase real wages and overall employment, though the impact varies according to country specific factors.39 Trade has also been shown to disproportionately benefit high-skilled employment and high-wage earners. For example, one study found that globalization has induced changes in labour income tax in developed countries that benefited the top 1 per cent of workers but resulted in higher tax burden for the rela-tively less mobile middle class.40 However, data shows that trade only explains a small portion of the growth in wage inequality.41
The dominance of global value chains (GVCs) in international trade, which distribute production of a final good across countries, and the way the revenue is distributed within value chains, may have deepened within-country income inequality, in both developed and developing countries.42 Figure 11 shows that, among high-income countries, the share of workers’ income at the fabrication stage in 2014 fell by 3.7 per-centage points from the level in 2000. On the other hand, the share of income received by professionals with the “headquarter” functions such as management, research and development and marketing, increased by 1.7 percentage points.
This deepening inequality across different tasks and functions, and the declining of labour income share—increasingly observed in middle-income countries as well—has in part been facilitated by growing market concentration, which has strengthened the bargaining
Box 4
Gender impact assessment and tradeCarrying out ex-ante and ex-post gender impact assessments of trade reforms makes trade policy more gender-re-sponsive. Ex-ante gender impact studies, which analyse the gender effects of trade reforms before the reform takes place, allows policymakers to design compensatory measures for expected negative impacts, or introduce comple-mentary measures to scale up expected positive impacts.
The European Commission has been carrying out Sustainability Impact Assessments (SIAs) of trade agreements under negotiation since 1999. In most cases, the gender assessment was limited to possible employment effects in specific sectors that traditionally attract a large female work force.a Recently, the European Commission started to apply the United Nations Conference on Trade and Development’s Trade and Gender Toolbox methodology in the SIA. For example, the SIA in support of the Modernization of the European Union-Chile Trade Agreement includes an assessment of the possible impact of the agreement on women in their different roles as employees, entrepreneurs, traders and consumers.a a BKP Development Research & Consulting, Sustainability Impact Assessment in Support of the Negotiations for the Modernisation of the Trade Part of the Association Agreement with Chile: Interim Report (Brussels, European Commission, 2018).

INTERNATIONAL TRADE AS AN ENGINE FOR DEVELOPMENT
113
power of a limited number of large firms that dominate trade. For example, the top 1 per cent of exporters ac-counted for 57 per cent of country exports on average in 2014, up from about 52 per cent in 2000.43 This growing market concentration has also exacerbated downward pressure on labour costs and effective corporate tax rates, as well as weakening of regulation and competi-tion policies in some countries (see chapter III.B).44
To increase trade’s contribution to sustainable devel-opment, and ensure it does not deepen inequality, trade policies and agreements should be crafted with global goals in mind. Trade and investment policies should not only align with the 2030 Agenda for Sustainable Devel-opment but should also be designed to be synergistic with policies related to finance, taxation, competition, labour, gender, and technology (see chapter III.F).
The issue of trade and inequality is compounded by the transformation that technology is bringing to the la-bour market (see chapter III.G). For example, evidence suggests that trade may explain up to 20–25 per cent of the recent decline in US manufacturing jobs, while oth-er factors such as technological change accounts for the rest.45 Through policy responses, Government can in-fluence how these changes ultimately impact inequality. This requires, for instance, investment in education and training to provide workers with skills that are in high demand. It also necessitates social protection policies to financially support those who have lost their jobs and ensure minimum wages. Investment in transport, tele-communications and energy also allow countries and people to better participate in international trade while rural infrastructure development creates more inclusive economic opportunities. This broad set of policies re-quired to address inequality needs to be incorporated into national sustainable development strategies.
Figure 11 Changes in the share of income in exported value added in manufacturing GVCs(Percentage points)
Source: UNCTAD, Trade and Development Report 2018. Note: “High income” covers 34 countries, including the high-income developing economies of the Republic of Korea and Taiwan, Province of China. “Other countries” includes two developed countries (Bulgaria and Romania) and six developing countries and transition economies (Brazil, India, Indonesia, Mexico, the Russian Federation and Turkey). All manufacturing sectors are included.
-4 -2 0 2
Capitalincome
Labour income:
Headquarter
Labourincome:
Fabrication
Capitalincome
Labour income:
Headquarter
Labourincome:
Fabrication
High income
-2 0 2
Other countries
0
20
40
60
80
100
2000 2014
High income
Labour income: FabricationLabour income: HeadquarterCapital income
0
20
40
60
80
100
2000 2014
Other countries

2019 FINANCING FOR SUSTAINABLE DEVELOPMENT REPORT
114
Endnotes1 United Nations Conference on Trade and Development, 2018 Handbook of Statistics (Geneva, 2018).2 World Trade Organization, World Trade Statistical Review 2018 (Geneva, 2018).
3 Ibid.4 See the ITC Series on Non-Tariff Measures at https://ntmsurvey.intracen.org/.5 See the Rules of Origin Facilitator at https://findrulesoforigin.org/.6 World Trade Organization, Annual Overview Report of the Director-General on trade-related developments, document
WT/TPR/OV/21.7 World Trade Organization, WTO E-learning: Trade Remedies and the WTO (Geneva, 2012).8 World Trade Organization, Annual Overview Report of the Director-General on trade-related developments, document
WT/TPR/OV/21.9 United Nations Economic and Social Commission for Asia and the Pacific, “Chapter 4: Policy development and poten-
tial impacts of trade tensions in Asia and the Pacific”, in Asia-Pacific Trade and Investment Report 2018: Recent trends and developments (Bangkok, 2018).
10 See World Trade Organization’s Information Technology Agreement.11 World Trade Organization, Regional trade agreements database. Available at https://www.wto.org/english/tratop_e/
region_e/region_e.htm#facts (accessed on 26 February 2019).12 United Nations Economic and Social Commission for Asia and the Pacific, “Chapter 4: Policy development and poten-
tial impacts of trade tensions in Asia and the Pacific”, in Asia-Pacific Trade and Investment Report 2018: Recent trends and developments (Bangkok, 2018).
13 This section refers to treaties that are concluded, irrespective of their entry into force.14 Addis Ababa Action Agenda of the Third International Conference on Financing for Development (Addis Ababa Action
Agenda) (United Nations publication, Sales. E.16.I.7), para. 91.15 United Nations Conference on Trade and Development, “Chapter III: Recent Policy Developments and Key Issues”, in
World Investment Report 2018 (Geneva, 2018).16 United Nations Conference on Trade and Development, UNCTAD’s Reform Package for International Investment Re-
gime 2018 Edition (Geneva, 2018).17 For example, see Burundi-Turkey BIT, Mozambique-Turkey BIT and Turkey-Ukraine BIT in 2017; Belarus-Turkey BIT,
Brazil-Suriname CFIA, Lithuania-Turkey BIT and Palestine-Turkey in 2018.18 For example, see Rwanda–United Arab Emirates BIT (2017); Australia–Peru FTA (2018); Republic of Korea–Republics
of Central America FTA (2018); and Lithuania-Turkey BIT (2018).19 Objectives of the process include modernizing the rules based on case experience, streamlining the process and mak-
ing it more efficient, enhancing the contracting parties’ control over the interpretation of their treaties and enhancing the legitimacy of the ISDS system. Topics under consideration include the appointment and disqualification of arbitra-tors, third-party funding, consolidation of cases, transparency and non-disputing party participation. See webpage on ICSID Amendments and statement by the SG of ICSID at the UNCTAD High-level International Investment Agree-ments Conference 2018 for more details.
20 Delegates at the UNCITRAL WG III meetings discussed three broad categories of concerns with respect to ISDS: 1) inconsistency and incorrectness of arbitral rulings; 2) concerns about arbitrators and decision makers who currently resolve disputes; and 3) concerns about the cost and duration of the process. Delegates agreed on the desirability of development reforms in UNCTIRAL with respect to those concerns. On 18 January 2019, the EU and its Member States submitted a paper to the working group, which sets out the EU’s proposal of establishing a permanent multilateral in-vestment court.
21 International Chamber of Commerce, 2018 Global Trade – Securing Future Growth – ICC Global Survey on Trade Fi-nance (Paris, 2018). The 10th edition of the ICC Global Survey on Trade Finance was realized between December 2017 and February 2018 and gathered inputs from 251 providers of trade finance and supply chain finance in 91 countries. On 18 January 2019, the EU and its Member States submitted a paper to the working group, which sets out the EU’s proposal of establishing a permanent multilateral investment court.
22 ibid.23 Asian Development Bank, 2017 Trade Finance Gaps, Growth, and Jobs Survey (Philippines, 2017).24 ibid25 World Economic Forum and the Global Alliance for Trade Facilitation, The Global Enabling Trade Report 2016 (Ge-
neva, 2016).26 International Chamber of Commerce, 2018 Global Trade – Securing Future Growth – ICC Global Survey on Trade Fi-
nance (Paris, 2018).27 United Nations Conference on Trade and Development, “Risks and benefits of data-driven economics”, 28 March 2018.

INTERNATIONAL TRADE AS AN ENGINE FOR DEVELOPMENT
115115
28 United Nations Conference on Trade and Development, Information Economy Report 2017: Digitalization, Trade and Development (New York and Geneva, 2017).
29 The index is based on the following four indicators which are highly related to online shopping and for which there is wide country coverage: (i) the share of the population which owns and account at a financial institution or with a mobile-money-service provider; (ii) the share of the population using the Internet; (iii) the reliability of postal services; and (iv) the availability of secure Internet servers per capita. The 2018 UNCTAD B2C E-commerce Index expanded the coverage to 151 economies, up seven from the 2017 edition, including forty-three African countries.
30 However, the continent is showing some progress in key indicators related to B2C e-commerce. Sub-Saharan Africa has surpassed world growth on three of the four indicators used in the Index since 2014.
31 International Trade Centre, SME Competitiveness Outlook: Business Ecosystems for the Digital Age (Geneva, 2018)32 Mukhisa Kituyi, “The Digital Divide Is Impeding Development”, Project Syndicate, 23 October 2018.33 World Trade Organization, Joint Statement on Electronic Commerce, document WT/L/1056.34 European Commission, “76 WTO members launch talks on e-commerce”, 25 January 2019.35 The review is focusing on Aid-for-Trade financing of trade policy and regulation, trade development, trade-related
infrastructure, building productive capacity, trade-related adjustment and other trade-related needs.36 Jamaica Gleaner, “Customs reports 17 per cent increase in revenue collection”, 22 May 2017.37 United Nations Conference on Trade and Development, “Solomon Islands customs agency collects record US$1 bil-
lion”, 01 March 2018.38 Esteban Ortiz-Ospina, “Does trade cause growth?”, Our World in Data, 22 October 2018.39 World Trade Organization, World Trade Report 2017: Trade, Technology and Jobs (Geneva, 2017).40 Peter Egger, Sergey Nigai and Nora M. Strecker, “The Taxing Deed of Globalization”, American Economic Review, vol.
109, no. 2 (February 2019).41 Elhanan Helpman, Globalization and Wage Inequality, background paper for the Keynes Lecture in Economics deliv-
ered to the British Academy, Harvard University and CIFAR, December 2016.42 United Nations Conference on Trade and Development, Trade and Development Report 2018: Power, Platforms and the
Three-Trade Delusion (New York and Geneva, 2018).43 Ibid.44 Ibid.45 World Trade Organization, World Trade Report 2017: Trade, Technology and Jobs (Geneva, 2017).


![Prod ucts Guid e - SHIKOKU CABLEmain/pdf/catalog_en.pdf · 5 6 0011 Satellite Broadcast Receivers ※Order proc ucts Model Inner Conductor C ons truc i [Nos./mm ] Insulator Diameter](https://img.dokumen.tips/doc/110x75/5edaf3f309ac2c67fa68930c/prod-ucts-guid-e-shikoku-cable-mainpdfcatalogenpdf-5-6-0011-satellite-broadcast.jpg)