Embed Size (px)
Citation preview

Third QuarTer 2017
CONSTRUCTION MARKET INTELLIGENCE
INTERNATIONAL REPORT

Rider Levett Bucknall | International Report – Third Quarter 20172 |
Cover: Brickell City Centre, Miami, Florida, USA
The Rider Levett Bucknall (RLB) International Report provides a half-yearly snapshot of construction market conditions and price movements around the world, via commentaries and analysis from Rider Levett Bucknall directors in key locations.
The RLB International Construction Cost Relativity Index is shown on page 6, with each location placed in its ranking spot in respect of all the other locations in the study.
A broad overview of global construction economic issues is provided on page 3 followed by a table of historical and forecasted movements in RLB’s Tender Price Index for key cities on page 7.
Building Cost Ranges and International Construction Cost Relativities are available in the RLB Intelligence Smartphone App and via the RLB Desktop WebApp.
Pages 8 and 9 feature Construction Rate Ranges for different key building types in cities within each region, providing an easy cost comparison between locations.
Pages 10 to 11 considers the wider issue of the construction activity cycle for seven building market sectors, in each location, using the RLB Construction Activity Cycle Model to provide an insight into each cities construction sectors position in the market cycle.
Further information can be found at rlbintelligence.com
Key economic data are highlighted on pages 12 & 13. This data describes the historical and projected economic conditions which the construction industry functions within those regions or countries.
From pages 15 to 49, RLB directors provide market intelligence commentary, highlighting the key issues that are impacting on the construction industry in major global cities together with providing information relating to current construction price movements.
GLOssARy OF TERMsGDP Gross Domestic ProductCPI Consumer Price Indexm o m month on monthy o y year on yearIMF International Monetary FundTPI RLB Tender Price Indexb Billions (109)m Millions (106)RBA Reserve Bank of Australia Fy Financial YearQ Quarter (3 month)

Rider Levett Bucknall | International Report – Third Quarter 2017 | 3
Global economic activity appears to be moving in a positive direction with cyclical recoveries in the global investment, manufacturing, and trade sectors, according to April’s International Monetary Fund’s (IMF) World Economic Outlook. Global activity is expected to rise from 3.1% in 2016 to 3.5% in 2017 and 3.6% in 2018. Stronger activity through global demand, falling deflationary pressures, and optimistic financial markets are all fuelling these positive sentiments.
These results are supplemented by Rider Levett Bucknall’s Q3 2017 International Report which highlights the continuing strengthening of the global construction industry. The Market Activity Cycle showcases RLB’s insight into the current positioning of the key construction sectors within the market activity cycle for 84 cities across the globe.
As highlighted in spider graph to the right, the global apartment sector is seen by 31 RLB offices as being in the peak zone (coloured red), whereas 22 cities see the housing sector in peak. The industrial sector is the weakest according to RLB across the globe with only 10 cities in peak and 41 cities in the trough zone, but as highlighted in the chart (Page 5 chart title ‘Growth sectors vs Decline sectors’), there are more cities indicating that the industrial sector is in a growth phase than a decline phase. Global infrastructure (civil sector) is positive as 46 cities have indicated that the civil sector is in the peak and mid zones (23 each) and 32 cities are in the trough zone.
Overall, 24% of all sectors across the globe are in the peak zone, with 33% in the trough zone.
Currently 365 sectors are within the growth zone across the globe representing 61% of total sectors highlighted in the pie chart on page 5. When reviewing individual sectors, the commercial sector appears the weakest, with almost as many cities within the decline zone than the growth zone. The houses, apartments, industrial, hotels and civil sectors have more than 50 cities within the growth zone and less than 35 cities in the decline zone.
Growth picked up in the United States as businesses are growing more confident about future demand, and inventories started contributing positively to growth. Growth also remained solid in the United Kingdom, where spending proved resilient in the aftermath of the June 2016 referendum in favour of leaving the European Union (Brexit). Activity surprised on the upside in Japan thanks to strong net exports, as well as in euro area countries, such as Germany and Spain, as a result of strong domestic demand.
A major threat to global growth is the increasing rise of protectionist trade policies. The risk associated with reduced trade and cross-border investment flows, mainly in advanced economies, may impact in slower global growth.
Headline inflation across the globe remains quite stable. In the majority of the advanced economies, headline inflation appears to have peaked in the first quarter of 2017 due in part to stabilising energy prices. In the major emerging markets, inflation
inTernaTional ConsTruCTionGLOBAL OUTLOOK
PEAK ZONE
MID ZONE
TROuGh ZONE
GloBal MarKeT aCTiViTY CYCle
NUMBER OF CITIES PER ZONE
142
201252
NUMBER OF CITIES PER ZONE
NET ZONE MOVEMENT Q4 2016 TO Q3 2017
NET ZONE MOVEMENT BY SECTOR Q4 2016 TO Q3 2017

4 |
ICC Sydney Convention Centre, Sydney, Australia
Architect: Hassell / Populous

Rider Levett Bucknall | International Report – Third Quarter 2017 | 5
is also mostly in decline, with Russia and Brazil emerging slowly from prolonged recessions. Looking ahead, a benign global environment of relatively low inflation is predicted to last for the next three years. This is reflected by the relatively stable global construction escalation forecasted by RLB as highlighted on page 7 of this report.
The global construction industry steadied in 2016, growing at 2.4%, according to the Construction Intelligence Centre, with construction volumes forecast to grow averaging 2.8% over the next five years. Growth will reflect trends in the wider economy as the world economy is set to expand by close to 3.0% per year on average from 2017 to 2021. However, there are a number of key risks; most notably the Chinese authority’s emphasis on reining in credit growth coupled with the slowing of overall growth within China.
Asia-Pacific continues to account for the largest share of the global construction industry, given that the region includes the significant markets of China, Japan and India. The pace of growth will slow in the region, partly due to the market dynamics currently in force within the residential sector in China. Offsetting this slowdown is a strengthening pipeline of infrastructure projects in the emerging economies of the Philippines, Indonesia and Malaysia.
Within the US, according to the report, construction growth is set to continue to record relatively solid growth. Canada’s construction industry is expected to edge slightly higher during 2017. Long term growth will be slower and uneven across the provinces, due to completion of major projects and a downturn in residential building.
Construction output within Western Europe is forecast to recover to 2008 levels in most markets, but this will not be the case in France, Italy, Spain, Greece or Portugal. The Eastern European construction industry will be relatively weak over the forecast period. This primarily reflects the troubled state of the Russian economy, weak commodity prices and political and economic uncertainties.
Construction activity in Brazil has been weak in recent years, following a sustained recession which resulted in a deteriorating business environment, weak investor confidence and reduction in construction activity. Weak commodity prices will constrain investment in new mining-related construction activity. However, Chile, Peru and Colombia will post solid growth over the forecast period, supported by the need for housing developments and improved infrastructure.
Although the Middle East and Northern Africa continue to show a strong construction industry, the pace of growth will fall from the significant expansion seen in the middle part of this decade. Efforts to shift from a reliance on fossil fuels has seen significant investment in infrastructure and non-oil industrial and commercial zones, which continues to drive construction activity in many countries in the Middle East and North Africa.
GloBal MarKeT aCTiViTY CYCleGROWTH SECTORS VS DECLINE SECTORS
GROWTh DECLINE
229
345
GROWTH SECTORS VS DECLINE SECTORS
NET GROWTH/DECLINE MOVEMENT PER SECTOR
Q4 2016 TO Q3 2017

Rider Levett Bucknall | International Report – Third Quarter 20176 |
rlB inTernaTional ConsTruCTionCOST RELATIVITIES
Rider Levett Bucknall’s Construction Cost Relativity Index identifies the relative cost of constructing similar buildings across the globe. The index is based on the local costing of standard building models. These models are costed worldwide using the same quantities and similar specifications. The models are costed in local currencies and relativities calculated using a combination of statistical methods including: § Conversion into ‘one currency’ method by converting local currency model costs using USD and IMF’s published Purchasing
Power Parity (PPP). § RLB developed EKS multilateral index § RLB Relativity Factor, a weighted sum of ‘one currency’ results.
The resultant index highlights the relativity in construction costs between key global cities.
236
193
189
189
177
165
171
164
160
157
155
155
147
137
137
135
133
133
132
129
127
125
121
120
118
118
117
115
117
115
113
113
113
111
111
111
108
106
104
103
91
91
90
82
80
77
74
64
OSLO
NEW YORK
HONOLULU
SAN FRANCISCO
PARIS
LONDON
BERLIN
BOSTON
CHICAGO
HONG KONG
WASHINGTON DC
LOS ANGELES
BRISTOL
MANCHESTER
MACAU
DUBLIN
BIRMINGHAM
SYDNEY
MOSCOW
SEATTLE
DARWIN
DOHA
CANBERRA
MADRID
PERTH
MELBOURNE
WELLINGTON
PORTLAND
CHRISTCHURCH
RIYADH
ADELAIDE
DUBAI
TOWNSVILLE
AUCKLAND
DENVER
BRISBANE
PHOENIX
LAS VEGAS
SINGAPORE
ABU DHABI
BUDAPEST
SHANGHAI
BEIJING
GUANGZHOU
SHENZHEN
KUALA LUMPUR
HO CHI MINH CITY
JAKARTA
2502252001751501251007550

Rider Levett Bucknall | International Report – Third Quarter 2017 | 7
afriCa 2015 2016 2017 (f) 2018 (f) 2019 (f) 2020 (f)CAPE TOWN 6.0 7.3 NP NP NP NPJOhANNEsBuRG 7.2 6.4 7.9 7.0 7.6 10.9MAPuTO 4.0 4.0 4.0 4.0 NP NPPORT LOIus 5.5 6.0 6.0 6.0 6.0 6.0PRETORIA 7.2 7.5 8.0 4.8 4.8 NP
aMeriCasBOsTON 4.0 4.0 3.5 4.0 4.0 4.0CALGARy NP NP 1.5 2.0 2.0 2.0ChICAGO 4.1 4.3 5.0 4.0 4.0 4.0DENvER 4.9 5.0 3.0 3.0 3.0 3.0hONOLuLu 8.2 0.7 1.0 2.0 2.0 2.0LAs vEGAs 4.4 3.3 3.0 5.0 5.0 5.0LOs ANGELEs 5.2 8.4 5.0 4.0 4.0 4.0NEW yORK 3.9 3.9 3.5 4.0 4.0 4.0PhOENIx 3.7 3.7 3.0 3.5 3.5 3.5PORTLAND 4.6 4.6 5.0 4.0 4.0 4.0sAN FRANCIsCO 9.4 14.7 5.0 4.5 4.5 4.5sEATTLE 4.9 4.7 5.0 4.0 4.0 4.0TORONTO NP NP 1.5 3.0 3.0 3.0WAshINGTON DC 4.4 4.3 4.0 4.0 4.0 4.0
asiaBEIJING (1.0) (0.0) 2.0 2.0 2.0 2.0ChENGDu 0.3 (0.8) 2.0 2.0 2.0 2.0GuANGZhOu (3.0) 1.0 2.5 3.5 2.0 2.0hONG KONG 1.2 0.4 0.0 2.0 2.0 2.0MACAu 3.5 0.0 2.0 2.8 3.0 3.0sEOuL (0.5) 3.9 2.5 2.1 1.9 1.8shANGhAI (4.4) 6.0 3.0 3.0 3.0 2.0shENZhEN (0.7) 1.0 2.0 3.5 4.1 4.1sINGAPORE 1.5 (5.8) (1.5) NP NP NPSINGAPORE
europeBERLIN 2.2 2.0 2.0 2.0 2.0 NPBIRMINGhAM 4.0 3.0 2.8 2.5 3.0 3.0BRIsTOL 4.5 5.0 5.0 5.5 5.2 5.0BuDAPEsT 1.0 5.5 9.5 8.0 8.0 5.0DuBLIN 7.0 4.0 8.0 8.0 8.0 NPLONDON 5.9 3.5 2.0 1.5 2.0 3.5shEFFIELD 9.0 2.5 (1.0) (3.0) 0.5 NPMADRID (0.0) 0.1 0.8 0.1 0.1 NPMANChEsTER 4.0 4.0 2.5 2.0 3.0 3.5MOsCOW (5.0) 0.0 1.0 1.5 1.5 2.0WARsAW 0.7 3.2 3.2 1.2 NP NP
Middle easTABu DhABI 4.7 (5.0) (3.0) 2.0 7.0 8.0DOhA 5.0 5.5 6.0 7.0 NP NPDuBAI 4.6 3.0 3.5 3.5 3.5 3.5RIyADh 4.8 5.0 5.0 5.0 5.0 NP
oCeaniaADELAIDE 0.8 1.8 3.0 3.5 3.5 3.5AuCKLAND 5.1 5.5 5.0 3.5 3.5 3.0BRIsBANE 5.9 7.2 4.0 4.0 4.0 4.0CANBERRA 2.0 2.5 2.8 3.0 3.0 3.0ChRIsTChuRCh 6.0 3.0 3.5 3.0 2.0 2.0DARWIN 1.0 1.0 1.0 2.0 2.5 2.5GOLD COAsT 4.0 6.5 4.0 3.0 3.0 3.0MELBOuRNE 2.0 2.0 3.0 3.0 3.0 3.0PERTh 0.8 0.8 1.5 2.0 2.5 3.0syDNEy 4.5 4.8 4.2 4.0 3.5 3.5TOWNsvILLE 3.0 3.0 4.0 4.0 4.0 4.0WELLINGTON 3.0 4.0 4.5 4.5 5.0 4.0
NP: NOT PUBLISHED
rlB Tender priCe indeX annual % ChanGeQ2 2017

Rider Levett Bucknall | International Report – Third Quarter 20178 |
ranGe of CosT per M2 of Gross floor area ranGe of CosT per M2 of Gross floor area
loCal CurrenCY
offiCe BuildinG reTail hoTels Car parKinG indusTrial Warehouse
residenTial MulTi sToreYpreMiuM offiCes Grade a Mall sTrip shoppinG 5 sTar 3 sTar MulTi sToreY BaseMenT
loW hiGh loW hiGh loW hiGh loW hiGh loW hiGh loW hiGh loW hiGh loW hiGh loW hiGh loW hiGh
aMeriCas aMeriCasBOsTON USD 3,230 5,110 2,155 3,230 1,885 2,960 1,345 2,155 4,035 5,920 2,690 4,035 805 1,345 970 1,615 1,075 1,885 1,885 3,230
CALGARy CAD 2,530 3,175 2,045 3,070 2,370 3,335 1,185 1,720 3,230 4,845 2,045 2,635 805 1,025 915 1,560 805 1,290 1,505 2,315
ChICAGO USD 2,905 4,845 1,775 3,015 1,990 3,015 1,290 2,370 4,200 6,995 2,850 4,090 860 1,345 970 1,505 1,185 1,940 1,720 3,445
DENvER USD 1,720 2,745 1,235 1,885 970 1,560 755 1,455 2,155 3,335 1,615 1,990 540 755 970 1,290 970 1,615 915 2,045
hONOLuLu USD 3,070 5,705 2,635 4,305 2,260 5,330 1,885 4,680 5,545 8,020 3,500 5,865 1,075 1,560 1,505 2,850 1,560 2,420 2,100 4,790
LAs vEGAs USD 1,505 3,175 1,130 2,045 1,240 5,165 700 1,560 3,765 5,380 1,615 3,230 540 915 645 1,615 540 1,075 755 4,360
LOs ANGELEs USD 2,315 3,500 1,615 2,475 1,455 3,285 1,185 1,885 3,550 5,330 2,370 3,285 1,075 1,290 1,290 1,775 1,130 1,885 1,830 2,960
NEW yORK USD 4,035 6,190 3,230 4,305 2,960 4,575 1,885 3,230 4,305 6,460 3,230 4,305 1,025 1,885 1,345 2,155 1,240 2,155 2,155 4,035
PuERTO RICO USD 2,650 3,540 2,065 2,950 2,065 2,660 1,185 1,765 3,830 4,715 2,355 2,950 N/P N/P N/P N/P N/P N/P 1,775 2,950
PhOENIx USD 1,720 2,960 1,185 1,885 1,185 1,830 860 1,505 3,230 5,115 1,615 2,690 485 755 645 1,185 590 1,075 970 1,990
PORTLAND USD 1,940 2,690 1,400 1,940 1,505 2,585 1,290 1,940 2,045 2,960 1,615 2,045 915 1,130 1,185 1,615 970 1,615 1,615 2,585
sAN FRANCIsCO USD 2,155 3,765 1,940 2,960 2,100 3,500 2,420 3,500 3,230 5,380 2,690 3,765 1,075 1,400 1,775 2,045 1,505 2,045 3,015 4,575
sEATTLE USD 2,155 2,635 1,455 2,100 1,455 3,285 1,185 1,670 2,475 3,500 2,315 2,475 915 1,075 1,290 1,670 1,025 1,345 1,560 2,690
TORONTO CAD 2,100 2,800 1,830 2,690 2,155 2,690 1,130 1,720 3,230 3,820 2,100 2,800 755 970 1,240 1,615 755 970 1,400 2,205
WAshINGTON D.C. USD 2,960 4,575 2,155 3,230 1,615 2,960 1,345 1,885 3,765 5,650 2,690 3,765 755 1,345 860 1,345 970 1,615 1,885 3,230
asia asiaBEIJING RMB 7,650 11,300 7,150 10,800 8,400 12,850 7,400 11,550 13,000 17,200 9,700 12,500 2,250 3,050 3,750 6,550 4,350 5,500 4,050 5,950
ChENGDu RMB 6,850 11,150 6,300 9,350 7,250 11,000 6,550 10,450 11,500 14,800 8,660 10,900 2,050 2,800 3,600 5,900 3,450 4,250 3,450 5,150
GuANGZhOu RMB 7,200 10,900 6,650 10,050 8,200 11,650 7,100 10,650 13,000 16,700 9,600 11,700 2,100 3,000 3,700 6,400 4,150 5,150 3,800 5,450
hO ChI MINh CITy VND ('000) 24,900 35,800 21,300 26,600 20,100 26,800 N/P N/P 32,400 39,700 24,400 31,500 9,100 13,600 18,700 25,500 6,210 9,400 15,400 23,300
hONG KONG $HKD 23,600 35,200 20,100 27,300 23,700 30,100 20,200 26,300 36,800 45,000 30,300 35,100 9,250 10,950 19,000 26,000 15,600 19,600 22,400 37,400
JAKARTA RP ('000) 10,130 13,200 6,870 11,000 6,520 8,515 N/P N/P 13,670 17,420 11,140 12,470 3,500 4,500 4,500 6,190 4,790 6,080 6,870 10,100
KuALA LuMPuR RINGGIT 2,800 4,000 2,200 3,000 2,100 3,500 N/P N/P 5,000 7,000 2,500 3,500 800 1,200 1,400 3,200 1,000 1,800 1,900 4,500
MACAu MOP 18,600 25,900 16,400 23,000 20,400 25,100 17,300 22,100 31,300 38,500 25,200 29,000 N/P N/P 10,850 13,700 N/P N/P 14,150 22,300
MANILA PHP 32,470 44,305 28,825 35,705 27,510 31,660 20,835 23,365 53,505 61,600 43,190 48,855 14,665 16,890 16,085 18,510 17,395 20,535 27,210 46,225
sEOuL KRW ('000) 2,330 3,000 1,760 2,160 1,570 2,270 1,320 2,010 3,150 4,680 2,030 2,580 670 820 850 1,090 1,180 1,460 1,590 2,180
shANGhAI RMB 7,500 11,100 6,750 10,300 7,850 12,450 7,000 11,400 12,900 17,000 9,500 12,300 2,100 3,050 4,000 6,650 4,050 5,200 3,700 5,450
shENZhEN RMB 7,100 10,700 6,550 9,950 7,550 11,600 6,650 10,200 12,300 16,000 9,260 11,700 2,100 2,950 3,750 6,400 3,900 4,900 3,650 5,400
sINGAPORE SGD 2,900 4,050 2,050 3,250 2,150 3,300 N/P N/P 4,150 5,450 3,200 3,600 700 1,350 1,450 2,200 1,100 1,450 1,950 3,100
europe europeBERLIN EUR 1,355 1,775 990 1,150 1,145 1,460 835 1,040 1,985 2,755 1,355 1,770 470 680 785 1,040 N/P N/P 990 1,405
BIRMINGhAM GBP 1,850 2,700 1,500 2,700 2,750 3,890 870 1,670 2,100 3,000 1,280 1,970 350 675 800 1,375 400 560 1,575 2,210
BRIsTOL GBP 1,950 2,800 1,600 2,800 2,750 3,890 870 1,650 2,300 3,100 1,350 1,800 400 800 950 1,500 400 650 1,700 2,450
DuBLIN EUR 1,800 2,000 1,600 1,800 1,900 2,100 1,000 1,200 2,000 2,200 1,340 1,440 400 500 600 1,000 N/P N/P 1,400 1,600
LONDON GBP 2,600 3,390 2,145 3,340 3,470 4,875 1,115 2,085 2,745 3,690 1,855 2,380 445 890 1,185 1,910 480 870 2,475 4,090
MADRID EUR 900 1,500 800 1,150 1,900 2,600 1,400 1,900 1,950 2,600 1,350 1,800 700 900 800 1,200 800 1,200 700 1,000
MANChEsTER GBP 2,045 2,680 1,765 2,650 2,875 4,040 915 1,735 2,190 3,000 1,385 1,845 345 695 940 1,500 380 695 1,755 2,460
MOsCOW EUR 1,500 2,000 1,300 1,600 1,700 2,100 1,200 1,500 2,800 3,500 1,700 2,200 430 550 800 1,000 600 700 1,200 1,500
OsLO EUR 2,840 3,690 2,190 2,850 1,800 2,340 1,440 1,870 3,920 5,090 2,960 3,850 690 880 890 1,160 N/P N/P 2,420 3,150
Middle easT & afriCa Middle easT & afriCaABu DhABI AED 5,510 6,650 4,465 6,270 3,895 6,175 N/P N/P 8,550 11,400 5,700 8,075 1,710 3,420 2,710 4,275 1,425 2,565 4,275 5,795
DuBAI AED 5,800 7,000 4,700 6,600 4,100 6,500 N/P N/P 9,000 14,000 6,000 9,000 2,300 3,600 3,100 4,500 1,850 2,900 4,500 6,500
RIyADh SAR 4,890 7,595 4,990 6,825 4,730 6,200 3,360 4,730 8,305 10,110 5,990 7,465 920 1,220 2,265 2,845 3,310 4,045 4,575 9,480
DOhA QAR 6,500 8,500 6,100 8,200 5,300 6,500 N/P N/P 11,500 14,500 7,500 8,500 2,750 4,500 2,500 4,250 N/P N/P 6,500 7,800
oCeania oCeaniaADELAIDE AUD 2,600 3,850 2,100 3,250 1,550 2,950 1,300 1,825 3,550 4,450 2,550 3,450 610 925 1,325 1,950 625 1,100 2,350 3,450
AuCKLAND NZD 3,400 4,500 2,600 4,250 2,500 2,800 1,400 1,800 4,500 5,500 3,800 4,300 750 1,000 2,000 2,500 700 950 3,000 4,000
BRIsBANE AUD 2,600 3,700 2,200 3,200 2,500 3,500 1,200 1,800 4,000 5,500 2,800 4,000 800 1,200 1,600 2,100 700 1,100 2,300 3,800
CANBERRA AUD 3,275 4,245 2,655 3,350 2,250 3,155 1,205 1,985 4,030 4,970 2,935 4,095 745 1,035 1,005 1,430 695 1,075 2,775 3,945
ChRIsTChuRCh NZD 3,600 4,500 2,750 4,250 2,500 2,800 1,400 1,800 4,500 5,500 3,800 4,300 850 1,350 1,750 2,200 720 1,100 3,000 4,000
DARWIN AUD 3,100 4,150 2,400 3,800 1,730 2,590 1,230 2,090 3,600 4,450 2,830 3,550 750 1,250 1,170 1,530 800 1,420 2,030 2,650
GOLD COAsT AUD 2,450 4,000 1,900 3,000 2,150 3,100 1,050 1,600 3,400 5,500 2,600 4,000 700 1,100 1,500 2,050 600 1,100 1,850 3,000
MELBOuRNE AUD 3,060 4,050 2,370 3,400 2,065 3,060 1,080 1,580 3,920 5,090 3,110 3,570 670 1,080 1,130 1,480 565 1,120 2,270 4,080
PERTh AUD 3,150 4,470 2,575 3,740 2,300 2,800 1,025 2,565 3,600 4,430 2,645 3,635 750 1,000 1,850 3,100 550 1,020 2,280 4,395
syDNEy AUD 3,400 4,450 2,510 3,620 1,880 3,930 1,460 1,890 4,230 5,610 2,980 3,770 730 1,100 1,050 1,680 700 1,100 2,460 5,080
WELLINGTON NZD 3,100 4,500 2,700 4,450 2,600 2,800 1,400 1,800 4,500 5,500 3,800 4,300 800 1,100 2,000 2,500 750 1,000 3,150 4,000
N/P: NOT PUBLISHED
The following data represents estimates of current building costs in the respective market. Costs may vary as a consequence of factors such as site conditions, climatic conditions, standards of specification, market conditions etc.
MarKeT daTaINTERNATIONAL CONSTRUCTION RATE RANGES

Rider Levett Bucknall | International Report – Third Quarter 2017 | 9
ranGe of CosT per M2 of Gross floor area ranGe of CosT per M2 of Gross floor area
loCal CurrenCY
offiCe BuildinG reTail hoTels Car parKinG indusTrial Warehouse
residenTial MulTi sToreYpreMiuM offiCes Grade a Mall sTrip shoppinG 5 sTar 3 sTar MulTi sToreY BaseMenT
loW hiGh loW hiGh loW hiGh loW hiGh loW hiGh loW hiGh loW hiGh loW hiGh loW hiGh loW hiGh
aMeriCas aMeriCasBOsTON USD 3,230 5,110 2,155 3,230 1,885 2,960 1,345 2,155 4,035 5,920 2,690 4,035 805 1,345 970 1,615 1,075 1,885 1,885 3,230
CALGARy CAD 2,530 3,175 2,045 3,070 2,370 3,335 1,185 1,720 3,230 4,845 2,045 2,635 805 1,025 915 1,560 805 1,290 1,505 2,315
ChICAGO USD 2,905 4,845 1,775 3,015 1,990 3,015 1,290 2,370 4,200 6,995 2,850 4,090 860 1,345 970 1,505 1,185 1,940 1,720 3,445
DENvER USD 1,720 2,745 1,235 1,885 970 1,560 755 1,455 2,155 3,335 1,615 1,990 540 755 970 1,290 970 1,615 915 2,045
hONOLuLu USD 3,070 5,705 2,635 4,305 2,260 5,330 1,885 4,680 5,545 8,020 3,500 5,865 1,075 1,560 1,505 2,850 1,560 2,420 2,100 4,790
LAs vEGAs USD 1,505 3,175 1,130 2,045 1,240 5,165 700 1,560 3,765 5,380 1,615 3,230 540 915 645 1,615 540 1,075 755 4,360
LOs ANGELEs USD 2,315 3,500 1,615 2,475 1,455 3,285 1,185 1,885 3,550 5,330 2,370 3,285 1,075 1,290 1,290 1,775 1,130 1,885 1,830 2,960
NEW yORK USD 4,035 6,190 3,230 4,305 2,960 4,575 1,885 3,230 4,305 6,460 3,230 4,305 1,025 1,885 1,345 2,155 1,240 2,155 2,155 4,035
PuERTO RICO USD 2,650 3,540 2,065 2,950 2,065 2,660 1,185 1,765 3,830 4,715 2,355 2,950 N/P N/P N/P N/P N/P N/P 1,775 2,950
PhOENIx USD 1,720 2,960 1,185 1,885 1,185 1,830 860 1,505 3,230 5,115 1,615 2,690 485 755 645 1,185 590 1,075 970 1,990
PORTLAND USD 1,940 2,690 1,400 1,940 1,505 2,585 1,290 1,940 2,045 2,960 1,615 2,045 915 1,130 1,185 1,615 970 1,615 1,615 2,585
sAN FRANCIsCO USD 2,155 3,765 1,940 2,960 2,100 3,500 2,420 3,500 3,230 5,380 2,690 3,765 1,075 1,400 1,775 2,045 1,505 2,045 3,015 4,575
sEATTLE USD 2,155 2,635 1,455 2,100 1,455 3,285 1,185 1,670 2,475 3,500 2,315 2,475 915 1,075 1,290 1,670 1,025 1,345 1,560 2,690
TORONTO CAD 2,100 2,800 1,830 2,690 2,155 2,690 1,130 1,720 3,230 3,820 2,100 2,800 755 970 1,240 1,615 755 970 1,400 2,205
WAshINGTON D.C. USD 2,960 4,575 2,155 3,230 1,615 2,960 1,345 1,885 3,765 5,650 2,690 3,765 755 1,345 860 1,345 970 1,615 1,885 3,230
asia asiaBEIJING RMB 7,650 11,300 7,150 10,800 8,400 12,850 7,400 11,550 13,000 17,200 9,700 12,500 2,250 3,050 3,750 6,550 4,350 5,500 4,050 5,950
ChENGDu RMB 6,850 11,150 6,300 9,350 7,250 11,000 6,550 10,450 11,500 14,800 8,660 10,900 2,050 2,800 3,600 5,900 3,450 4,250 3,450 5,150
GuANGZhOu RMB 7,200 10,900 6,650 10,050 8,200 11,650 7,100 10,650 13,000 16,700 9,600 11,700 2,100 3,000 3,700 6,400 4,150 5,150 3,800 5,450
hO ChI MINh CITy VND ('000) 24,900 35,800 21,300 26,600 20,100 26,800 N/P N/P 32,400 39,700 24,400 31,500 9,100 13,600 18,700 25,500 6,210 9,400 15,400 23,300
hONG KONG $HKD 23,600 35,200 20,100 27,300 23,700 30,100 20,200 26,300 36,800 45,000 30,300 35,100 9,250 10,950 19,000 26,000 15,600 19,600 22,400 37,400
JAKARTA RP ('000) 10,130 13,200 6,870 11,000 6,520 8,515 N/P N/P 13,670 17,420 11,140 12,470 3,500 4,500 4,500 6,190 4,790 6,080 6,870 10,100
KuALA LuMPuR RINGGIT 2,800 4,000 2,200 3,000 2,100 3,500 N/P N/P 5,000 7,000 2,500 3,500 800 1,200 1,400 3,200 1,000 1,800 1,900 4,500
MACAu MOP 18,600 25,900 16,400 23,000 20,400 25,100 17,300 22,100 31,300 38,500 25,200 29,000 N/P N/P 10,850 13,700 N/P N/P 14,150 22,300
MANILA PHP 32,470 44,305 28,825 35,705 27,510 31,660 20,835 23,365 53,505 61,600 43,190 48,855 14,665 16,890 16,085 18,510 17,395 20,535 27,210 46,225
sEOuL KRW ('000) 2,330 3,000 1,760 2,160 1,570 2,270 1,320 2,010 3,150 4,680 2,030 2,580 670 820 850 1,090 1,180 1,460 1,590 2,180
shANGhAI RMB 7,500 11,100 6,750 10,300 7,850 12,450 7,000 11,400 12,900 17,000 9,500 12,300 2,100 3,050 4,000 6,650 4,050 5,200 3,700 5,450
shENZhEN RMB 7,100 10,700 6,550 9,950 7,550 11,600 6,650 10,200 12,300 16,000 9,260 11,700 2,100 2,950 3,750 6,400 3,900 4,900 3,650 5,400
sINGAPORE SGD 2,900 4,050 2,050 3,250 2,150 3,300 N/P N/P 4,150 5,450 3,200 3,600 700 1,350 1,450 2,200 1,100 1,450 1,950 3,100
europe europeBERLIN EUR 1,355 1,775 990 1,150 1,145 1,460 835 1,040 1,985 2,755 1,355 1,770 470 680 785 1,040 N/P N/P 990 1,405
BIRMINGhAM GBP 1,850 2,700 1,500 2,700 2,750 3,890 870 1,670 2,100 3,000 1,280 1,970 350 675 800 1,375 400 560 1,575 2,210
BRIsTOL GBP 1,950 2,800 1,600 2,800 2,750 3,890 870 1,650 2,300 3,100 1,350 1,800 400 800 950 1,500 400 650 1,700 2,450
DuBLIN EUR 1,800 2,000 1,600 1,800 1,900 2,100 1,000 1,200 2,000 2,200 1,340 1,440 400 500 600 1,000 N/P N/P 1,400 1,600
LONDON GBP 2,600 3,390 2,145 3,340 3,470 4,875 1,115 2,085 2,745 3,690 1,855 2,380 445 890 1,185 1,910 480 870 2,475 4,090
MADRID EUR 900 1,500 800 1,150 1,900 2,600 1,400 1,900 1,950 2,600 1,350 1,800 700 900 800 1,200 800 1,200 700 1,000
MANChEsTER GBP 2,045 2,680 1,765 2,650 2,875 4,040 915 1,735 2,190 3,000 1,385 1,845 345 695 940 1,500 380 695 1,755 2,460
MOsCOW EUR 1,500 2,000 1,300 1,600 1,700 2,100 1,200 1,500 2,800 3,500 1,700 2,200 430 550 800 1,000 600 700 1,200 1,500
OsLO EUR 2,840 3,690 2,190 2,850 1,800 2,340 1,440 1,870 3,920 5,090 2,960 3,850 690 880 890 1,160 N/P N/P 2,420 3,150
Middle easT & afriCa Middle easT & afriCaABu DhABI AED 5,510 6,650 4,465 6,270 3,895 6,175 N/P N/P 8,550 11,400 5,700 8,075 1,710 3,420 2,710 4,275 1,425 2,565 4,275 5,795
DuBAI AED 5,800 7,000 4,700 6,600 4,100 6,500 N/P N/P 9,000 14,000 6,000 9,000 2,300 3,600 3,100 4,500 1,850 2,900 4,500 6,500
RIyADh SAR 4,890 7,595 4,990 6,825 4,730 6,200 3,360 4,730 8,305 10,110 5,990 7,465 920 1,220 2,265 2,845 3,310 4,045 4,575 9,480
DOhA QAR 6,500 8,500 6,100 8,200 5,300 6,500 N/P N/P 11,500 14,500 7,500 8,500 2,750 4,500 2,500 4,250 N/P N/P 6,500 7,800
oCeania oCeaniaADELAIDE AUD 2,600 3,850 2,100 3,250 1,550 2,950 1,300 1,825 3,550 4,450 2,550 3,450 610 925 1,325 1,950 625 1,100 2,350 3,450
AuCKLAND NZD 3,400 4,500 2,600 4,250 2,500 2,800 1,400 1,800 4,500 5,500 3,800 4,300 750 1,000 2,000 2,500 700 950 3,000 4,000
BRIsBANE AUD 2,600 3,700 2,200 3,200 2,500 3,500 1,200 1,800 4,000 5,500 2,800 4,000 800 1,200 1,600 2,100 700 1,100 2,300 3,800
CANBERRA AUD 3,275 4,245 2,655 3,350 2,250 3,155 1,205 1,985 4,030 4,970 2,935 4,095 745 1,035 1,005 1,430 695 1,075 2,775 3,945
ChRIsTChuRCh NZD 3,600 4,500 2,750 4,250 2,500 2,800 1,400 1,800 4,500 5,500 3,800 4,300 850 1,350 1,750 2,200 720 1,100 3,000 4,000
DARWIN AUD 3,100 4,150 2,400 3,800 1,730 2,590 1,230 2,090 3,600 4,450 2,830 3,550 750 1,250 1,170 1,530 800 1,420 2,030 2,650
GOLD COAsT AUD 2,450 4,000 1,900 3,000 2,150 3,100 1,050 1,600 3,400 5,500 2,600 4,000 700 1,100 1,500 2,050 600 1,100 1,850 3,000
MELBOuRNE AUD 3,060 4,050 2,370 3,400 2,065 3,060 1,080 1,580 3,920 5,090 3,110 3,570 670 1,080 1,130 1,480 565 1,120 2,270 4,080
PERTh AUD 3,150 4,470 2,575 3,740 2,300 2,800 1,025 2,565 3,600 4,430 2,645 3,635 750 1,000 1,850 3,100 550 1,020 2,280 4,395
syDNEy AUD 3,400 4,450 2,510 3,620 1,880 3,930 1,460 1,890 4,230 5,610 2,980 3,770 730 1,100 1,050 1,680 700 1,100 2,460 5,080
WELLINGTON NZD 3,100 4,500 2,700 4,450 2,600 2,800 1,400 1,800 4,500 5,500 3,800 4,300 800 1,100 2,000 2,500 750 1,000 3,150 4,000
N/P: NOT PUBLISHED
Rates are in national currency per square metre of Gross Floor Area except as follows:• Chinesecities,HongKongandMacau:RatesarepersquaremetreofConstructionFloorArea,measuredtoouterfaceof
external walls. • Singapore,HoChiMinhCity,JakartaandKualaLumpur:RatesarepersquaremetreofConstructionFloorArea,measuredto
outer face of external walls and inclusive of covered basement and above ground parking areas.• Chinesecities,HongKong,KualaLumpur,MacauandSingapore:AllhotelratesareinclusiveofFurnitureFittingsand
Equipment (FF&E).

Rider Levett Bucknall | International Report – Third Quarter 201710 |
aMeriCas houses aparTMenTs offiCes indusTrial reTail hoTel CiVil
NORThERN AMERICA
BOsTONCALGARyChICAGODENvERhONOLuLuLAs vEGAsLOs ANGELEsNEW yORKPhOENIxPORTLANDsAN FRANCIsCOsEATTLEWAshINGTON, D.C.
CariBBeanANTIGuA AND BARBuDABAhAMAsBARBADOsBERMuDABRITIsh vIRGIN IsLANDsCAyMAN IsLANDsCuBADOMINICAN REPuBLIChAITIJAMAICAMARTINIQuENEThERLANDs ANTILLEsPuERTO RICOsT KITTs AND NEvIssT LuCIAsT vINCENT AND ThE GRENADINEsTRINIDAD AND TOBAGOus vIRGIN IsLANDs
afriCaCAPE TOWN JOhANNEsBuRGMAPuTO (MOZAMBIQuE) PORT LOuIs (MAuRITIus)PRETORIA
NP: NOT PUBLISHED
MarKeT daTaCONSTRUCTION SECTOR ACTIVITY
RLB Construction Market Activity CycleActivity within the construction industry traditionally has been subject to volatile cyclical fluctuations.The RLB Construction Sector Activity Cycle represents the construction development activity cycle. Each RLB office highlights the current construction sector activity position within the market activity cycle of those key construction sectors within their region.Each sector is categorised by three positions within the cycle; Peak, Mid and Trough. Within each position, activity is further defined by either declining or growing within that sector.The “up” and “down” arrows highlight the current status within the three positions of the cycle by means of the three colours identified in the cycle diagram below.

Rider Levett Bucknall | International Report – Third Quarter 2017 | 11
asia houses aparTMenTs offiCes indusTrial reTail hoTel CiVil
BEIJING
ChENGDu
GuANGZhOu
hO ChI MINh CITy
hONG KONG
JAKARTA
KuALA LuMPuR
MACAu
MANILA
sEOuL
shANGhAI
shENZhEN
sINGAPORE
europe
AMsTERDAM
BELFAsT
BERLIN
BIRMINGhAM
BRIsTOL
DuBLIN
EDINBuRGh
LONDON
MADRID
MANChEsTER
MILAN
MOsCOW
OsLO
PARIs
shEFFIELD
Middle easT & afriCa
ABu DhABI
DOhA
DuBAI
RIyADh
oCeania
ADELAIDE
AuCKLAND
BRIsBANE
CANBERRA
ChRIsTChuRCh
DARWIN
GOLD COAsT
MELBOuRNE
PERTh
syDNEy
WELLINGTON
NP: NOT PUBLISHED
Rider Levett Bucknall | International Report – Third Quarter 201712 |
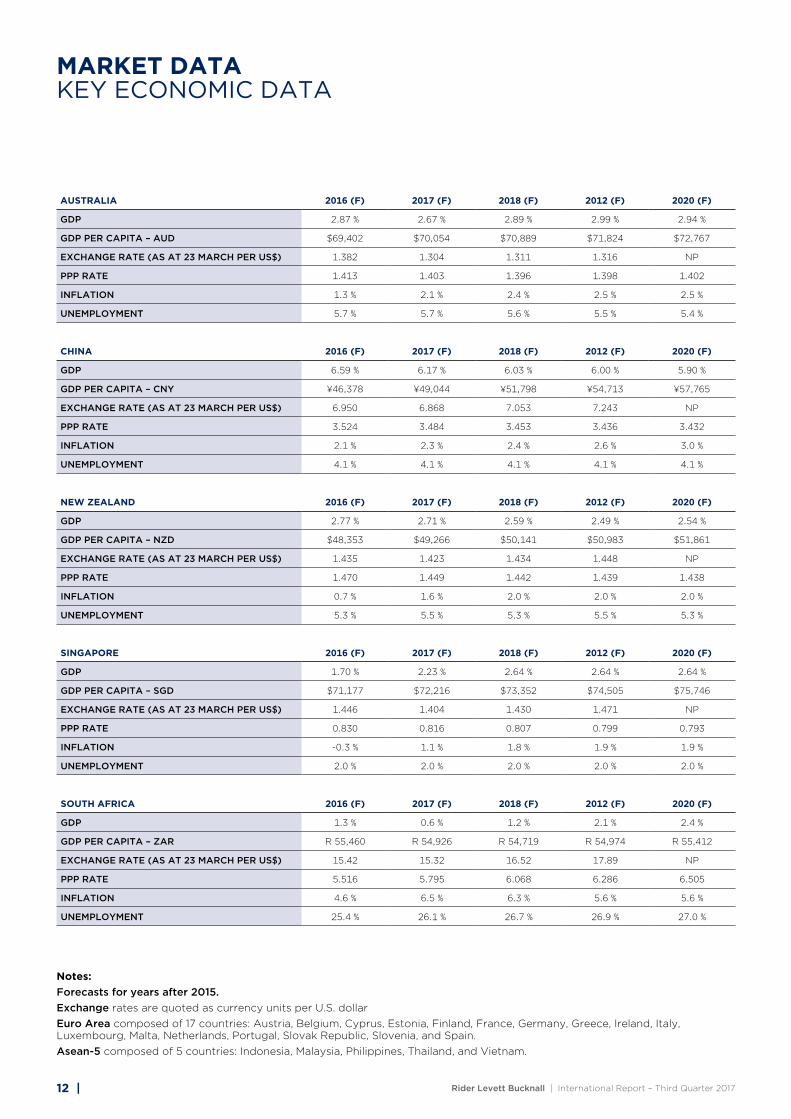
MarKeT daTaKEY ECONOMIC DATA
ausTralia 2016 (f) 2017 (f) 2018 (f) 2012 (f) 2020 (f)
GDP 2.87 % 2.67 % 2.89 % 2.99 % 2.94 %
GDP PER CAPITA – AuD $69,402 $70,054 $70,889 $71,824 $72,767
ExChANGE RATE (As AT 23 MARCh PER us$) 1.382 1.304 1.311 1.316 NP
PPP RATE 1.413 1.403 1.396 1.398 1.402
INFLATION 1.3 % 2.1 % 2.4 % 2.5 % 2.5 %
uNEMPLOyMENT 5.7 % 5.7 % 5.6 % 5.5 % 5.4 %
China 2016 (f) 2017 (f) 2018 (f) 2012 (f) 2020 (f)
GDP 6.59 % 6.17 % 6.03 % 6.00 % 5.90 %
GDP PER CAPITA – CNy ¥46,378 ¥49,044 ¥51,798 ¥54,713 ¥57,765
ExChANGE RATE (As AT 23 MARCh PER us$) 6.950 6.868 7.053 7.243 NP
PPP RATE 3.524 3.484 3.453 3.436 3.432
INFLATION 2.1 % 2.3 % 2.4 % 2.6 % 3.0 %
uNEMPLOyMENT 4.1 % 4.1 % 4.1 % 4.1 % 4.1 %
neW Zealand 2016 (f) 2017 (f) 2018 (f) 2012 (f) 2020 (f)
GDP 2.77 % 2.71 % 2.59 % 2.49 % 2.54 %
GDP PER CAPITA – NZD $48,353 $49,266 $50,141 $50,983 $51,861
ExChANGE RATE (As AT 23 MARCh PER us$) 1.435 1.423 1.434 1.448 NP
PPP RATE 1.470 1.449 1.442 1.439 1.438
INFLATION 0.7 % 1.6 % 2.0 % 2.0 % 2.0 %
uNEMPLOyMENT 5.3 % 5.5 % 5.3 % 5.5 % 5.3 %
sinGapore 2016 (f) 2017 (f) 2018 (f) 2012 (f) 2020 (f)
GDP 1.70 % 2.23 % 2.64 % 2.64 % 2.64 %
GDP PER CAPITA – sGD $71,177 $72,216 $73,352 $74,505 $75,746
ExChANGE RATE (As AT 23 MARCh PER us$) 1.446 1.404 1.430 1.471 NP
PPP RATE 0.830 0.816 0.807 0.799 0.793
INFLATION -0.3 % 1.1 % 1.8 % 1.9 % 1.9 %
uNEMPLOyMENT 2.0 % 2.0 % 2.0 % 2.0 % 2.0 %
souTh afriCa 2016 (f) 2017 (f) 2018 (f) 2012 (f) 2020 (f)
GDP 1.3 % 0.6 % 1.2 % 2.1 % 2.4 %
GDP PER CAPITA – ZAR R 55,460 R 54,926 R 54,719 R 54,974 R 55,412
ExChANGE RATE (As AT 23 MARCh PER us$) 15.42 15.32 16.52 17.89 NP
PPP RATE 5.516 5.795 6.068 6.286 6.505
INFLATION 4.6 % 6.5 % 6.3 % 5.6 % 5.6 %
uNEMPLOyMENT 25.4 % 26.1 % 26.7 % 26.9 % 27.0 %
notes:Forecasts for years after 2015. Exchange rates are quoted as currency units per U.S. dollar Euro Area composed of 17 countries: Austria, Belgium, Cyprus, Estonia, Finland, France, Germany, Greece, Ireland, Italy, Luxembourg, Malta, Netherlands, Portugal, Slovak Republic, Slovenia, and Spain. Asean-5 composed of 5 countries: Indonesia, Malaysia, Philippines, Thailand, and Vietnam.

Rider Levett Bucknall | International Report – Third Quarter 2017 | 13
uniTed KinGdoM 2016 (f) 2017 (f) 2018 (f) 2012 (f) 2020 (f)
GDP 1.8 % 1.1 % 1.7 % 1.8 % 1.9 %
GDP PER CAPITA – GBP £28,471 £28,571 £28,843 £29,167 £29,534
ExChANGE RATE (As AT 23 MARCh PER us$) 0.813 0.802 0.793 0.783 NP
PPP RATE 0.693 0.695 0.693 0.691 0.690
INFLATION 0.74 % 2.51 % 2.60 % 2.00 % 2.00 %
uNEMPLOyMENT 5.0 % 5.2 % 5.4 % 5.5 % 5.4 %
usa 2016 (f) 2017 (f) 2018 (f) 2012 (f) 2020 (f)
GDP 1.6 % 2.2 % 2.1 % 1.9 % 1.7 %
GDP PER CAPITA – usD $51,411 $52,188 $52,915 $53,570 $54,134
ExChANGE RATE (As AT 23 MARCh PER us$) 1.000 1.000 1.000 1.000 1.000
PPP RATE 1.000 1.000 1.000 1.000 1.000
INFLATION 1.19 % 2.34 % 2.65 % 2.52 % 2.39 %
uNEMPLOyMENT 4.9 % 4.8 % 4.7 % 4.8 % 5.0 %
laTin aMeriCa and CariBBean 2016 (f) 2017 (f) 2018 (f) 2012 (f) 2020 (f)
GDP -0.55 % 1.60 % 2.09 % 2.61 % 2.71 %
GDP PER CAPITA (INT $) 15,403 15,814 16,357 16,988 17,641
INFLATION 5.8 % 4.2 % 3.8 % 3.7 % 3.6 %
euro area 2016 (f) 2017 (f) 2018 (f) 2012 (f) 2020 (f)
GDP 1.661 % 1.512 % 1.586 % 1.528 % 1.521 %
GDP PER CAPITA (INT $) 0 0 0 0 0
ExChANGE RATE (As AT 23 MARCh PER us$) 0.949 1.079 1.101 1.126 NP
PPP RATE N/A N/A N/A N/A N/A
INFLATION 0.3 % 1.1 % 1.3 % 1.5 % 1.6 %
uNEMPLOyMENT 10.0 % 9.7 % 9.3 % 9.0 % 8.7 %
Middle easT & norTh afriCa 2016 (f) 2017 (f) 2018 (f) 2012 (f) 2020 (f)
GDP 3.2 % 3.2 % 3.4 % 3.6 % 3.7 %
GDP PER CAPITA (INT $) 18,175 18,766 19,467 20,225 21,018
INFLATION 5.4 % 6.1 % 5.8 % 4.6 % 4.1 %
asean-5 2016 (f) 2017 (f) 2018 (f) 2012 (f) 2020 (f)
GDP 4.8 % 5.1 % 5.2 % 5.4 % 5.5 %
GDP PER CAPITA (INT $) 11,593 12,289 13,069 13,905 14,794
INFLATION 2.5 % 3.4 % 3.6 % 3.6 % 3.5 %
suB sahara afriCa 2016 (f) 2017 (f) 2018 (f) 2012 (f) 2020 (f)
GDP 1.4 % 2.9 % 3.6 % 4.2 % 4.3 %
GDP PER CAPITA (INT $) 3,831 3,920 4,051 4,207 4,370
INFLATION 11.3 % 10.8 % 9.3 % 8.9 % 8.4 %
MarKeT daTaKEY ECONOMIC DATA
south America and Carribean composed of 32 countries: Antigua and Barbuda, Argentina, The Bahamas, Barbados, Belize, Bolivia, Brazil, Chile, Colombia, Costa Rica, Dominica, Dominican Republic, Ecuador, El Salvador, Grenada, Guatemala, Guyana, Haiti, Honduras, Jamaica, Mexico, Nicaragua, Panama, Paraguay, Peru, St. Kitts and Nevis, St. Lucia, St. Vincent and the Grenadines, Suriname, Trinidad and Tobago, Uruguay, and Venezuela. Middle East and North Africa composed of 20 countries: Algeria, Bahrain, Djibouti, Egypt, Iran, Iraq, Jordan, Kuwait, Lebanon, Libya, Mauritania, Morocco, Oman, Qatar, Saudi Arabia, Sudan, Syria, Tunisia, United Arab Emirates, and Yemen.Sources : RLB, IMF, Scotiabank

14 |
Menlyn Maine Central Square, Pretoria, South Africa
Architect: Boogertman & Partners

REGIONAL INTELLIGENCE
Sub Saharan africa
Rider Levett Bucknall | International Report – Third Quarter 2017 | 15
Growth in Sub-Saharan Africa is recovering, supported by modestly increasing commodity prices, strengthening external demand, and the end of drought in many countries, according to the World Bank in June 2017.
Across southern Africa, the Market Activity Cycle highlights an even distribution of sectors across the Peak, Mid and Trough Zones. From RLB observations there has been a downward movement since our last report with the hotel, house retail sectors moving downward and the apartment and civil sectors strengthening.
The drought in East Africa has continued into 2017, adversely affecting economic activity in Kenya, and contributing to famine in Somalia and South Sudan.
Regional inflation is gradually decelerating from very high levels, although it remains elevated in Angola, Nigeria, and Mozambique. Inflationary pressures increased in East Africa, due to drought. Inflation forecasted for the region was 11.3% in 2016 falling to 10.8% in 2017.
Growth is forecast to pick up to 2.9% in 2017 and to 3.6% in 2018, predicated on moderately rising commodity prices and reforms to tackle macroeconomic imbalances within the region.
Growth in South Africa is forecasted by the IMF to pick up marginally in 2017 to 0.8% up from 0.1% in 2016. Business confidence is currently at a multi-year low, after an abrupt cabinet reshuffle increased political uncertainty. Moreover, the economy’s credit rating was recently downgraded by Moody’s and a key driver of growth, the mining industry is threatening legal action over recent changes to legislation. The government recently unveiled a new mining charter, which lifts the black ownership requirement to 30% and is toughly opposed by mining companies in the country.
Escalation within the region is considerably higher than the global TPI’s contained within this publication. The region’s TPI increase for 2017 ranges from 4% to 8%, albeit lower than the regions inflation forecasts.
2017 foreCasTed esCalaTion
NET ZONE MOVEMENT BY SECTORQ4 2016 TO Q3 2017
3
2
1
-1
-2
0
HOUSES APARTMENTS OFFICES INDUSTRIAL RETAIL HOTEL CIVIL
reGional MarKeT aCTiViTY CYCle seCTors per Zone
PEAK ZONE
MID ZONE
TROuGh ZONE
11
12 12

Location inteLLigenceSub Saharan africa
Rider Levett Bucknall | International Report – Third Quarter 201716 |
CAPE TOWNCape Town’s stability within the commercial property sector is a positive factor in the vacancy rates of 7.6%, up 0.4% from Q1 2016. The city continues to attract the interest of global contracts and this robust demand is supporting optimistic growth in local rental rates. Newly completed buildings in prime nodes are also driving an upward curve in the city’s rental rates. Grade P buildings recorded a fall in vacancy from 12% in Q4 2016 to 9.1% in Q1 2017, reflecting the trend across the South African office market in smarter, agile workspaces in green-efficient buildings. This supports the demand for high quality, more expensive grade A and P stock.
Current additions to the commercial supply will include the KPMG building (16,000m2) development in the CBD and Sable Road Offices (18,300m2) with Discovery Health as the anchor tenant. Another key development within the city is Rabie’s iconic Axis residential apartments.
Contractor prices have been steadily increasing in line with increased project opportunities and limited capacity of contractors and subcontractors. Main Contractor preliminaries and profit/attendance & overheads have increased. Wet trades are seeing increases together with formworks, masonry brickwork and ever fluctuating reinforcement rates.
JOhANNEsBuRGThere are signs that the South African economy is stabilising and that the weaker rand is promoting economic adjustments, which will generate growth which is being seen in Johannesburg. Developing areas such as Sandton and Waterfall continue to grow despite the economic circumstances.
Key areas of development activity include:
sANDTON - Known as the richest square mile in Africa. Nearly half of all the office developments taking place in South Africa are occurring in Sandton. Sandton Central is the epicentre of development. Discovery Health’s Head Office, an 87,00m² resource-efficient, cost- effective and environmentally- innovative office building has been recently completed. Developed in joint venture by Growthpoint Properties Limited (55%) and Zenprop Property Holdings (45%).
WATERFALL - A city developed on a scale beyond anything South Africa has previously seen. The Waterfall development encompasses 2,200 hectares. Waterfall is focusing on becoming the new corporate headquarters node of Gauteng, a new economic hub for the African continent. Within Waterfall, the urban concept development Waterfall City is being developed as a work, live and play destination. It embraces integrated, new urban living with retail, offices, homes, hotels, a hospital, parks, dining and entertainment.
Waterfall Lifestyle, Waterfall Corner, Mall of Africa, Netcare Waterfall, PWC headquarters and Maxwell Office Park are some of the developments located within the Waterfall precinct. The Mall of Africa is South Africa's biggest single-phase shopping mall development to date. Developed by Atterbury Property Group and located in Waterfall Estate. The full development occupies 485,000m² with the shopping area occupying 131,000m². It is designed around new principles of walkable, mixed- use environments to create a truly cutting-edge shopping experience.

Location inteLLigenceSub Saharan africa
Rider Levett Bucknall | International Report – Third Quarter 2017 | 17
MOZAMBIQuE2016 was a testing year for Mozambique. Low commodity prices, drought and conflict, was compounded by the fallout from the discovery of hidden government debts in April 2016. The revelation of USD 1.4b in previously undisclosed commercial loans dented confidence in the country and negated its previous track record for high growth and economic stability.
The forecast of a strong uplift in the Mozambican economy in 2017 is due to the significant natural gas finds. Negotiations are still continuing and are being prolonged.
The market has been in a difficult position over the past twelve months due to various governmental and economic factors such as:
§ Currency devaluation from 48 MZN to 71 MZD for 1 USD during 2016. Currently 60 MZN to 1 USD.
§ Severe shortage of foreign currency internally so investors could get their money out of Mozambique
§ Risk on currency fluctuation saw no USD leases being signed making development funding very difficult.
Over the past couple of months we are seeing positive signs that inquiries are now commencing for new or stalled developments due to a rise in the availability of foreign currency and the local currency stabilising slightly.
Other infrastructure works due to start this year are road networks, falling under the Road Decongestion Program. These include a grade separated junction at Jumbo/Phoenix/ Dowlut Roundabouts (Rs 2.4b); A1-M1 New Road, Bridge and Interchange at Sorèze (Rs 2.3b); the construction of Port Louis Ring Road Phase 2, including a 1.2 km tunnel (Rs 5b); the construction of Port Louis Ring Road Phase 3 (Rs 2.9b); and A3-A1 Link Road (Rs 200m).
The Board of Investment has since issued development permits to three Smart City projects last year. Those three are: Jinfei Smart City (North), Cap Tamarin from Trimetys Group (West), and Mon Trésor Smart City from Omnicane, next to the airport (South). In all the Smart City projects for this year will require some Rs 5.2b investments and will create some 3,000 jobs.
PORT LOuIs (MAuRITIus) In 2016, the real estate sector received Foreign Direct Investments of Rs 7.6b, mostly geared towards the former IRS/RES projects. The construction sector contributes, in nominal terms, around Rs 16b (2016) towards the country’s GDP and represents 4.2% of the country’s GDP in relative terms.
The construction of the new access road to Sir Seewoosagur Ramgoolam International Airport, the first major road infrastructure project for 2016, commenced on 23 March 2016. The project, Rs 602 million, is expected to be completed by mid 2017.
The new access road is deemed necessary with the anticipated traffic volumes which will result from the forthcoming planned development in the airport area as well as the future Air Cargo and Freeport Zone. In addition, the road will not only provide a bypass to reduce traffic congestion and enhance road safety in the residential areas of Plaine Magnien, but will offer an alternative route to the airport, in case of emergencies.
During 2017, another four projects will start. Smart City of Médine in Flic-en-Flac, including an Education Village; ENL Group’s Moka Smart City, Yihai Smart City project at Domaine Les Pailles, a joint initiative of the State Investment Corporation and the Chinese company Yihai International Investment Management Ltd. Another major project announced for this year, is the Metro Express. The construction of this light railway transport system to the tune of Rs 18b with financial support of the government of India.

18 |
Edith Green Wendell Wyatt, Portland, Oregon, USA
Architect: Sera Architects, Inc.

REGIONAL INTELLIGENCE
AMERICAS
Rider Levett Bucknall | International Report – Third Quarter 2017 | 19
Most analysts forecast that economic growth in the United States will pick up later in 2017 and in 2018 as the impacts from past exchange-rate appreciations abate and new fiscal policies begin to gain traction. Consumer spending is forecast to benefit from continued, though slowing, employment growth and, as the labour market tightens, stronger wage growth.
According to the US Federal Reserve Board and Federal Open Market Committee report dated 14 June 2017, the real GDP has risen from 1.9% in 2015 to a median projection of 2.2% in 2017 and 2.1% in 2018, significantly less than the Trump administration’s aspirational target of 3% growth.
The same report highlights the strengthening labour market, with unemployment falling from 5.7% in 2014 to a projected 4.3% for 2017 and then 4.2% in 2018 and 2019, based on the median forecast. This is a slight decline from the March 2015 forecast.
With inflation nearing its target and unemployment edging down further, the US Federal Reserve has begun a gradual withdrawal of monetary stimulus programs. With growth picking up, interest rate rises are predicted to offset inflationary pressures. The Trump administration and Congress are formulating plans to cut taxes and increase infrastructure spending.
US construction growth in 2017 could get an additional boost if, as announced, the administration invests heavily in infrastructure improvements. After the US Federal Reserve raised interest rates in December 2016, further increases are expected in 2017, which could result in accelerated buying activity in the housing segment.
Banks are still cautious with their lending practices, with only viable projects receiving financing. As the commercial and residential development markets strengthen, the construction sector´s economic climate is improving, however, increasing salaries, healthcare costs for staff, and miscellaneous expenses continue to weigh on the already-tight margins of many US construction businesses.
In May 2017, non-residential construction spending expanded by 0.3% on both a monthly and yearly basis and stands at USD 714.3b on a seasonally adjusted annualised basis, according to analysis of a report by the US Census Bureau.
Going forward, the key issues facing the US construction industry will be the rising costs of labour and materials, and construction firms ongoing struggle to maintain sustainable profit margins.
reGional relaTiViTiesCITIEs Q3–2017NEW yORK 193hONOLuLu 189sAN FRANCIsCO 189BOsTON 164ChICAGO 160WAshINGTON DC 155LOs ANGELEs 155sEATTLE 129PORTLAND 117DENvER 111PhOENIx 108LAs vEGAs 106
2017 foreCasTed esCalaTion
NET ZONE MOVEMENT BY SECTOR Q4 2016 TO Q3 2017
4
3
2
1
-1
-2
-3
-4
0
HOUSES APARTMENTS OFFICES INDUSTRIAL RETAIL HOTEL CIVIL
PEAK ZONE
MID ZONE
TROuGh ZONE
reGional MarKeT aCTiViTY CYCleSECTORS PER ZONE
3421
36

Location inteLLigenceAMERICAS
Rider Levett Bucknall | International Report – Third Quarter 201720 |
ChICAGOChicago presents a unique economic picture. Despite an increase in local job opportunities (automakers Ford and Chrysler expanded their facilities on the city’s south side) and low unemployment rates, one of the major problems facing the market is a declining labour force, which is now at its lowest level since March 2006. In January 2017, the not- seasonally-adjusted unemployment rate in Chicago was well above the national unemployment rate. However, things turned around over the last few months; in May 2017, Chicago’s unemployment rate stood at 4.1%, just below the national unemployment rate of 4.3%. Chicago-Naperville-Arlington Heights Metro Division added a total of 24,600 non-farm jobs year-over-year in May 2017, with financial services, educational, and health services combining to contribute 17,100 jobs to the economy while the retail and manufacturing sectors gave up 6,400 jobs.
With high-profile companies such as Google and McDonald’s moving to the West Loop area, and a very low vacancy rate for office space in downtown Chicago, it can be expected that more office buildings will be rising into the skyline. Tech firms are also looking at Chicago as the next urban centre for their expansion.
As a rule, first-quarter retail sales activity in Chicago is often weak due to cold, harsh conditions keeping shoppers at home. However, weather is not the primary challenge facing local sellers; the sector is suffering from the competition posed by online merchants. In response, developers have started to encourage broadening the focus and function of traditional commercial/retail centres, transforming them into entertainment centres with the strategic inclusion of bottom-line boosting restaurants and bars.
Despite slow economic growth, crane counts in the Chicago area are at their peak. Significant projects either under construction or in pre-construction phase are distributed across all sectors. These include: Riverline, a 14-acre site with new residential, retail, and public open space; the Carillon, a 60-story, mixed-use tower in River North; at the University of Chicago, Campus North Residential Commons, William Eckhardt Research Centre, and David M. Rubenstein Forum; the Focal Point Community Campus, featuring a new facility for Saint Anthony hospital and other amenities such as fitness facilities, sports fields, and other community-oriented services; and the Fulton Market office project.
LAs vEGAsThe gaming and entertainment industries have always been a top attraction in Las Vegas, consistently bringing millions of visitors and trillions of dollars to the Silver State. According to Las Vegas Convention and Visitor Authority, 42.9 million people visited the city in 2016, driving hotel occupancy rates to above 90% and generating USD 9.7 b in gaming revenue.
At the height of the 2006 boom, 111,100 people were employed in the construction field in Las Vegas. But the 2008 Great Recession drastically reduced that workforce by 68%, leaving only 35,700 workers in the industry as of April 2012. The industry is now on the rebound, spurred by single-family housing construction. From 2015 to 2016, housing permits for this sector rose by 28%, to 13,577. Reflecting this growth, the 2016 'All Transactions House Price Index' issued by the US Federal Housing Finance Agency increased by 7.67%. At the same time, the real GDP of Nevada increased by 5.94%, with the state’s real construction GDP increasing by 17.2%. Overall unemployment is down to 4.9% in first quarter of 2017 as compared to 6.3% of the same period in 2016.
Las Vegas’ construction workforce is increasing at a speed faster than New York, San Francisco, Los Angeles, Seattle, and Chicago. There was a 33% spike in Las Vegas’ construction workforce in the last three years, which increased the construction employees from 40,458 in 2013 to 53,794 in 2016. Still, that might not meet the upcoming demand in the market in the near future.

Location inteLLigenceAMERICAS
Rider Levett Bucknall | International Report – Third Quarter 2017 | 21
Over the next five years, the city will be a solid construction market as major arena, convention centre, and resort/casino projects get underway. With a collective budget of more than USD 9b, the new Las Vegas Raiders Stadium, Las Vegas Convention Centre Expansion, Wynn Paradise Park, and Resorts World by Genting are the headliners in the city’s upcoming construction projects. There are labour shortages in the city, particularly for skilled trade workers. According to the Nevada Governor’s Office of Development, southern Nevada will be short about 10,000 construction workers needed to complete the projects already in the pipeline. It is projected that by the end of 2019, 54,000 construction jobs will have been added to the field since it bottomed out in 2008.
LOs ANGELEsLos Angeles has a truly thriving construction market, with construction costs growing 3.5% over the last quarter and 9% since this time last year.
According to the Los Angeles County Economic Development Corporation (LAEDC), ‘In 2016, real GDP in Los Angeles County grew at 2.2%, a slowdown from the prior year when its economy grew by 3.6%. However, this year’s growth exceeds the national rate, as do projections for the next two years, when the county’s 2.7% growth is also expected to outpace that of the nation’.
Drawing entrepreneurs and risk- takers from around the world, the area offers a diverse economic base to its workforce of more than 4.8m people: manufacturing, global trade, tourism, and entertainment. LADEC’s 2017 economic forecast further noted that during 2016, ‘the average unemployment rate in Los Angeles County reached 5.1%, the lowest since 2007. It is expected to decline slowly over the next two years, falling to 5% in 2017 and to 4.9% in 2018, as the county reaches full employment’. New home construction peaked in Los Angeles County in 2004 at 26,935 units permitted before falling to a low of 5,653 units in 2009. Since then, with the exception of 2016 when 20,213 units were permitted, new home construction has increased at a gradual pace.
Downtown Los Angeles is undergoing a tremendous construction boom, with more than 65 projects proposed in the neighborhood. Among those now under construction are Oceanwide Plaza, a complex of three towers standing 43, 53, and 65-stories tall. Housing more than 500 condominium residences and a 5-star hotel, it will also will include 166,000 square feet of open-air retail. Another downtown project, Metropolis, contains 1,500 residential units and a Hotel Indigo property spread over three buildings. A Richard Meier design that will have a 13-story tower, a 15-story tower, and public gardens, One Beverly Hills is located at the intersection of Wilshire and Santa Monica boulevards. It will include 193 high-end condos, 134 hotel rooms, and several restaurants.

22 |
MGM – National Harbor, Maryland, USA
Architect: SmithGroupJJR

Location inteLLigenceAMERICAS
Rider Levett Bucknall | International Report – Third Quarter 2017 | 23
Architect: SmithGroupJJR
NEW yORKOne of the world’s most expensive cities in which to build, New York tallied USD 42b in construction spending in 2016, an all-time high, up by 2.9% from 2015 and 30.9% from 2014. The city’s economy is growing at a record pace. The real GDP of the New York state was USD1.27 trillion in 2016, up 2.0% compared to USD 1.25 trillion in 2014. The construction GDP of the state is increasing at a greater pace than the overall GDP. The construction GDP was recorded at USD 40b in 2016, up 8.6% from USD 36.9b in 2014.
The city’s economy and population are growing at a record pace. 2016 marked five consecutive years of growth in construction employment, with 2017 estimated to reach 147,800 jobs. According to the US Bureau of Labor Statistics, 43,300 employees are dedicated to the construction of buildings in New York City, up 43.9% from 30,100 in 2010. According to the New York Building Congress, the average compensation of construction workers in 2015 was USD 76,100, which increased by 5.38% to USD 80,200 in 2016. Civil engineering and heavy construction employees remained the highest paid workers in the industry with an average salary of USD 116,800 in 2016.
In 2016, the total number of permitted housing units in New York Metropolitan Area—which includes Northern New Jersey and Long Island—was 43,321, down 50% from 2015, but much above the average of last five years.
The borough of Manhattan is home to numerous major developments in New York City. A cluster of skyscrapers, Hudson Yards will offer more than 1.18m square metres of new office, residential, and retail spaces. Currently under construction, the massive project is expected to cost in excess of USD 20b and will accommodate 65,000 daily visitors. Scheduled for completion in 2019, Central Park Tower will reach 472 metres in height. One Vanderbilt started construction in 2016. When finished in 2020, the 58 floor commercial office tower will have cost more than USD 3.1b to build. Looking ahead, it is expected that New York City construction will be booming in the years to come, with ongoing and new residential, mixed-use, and commercial projects.
sAN FRANCIsCO Construction in San Francisco continues to its upward trend in all market sectors, with towers rising throughout the city’s South of Market (SoMa) district for office, residential, and hospitality use. The activity is reflected in the local employment picture; in Q1 2017, the overall unemployment rate in San Francisco was 3.5%, (the second lowest since Q1 2001, when the rate was 3.4%), with particular gains noted in the construction field. May 2017 saw 7.4% more people working in the construction industry in San Francisco than in May 2016, when 112,000 employees were counted. Still, the market is feeling the stress of success, as large projects throughout the city and the region have kept labour and equipment resources in constant demand.
According to San Francisco based Paragon Real Estate Group, approximately 64,000 housing units, 2.9m square metres of commercial space, and 25 hotels (4,600 guest rooms) are in the pipeline, with 5,700 housing units and five hotels currently under construction. Permits for 14,787 housing units, including 4,967 single-family dwellings, were issued in 2016. The tallest building in San Francisco, the 61-story, USD 1.1b Salesforce Tower, is nearing its structural topping-off. Oceanwide Centre’s two towers (one which will claim the title of the city’s second tallest building) has broken ground. A key commuter hub, the TransBay Terminal, should wrap up construction by the end of the year. In a project that will impact the city’s tourism revenue, the Moscone Convention Centre is undergoing a USD 500m expansion. Responsible for 21% of the local tourism income, the facility will operate at a drastically reduced level until construction is complete in 2018, resulting in a loss of 290,000 visitors during 2017.

24 |
Shangri-La the Fort, Taguig City, Philippines
Architect: GF & Partners Architects, Inc. and Handel Associated Limited

REGIONAL INTELLIGENCE
ASIA
Rider Levett Bucknall | International Report – Third Quarter 2017 | 25
Asia continues to perform well, with the region forecasted to expand GDP by 5.7% in 2017 and 2018, just down from the 5.8% growth achieved in 2016, according to the Asian Development Bank. Moderation in the People’s Republic of China (China) is being offset by strong results in most other economies in the region.
Asia’s Market Activity Cycle is highlighted by an overall sector movement from peak to mid since our last report. The house, apartment and hotel sectors have all shown that construction activity may have peaked across the region.
Continued expansion helps developing Asia deliver more than 60% of global growth. Growth is picking up in 30 of the 45 economies in developing Asia, supported by higher external demand and rebounding global commodity prices, according to the Asian Development Bank.
In 2017, China’s growth is forecasted to grow at 6.2% in 2017 and 6.0% in 2018 according to the latest IMF forecasts. The national economy is expected to stabilise as a whole with long term growth significantly above the global average with CPI to rise by about 2.3% in 2017.
China continues to rebalance, depending more on consumption to drive growth. The continuing shift of economic activity from industry to services shows that the central government’s planned rebalancing of the economy is progressing as planned. Growth in China now relies more on internal demand and less on exports. The authorities are likely to emphasise the maintenance of financial and fiscal stability and accept the cost of marginally lower growth.
India’s growth is expected to edge up to 7.4% in 2017 and 7.6% in 2018. Growth in the Asean 5 economies is forecast to accelerate further. After rising 0.3% to 5.1% in 2017, growth is forecasted, by the IMF, to continue to improve to 5.2% in 2018 and 5.4% in 2019. Indonesia, the largest economy in the subregion, should see fiscal and structural reforms boost domestic demand.
Uncertain policy directions abroad could undermine the regional outlook. While baseline assumptions have factored in gradual increases in us interest rates, sharper-than-expected us monetary tightening could have further consequences for developing Asia. Possible shifts in trade and tax policies, especially policy changes being discussed in the US, could create uncertainty for business investment.
Rising prices for global food and fuel prices and in agricultural output will help commodity producers such as Indonesia, Malaysia, and Vietnam. Rising commodity prices also fuels inflation within the Asean 5 countries with 3.4% being forecasted in 2017, rising to 3.6% in 2018.
RLB’s forecasted TPI across Asia shows lower than inflation increases over the next few years with the majority of RLB offices across the region forecasting within a band of 2% to 3% for 2017. Both Hong Kong and Singapore are forecasting negative or zero TPI growth for 2017.
reGional relaTiViTiesCITIEs Q3–2017hONG KONG 157MACAu 137sINGAPORE 104shANGhAI 91BEIJING 90GuANGZhOu 82shENZhEN 80KuALA LuMPuR 77hO ChI MINh CITy 74JAKARTA 64
2017 foreCasTed esCalaTion
NET ZONE MOVEMENT BY SECTOR Q4 2016 TO Q3 2017
4
3
2
1
-1
-2
-3
-4
0
HOUSES APARTMENTS OFFICES INDUSTRIAL RETAIL HOTEL CIVIL
PEAK ZONE
MID ZONE
TROuGh ZONE
reGional MarKeT aCTiViTY CYCleSECTORS PER ZONE
30
24 37

Location inteLLigenceASIA
Rider Levett Bucknall | International Report – Third Quarter 201726 |
BEIJINGBeijing's GDP in Q4 2016 maintained its path of steady growth at 6.7% y o y, a rate at which it has kept for the first three quarters, according to official statistics. However, the construction industry was in a declining trend with its GDP growth falling by 5.6%, from 13.3% in 2015 to 7.7% last year. The construction volume of residential properties decreased by 6.1%, from 63.1m square metres to 59.3m square metres in 2016. Sales of residential units also went down by 11.9%, from 11.3m million square metres in 2015 to 9.9 million square metres in 2016. This slowdown in construction is expected to be maintained much into 2017 as the country continues on its path of a lower economic growth rate until year 2020.
In 2016, housing prices in Beijing continued on their path of escalation, despite tough measures implemented to curb housing prices such as restricting local residents from purchasing additional houses, requiring non- local residents to provide social security payment records prior to purchasing houses, and increasing the down payment ratio. The Beijing Municipal Government plans to implement further tightening measures in 2017 to dampen speculative activities in residential properties.
However, led by increases in infrastructure and construction investment, Beijing as a whole attracted more investment in 2016 as compared to the previous year. Fixed asset investment was up by 5.9% or RMB 47b y o y from RMB 799b to RMB 846b in 2016. Overall inflation rate was only down by 0.4% from 1.8% in 2015 to 1.4% in 2016.
In 2017, Beijing will focus on major missions planned to promote the Beijing-Tianjin-Hebei integrated development, speed up sub-centre construction in Tongzhou and to fight air pollution.
Beijing will fund the new airport construction to boost the transport network in the Beijing-Tianjin- Hebei region. The relocation of Beijing Zoo Wholesale Market will be completed this year. The relocation project forms part of a broader plan for the integration of Beijing-Tianjin-Hebei and eventually all the wholesale markets in Beijing downtown will be relocated away from the city centre in keeping up with Beijing's new wave of development, and to reduce traffic congestion and population density.
This year, the city will also strengthen air pollution treatment, replace coal by clean energy for villages, phase out old vehicles with high pollution and close down or upgrade polluting factories. According to Beijing authorities, over 350 km of subway lines will be constructed this year, including 6.1 km branch of the Yanfang line, which will be China's first driverless line. There will be 3 new subway lines, with a total of 34.6 km starting operation this year.
The prices of construction materials have been increasing moderately since Q2 2016. However, as labour costs had been steady and the contractors’ prices remained competitive, overall tender prices had little movement in 2016. With the anticipation of more infrastructure projects in 2017 and more stringent environmental protection regulations against construction activities, it is expected that tender prices will increase by 2.0 to 3.0% in 2017.
ChENGDuChengdu’s economy has been maintaining a moderate growing pace. Chengdu’s total GDP in Q4 2016 was RMB 304.3b, an increase of 7.7% y o y and 0.9% higher than the national GDP growth rate.
In Q4 2016, a total of RMB 66b was invested in the local real estate, an increase of 6.5% y o y, which was a slower increase rate, while a total of RMB 37.7b was invested in Tianfu New District, an increase of 17.6% y o y.
Chengdu Government promulgated some measures to restrict house purchasing in some districts of Chengdu, such as High-tech Zone Southern Park and Tianfu New District, in November 2016 and March 2017 in order to stabilise house prices and prevent the market from overheating.
According to the Land and Resources of Sichuan Province in 2016, the Chengdu Government has supplied approximately 1,500 hectares of land for residential development and 870 hectares for commercial use, representing a yearly increase of 5.8% and decrease of 15.7% respectively. Land prices and turnovers have sharply increased compared with 2015. Land prices increased about 50% compared to 2015 in some districts.
In 2016, the cumulative sale of new residential buildings in Chengdu was about 9.9m square metres or 98,608 suites, representing an annual increase of 11.3% and 6.1% respectively.
To cope with new town developments, infrastructure projects are speeding up in Chengdu. Chengdu Metro contributes the highest volume of works, as well as the highest investment in construction. Chengdu Metro Line 18 project is the first PPP subway project in Chengdu, and is also the largest urban subway investment project in PPP mode and the first metro line with the fastest design speed of 140km/hour in China. The length of Metro Line 18 is about 66.7km and the tunnel section under construction is the longest for a metro line in mountains.
Location inteLLigenceASIA
Rider Levett Bucknall | International Report – Third Quarter 2017 | 27
In April 2017, the provincial government of Sichuan officially launched its Pilot Free Trade Zone (FTZ) covering three different areas in the cities of Chengdu and Luzhou, covering 120 square kilometres.
The two cities included in the pilot FTZ programme have clear divisions of responsibility. Chengdu takes care of developing modern service industries, high-end manufacturing, and international logistics services, based on the existing air and railway network.
Companies from across the world can now enjoy more favourable policies to do business and invest in Sichuan's free trade zone, including lower taxes, greater business opportunities, and adequate legal support. To better serve companies and individuals, the FTZ centre provides services in 55 different languages. It also employs big data analysis to streamline its work and customize its programmes.
Previously, China’s FTZ programmes focused on cities in Eastern China and the coastal regions. But this time, three of the seven areas -- Sichuan, Chongqing and Shaanxi -- are located in Western China. Experts point out that this is a continuation of national policies introduced to help develop the west, an initiative launched in 2000.
Given its location, Sichuan Province will also benefit from the growth of the Yangtze River economic belt, by working with cities along the river. Additionally, as a traffic hub, the province will promote the implementation of the Belt and Road Initiative, providing more business opportunities for countries in Europe and Southeast Asia.
Labour costs increased 6.3% while the prices of concrete and steel increased 4.3% and 19.9% respectively in Q4 2016 compared with the end of 2015. On the other hand, the prices of ceramic, wall finishes and stone finishes have only risen moderately. Tender prices in 2017 are expected to rise mildly.
GuANGZhOuGuangzhou's economy grew 8.2% y o y in 2016, which was higher than the national GDP annualised growth rate of 6.7%. CPI rose 2.7% in the year. The major economic statistical data for the year including retail sales, fixed asset investment, industrial output, and exports also showed signs of stable growth. However, there are many downside risks that may affect the economy both domestically and beyond the borders. Uncertainty in US trade policies, the looming property bubble and the pressing need for reforms in the economic structure and financial system are just a few.
In response to soaring housing prices since late 2016, many cities in Mainland China have been implementing various curbing measures such as raising the down payment for housing purchase, imposing harsher requirements on eligibility for purchases by foreigners. Comparatively speaking, Guangzhou’s tightening measures were more lenient so that it was the only major city that still saw rising housing prices as late as January 2017. It is likely that the municipal government will take further efforts to cool down the property market, resulting in a deteriorating investment sentiment.
In light of the robust economic growth, the central government is expected to be more willing in driving harder the necessary structural reforms of the economy at the expense of the growth numbers. A projected slower growth in 2017 is virtually a consensus in the market. The slowdown will probably be rather modest given China’s track record of favouring experimental modes of working at a measured pace.
Property construction activity in Guangzhou has been falling since late 2015. The total floor area of property under construction in
2016 was 115.6m square metres falling 11.9% on an annual basis. This declining trend is likely to continue in the first half of 2017 resulting from the dismal land supply in 2016. Land sales for the year, in terms of floor areas that can be built, fell 40% from the previous year. The government however has scaled up the land supply sharply since Q4 2016, which accounted for almost 70% in total value of the year. Since the inventory of new houses in the market is running out, to meet the increasing demand there is a high hope that land supply will be beefed up in 2017 bucking the declining trend. Construction activity may pick up strongly in the latter half of 2017.
Material prices including steel bars, concrete, aluminum and copper have been rising since Q2 2016. Tender prices are forecast to be steady or fall slightly initially and edge up later in 2017 giving a moderate annual rise of 2 to 3%.

28 |
Shanghai Tower, Shanghai, China
Architect: Gensler

Location inteLLigenceASIA
Rider Levett Bucknall | International Report – Third Quarter 2017 | 29
hO ChI MINh CITyVietnam remains as Southeast- Asia’s fastest growing economy with a resilient export growth amidst a global trade slowdown in 2016. Affected by a crippling drought in the early part of the year, the country's economy suffered its first slowdown in four years in 2016 and the annual economic performance slipped from the previous year's achievement of 6.7%. GDP expanded 6.21% in 2016, slightly behind the target of 6.3%-6.5%, but higher than the International Monetary Fund’s (IMF) estimate of 6.1%, according to data from the Government Statistics Office (GSO).
Based on information released by the Ministry of Planning and Investment, Vietnam’s economy has benefited in the past five years from the steady inflow of foreign direct investments (FDI) and the most significant performance of Vietnam’s economy in 2016 was the strong increase in FDI. Attracted by cheap labour and tax incentives offered by the country and partly in anticipation of the Trans-Pacific Partnership (TPP), actual foreign investment inflows rose by 9.0% in 2016 from the previous year and reached a record high of USD 15.8b. Most of the FDI went to the manufacturing and processing sector. The real estate received 6.9% of the inbound investments. South Korean investors pledged the most funds in 2016 with conglomerates like LG and Samsung Electronics Co. setting up plants in the country, transforming it into a manufacturing hub for electronics goods, including smartphones.
The relaxed policies on foreign ownership of property helped lure the foreign investment needed to boost market liquidity saddled with an oversupply since the real estate bubble burst in 2011. The Vietnam Real Estate Association (VNREA) is positive the local real estate market will be driven by foreign buyers demand in 2017. Low cost housing remains an urgent issue for the real estate sector. HCMC Real Estate Association (HoREA) forecast that the needs for low cost commercial and social housing for lease will approximate one million apartments in the next decade, as current supply has only met 13% of total demand in the city.
Barring any unforeseen market conditions, building tender prices in Ho Chi Minh are anticipated to increase by about 3.0% to 5.0% in 2017.
hONG KONGHong Kong’s economy grew by 4.3% y-o-y in real terms in Q1 2017, compared with the 3.2% increase in Q4 2016. On a seasonally adjusted quarter-to-quarter comparison basis, real GDP increased by 0.7% in Q1 2017 over Q4 2016. According to the Composite Consumer Price Index, overall consumer prices rose by 2.0% in May 2017 over the same month a year earlier but remained unchanged as compared to April 2017. The seasonally adjusted unemployment rate stood at 3.2% in March 2017 to May 2017. The underemployment rate remained unchanged at 1.2% in the two periods.
In the Budget Speech 2017- 18, increasing land and housing supply continues to be one of the government’s top priorities. The estimated number of private residential units to be produced will reach an average of about 20,300 each year in the next five years, representing an increase of about 70% over the yearly average in the past five years. At the same time, a number of land plots for commercial and hotel developments will also be tendered out this year which is generally welcomed by the market. The steady land supply policy and the government’s capital work program such as the HKD 200b ten year hospital development plan, Kai Tak Sport Park, Tung Chung New Town Extension and Central Kowloon Route will provide sustained support to the construction industry in the coming few years.
According to RLB’s Tender Price Index, which measures tender price movements of builder’s works in the private sector in Hong Kong, the tender prices remained steady in Q1 2017. On a y o y basis, the increase was 0.6%. With a tight labour supply and a relatively stable material market, tender prices are expected to move moderately within a narrow range in 2017.

Location inteLLigenceASIA
Rider Levett Bucknall | International Report – Third Quarter 201730 |
JAKARTAWith muted domestic consumption, low global commodity prices, tepid foreign investment, reduced government spending as well as some infrastructure bottlenecks, Indonesia’s gross domestic product in 2016 expanded 5% y o y, falling short of the government’s initial target of 5.3% y o y and only marginally better than the revised target of 5% y o y.
The Ministry of Finance and the IMF project Indonesia’s economic growth to accelerate to 5.1% in 2017. The IMF pointed out that the majority of risks faced would be associated with external factors, including weaker growth in China, low commodity prices and tighter global financial conditions amidst uncertainties about US policies under the Trump administration. Similarly, the World Bank thinks that the country has the potential to grow to 5.3% y o y on the back of more robust private investment following monetary easing in 2016 and on-going investment climate reforms, including the Tax Amnesty Program.
The government expects global uncertainties to linger in 2017 and continue to have a significant impact on Indonesia’s economy, but it is optimistic that its 2018’s economic growth could exceed slightly beyond 6.0% y o y with the view that there would be a more stable global economy and the country will be hosting the 2018 Asian Games and annual IMF meeting. These events could boost investments in the country and the property and construction sectors could benefit tremendously.
The property market is expected to remain soft, at least in 1H 2017. According to market sources, the rescheduled completion of some office buildings in 2016 may cause demand to lag behind supply in 2017. For the residential property segment, there were about 19,300 apartments completed during 2016. The cumulative supply of apartments in Jakarta increased by 12.3% y o y and brought the total stock to 176,178 units. The residential property demand is expected to improve in 2017, as the impact from a set regulation relaxation meant to boost property demand, introduced in 2016, sets in.
The Ministry of Public Works and People’s Housing announced that the country’s construction sector contributed 0.5% y o y to national economic growth in 2016. Data from Statistics Indonesia (BPS) shows that the construction GDP averaged IDR 194.3 trillion (approx. USD 14.5b) from 2010 until 2016, reaching an all-time high of IDR 245.4 trillion (approx. USD 18.3b) in the last quarter of 2016.
Several major transportation projects are currently undergoing construction in Jakarta, including the Soekarno-Hatta Airport railway link. The construction of railway station in the airport will be completed by the end of March 2017 while airport link is expected to be finished before the end of 2017. The construction market is likely to continue relying on the government’s ambitious effort to boost the country’s infrastructure in 2017.
In the 2017 State Budget, the government allocated IDR 387.3 trillion (approx. USD $29b) for infrastructure development, up from IDR 317.1 trillion in the 2016 budget. There is IDR 377.8 trillion allocated for the nation's hard infrastructure, IDR 5.5 trillion for social infrastructure, and IDR 4.1 trillion for supportive infrastructure. The largest proportion of the Budget goes to the Public Works & Housing Ministry.
Indonesia looks set to have Southeast Asia’s first high speed railway by May 2019. The high- speed rail connects Jakarta to Bandung across 142.3km at a cost of an estimated IDR 76.2 trillion (approx. US$5.7b).
However, at the beginning of 2017, construction has reportedly fallen behind schedule due to surging land prices and local objections to land acquisition required for the mega development. The unfinished land acquisitions also risks disrupting the Chinese loan disbursement for the project. According to the National Development Planning Agency (Bappenas), as government and private sector infrastructure projects escalate, the construction sector is forecast to grow by 8.1% y o y in 2017.
Barring any unforeseen market conditions, building tender prices in Jakarta are anticipated to increase from 1.0% to 4.0% in 2017.

Location inteLLigenceASIA
Rider Levett Bucknall | International Report – Third Quarter 2017 | 31
shANGhAIIn 2016, the Shanghai Government encouraged innovation and monitored the advancement in new industrial transformation. Overall, Shanghai's economy achieved a steady growth, with GDP amounted to RMB 2.75 trillion in 2016, a y o y growth of 6.8% and a drop of 0.1% as compared to last year.
In 2016, real estate investment in Shanghai amounted to RMB 370.9b, y o y growth of 6.9%, representing 54.9% of total investment in fixed assets in Shanghai. Total investment of residential projects was RMB 196.5b, a y o y growth of 8.4%; total investments of offices and commercial projects were RMB 69.6b and RMB 51.9b, a y o y growth of 6.3% and 11.1% respectively. The increase of investment in the commercial sector was higher than that of the residential and offices sectors.
Meanwhile, the total floor area under construction in real estate development was 151.1m square metres (a y o y growth of 0.1%) of which 80.7 m square metres were residential developments (a y o y drop of 3.6%). The total floor area of new projects was 28.4m square metres, up by 9.1%. The total floor area of new residential projects was 14.4m square metres, a drop of 8.0%. Total real estate completions reached 25.5m square metres, a drop of 3.6%. Total completed residential floor area was 15.4m square metres, a drop of 3.5%. Total sold area for real estate development was 27m square metres, up by 11.3%. Total residential floor area sold was 20.2m square metres, up by 0.5%.
In 2016, Shanghai launched 122 major projects, including commencement of 42 projects, representing an increase of 22 projects as compared to last year. Total investment amounted to RMB 128.01b.
In 2017, the Shanghai government will increase its investment in urban transportation, including construction of Metro transit up to 55 km long, the high-way of Jungong Road, the third phase of Pudong International airport, driveway connecting Beihong Lu/ Changning Lu to Zhou Jia Zui Lu, and the riverside driveway with tunnel crossing Huangpu River.
Large-scale projects under construction in Shanghai include Hongqiao Transportation Centre with exhibition, office and commercial areas, Qiantan development centre, Xuhui Central Urban Complex development, and Xuhui Binjiang Centre UrbanComplex development.
Several Shanghai districts are luring investors with industrial parks or programs. The Shanghai G60 Sci-tech Corridor, a joint venture between Songjiang government and Lin'gang Area developer, is a high-tech park for entrepreneurs and investors.
The prices of major construction materials (such as steel, cement, concrete and sand) have been trending upwards since Q2 2016. The price of steel in Q2 2017 has returned to the same levels as in Q1 2013. Tender prices have increased 6% from Q2 2016 to Q2 2017. It is expected that the upward trend will continue in the coming months in 2017 with an annual increase of between 3 to 5%.
shENZhEN
Shenzhen's GDP amounted to RMB 1.93 trillion in 2016 representing a 9% growth as compared with that in 2015. This surpassed its economic growth target of 8% as set by the government, largely thanks to the investment in information technology and other hi-tech industries. The goal for 2017 is 8.5%. The economic growth is exciting, so is the rapid surge in property prices. Despite the various cooling measures enforced by the government, property prices rocketed by more than 70% from Q1 2015 to Q3 2016. This may deter talents from migrating to the city as the cost of living becomes unaffordable. The government implemented further controls earlier this year aiming to curb the sharp rise in property prices. The result is yet to be seen.
There will be more major commercial developments in the Qianhai area in 2017. For the relatively saturated Futian area, the government is planning to demolish the existing Shenzhen Convention and Exhibition Centre and relocate it next to the Shenzhen International Airport. This will provide new land supply in Futian to allow for new developments and at the same time beef up the developments around the airport. The long awaited Shenzhen Zhongshan corridor will connect the BaoAn area where the Shenzhen International Airport is situated across the Pearl River to Zhongshan. This will greatly enhance the connectivity between Shenzhen and the nearby cities at the western side of the river.
With the continuous flow of new developments in the coming few years and the increase in raw material prices, tender prices is expected to increase moderately in the medium term.

32 |
Marina Bay Sands, Singapore
Architect: Safdie Architects

Location inteLLigenceASIA
Rider Levett Bucknall | International Report – Third Quarter 2017 | 33
sINGAPORESingapore’s economic growth and business sentiment remain impacted by external factors.
For the whole of 2016, economic growth expanded by 2.0% slightly faster than the 1.9% for 2015, primarily weighed down by sluggish domestic private sector construction activities that shrank on the back of a decline in private residential and private industrial works. The manufacturing industry contributed the most to the GDP as its growth leaped to 3.6% in 2016, from -5.1% in 2015. Private sector construction demand in 2016 declined to half of that in 2015 in tandem with the slow global economy, causing the overall construction industry's growth to significantly slow down to 0.2% in 2016, from the 3.9% in 2015. Taking into account the global uncertainties, and barring the full materialisation of downside risks, the Ministry of Trade and Industry maintains Singapore economy to expand at a modest pace of 1.0% to 3.0% in 2017.
The construction scenario in Singapore currently looks dull. The public sector construction demand achieved about S$15.3b in 2016, boosted by major infrastructure projects including the second phase of the Deep Tunnel Sewerage System, the North-South Corridor and Circle Line 6. The Building Construction Authority (BCA) expects the total value of construction contracts to be awarded in 2017 to reach between SGD 28b and 35b, higher than the preliminary estimate of SGD 26.1b for 2016 and the public sector construction demand to improve to between SGD 20b and 24b in 2017.
Private sector construction demand this year is projected to stay between SGD 8b and 11b, weighed down by economic uncertainties and the property market slowdown.
According to the BCA’s estimates, public sector construction demand for 2018 and 2019 will be between SGD 26b and SGD 35b per annum, growing to between SGD 26b and 37b per annum in 2020 and 2021. Besides public housing, healthcare and educational facilities, public sector demand over the next few years will include key infrastructure projects such as the Jurong Regional Line, Cross Island Line and the development of Changi Airport Terminal 5.
The BCA Tender Price Index (TPI) fell an annualised 5.8% in 2016 from 2015 on the back of higher labour costs and intensifying competition over a shrinking pool of jobs. Tender prices and project margins are projected to trend downwards in 2017. Based on current market trends and barring any unforeseen changes in market conditions, RLB expects building tender prices in Singapore to shrink a further -2.0% and -1.0% in 2017.

34 |
Charter Building, UK
Architect: dn-a
The Regional Market Activity within Europe shows an even distribution of sectors within the three zones as highlighted by the donut graph on page 35. Since our last publication, positive movement has been seen within all sectors indicating a growing confidence in the general economy and direction of the Euro Area countries together with little impact from the UK’s Brexit. The number of sectors moving in a positive direction has increased with more activity being seen in the industrial, hotel and civil sectors.
The Eurozone economy has emerged as a bright spot in global growth this year, expanding 0.6% in Q1 2017 over the previous quarter, the best result in two years as growth broadens across economies. The overall European economy is performing well despite a number of challenges. Although political uncertainty is clearly receding, the region is not yet completely stable. In the Netherlands, a government still has yet to be formed after March’s elections. Italy has rejected a new electoral law that would have brought about elections sooner. In addition, while Spain’s economy is performing robustly, tensions are rising between the central government and Catalonia, which is planning to hold a referendum on independence in October 2017.

REGIONAL INtELLIGENcE
EUROPE
Rider Levett Bucknall | International Report – Third Quarter 2017 | 35
reGional relaTiViTiesCITIEs Q3–2017OsLO 236PARIs 177LONDON 171BERLIN 165BRIsTOL 147MANChEsTER 137DuBLIN 135BIRMINGhAM 133MOsCOW 132MADRID 120BuDAPEsT 91
2017 foreCasTed esCalaTion
NET ZONE MOVEMENT BY SECTOR Q4 2016 TO Q3 20177
5
3
6
4
2
1
-1
-2
-3
0
HOUSES APARTMENTS OFFICES INDUSTRIAL RETAIL HOTEL CIVIL
PEAK ZONE
MID ZONE
TROuGh ZONE
reGional MarKeT aCTiViTYSECTORS PER ZONE
31
33
41
The economic expansion continues in 2017, achieving four years of moderate, uninterrupted GDP growth. Recent data show economic growth continuing at a steady pace, supported by macroeconomic policies, robust job creation, strong confidence, a gradual improvement in world trade, and the euro’s relatively low exchange rate. Overall, euro area GDP growth of 1.7% was seen in 2016 and is set to rise to 1.6% in 2018, according to the IMF.
Bank lending rates have remained at low levels since the beginning of 2017. Bank lending in the euro area as a whole is expected to expand further due to increasing demand and the capacity of banks generally has improved by strengthening their capital positions and reducing the risk on their balance sheets.
According to the European Commission in their spring 2017 economic forecast ‘Private consumption has been the main growth driver over the past few years, growing at its fastest rate in 10 years in 2016. Continued improvements in the labour market situation have fuelled consumer confidence, suggesting that the short-term outlook remains favourable. Private consumption should pick up again slightly next year as inflation recedes’. Job growth in the euro area grew by 1.4% in 2016, its best performance in eight years.
The construction sector was severely hit by the economic and financial crises and only really started to recover last year. The Commission’s Construction Confidence Indicator, reached a post-crisis high in the first quarter of this year (-11.0 in the euro area, -9.2 in the EU). Construction
output has continued increasing but still remains well below pre-crisis levels. The forecast also stated that the annual rate of growth in loans for house purchases in February 2017 increased further to 2.9%, the highest rate since November 2011. Overall, construction investment is expected to expand in the euro area by 2.8% in 2017 (up from 2.5% in 2016) and by 3.5% in 2018.
The Confederation of British Industry recently lifted its forecasts for economic growth to 1.6% for 2017, but falling to 1.4% in 2018. Construction new orders in Great Britain rose by 0.7% in the first quarter of 2017, rebounding after two consecutive quarters of decline (ONs - New Orders in the Construction Industry, Table 1). The increase in new orders during the first quarter of 2017 was driven by rises in both private housing and private commercial work, however in April 2017 construction output was down 1.6% on March, driven by falls in both repair and maintenance, and all new work. The fall in all new work in April 2017 was offset by a 5.7% rise in infrastructure works.
Forecast TPI rates for 2017, reflect the differing rates of activity across the region, with rates of escalation between 8.0% in Dublin down to negative -1.0% in Sheffield.
Location inteLLigenceEUROPE
Rider Levett Bucknall | International Report – Third Quarter 201736 |
BELGIuMBelgium’s economy is continuing its slow rebound after the lows of the recession. Its GDP growth in 2016 stayed at a steady 1.3% and is currently on target to marginally increase to 1.4% for 2017. Construction is steadily gaining market share in the national economy, now at approximately 5% and forecast to slowly increase.
As a result of the economy gradually gaining speed, the Belgium construction industry is also building on sustained growth. The recovery is supported by increasing work volumes (larger order portfolios with a longer time horizon), triggered by low interest rates, tighter environmental regulations and insufficient infrastructure investments in the past. Upcoming local elections should also provide a boost to the infrastructure sector, though due to budget constraints, this is unlikely to be as pronounced as previous surges around previous elections.
However, serious growth in the Belgium construction sector is hampered by the still difficult general economic climate present. This is highlighted by the low annual GDP rates of around 1.5%, government budget constraints (with a very price-sensitive public tendering) and the fact that banks
remain restrictive in providing loans to construction businesses. Profit margins continue to be small as Belgium is also hindered by high labour costs, making nearby Eastern European construction businesses often more attractive. This serves to make a very competitive market more so.
Construction companies in Belgium are further hampered by little to no advance payments coupled with long payment terms (‘60 days end of month’ is common) compared to a high working capital needed to operate. Whilst the need for more investment in schools, hospitals and road improvements is there, alongside aged real estate stock, the levels of investment required are not.
BIRMINGhAM (uK)With a number of tower cranes now dotted around the city skyline, the construction market in Birmingham certainly appears buoyant. Whilst confidence may be driven by a number of significant commercial projects, the impact of a general election and commencement of Brexit negotiations has caused some uncertainty in investment decisions. The region feels well placed to capitalise on the increasing trend for relocations out of London and the growing momentum around the High Speed 2 rail project.
With key commercial projects now well underway, a number of PRS projects are commencing across the city centre. Industrial and commercial development outside the city core is also active. A number of speculative projects are commencing. Many of the region’s universities have active pipelines of development.
All in tender price inflation can appear a blunt instrument in forecasting inflation at a project level. There generally remains reasonable competition across much of the supply chain at small to mid-sized projects, whilst larger projects are seeing fewer contractors with both the capacity and capability to deliver. Supply side pressures resulting from currency fluctuations remain a key feature of tender prices.
Location inteLLigenceEUROPE
Rider Levett Bucknall | International Report – Third Quarter 2017 | 37
BRIsTOL (uK)Bristol continues to grow, supported by a robust occupational demand for industrial and office spaces. The demand for this space currently exceeds supply and the pipeline for new space is low due to the ongoing political and economic uncertainty that is affecting funding of projects. The residential market continues to experience high demand with a lack of homes coming on line to meet local authority and government targets. Residential developers are targeting Bristol and Bath for key developments in the PRS sector and there is a continued growth in the provision of student accommodation projects.
Bristol city centre development continues to expand with the acquisition of the 7 acre temple quarter site near the train station for the new Bristol University Business and Law campus (150,000 square feet of education space and 1,500 student beds. There are two speculative office developments in the pipeline, 4 Glass Wharf for Salmon Harvester (200,000 square feet) and on Temple Quarter for Legal & General. The new build industrial sector continues to grow with large schemes being built for Amazon and other retailers on the Avonmouth Severnside industrial parks.
The South West market is experiencing high demand for labour. In particular, the Hinckley Point nuclear power station project is having a major impact on the draw of labour and suppliers, the effect of which is showing in increasing the overall tender prices.
FRANCE Whilst stable, the French economy has failed to see the level of growth that it desperately needs. GDP growth has remained at approximately 1.2% from 2015 to 2016, with no change currently forecast for 2017. Construction currently holds a 4.8% share in the national economy.
The rebound of the French construction sector has finally gained momentum. According to the French Builders Association, FFB, in 2016 construction activity grew 1.9% in volume, after eight years of decline. The recovery was mainly driven by new residential construction activity, which increased 7.4% in 2016. In 2017 construction activity is forecast to increase 3.4%, driven by higher residential and commercial construction output. The on-going recovery is helped by tax exemptions for real estate investors, financial support for first-time buyers and persistently low interest rates.
However, the rebound remains fragile for the time being, as household purchasing power remains constrained and activity in the public building segment remains low due to public budget spending constraints. In addition to this, given the poor construction performance and low demand in previous years, it comes as no surprise that French construction
businesses still face many difficulties. Competition is still fierce and prices and profitability remain low, although profit margin levels are expected to stabilise in 2017 due to the increased demand.
Major players in the marketplace are putting pressure on their subcontractors, and despite the current upturn, banks still remain very selective with their loans, making access to short term credit difficult. Due to the on-going difficulties in accessing short-term credit facilities, cash management remains a major issue for many mainly smaller construction businesses.
Despite these difficulties, the French construction industry is expected to continue to expand past 2017.

Location inteLLigenceEUROPE
Rider Levett Bucknall | International Report – Third Quarter 201738 |
GERMANyDespite a marginal slowdown in the growth factor of the German economy into 2017, the economy remains strong and stable. GDP grew by 1.9% in 2016, and is set to grow by 1.3% for 2017, with the sector share for construction remaining at around 3.3% of the national economy.
According to the German Builders Association, turnover growth will increase 5% in 2017, to more than EUR 112b. Residential construction is expected to increase 7%, driven by the high employment rate, low interest rates and the need to provide new housing for the large number of refugees and asylum seekers. Public construction is expected to increase 5% due to increased investment in infrastructure, while commercial building output is forecast to grow by 3%. This is underpinned by the capability of German construction companies, featuring as they do, a significant amount of specialisation and strength in technical innovations, particularly in the area of renewable technologies.
Despite the continued growth of the last 10 years, it is important to note that the 3.3% share of the national economy is relatively low compared to the rest of Europe, and is down from 6% in the mid 1990’s. Another striking fact is that within the industry, around 90% of
companies are small businesses with 20 or less employees. These small companies account for approximately 45% of the total turnover and are mainly focused on residential projects. Mid-level companies (20 – 100 employees) account for another 45%, and large companies (more than 100 employees) make up the remaining 10%.
Due to this level of smaller companies, the construction industry sees a disproportionally high insolvency rate, with almost twice that of the average. It is also noted that these small companies often lack the financial scope necessary to break into bigger markets, and this makes them vulnerable to the historically late public sector payments.
huNGARyHungary’s economy is in recovery mode at present, gaining momentum after the second of the two dips caused by the recession. GDP grew by 3.8% in 2016, and is forecast to hit a similar figure for 2017 after a strong start to the year, with more of the same for 2018. The Hungarian construction sector is the stand out performer of the economy, with a 14.9% year on year predicted growth in the period from 2017 to 2019.
This sustained period of growth is largely due to the government's increasing efforts to improve transport infrastructure and develop regional connectivity. Plans to increase the nation's energy production are also expected to support funding in energy infrastructure projects. Consequently, the industry will rise from a value of USD 10.4b in 2015 to USD 11.9b in 2020, measured at constant 2010 USD exchange rates. Infrastructure construction was the biggest market in the Hungarian construction industry, accounting for 36.2% of its total value in 2015. It is expected to increase in importance over the next five years, although marginally, to account for 37.3% of the industry's total value in 2020. A potentially key project to support this growth is the Paks II nuclear power plant that has just been cleared for state investment.

Location inteLLigenceEUROPE
Rider Levett Bucknall | International Report – Third Quarter 2017 | 39
Hungary’s residential market is also experiencing strong growth. Property prices were up approximately 10% in 2016 and homes on sale almost doubled from 2015 figures, alongside a 31% increase in new build dwellings. This has served to boost activity in the property market and has created an attractive market for private investment.
Whilst the intention and investment is in place, Hungary is still struggling with the necessary skilled workers with which to deliver construction projects. Following the double dip recession many of the required employees left the country as demand vastly decreased. This is slowly increasing, and the Hungarian government is looking to incentivise moving into the construction industry through qualification. However in the short term, Hungarian companies are relying largely on expensive foreign workers to plug the gaps.
IRELAND Ireland’s strong economic growth is set to continue over the next two years, though it is inevitably slowing down. Demonstrating this, GDP was up at 5.2% growth in 2016, which is set to fall to 4% and 3.6% in 2017 and 2018 respectively. The construction sector, however, is set to buck this trend, with construction’s strong year on year growth. The most ambitious estimates have the 15% figure achieved in 2016, forecast to increase to as much as 20% growth in 2017.
The currently estimated EUR 14.6b of construction production in 2016 was largely fuelled by commercial building, especially in and around Dublin. This focus on the commercial sector, in the capital, is set to continue throughout 2017, although due to saturation in the market, alongside higher rents and housing needs, companies are beginning to look further afield. Whilst this is providing some much needed investment in the rest of the country, it is still sluggish compared to Dublin.
The residential sector is also seeing a boost, with investment from the government set to rise from EUR 473m in 2016 to EUR 702m in 2017. One key outlet for this spending is the EUR 3.8b Social Housing Strategy providing 35,000 social housing units to be delivered by 2020. This added investment is following the crisis in the market in the aftermath of following on from the 2008 recession that saw investment in the sector plummet. High end residential is also in demand in Dublin which supplements the large commercial developments being undertaken.
Although the levels of investment are clear, tender prices and construction costs are still to reach the pre-recession highs of 2006. This is however set to change. Due to the amount of work in the market, the availability of skilled workers is fast becoming an issue meaning that contractors are being far more selective with their tenders. The need to attract the right contractors is leading to increases in both tender price and construction costs.

40 |
One Queen Caroline Street, UK
Architect: dn-a and Penson

Location inteLLigenceEUROPE
Rider Levett Bucknall | International Report – Third Quarter 2017 | 41
ITALyA significant rebound continues to elude Italy’s stuttering economy. The forecast GDP growth for 2017 is just 0.7%, after 0.8% was achieved in 2016. This is set to be one of the major influences on any construction industry growth for the rest of this year. Indeed, after a weak 0.3% increase in 2016, construction investments are expected to decrease 1.2% in 2017, with new housing investments down 3% and public works investments decreasing 3.5%.
Next to low spending capacity, tight lending conditions set by banks are the main reason for the poor performance of the construction sector. Given the current problems in the Italian financial sector, it seems that there will be no improvement in the restrictive loan policy anytime soon. Many businesses in the construction sector remain highly geared. Bank loans for residential building decreased from EUR 30b in 2007 to less than EUR 8b in 2015, and for non-residential construction from EUR 20b to EUR 10b for the same period.
Late payments from public bodies have also contributed to market difficulties. Average payment terms are 5.5 months, compared to two months set by law. Average payment delays are still long, but have at least decreased since 2014 (from 146 days in H1 2014, 117 days in H1 2015 and 108 days in H1 2016). Non-payment notifications are expected to remain at a high level in 2017, but at least no major increase is expected.
Large construction companies have, however, proved to be resilient due to portfolio diversification and export orientation, which makes them less dependent on the domestic market. Large export oriented players (mainly active in African and Middle Eastern countries) are expected to achieve positive results.
In contrast, construction cooperatives and consortiums focused on the domestic residential construction market and dependent on public works have been severely hit by deteriorating demand, decreased bank loans and late payments. Finally, small and medium-sized businesses focused on residential construction are most severely affected, due to decreased investment in private housing (new buildings shrank by more than 60% between 2008 and 2015) and restricted bank loans. The only exceptions have been businesses active in renovation works supported by government incentives (up 19% between 2008 and 2015).
LONDON (uK)There is no doubt that the UK economy has suffered as a result of the political turmoil and uncertainty caused by Brexit in June 2016 and the result of a general election in May 2017, however, the actual effect has, initially, been less than first suggested.
London, particularly the City, has felt the effect more than the rest of the UK, primarily due to its reliance upon the financial services sector. Initial concerns about the rapid relocation of financial institutions from London to Western Europe has not occurred at the rate first suggested although Citigroup, Deutsche Bank and Bank of America have all confirmed that their main EU trading operations will take place from Frankfurt and Dublin respectively.
The timing of a next General Election, the outcome of the negotiation of a trade deal with Europe and the Bank of England’s response to inflation will remain significant factors in determining the stability of the UK economy.
The commercial office sector in Greater London has slowed in Mid-Town and the City Core, with the overall transaction market in the first quarter of 2017 down 4% on the same period in 2016. 75% of the spend in the London office class use has been from overseas investors taking advantage of a flattening market and advantageous exchange rates. There are a number of occupiers that are bucking the trend, namely TMT (up 11%) and serviced office / collaborative working (up 11%). As a result of their transactions the office leasing market remains busy but there is a reduction in the average size of deals being undertaken. Rental Levels are predicted to rise in the Docklands and the West End whilst shallow rental drops are expected in the City Core and Mid-Town areas.

Location inteLLigenceEUROPE
Rider Levett Bucknall | International Report – Third Quarter 201742 |
The UK has endured a prolonged period of low interest rates which has fuelled the London residential property market. London has seen rapid price growth between 2014 and 2016 which has resulted in an affordability crisis.
The effect of this arguably unsustainable price growth, plus the implementation of an additional 3% stamp duty surcharge (April 2016) on second homes, has had an effect with an overall decrease of 1.6% in private residential pricing. At odds with the sales price of private property has been the significant increase in rental costs in London.
Housing in London remains a key policy of Sadiq Khan, the London Mayor. At the end of 2016, the central government provided GBP 3.15b part funding for 90,000 new affordable homes. This monetary injection has increased the number of new starts from 15% in 2016 to 22% in 2017. Research by Savills suggests that 64,000 new homes are required in London, year on year, to meet the need for affordable housing.
The private rented sector is predicted to grow over the period as a reaction to private rental growth and the unaffordability of the private housing stock to many Londoners.
An advantageous exchange rate has meant that a large portion of the non-Prime London private residential market has been sustained by overseas investors.
The Prime West End residential market remains subdued because of the recent stamp duty change.
Reductions in construction costs that were predicted by some in the 2nd Quarter of 2016 have failed to occur in the last 12 months although most industry experts are now forecasting reductions in tender price inflation.
MANChEsTERManchester, famous for its industrial heritage, has become the UK's fastest growing “Powerhouse” city, with GBP 56b gross value added.
Manchester’s property market goes from strength to strength with ten City Centre apartment residential Schemes over 25 storeys being constructed in 2017. Due to the UK’s and regional housing shortages, investors are attracted to these residential developments and are keeping the residential property sector in the region very strong. Over 7,000 residential units will be constructed in 2017 with approximately 600,000 square feet of new commercial office space and over 4m square feet of logistic/industrial units in the region.
Manchester continues to attract substantial international investment on diverse schemes such as Airport City, Manchester Life, St. Johns, Media City, NOMA, Spinningfields, St.Peters Square, Mayfield (Piccadilly) and Manchester/Salford University expansion.
Manchester is at the centre of the ‘£50 Billion Northern Powerhouse’ which is a collection of Northern UK cities working together designed to encourage investment and rebalance the economy of the country to reduce its reliance on London.
NEThERLANDs Recovery in the Dutch construction sector largely continued throughout 2016 and into early 2017. In line with GDP performance, the rate of growth is set to decrease slightly moving into 2017, with GDP growth going from 2% to 1.7%, and sector value added growth reducing to 2.4% from 2.7%. The construction sector’s share of the national economy remains at approximately 4.9%.
In Q3 of 2016 construction was the fastest growing trade sector in the Netherlands, and turnover and gross added value have increased over the past eight quarters successively. Home prices have further increased, and the sentiment of many construction companies remains positive, with businesses expecting further revenue increases in 2017.
Residential remains a key sector, with demand and growth set to continue to increase into 2017 due to the low mortgage interest rates on offer. This, combined with the government’s focus on affordable housing, makes the residential market in the Netherlands very attractive. Non-residential construction in 2017 is also building upon the return to demand, evidenced throughout 2016. Civil and utility construction has shown robust growth in 2016, and production even increased 13.4% year-on-year in Q3 2016.
It is key to note, however, that commercial, hospitality and retail projects are generally centralised in the bigger cities, with Amsterdam close to saturation point. As a result of this overcapacity in the market, margins continue to be tight, forcing many companies into price wars. The infrastructure sector has also seen a slowdown, with order books shrinking as 2017 progresses.

Location inteLLigenceEUROPE
Rider Levett Bucknall | International Report – Third Quarter 2017 | 43
NORWAyThe Norwegian economy remains in the slow and stable growth phase that has been apparent since 2010. Reflecting this, the 0.8% of GDP growth achieved in 2016 is forecast to marginally increase in 2017 to 1.2%. The construction industry is slightly ahead of the economy on the whole, with GDP from construction for the first quarter of 2017 increasing by approximately 5.5% compared to the same period last year. GDP generated in the quarter was at an all-time high of EUR 4.85b.
This is largely due to improving investor and consumer confidence, driving investment in the residential, infrastructure and industrial sectors. In addition to this, the government’s efforts to balance demand and supply for housing and energy are expected to support construction industry growth until 2020.
However, there remains risks associated with the Norwegian construction industry outlook; most notably, low oil prices and its direct effect on the economy. Low oil prices are expected to affect government earnings from oil exports, as 25% of the country’s total economic output is dependent on the oil and gas sector. Any decline in oil revenues is therefore expected to negatively weigh on government funding of the construction industry.
Government efforts to develop the country’s transport infrastructure and to improve regional connectivity are expected to support the construction industry’s growth up until late 2020. As part of the move, the government is implementing the fourth edition of the National Transport Plan (NTP) up until 2023, with a total investment of NOK 508b (USD 86.5b).
RussIA Due to the current political turmoil surrounding Russia, with the ongoing situations surrounding Syria and Ukraine and consequent Western sanctions, the economy has largely been in decline. This decline has been arrested in 2017, with GDP forecast to grow by 1.4%, up from the retraction of approximately 0.4% seen in 2016.
This has been mirrored in the construction industry with the 2.1% decline in 2016 set to return to a slight increase for 2017. This is as a result of the government's focus on developing the country's manufacturing sector to diminish its reliance on oil exports.
Over 2017, the construction industry will also be supported by government plans to complete transport infrastructure, energy and utilities projects, and residential buildings in anticipation of the 2018 FIFA World Cup. In addition to this, the government is also set to focus on affordable housing for middle to low income groups, combining this with the lending interest rate to help boost the residential sector.
The construction industry's output value in real terms is expected to post a compound annual growth rate of 1.76% over the period from 2016 to 2021.
sPAINSpain’s economy is continuing its recovery with stable levels of growth for the first time since the recession. GDP grew by 3.2% in 2016, which is expected to be consolidated with a 2.7% growth in 2017. The Spanish construction sector continued to rebound in 2016, with a value added growth rate of 3%, mainly due to Spain´s economic recovery, increased foreign investments and a return of business confidence. Lower commodity prices also have had a positive impact. However, it must be said that the current construction recovery comes from a very low level following years of severe recession, as domestic production decreased by more than 50% in the period 2007-2014.
In 2017 value added construction growth is expected to increase again by about 3%, mainly driven by residential and commercial construction, while growth in the public construction/civil engineering segment is expected to be subdued. Competition in the industry has all but ceased, as a large number of players have left the market since 2008. Profit margins were stable in 2016, and are expected to remain so in 2017.
Spanish construction businesses are highly dependent on bank funding. Conditions for external financing have improved since 2015 due to lower interest rates and better growth prospects for the Spanish economy. It must be noted, however, that growth is largely focused around the big cities such as Madrid and Barcelona, where the economic recovery is well ahead of the rest of the country.

44 |
Boulevard Point, Dubai
Architect: Dewan Architects & Engineers

REGIONAL INtELLIGENcE
MIDDLE EAST
Rider Levett Bucknall | International Report – Third Quarter 2017 | 45
According to the IMF, GDP growth across the Middle East and North Africa (MENA) was expected to reach 3.2% by the end of 2016 and forecasted in 2017 at 3.2%. This is a reflection of a stable oil price and increased market confidence, underpinned by strategic initiatives aimed at reducing oil dependency, such as vision 2030 in Saudi Arabia.
The Construction industry is slowly maintaining a positive sentiment across the region which has been significantly impacted by political events over the past five years. Within the RLB Market Activity Cycle, the majority of sectors within the Gulf States are within the peak and mid zones. Movement since our last report sees that both the apartment and the civil sectors have strengthened but the house, offices and retail sectors have weakened.
On 25 May, the Organisation of the Petroleum Exporting Countries (OPEC) and other oil producers such as Russia agreed to prolong the duration of the oil cuts to Q1 2018 in order to continue reducing the massive oil glut and supporting prices.
The oil generating economies are being very cautious in future spending decisions. Oil prices have bounced from USD 100 in 2015 to a low of USD 30 in January 2016, the current oil price is around USD 50. This has caused governments prioritising expenditure on strategically important projects, rather than speculative or vanity projects. A decline in project awards has impacted the construction industry first and most profoundly. The markets most affected are Saudi Arabia, Qatar and Abu Dhabi, while Dubai, Oman and Bahrain have been less affected due to a greater level of economic diversification.
In the political arena, political unrest has erupted in the region after Bahrain, Saudi Arabia and the United Arab Emirates decided to sever diplomatic ties with Qatar. Egypt, Libya, the Maldives and Yemen also cut off relations with the country. These countries also ended all land, sea and air contacts with Qatar.
Inflation within the region was forecasted to be 5.4% rising to 6.1% for 2018. RLB’s TPI for the region is forecasting a net fall in pricing within Abu Dhabi of negative 3% for 2017 against positive rises across the other Gulf States of between 5% and 6% for 2017.
reGional relaTiViTies
CITIEs Q3–2017DOhA 125RIyADh 115DuBAI 113ABu DhABI 103
2017 foreCasTed esCalaTion
NET ZONE MOVEMENT BY SECTOR Q4 2016 TO Q3 2017
2
1
-1
-2
0
HOUSES APARTMENTS OFFICES INDUSTRIAL RETAIL HOTEL CIVIL
PEAK ZONE
MID ZONE
TROuGh ZONE
reGional MarKeT aCTiViTYSECTORS PER ZONE
4
8
16

46 |
Jeddah Tower, Jeddah - KSA
Architect: Adrian Smith of Adrian Smith + Gordon Gill Architecture (AS + GG)

Location inteLLigenceMIDDLE EAST
Rider Levett Bucknall | International Report – Third Quarter 2017 | 47
ABu DhABIIn Abu Dhabi fiscal consolidation has slowed down GDP growth. It is down to 1.3% from 8.6% in 2014. With oil prices around USD 50 per barrel this trend is likely to continue into 2018.This has led to the Abu Dhabi Government reviewing their budgets on construction projects more closely and prioritising expenditure on strategically important projects. A decline in project awards which has been a major issue for the construction industry. This has brought about greater competition and reduced margins for both Contractors and Consultants as they chase a smaller pool of potential projects. Over the next five years to 2022, the Abu Dhabi Government is planning to anchor spending at a flat level of USD 70b per year and looking to increase revenues with the introduction of a value added tax in 2018 and increasing crude oil production.
The lower volume of project awards has not translated into quicker decision making as more scrutiny is being placed on award decisions which in time slows down the project pipeline. Most analysts agree that spending on construction projects, particularly in infrastructure, low rise residential and education will increase into 2018.
Prices in the construction market will remain very competitive for the foreseeable future. This could result in some major International Contractors and Consultants withdrawing from the Abu Dhabi market as risk profiles increase and margins reduce.

48 |
1 William Street, Brisbane, Australia
Architect: Woods Bagot
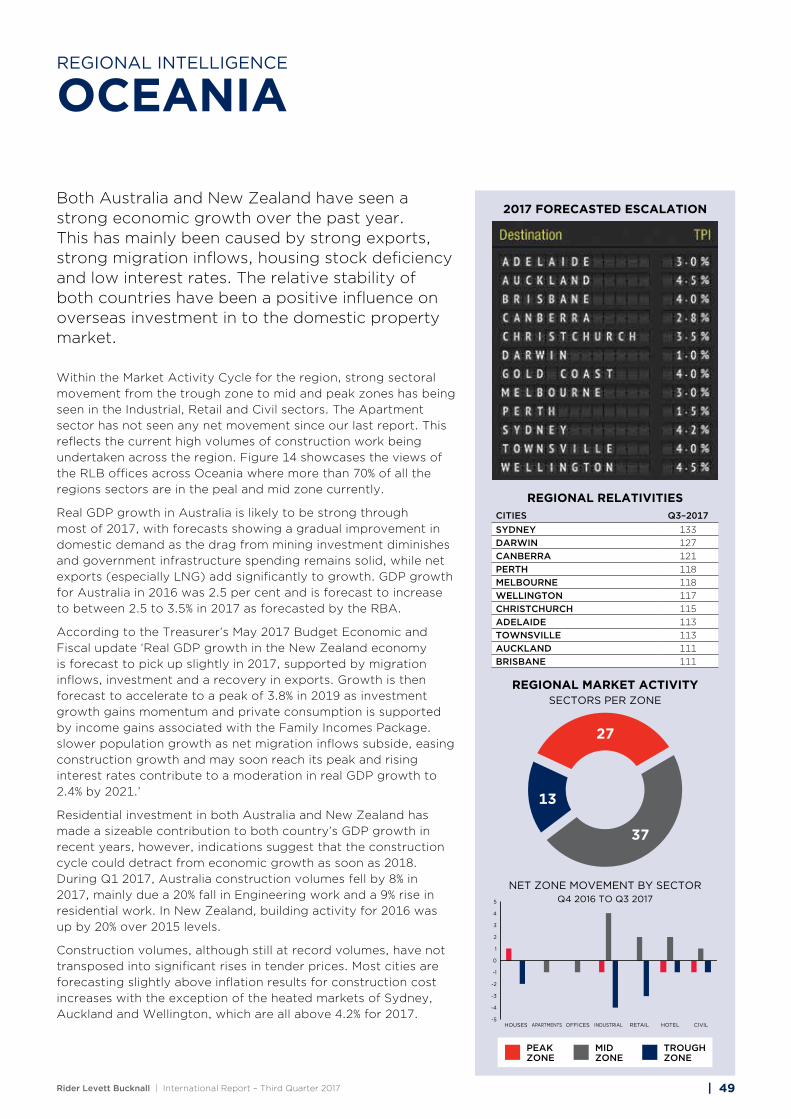
REGIONAL INtELLIGENcE
OCEANIA
Rider Levett Bucknall | International Report – Third Quarter 2017 | 49
Both Australia and New Zealand have seen a strong economic growth over the past year. This has mainly been caused by strong exports, strong migration inflows, housing stock deficiency and low interest rates. The relative stability of both countries have been a positive influence on overseas investment in to the domestic property market.
Within the Market Activity Cycle for the region, strong sectoral movement from the trough zone to mid and peak zones has being seen in the Industrial, Retail and Civil sectors. The Apartment sector has not seen any net movement since our last report. This reflects the current high volumes of construction work being undertaken across the region. Figure 14 showcases the views of the RLB offices across Oceania where more than 70% of all the regions sectors are in the peal and mid zone currently.
Real GDP growth in Australia is likely to be strong through most of 2017, with forecasts showing a gradual improvement in domestic demand as the drag from mining investment diminishes and government infrastructure spending remains solid, while net exports (especially LNG) add significantly to growth. GDP growth for Australia in 2016 was 2.5 per cent and is forecast to increase to between 2.5 to 3.5% in 2017 as forecasted by the RBA.
According to the Treasurer’s May 2017 Budget Economic and Fiscal update ‘Real GDP growth in the New Zealand economy is forecast to pick up slightly in 2017, supported by migration inflows, investment and a recovery in exports. Growth is then forecast to accelerate to a peak of 3.8% in 2019 as investment growth gains momentum and private consumption is supported by income gains associated with the Family Incomes Package. slower population growth as net migration inflows subside, easing construction growth and may soon reach its peak and rising interest rates contribute to a moderation in real GDP growth to 2.4% by 2021.’
Residential investment in both Australia and New Zealand has made a sizeable contribution to both country’s GDP growth in recent years, however, indications suggest that the construction cycle could detract from economic growth as soon as 2018. During Q1 2017, Australia construction volumes fell by 8% in 2017, mainly due a 20% fall in Engineering work and a 9% rise in residential work. In New Zealand, building activity for 2016 was up by 20% over 2015 levels.
Construction volumes, although still at record volumes, have not transposed into significant rises in tender prices. Most cities are forecasting slightly above inflation results for construction cost increases with the exception of the heated markets of Sydney, Auckland and Wellington, which are all above 4.2% for 2017.
reGional relaTiViTiesCITIEs Q3–2017syDNEy 133DARWIN 127CANBERRA 121PERTh 118MELBOuRNE 118WELLINGTON 117ChRIsTChuRCh 115ADELAIDE 113TOWNsvILLE 113AuCKLAND 111BRIsBANE 111
2017 foreCasTed esCalaTion
NET ZONE MOVEMENT BY SECTOR Q4 2016 TO Q3 20175
3
4
2
1
-1
-2
-3
-4
-5
0
HOUSES APARTMENTS OFFICES INDUSTRIAL RETAIL HOTEL CIVIL
PEAK ZONE
MID ZONE
TROuGh ZONE
reGional MarKeT aCTiViTYSECTORS PER ZONE
27
13
37

Location inteLLigenceOCEANIA
Rider Levett Bucknall | International Report – Third Quarter 201750 |
ADELAIDEThe South Australian economy is expected to grow 2.3% in FY 2017 and 2.3% in FY 2018 according to the State’s 2017/18 budget papers. The imminent closure of South Australia’s car industry in late 2017 will represent a significant negative for South Australian manufacturing. The recent announcements for the increase defence manufacturing sector and commitment to funds for energy security will offset this to some extent.
The South Australian housing market continues to lift as investors and owner-occupiers broaden their view. Annual growth of home starts and home loans are solid. House prices in Adelaide have grown only modestly through the year to March. House prices are up 3.7% for the twelve months to March 2017 according to the government.
Positive signs were seen in building approvals during 2016, where there was an increase of 9% in residential approvals over 2015 results. Overall building approvals rose 16% in 2016. Total approvals of AUD 5.1b was the highest value since 2012.
The tender market continues to be keen but there are clear signs with more work coming into the pipeline the cost of construction is increasing. RLB continues to see signs of larger contractors pricing smaller projects to ensure they maintain work into 2017.
The expansion of education projects is seeing tertiary institutions continue their activity with large projects being tendered to Tier 1 contractors. The retail sector continues to provide new project work into the next year, this has kept many of the Tier 2 contractors busy tendering in this sector. There are some major projects in early stages that are expected to help lift the market including new work in the defence sector. While aged care continues to provide many opportunities to the mid-sized builders, the public sector still remains relatively quiet however with the release of the National STEM (Science, Technology, Engineering and Mathematics) School Education Strategy Program should also provide some more opportunity for trade and head contractors alike.
Major projects within Adelaide include: Adelaide University Clinical School (AUD 230m); University of South Australia Health Innovation Building (AUD200m); Skycity Casino (AUD 300m), University of South Australia Great Hall (AUD 50m); New CBD High School Adelaide (AUD 80m).
All trade contractors continue to remain competitive and are actively seeking new work as the year comes to an end. With the prospect of more work becoming available in the new year there is an expectation that costs will rise more than what has been seen in recent years.

Location inteLLigenceOCEANIA
Rider Levett Bucknall | International Report – Third Quarter 2017 | 51
AuCKLANDAuckland construction has experienced sustained growth since 2011.Net migration into Auckland remains exceptionally strong with net inflows totaling over 33,000 in the last year. The residential construction sector is not currently able to keep up with the amount of new dwellings required to match demand. The regional centres of the Waikato and Bay of Plenty are piggy backing off Auckland with strong residential demand and new commercial development. With strong population growth there are significant non-residential construction projects in the delivery phase with many more planned to start construction in the short term. All sectors are experiencing strong demand including the education and health sectors. In this heated market resource issues are evident, particularly on the larger projects. Tier 1 and 2 contractors and larger subcontractors are generally fully booked. This lack of resource is increasing prices and affecting delivery programs. Banks have also started to tighten up on lending and requirements for pre-sales. This combination of tighter lending and increasing construction costs are likely to see a number of planned projects deferred.
There is a significant volume of work underway within the CBD. The three largest projects being the City Rail Loop, Commercial Bay and the Skycity Convention Centre and Hotel. Additionally, there are a number of commercial and residential projects within the Wynyard Quarter area and city fringe. There are some 60 plus cranes currently operating in the
Auckland region. The University of Auckland has large projects in planning and population growth is requiring significant investment in public infrastructure such as prisons, hospitals, schools and the like.
The market, particularly with respect to the NZD 50m plus projects requiring Tier 1 or 2 contractors is heated. There are a lack of contractors with the resources and skill base to deliver the number of large projects in the Auckland region. Some out of town contractors have established in Auckland to fill some of this void, namely Leighs Construction from Christchurch and LT McGuiness from Wellington. The subcontractor market across the board is also under resource pressure and this is seen in generally poor tender responses and volatile tender prices. To mitigate tendering risk, it is important more than ever to provide good quality tender documentation with realistic timeframes. A well set-up project can achieve competitive pricing in the current market if it is made as attractive as possible. Despite CPI inflation below 1%pa, within the construction sector wage growth and market forces has seen tender prices increase in the order of 6% for the 2016 year with a forecast of 5% for 2017.

Location inteLLigenceOCEANIA
Rider Levett Bucknall | International Report – Third Quarter 201752 |
BRIsBANEQueensland will rely on exports to deliver growth with business investment, housing and household spending in a slump according to government’s 2017 budget. The state’s economy will remain flat throughout 2017 before returning to moderate growth in 2018 and 2019. The bright spots in the economy will come from tourism, education and the coal seam gas sector which has been spurred into increased activity by the expectation of an east coast gas crisis emerging later this year.
Queensland is adjusting from the slowing down of the mining sector which has seen more than AUD 60b spent. Engineering work done (mining engineering, road and train infrastructure) for the twelve months to 31 December 2016 was down 21% from 2015 levels. This fall represented almost AUD 5b.
In comparison the building work done for 2016 was AUD 20.7b, an increase of AUD 1.6b over 2015. This has been driven by the boom in residential construction which accounted for AUD $14b of the total work done. Building approvals for 2016 were down 0.7% from 2015 numbers. Strong commercial and industrial approvals were offset by a fall of 23.5% in the value of apartment approvals. Apartment approvals for 2016 at AUD 4b was still more than the combined value of all apartment approvals for 2010,2011 and 2012 years.
There is currently a large differential between house prices in Brisbane and those in Melbourne and Particularly Sydney. In the past when this has occurred there has been significant inter-state migration to Queensland. In the current market this has not occurred. The lack of job opportunities in Queensland following the resource sector downturn has resulted in Queensland’s population remaining static over the period.
The long-awaited commencement of the Queens Wharf project will occur in early 2017 when the demolition of the government buildings will start the construction process. The state government also announced Australian Unity as the preferred proponent for the redevelopment of the Herston Quarter. This will see a major health, research and aged care precinct developed on the site of the old Children’s Hospital site.
A number of major commercial projects were completed in 2016 including 1 William Street, 480 Queen Street and 160 Ann Street that have resulted in the historically high commercial vacancy rates in both Brisbane CBD and Fringe markets. With commercial buildings at Southpoint and 900 Ann Street yet to come online this situation is likely to get worse before it improves.
Construction cost increases appear to have peaked and we expect some softening of construction costs during 2017. However there is still a large pipeline of work under construction and we expect the softening to be a gradual process with structural trades affected first.
CANBERRAThe current economic outlook for Canberra is now looking positive after some recent uncertainty due to Commonwealth Government job cuts. The ACT Government election result secured the future of the first stage of the Light Rail project and there is a strong pipeline of work in the Universities sector. Whilst there is still a risk to the economy around the Commonwealth Governments efficiency dividend; there is also potential opportunity in the recent establishment of Canberra’s first international flights between Singapore and Wellington, NZ and the recent announcement of the Qatar Airways route.
Capital Metro Light Rail has commenced initial works on Northbourne Ave and the Stage 2 Feasibility is underway. The Australian National University (ANU) has recently awarded the circa AUD 160m Union Court project to Lend Lease. This will revitalise the heart of the university campus while providing new learning, teaching, social and community facilities. The new ANU 800 bed student accommodation project has also commenced and other key education projects are also underway. There is strong sentiment in the residential market with the proposed AUD 500m ‘Section 200’ mixed use development in Belconnen, a development to be staged over the next 10 years. There has been an increase in dwelling unit approvals of approximately 14% from the previous year overall.
With confidence returning and more projects currently in and planned for the market our forecast is a rise in the tender price index ahead of inflation for 2017 of between 2.8 to 3%.

Location inteLLigenceOCEANIA
Rider Levett Bucknall | International Report – Third Quarter 2017 | 53
ChRIsTChuRChLate 2016 and early 2017 has seen the completion and occupation of a number of office developments in Christchurch CBD, continuing the reoccupation of the city following the major earthquakes of 2010 and 2011. The recent completion of the Canterbury Earthquake National Memorial on the banks of the River Avon has coincided with the relocation to the CBD of a number of major firms including accountancy and legal firms and banks. In addition several Government departments have now occupied their newly completed buildings. In recent weeks, Spark Telecommunications have confirmed plans to relocate to the CBD, selecting a site in Cathedral Square. Several long- awaited car parking buildings are either operational or nearing completion. Combined, this reoccupation of the CBD is anticipated to give greater confidence to land owners and developers to continue to look for opportunities for further projects.
Recent major projects that have commenced in Christchurch CBD include the long-awaited NZD 300m Metro Sports facility which has initiated enabling and ground works. The NZD 85m Christchurch Central Library project is rising near Cathedral Square. Major projects continuing in the CBD include the 60,000m2 Christchurch Hospital Acute Services Building (due for completion in 2018), the Justice Precinct, the Ngai Tahu led King Edward Barracks office precinct, the Terraces hospitality and retail complex, the Crossing retail development and a number of smaller commercial projects.
In the suburbs, major construction projects at the University of Canterbury continue while Lincoln University has selected a preferred contractor for the ECI stage of the major Lincoln Hub development.
Christchurch and the wider Canterbury area continues on the rebuild path that has led to rapid escalation in construction costs over recent years. While it is generally agreed that the rebuild peak has been reached, there remains a large amount of work in the pipeline and at various stages of design and construction. TPI increases are expected to be at a slightly lower level than previously envisaged as the workload no longer increases at the pace seen in recent years. The residential rebuild program is near completion although certain developments such as the long- term Fletcher Living project in the East Frame has a long rollout period. Decisions remain to be made with regard to several other expected major projects such as the Christchurch Cathedral reinstatement, commencement of the Convention Centre project and any movement on the stadium rebuild. Demand in other centres of New Zealand has seen Canterbury firms looking at opportunities across the country as well as locally.
DARWINThe NT is experiencing a prolonged period of low activity in the construction sector with the NT Government now trying to stimulate the market with a number of new projects though our fiscal position remains very tight. A number of infrastructure projects are being promoted though we are yet to see any funds being allocated for projects from the North Australian Infrastructure Fund.
As existing projects are coming to an end there are fewer replacement projects coming on board. Defence is becoming active with a number of projects in planning or delivery phase with more to come and with the potential to inject major funds and activity in the market. The private sector is very sluggish taking its cue from Government projects that are yet to provide the necessary stimulus to cause the private sector to invest in capital projects.
Current large projects such as the ICHTHYS Gas project, Gateway Shopping Centre and Palmerston Hospital are still in construction along with Defence projects in Darwin and Tindal. We expect stable construction conditions to continue to prevail in the short to medium term with capacity in the industry to absorb new projects as they come on line. In the long term we see the market improving as new investment projects come on line.
54 |
Collins Arch, Melbourne, Australia
Architect: Woods Bagot / Shop Architects

Location inteLLigenceOCEANIA
Rider Levett Bucknall | International Report – Third Quarter 2017 | 55
GOLD COAsTGold Coast international visitor numbers increased by 14% in 2017 over 2016 and domestic numbers up by 2% according to Tourism Research Australia. Increased visitors, strengthen the Gold Coast economy which is reflected in building activity. Tourism, Education and Infrastructure sectors are performing strongly. With the Commonwealth Games being hosted on the Gold Coast in April 2018, the outlook is positive.
The AUD 0.5b Games Village will be completed in September2017. Significant committed developments include the Jewell (AUD 1.0b), Spirit (AUD 1.2b), Ruby (AUD 1.01b), Coomera Town Centre, Star Casino expansion, M1 upgrade, Empire Industrial Estate in Yatala. Projects under consideration for planning approval include Stage 3 of Light rail project, Cruise Ship Terminal, ASF Integrated Resort and Orion Towers.
The increase in construction activity has led to an increase in the costs of a number of trades including formwork, tiling and plasterboard partitions and ceilings with other trades experiencing periodic shortages and price spikes. Overall pricing is being held back somewhat by the recent decline in optimism of the main sub-contractors and contractors as projects have stalled and not commenced within the original planned timeframes. Forecasted TPI for 2017 is 4%.
MELBOuRNEConstruction activity is still strong in Melbourne with constant new work coming onto the market. Disruption will be the buzzword for Melbourne during 2017, as infrastructure works planned for the city make their presence felt with major closures and delays. The Melbourne Metro Rail Tunnel is the biggest public transport project the city has seen in 35 years and the impact of construction will be just as significant. Construction impacts will be felt within the CBD along Swanston St and areas to the north and south of the CBD. Adding to the upheaval, the project coincides with road widening works on all freeways, level crossing removals and a general strong building construction sector across Melbourne.
Both large scale projects and suburban residential work is still strong. Significant projects confirmed and commencing construction over the next three months include 80 Collins St, Vic Police stage 2, the Foundry in Bourke St, Westside Place and the Glen Shopping Centre. These major projects will continue to add competitive pressure on stable pricing in the medium term.
Even with negative pressure that the ‘boom’ is over within Victoria, work done for the March quarter was up 7.2% in residential work and up 28.5% in non- residential work over the same period in 2016. The sentiments within the market are still positive with a strong workload for the next 18 months to two years.
The continued growth in residential apartments is putting pressure on general pricing with large spreads being seen in tender pricing.
Market talk is focused on future pressure in the steel and concrete trades due to the commencement of the metro tunnel project and other infrastructure projects.
Forecasted tender prices are expected to increase in 2017 at higher levels than 2016 in the order of 3%.
Location inteLLigenceOCEANIA
Rider Levett Bucknall | International Report – Third Quarter 201756 |
syDNEyRecent economic data continues to report a strong NSW economy together with a significant contribution from the NSW Construction Industry. Recent data from the Australian Bureau of Statistics for the National Accounts reports the NSW yearly GDP was at an annual growth rate of 4.1% in December 2016. The value of construction works completed for the last two quarters of 2016 being 2% greater than the first half of the year.
Indications to date is that this level of activity is unlikely to reduce in the near future. Bureau of Statistics Value of Building Approvals for the last two quarters of 2016 was 16% higher than the previous six months. In addition, approvals for January 2017 are at similar levels for the last quarter of 2016. A further detailed examination of the approvals data indicates that whilst the residential sector has declined there has been strong growth in the non-residential sector to partly offset approval falls in the residential sector.
Whilst recent months have seen reduced numbers of Development Application approvals, the volume of approvals for the dwellings earlier in the year will have an impact upon future activity. It is expected that construction activity will be at either record or near record levels.
The strong levels of Building Approvals and Building Activity are providing a buoyant market place for all types of contractors. At the present time contractors are confident that there is sufficient work available for the short to medium term and there is understanding or expectation that price movements for material and labour are predictable and a known factor.
The tender market is currently remaining competitive to the surprise of contractors, prices are within expectation however the range of prices continues to be a significant difference between lowest and highest prices. Price variation is subject to risk, for projects where the contractor is to accept a higher risk profile premium will be added, the size of the premium will vary according to the contractor’s perception of risk.
Contractors are now reporting that the capacity order books are becoming limited due to the availability of staffing resources. Contractors are now being selective as to the type, size and clients of projects, so that the projects being undertaken will align with the expertise and availability of staff.
Concerns have been raised that the oversupply of residential multi dwelling units may occur. However, developer/builders report the financial requirements for such developments have tightened in recent months. Such restrictions may impact activity to suburban locations as opportunities become limited due to funding or finance requirements.
Due to Sydney’s strong population growth and infrastructure expenditure it is likely construction activity throughout 2017 and into 2018 will continue to experience record or near record levels of activity. Such levels of activity will impact upon costs in the range of 4% to 4.5% in 2017. However, the pressure on labour resources may impact prices as competition for labour resources intensifies.

Location inteLLigenceOCEANIA
Rider Levett Bucknall | International Report – Third Quarter 2017 | 57
WELLINGTONConstruction in the Wellington region continues to improve with a number of good size projects currently underway. Three additional tower cranes have been erected over the past couple of months and further large projects remain in design stage. Activity across all sectors remains strong and very positive for the next few years. The 7.8 magnitude earthquake in the South Island on November 14 last year has had a very real effect on the Wellington CBD with a few buildings already demolished, some confirmed for demolition and a small number of others which are being considered further. A large number of buildings were evacuated due to safety concerns and the majority of previously vacant office space has now been filled temporarily with displaced tenants. The overall cost of the earthquake is still being tallied, with major costs being incurred in clearing the main rail and road routes in the South Island, and insurance assessments still being carried out on the building stock in the Wellington region as well as those in the upper South Island towns. The Lower North Island regional centres are showing signs of increased construction activity with the positive economic signals in the main centres filtering through. We expect this to continue for some time.
Wellington, even without the workload stemming from the major earthquake, has a good variety of current projects now under construction, including some major office buildings, school refurbishments and multi-unit housing for private and public clients. These developments have only just started in the last six months and a wide variety of other large projects remain in the design stage with a few likely to start later this year.
The City Council precinct buildings are all due for refurbishment and a new Museum/Convention Centre still in the early planning stages. The tertiary institutions are also continuing with their work programs with projects of varying values and timeframes. A large number of smaller projects, across a number of industry sectors, are also currently underway or nearing tender stage.
Regional infrastructure works are continuing with the recent completion of the Kapiti Expressway and the Transmission Gully road now well underway and not due for completion until 2020.
Cost escalation in the region has now really taken hold with major cost uplifts for materials and labour, not seen since 2008. The large increase in workload is also having drastic effects on market competitiveness and the securing of sub trades on various projects. Cost movement in some trades has gone beyond normal escalation parametres due to the lack of subcontract resource, and this is causing major issues with project budgets set during a much quieter market period. This situation is likely to remain for some time given the number of projects still in design phases and the scale of projects yet to come to market.
Low interest rates are one factor still fuelling construction demand, and given the same heated environments in our other major cities, we are unlikely to see any price relief in the next few years. It will be interesting to see how this situation develops over the next few months and what constraints will develop, if any, to ease the current pressure on the building industry. The NZ General Election in 2017 Q4 may also add an additional level of uncertainty to the local market.

Rider Levett Bucknall | International Report – Third Quarter 201758 |
independenT ConsulTanTs, loCal KnoWledGeAND ExPERTISE, GLOBAL NETWORK
The strength of Rider Levett Bucknall (RLB), the largest independent and most geographically prevalent construction cost consultancy of its kind in the world, is that it has the foremost construction intelligence available to it. We collect and collate current construction data and forecast trends on a global, regional, country, city and sector basis. RLB publishes key industry intelligence publications throughout each year. For more detailed sector and city/country information than is published within the International Report please review our regional or country specific publications.
A listing of our publications and proposed publishing date are:
Disclaimer: While the information in this publication is believed to be correct at the time of publishing, no responsibility is accepted for its accuracy. Persons desiring to utilise any information appearing in the publication should verify its applicability to their specific circumstances. Cost information in this publication is indicative and for general guidance only and is based on rates as at July 2017.
REGIONALAmericas –Caribbean
Gulf States
Hong Kong & China Report
Oceania Report
COuNTRy sPECIFIC
China
New Zealand
Singapore
UK Index
USA
sECTOR sPECIFICEMEA Hotels Monitor
Latin America & Caribbean Hotels Monitor
RIDERs DIGEsTs
Riders Digest – Australian States (6 of)
Riders Digest – New Zealand
Riders Digests – Philippines
Riders Digest – Singapore
Riders Digest – UK
Riders Digest – USA
sOuRCEs OF INFORMATION – INTERNATIONAL REPORTInformation contained within this report has been compiled from numerous global sources and RLB offices. Certain text and data contained within the report has been compiled from information published by the following organisations.
International Monetary Fund – Regional Economic Outlooks imf.org
World Bank worldbank.org
Asian Development Bank adb.org
ANZ Bank research anz.com
Global Construction Perspectives and Oxford Economics globalconstruction2025.com
The Economist economist.com
LAEDC, Institute of Applied Economics laedc.org
Reserve Bank of Australia rba.gov.au
Royal Institution of Chartered Surveyors rics.org
Colliers International colliers.com
Further information can be found on their websites.
All publications are available from rlb.com or for a hard copy please contact your local office.
| 59
offiCes around The World
AFRICABotswanaGaborone
MauritiusSaint Pierre
MozambiqueMaputo
south AfricaCape TownJohannesburgPretoria
AsIANorth AsiaBeijingChengduChongqingDalianGuangzhouGuiyangHaikouHangzhouHong KongJejuMacauNanjingNanningQingdaoSeoulShanghaiShenyangShenzhenTianjinWuhanWuxiXiamenXianZhuhai
south AsiaBacolodBoholCagayan de OroCebuDavaoHo Chi Minh CityIloiloJakartaKuala LumpurLagunaMetro ManilaSingaporeYangon
AMERICAsCaribbeanBarbadosCayman IslandsSt. Lucia
North AmericaAustinBostonCalgaryChicagoDenverGuamHiloHonoluluLas VegasLos AngelesMauiNew YorkOrlandoPhoenixPortlandSan FranciscoSeattleTorontoTucsonWaikoloaWashington DC
EuROPEunited KingdomBirminghamBristolCumbriaLeedsLondonManchesterSheffieldThames ValleyWarrington/BirchwoodWelwyn Garden City
RLB | Euro AllianceAustriaBelgiumCzech RepublicFinlandGermanyHungaryIrelandItalyLuxemburgNetherlandsNorwayPolandPortugalRussiaSpainSwedenTurkey
MIDDLE EAsTOmanMuscat
QatarDoha
saudi ArabiaRiyadh
united Arab EmiratesAbu DhabiDubai
OCEANIAAustraliaAdelaideBrisbaneCairnsCanberraCoffs HarbourDarwinGold CoastMelbourneNewcastlePerthSunshine CoastSydneyTownsville
New ZealandAucklandChristchurchHamiltonPalmerston NorthQueenstownTaurangaWellington

RLB.com


![NHA RLB PRESENTATION3[1]](https://img.dokumen.tips/doc/110x75/577d2c471a28ab4e1eabcb75/nha-rlb-presentation31.jpg)