Embed Size (px)
Citation preview

ORIGINAL ARTICLE
ISSN No : 2230-7850
International MultidisciplinaryResearch Journal
Indian Streams
Research Journal
Executive EditorAshok Yakkaldevi
Editor-in-ChiefH.N.Jagtap
Vol 5 Issue 8 Sept 2015

Mohammad HailatDept. of Mathematical Sciences, University of South Carolina Aiken
Abdullah SabbaghEngineering Studies, Sydney
Ecaterina PatrascuSpiru Haret University, Bucharest
Loredana BoscaSpiru Haret University, Romania
Fabricio Moraes de AlmeidaFederal University of Rondonia, Brazil
George - Calin SERITANFaculty of Philosophy and Socio-Political Sciences Al. I. Cuza University, Iasi
Hasan BaktirEnglish Language and Literature Department, Kayseri
Ghayoor Abbas ChotanaDept of Chemistry, Lahore University of Management Sciences[PK]
Anna Maria ConstantinoviciAL. I. Cuza University, Romania
Ilie Pintea,Spiru Haret University, Romania
Xiaohua YangPhD, USA
......More
Flávio de São Pedro FilhoFederal University of Rondonia, Brazil
Kamani PereraRegional Center For Strategic Studies, Sri Lanka
Janaki SinnasamyLibrarian, University of Malaya
Romona MihailaSpiru Haret University, Romania
Delia SerbescuSpiru Haret University, Bucharest, Romania
Anurag MisraDBS College, Kanpur
Titus PopPhD, Partium Christian University, Oradea,Romania
Pratap Vyamktrao NaikwadeASP College Devrukh,Ratnagiri,MS India
R. R. PatilHead Geology Department Solapur University,Solapur
Rama BhosalePrin. and Jt. Director Higher Education, Panvel
Salve R. N.Department of Sociology, Shivaji University,Kolhapur
Govind P. ShindeBharati Vidyapeeth School of Distance Education Center, Navi Mumbai
Chakane Sanjay DnyaneshwarArts, Science & Commerce College, Indapur, Pune
Awadhesh Kumar ShirotriyaSecretary,Play India Play,Meerut(U.P.)
Iresh SwamiEx - VC. Solapur University, Solapur
N.S. DhaygudeEx. Prin. Dayanand College, Solapur
Narendra KaduJt. Director Higher Education, Pune
K. M. BhandarkarPraful Patel College of Education, Gondia
Sonal SinghVikram University, Ujjain
G. P. PatankarS. D. M. Degree College, Honavar, Karnataka
Maj. S. Bakhtiar ChoudharyDirector,Hyderabad AP India.
S.Parvathi DeviPh.D.-University of Allahabad
Sonal Singh,Vikram University, Ujjain
Rajendra ShendgeDirector, B.C.U.D. Solapur University, Solapur
R. R. YalikarDirector Managment Institute, Solapur
Umesh RajderkarHead Humanities & Social Science YCMOU,Nashik
S. R. PandyaHead Education Dept. Mumbai University, Mumbai
Alka Darshan ShrivastavaShaskiya Snatkottar Mahavidyalaya, Dhar
Rahul Shriram SudkeDevi Ahilya Vishwavidyalaya, Indore
S.KANNANAnnamalai University,TN
Satish Kumar KalhotraMaulana Azad National Urdu University
Editorial Board
International Advisory Board
Welcome to ISRJISSN No.2230-7850
Indian Streams Research Journal is a multidisciplinary research journal, published monthly in English, Hindi & Marathi Language. All research papers submitted to the journal will be double - blind peer reviewed referred by members of the editorial board.Readers will include investigator in universities, research institutes government and industry with research interest in the general subjects.
RNI MAHMUL/2011/38595
Address:-Ashok Yakkaldevi 258/34, Raviwar Peth, Solapur - 413 005 Maharashtra, IndiaCell : 9595 359 435, Ph No: 02172372010 Email: [email protected] Website: www.isrj.org

Indian Streams Research Journal Impact Factor : 3.1560(UIF) ISSN 2230-7850 Volume - 5 | Issue - 8 | Sept - 2015
A PICTURE OF TRADE UNIONS IN INDIA
1 2Surendra Pratap and Annavajhula J.C. Bose1Center for Workers Education, New Delhi. 2Department of Economics, Shri Ram College of Commerce, Delhi .
ABSTRACT
KEYWORDS :
INTRODUCTION:-DATA
This paper is an attempt at giving a picture of trade unions in India by taking stock of the available data on unions and their membership and density; their sectoral and sub-sectoral presence; and their presence in various states of India. In the process, the paper also identifies the factors governing organization dynamics. There are many trade-union-like mass organizations about which we are in the dark, though, in the absence of ethnographic research about them.
Trade Unions, Membership, Density, Sector, Sub-sector, State, Unionisation Dynamics.
There is data on the number of trade unions that are registered under the Trade Union Act, and on membership of trade unions that submit returns. There are s ign i f icant numbers of organizations of workers in various states of India that are working as mass organizations of various sections of unorganized workers and are neither registered under the Trade Union Act, nor functioning as typical trade unions. There are also large numbers of trade unions
that do not submit annual returns and therefore their membership is not verified and not available. Moreover, considering the hugeness of the geographical area, diverse nature of economies in various regions and diverse nature of the labour force in various subsectors in the Indian economy, it is also not easy to capture an overall picture of organizing dynamics based on a limited field work and interviews with a few activists working in a few sub sectors.
However, the available data on trade unions and trade union density do clearly reflect the trends in various sectors and the interviews with activists working in some major sectors do enable us to capture the trends of organizing dynamics and the challenges that the workers and their movements are facing in various sectors.
It is also to be kept in mind that the available data on union membership is generally inflated. In India there is a provision for selecting the central trade unions for representing labour in various national and international committees, councils and conferences on the basis of their membership. After the
Available online at www.lsrj.in 1

A PICTURE OF TRADE UNIONS IN INDIA
verification of their membership the central ministry of labour allots the status of Central Trade Union Organization (CTUO) to those unions having required verified membership and geographical as well as sectoral spread up to the mark. The last verification was done for membership as existed in 2002 and results were published in 2008. The verification criteria for identifying the CTUOs was based on verified membership of 0.5 million spread over in at least 4 states and in 4 industries (which may include agriculture and other rural sectors) (GoI, 2008b). Recently the next verification process for membership as in 2011 was started and this time the revised criteria requires a verified membership of 0.8 million spread over in at least 8 industries and 8 sectors (GoI, 2013).
There is an intense competition among trade unions to get the status of CTUO and therefore, generally a highly inflated membership is reported. This is also reflected in the data on claimed membership and finally verified membership. Thirteen CTUOs were declared on the basis of their verified membership and the total membership they claimed was more than 41.2 million as against their finally verified total membership of 24.9 million. It is generally understood that the verified membership may still be inflated. It is also worth mentioning that there are a number of other central trade unions in line for getting the status of CTUO and most of them may also be playing this number game.
As already mentioned, a huge proportion of registered trade unions (88.53 percent) do not bother about submitting the annual returns and so their membership is altogether not reflected in the data on union membership. To balance the inflation in membership by CTUOs and other central unions aspiring to be CTUOs, and to skip the non-operational unions, if we count only one third of the unions not submitting returns and consider their average membership same as that of unions submitting returns, then the total number of operational unions may be 34686 (total registered-84642, submitting returns-9709), and their total membership may be as high as 34.2 million and the trade union density may be 6.88 percent of the labour force and 7.46 percent of the workforce. However, due to no verified data on membership of registered trade unions, generally the trade union density is calculated only on the basis of verified membership of CTUOs (24.88 million), and on that basis the trade union density may be only 5.81 percent of the labour force and 6.27 percent of the workforce (Table 1).
If we disaggregate this picture then we find that the trade union density among wage workers is about 17 percent by total membership of operational trade unions and 13.15 percent by membership of CTUOs. On the other hand, the union density among self employed workers is as low as 0.081 percent. Among formal sector workers the trade union density is about 26.48 percent and among formal workers the union density is as high as 40.94 percent. The union density in informal sector is as low as 3.02 percent. Similarly, only 4.38 percent women workers by membership of all operational unions and 3.71 percent by CTUO membership are unionized (Table 1).
Available online at www.lsrj.in 2

Table 1: Trade Union Density by Various Measurement Factors
Available online at www.lsrj.in
M easurement fact ors (2004-05)
T ota l membersh ip o f unions submitting ret urns (2008) (To tal reg istered -84642 S ubmitting ret urns-9709 No t submitting ret urns-74933 Average membersh ip -986)
M embership o f a ll operat ional reg iste red unions (2008) (if we consider one th ird o f the trade un ions not submitt ing retu rns as operational and with the same average membership as that o f un ions submitt ing re turns)
To tal membership of CTU Os (2002)
T U density (considering membership o funio ns submitt ing re turns 2008, and labour fo rce/ w ork fo rce 2004-05)
TU density (considering membership o f all operational reg iste red unio ns 2008, and labour force/work fo rce 2004-05)
TU density (considering membership o f CTU Os as tota l TU membership in 2002 and labour fo rce/ workfo rce 1999-2000 /2002)
B y labour fo rce 428 millio n (2002) 468 million (2004-05)
9 .57 million 34 .2 million (to tal operat ional TU= 9709+(74933/3 )= 34686 ;membership o f operation un ions=34686*986= 34200396)
24 .88 million 2 .04** 6.88** 5.81**
B y workfo rce 396 .8 m (1999-2000) 458 m (2004-05)
9 .57 million 34 .2 million 24 .88 million 2 .08** 7.46** 6.27**
B y wage workers 187 .8m (1999-2000) 200 m (2004-05)
9 .4 million (deducting T o tal self employed members o f CT UOs inc lud ing S EW A from to talmembers o f unions submitting ret urns)
34 .03 million (deducting T ota l se lf employed members o fCTU Os inc lud ing SE W A fro m tota l members o foperational un ions)*
24 .71 million (deducting To tal se lf employed members o f CTU Os includ ing SE W A fro m to tal members o f CTU Os)
4 .72* 17.1* 13 .15
3
A PICTURE OF TRADE UNIONS IN INDIA

Available online at www.lsrj.in
By self employed W orkforce 209m (1999-2000) 258m(2004-05)
0.17 million* (Total selfemployed members ofCTUO s including SEWA)*
0.17 million (Tota l self employed memb ers reported by CTUOs including SEW A)
0.065* 0.081
By forma l sector workforce 54.1m (1999-2000) 62.6 m (2004-05)
14.33 million (deducting CTUO memb ers in informal ec onomy from total memb ership of CTUO s
26.48
By forma l workers 35m (1999-2000) 34.9m(2004-04)
14.33 million (deducting CTUO memb ers in informal ec onomy from total memb ership of CTUO s
40.94
By informa l sector workforce 342.7 m(1999-2000) 395.4 million(2004-05)
10.38 million (CTUO memb ers in informal ec onomy including Agriculture (7.64m), Building & construction, Brick kilns, Personal servic es, Local authority bodies, Food & beverage selling and Self-employment)
3.02**
By Women workers 127m (2001) 148 m (2004-05)
2.15 million 6.49 million (if women form 19% of total membership of operational unions as in case of CTUOs)
4.72 million 1.45 4.38 3.71
*This is only a rough estimate, because data on number of self employed members (male/female) in all unions submitting returns is not available ** The data on large numbers of organizations working in informal sectors and their membership is not present, they are largely mass organizations and not registered as trade unions and so the union/organizational density may be underestimated, and therefore to that extent it may also be true for union density by labour force and workforce Source: Authors’ own estimate based on data provided in Papola (2013); GoI (2008a); GoI (2008b); and Ahn (2010); and World Bank Country wise and year wise data on labour force; http://data.worldbank.org/indicator/SL.TLF.TOTL.IN?page=2 ; GoI (2001).
4
A PICTURE OF TRADE UNIONS IN INDIA

ORGANIZING DYNAMICS
SECTORS AND SUB-SECTORS
It is evident from the above data that the existence of the formal employment relationship is one of the most important factors that accelerates the process of unionization of workforce. This is why we get highest trade union density among formal workers. Highest percentage of formal workers is in the formal sector and therefore this sector has higher rate of unionization as well. The role of this factor is also reflected in the fact that the union density among wage workers in general is less than that of the formal workers, but greater than that of the self employed workers. This is also reflected in very low rate of unionization of women workers and informal sector in general, as we also know that the self employed workers form the majority of informal sector workers and women workers. However, this is not the only factor determining the rate of unionization. Another factor is equally important and that is related to the scope of collective bargaining. The scope of collective bargaining may be inbuilt in some occupations by nature of the economy, or built by way of institutions created by the government to regulate the conditions (e.g. welfare boards created in various states for some sections of workers), or forced by the organizing initiatives of working class movements. The inbuilt scope of collective bargaining in various economies may also vary with the industrial structure as, for example, in industries with dominance of smaller economies or where the workforce is largely scattered, the inbuilt scope of collective bargaining and the collective bargaining power of labour is drastically reduced. Similar is the situation in industries with various layers of outsourcing that blur the employer-employee relationship and also effectively scatter the workforce. The lowest scope of collective bargaining may be in subsistence economies where the nature of exploitation is completely hidden. In these situations, the scope of collective bargaining and the collective bargaining power of labour can be increased only by (a) initiatives that may integrate the small economies and subsistence activities in such a way that they can articulate their collective interests and can build a collective power for their collective interests; (b) initiatives in the nature of sub sector boards that may regulate the sub sector economy in such a way that they establish some kind of employer-employee relationship between workers in general and employers in general (not unit based but subsector based) as, for example, the Mathadi boards; (c) initiatives for establishing a dominant practice of industry wide bargaining, that creates and addresses the collective interest of all workers in a particular industry or subsector. Another important factor that impacts the scope of collective bargaining is the level of democracy and the nature of politico-economic regime (level of authoritarianism) in the country. The greater the democracy, the greater the scope of collective bargaining, so to say. The limits of democracy in the capitalist regime put a limit on the scope of collective bargaining as well. This also directly relates to the strength and power of democratic movements that directly or indirectly translates into the collective bargaining power of labour. The impact of all these factors is reflected in the rate of unionization of workforce in general and varied levels of unionization in various sectors and subsectors.
It is interesting to note that in Indian history, in almost all periods when democratic and political movements were stronger, workers in general and the agriculture workers in particular were relatively better organized. We know that the agriculture workers form the huge majority of the informal sector workforce. Therefore the downfall in the democratic and political movements had a disastrous impact on the organizing dynamics and its overall impact was felt in reduced organized density and reduced collective bargaining power. We may cite here as example, the disappearance of land reform movements and the movements for a legislation for agriculture workers. It is to be noted that the downfall of the political movement is not only related to the downfall of the left movements; it is a general downfall in that with the advent of liberalization and globalization a consent was formed among almost all parliamentary parties from left to right representing various sections of society and various ideologies,
Available online at www.lsrj.in 5
A PICTURE OF TRADE UNIONS IN INDIA
regarding neo-liberal politico-economic regime, on the basis of TINA syndrome (There is no alternative). The trade unions and other workers organizations representing the majority of organized workforce were linked with these political parties, and therefore its impact was largely felt in terms of paralyzing the working class movements. It is also worth mentioning that in various states and in various sectors industry wide collective bargaining was the dominant practice, and this was one of the important factors for high rate of unionization and higher collective bargaining power in many subsectors of economy in many states of India. However, due to various factors closely related to the liberalization of the economy actually force ended the practice of industry wide bargaining as, for example, in textiles and engineering sectors in Maharashtra and West Bengal, and in various industries that were shifted from public sector to private sector. Moreover, a section of working class movement was focusing on inclusive transformation of informal sectors by way of building cooperatives and this had also helped in organizing the workers and increasing their collective bargaining power. This trend was also reversed and took a completely different shape in the phase of globalization as, for example, the promotion of Self Help Groups (SHGs) is in no way comparable to the earlier concept of cooperatives.
In light of the above, we can understand why there are wide variations in the level of unionization in various sectors and subsectors of economy and also why there are variations in the rate of unionization in various states of India.
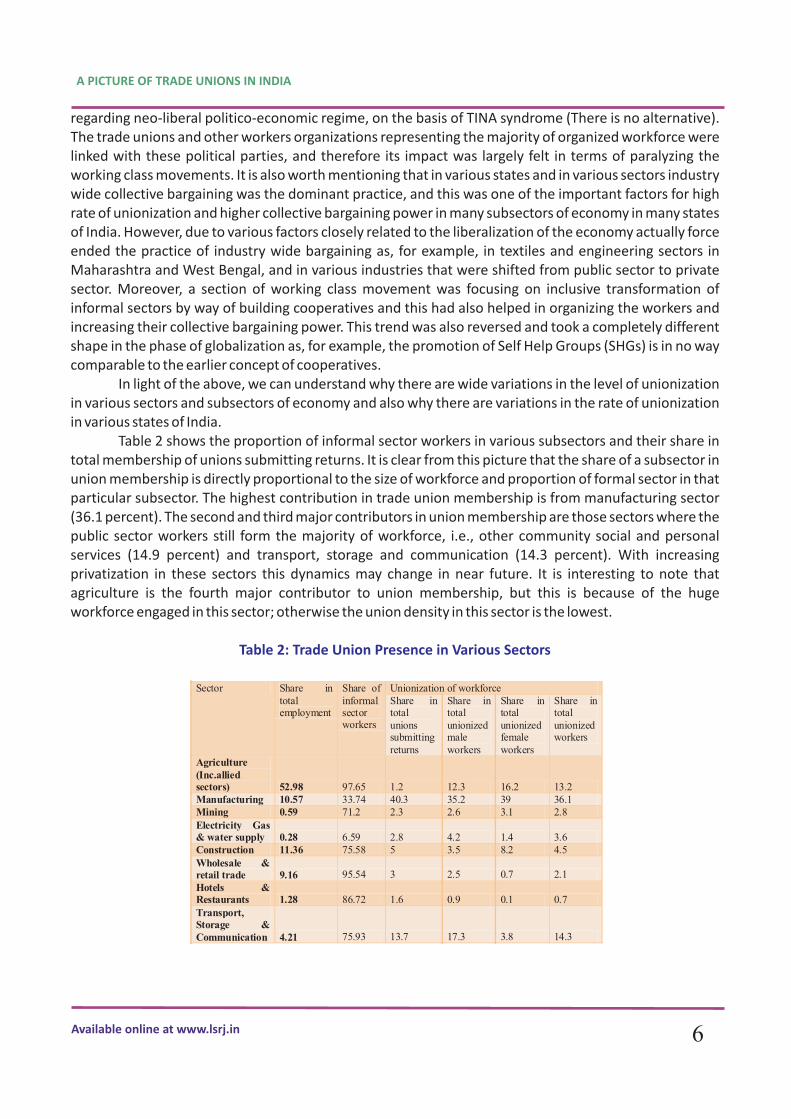
Table 2 shows the proportion of informal sector workers in various subsectors and their share in total membership of unions submitting returns. It is clear from this picture that the share of a subsector in union membership is directly proportional to the size of workforce and proportion of formal sector in that particular subsector. The highest contribution in trade union membership is from manufacturing sector (36.1 percent). The second and third major contributors in union membership are those sectors where the public sector workers still form the majority of workforce, i.e., other community social and personal services (14.9 percent) and transport, storage and communication (14.3 percent). With increasing privatization in these sectors this dynamics may change in near future. It is interesting to note that agriculture is the fourth major contributor to union membership, but this is because of the huge workforce engaged in this sector; otherwise the union density in this sector is the lowest.
Table 2: Trade Union Presence in Various Sectors
Available online at www.lsrj.in
Sector Share in total employment
Share of informal sector workers
Unionization of workforce Share in total unions submitting returns
Share in total unionized male workers
Share in total unionized female workers
Share in total unionized workers
Agriculture (Inc.allied sectors) 52.98 97.65 1.2 12.3 16.2 13.2 Manufacturing 10.57 33.74 40.3 35.2 39 36.1 Mining 0.59 71.2 2.3 2.6 3.1 2.8 Electricity Gas & water supply 0.28 6.59 2.8 4.2 1.4 3.6 Construction 11.36 75.58 5 3.5 8.2 4.5 Wholesale & retail trade 9.16 95.54 3 2.5 0.7 2.1 Hotels &Restaurants 1.28 86.72 1.6 0.9 0.1 0.7 Transport, Storage &Communication 4.21 75.93 13.7 17.3 3.8 14.3
6
A PICTURE OF TRADE UNIONS IN INDIA

Source: GoI (2008b); GoI (2011); NCEUS (2007; 2009);http://planningcommission.gov.in/aboutus/committee/wrkgrp12/wg_emp_planing.pdf. Note: Figures are rounded off, and so may not match up to totals.
The data on number and membership of unions submitting returns (GoI, 2008c) also reveals that during 1996-2007 there was a significant growth in the number of registered unions (58988 to 95783), membership of unions submitting returns (5.6 million to 7.8m) as well as the average membership per union (777 to 1063) . However, the whole period from 1996 to 2008 reflects many ups and downs in the growth of trade unions. The period of 1996 to 2004 reflects a period of very slow growth or stagnation (2001-02 and 2003-04) and in many years decline in average membership (1998-99 and 2001-04). There was a drastic decline in membership of unions submitting returns during 2003-2004 (6.2 to 3.3 million). This was the phase of industrial restructuring with large scale privatization, downsizing, retrenchments and most importantly large scale informalization of workforce in formal sectors by way of replacing regular workers with contract and casual workers. The labour movement was largely compelled to go on the defensive. The data clearly reflects revival of growth in trade unions right from 2005. From 2004 to 2007 the number of registered unions increased from 74403 to 95783, the total membership of unions submitting returns increased from 3.3m to 7.8 m (8.9 m in 2006), and the average membership per union increased from 648 to 1063. It is interesting to note that from 2007 to 2008 there was a decline in number of unions registered (95783 to 84642) and average membership per union (1063 to 986); however, the total membership of unions submitting returns recorded a significant increase (7.8 million to 9.5 million). This was precisely due to the fact that the number and percentage of unions submitting returns significantly increased (7.7 to 10.3 percent) (Table 2.1). This reflects a very interesting dynamics of the new phase when the revival in trade union growth gave rise to emergence of new central trade unions aspiring to get the status of Central Trade Union Organizations. This dynamics was reflected in the verification of union membership of CTUOs in 2002, which gave rise to the emergence of three new CTUOs. On the basis of the trends reflected by the current analysis it can be projected that in the new membership verification process for CTUOs that has already started, a number of new central trade unions will emerge and file their claims for the status of CTUOs. Probably this was the reason why in the new verification criteria, the number limit for getting the status of CTUO is increased from 4 million to 8 million and geographical presence increased from 5 states to 8 states. It is worth mentioning that the phase starting from 2005 onwards also corresponds to a wave of labour movement in formal sectors particularly focused on the issue of formation of trade unions and their recognition as collective bargaining agents, and most of these movements emerged largely independent of existing CTUOs. The period also corresponds with a new phase of organizing the agriculture workers and construction workers utilizing the space created by National Rural Employment Guarantee Act and Construction Workers Welfare Boards established in various states under the central legislation of construction workers enacted in 1996-98. These factors significantly contributed to the emergence of above dynamics of trade union growth.
Available online at www.lsrj.in
Banking & Insurance total 0.81 25.7 7 4 1.6 3.5 Real Estate, renting total 1.25 70.74 3.9 3.2 0.9 2.7 Public administration and defence; compulsory social security 1.96 0.9 2.3 1.4 0.4 1.2 Education 2.41 26.88 0.4 - - - Health and social work 0.66 44.18 2 0.5 0.7 0.5 Other community, social & personal services total 1.8 88.2 14.2 12.3 23.7 14.9 Activities of private households as employers of domestic staff 0.76 98.72 0.2 - 0.1 - Extraterritorial organizations and bodies 0.005 - - - - - Total 100 86.32 100 100 100 100
7
A PICTURE OF TRADE UNIONS IN INDIA

Similar trends are reflected in the verification of membership of CTUOs. The membership of CTUOs increased from 13.22 million in 1989 to 24.88 million in 2002 (Ahn, 2010). It is interesting to note that the loss of membership of central trade unions in formal sector was more than compensated by significant expansion of their membership in the informal sector, particularly in agriculture and construction sectors. It is very much clear from the data that the CTUOs engaged in a big way in organizing the informal sector workers after 1989. The share of informal sector in total membership of CTUOs was about 41.7 percent in 2002. The union membership in agriculture formed as high as 30.7 percent of total CTUO membership and construction formed 4.3 percent. Other informal sectors also contributed significant membership including Brick Kiln 1.8 percent, personal services 1.8 percent, local bodies 1.2 percent, food and drinks 1.2 percent and self employed 0.7 percent of total CTUO membership. It is worth mentioning that the membership of agriculture worker organizations affiliated to Communist Party of India-Marxist (CPI-M) is not counted in verification because it is not part of its trade union CITU and it runs as mass organization; if its membership is also counted then total membership of CTUOs in informal sector
Available online at www.lsrj.in 8
A PICTURE OF TRADE UNIONS IN INDIA

may be far higher (Datt, 2008) (Table 3).
The membership of the CTUOs in the formal sector is mainly concentrated in a few industries. Trade union membership in railways forms as high as 16.87 percent of formal sector CTUO membership. Tobacco--mainly factory sector of beedi making-- constitutes 12.69 percent, coal mining 8.58 percent, roadways 8.43 percent, electricity, gas and water 5.81 percent of formal sector CTUO membership. Membership in these industries together forms more than 52 percent of CTUO membership in formal sector (Datt, 2008) (Table 5).
The above picture reflects the fact that the CTUO membership in formal sector is still heavily concentrated in public sectors. With increasing privatization in railways, roadways, electricity, water and gas services and coal mining, and informalisation of workforce in these sectors, the CTUO membership in these sectors may suffer a setback and this impact may bring an overall downfall in CTUO membership. This process has already started on a large scale and probably the new verification of CTUO membership will vividly reveal it.
In 2002 verification of membership of CTUOs, out of 13 central trade unions that claimed the status of CTUO, 12 were successful in getting this status on the basis of their verified membership at more than 0.4 million and their geographical presence in more than 5 states of India. National Federation of Indian Trade Unions-Kolkata (NFITU (KOL) was denied this status as its final verified membership came to be only 0.03 million. The membership of various trade unions and their share in total membership of CTUOs is given in Table 6. Three new central trade unions entered the CTUO list in 2002 including SEWA, AICCTU and LPF. These three represent three different tendencies. The growth of LPF is closely linked to the political power held by its mother party DMK which remained in power in the state of Tamil Nadu for a long time. This dynamics can also be seen in the sudden unimaginable rise of BMS. The membership of
Available online at www.lsrj.in 9
A PICTURE OF TRADE UNIONS IN INDIA

BMS almost doubled from 3.1 million to 6.2 million from 1989 to 2002. This was closely linked to its mother party in power in various states and in the central government during this period. Same factors can be attributed to the rise of INTUC. One more interesting example is of a new trade union called All India Trinamool Trade Union Congress (AITTUC) affiliated to Trinamool Congress that came into power after defeating CPI-M. During a very short period AITTUC has grown to be a big trade union by membership and also one of the new central trade unions claiming the status of CTUO. But the greatest increase in union membership was recorded by AITUC affiliated with the Communist Party of India that is not in power in any state. Another remarkable development was rise of AICCTU affiliated to the Communist Party of India-Marxist-Leninist-Liberation as CTUO, that reflects increasing presence of left in the labour movement. The rise of SEWA as CTUO and rise of significant proportion of informal sector members in CTUO membership reflects increasing role of the informal sector workers in the labour movement of India.
There is no systematically compiled information on trade unions in various states of India. According to available data on membership of state level trade unions submitting returns, West Bengal is the most unionized state followed by Tamil Nadu, Karnataka, Haryana, Punjab, Assam and Rajasthan.
Table 6: Membership of CTUOs and their Share in Total Membership
VARIOUS STATES
Available online at www.lsrj.in
CTUOs Membership in million (2002)
Membership in million (1989)
Percentage share in total membership 2002
Bharatiya Mazdoor Sangh (BMS) formed in 1955 and affiliated to Bharatiya Janata Party (BJP)
6.22 3.12 (26.2%) 24.98
Indian National Trade Union Congress (INTUC) formed in 1947 and affiliated to Indian National Congress
3.95 2.71 (22.8%) 15.89
All India Trade Union Congress (AITUC) formed in 1920 and affiliated to Communist Party of India (CPI)
3.44 0.92 (7.8%) 13.83
Hind Mazdoor Sabha (HMS) formed in 1948 and not affiliated to any one party, State units support various socialist parties
3.34 1.48 (12.4%) 13.43
Centre of Indian Trade Unions (CITU) formed in 1970 and affiliated to Communist Party of India (Marxist)
2.68 1.8 (15.1%) 10.76
United Trade Union Congress-Lenin Sarani (UTUC-LS) formed in 1951 affiliated to Socialist Unity Centre of India (SUCI)
1.37 5.52
Trade Union Coordination Centre (TUCC) formed in 1970 and affiliated to All India Forward Bloc (AIFB)
0.73 2.94
Swashrayi Mahila Sewa Sangh (Self-Employed Women’s Association-SEWA) formed in 1972 and politically not affiliated to any party, but believes in Gandhian reformist ideologies
0.69 2.77
All India Central Council of Trade (AICCTU) formed in 1989 and affiliated to Communist Party of India Unions (Marxist-Leninist) Liberation
0.64 2.57
Labour Progressive Front (LPF) formed in 1980 and affiliated to a regional part in Tamil Nadu-Dravida Munnetra Kazhagam (DMK)
0.61 2.46
United Trade Union Congress (UTUC) formed in 1949 and affiliated to Revolutionary Socialist Party (RSP)
0.60 2.44
National Front of Indian Trade Unions-Dhanbad (NFITU-DHN) formed in 2006 and affiliated to Rashtriya Janata Dal (RJD)
0.57 2.29
National Front of Indian Trade Unions-Kolkata (NFITU-Kol) formed in 1967 and politically not affiliated to any party
0.03 1.14
Total 24.88 1.19 100 Source: Datt (2008)
10
A PICTURE OF TRADE UNIONS IN INDIA

However, this picture is incomplete and perhaps unbalanced because data on many states were not available as, for example, for Maharashtra, Uttar Pradesh, Bihar, Andhra Pradesh, Odisha and Madhya Pradesh (GoI, 2008c).
If we look at the geographical spread of CTUOs by their verified membership, the central trade unions are almost completely absent in seven states and union territories of India including Arunachal Pradesh, Dadra & Nagar Haveli, Daman & Diu, Lakshadweep, Mizoram, Nagaland and Sikkim. In other 28 states of India, BMS occupied the top position in 12 states including Andhra Pradesh (54.1 percent), Delhi (40.8 percent), Haryana (47.6 percent), Himachal Pradesh (69.6 percent), Jammu & Kashmir (72.8 percent), Maharashtra (34.4 percent), Madhya Pradesh (57.2 percent), Manipur (77.9 percent), Punjab (44.7 percent), Rajasthan (48.9 percent), Uttar Pradesh (42.6 percent) and Uttarakhand (82.0 percent). INTUC occupied the top position only in two states including Assam (62.3 percent) and Chhattisgarh (49.2 percent). CITU occupied the top position in three states including Kerala (50.9 percent), Tripura (52.7 percent) and West Bengal (23.0 percent). AITUC occupied the top position in three states and one union territory including Bihar (35.9 percent), Goa (85.1 percent), Meghalaya (63.1 percent) and Pondicherry (45.4 percent). HMS occupied the top position in two states and one union territory including Chandigarh (75.0 percent), Karnataka (35.0 percent) and Orissa (43.0 percent). LPF occupied the top position in Tamil Nadu (40.5 percent), NFITU-DHN occupied the top position in Jharkhand (34.6 per cent), and SEWA occupied the top position in Gujarat (67.6 percent) and AICCTU occupied the top position in Andaman & Nicobar (54.3 percent).
The central trade unions were also able to get representation in the Parliament; however, the number of trade union representatives in Indian Parliament declined consistently. The highest number of trade unionists in parliament were in 1971 (108) and they captured almost 21 percent of Lok Sabha Seats. In 1996, their number in Lok Sabha decreased to 41 parliamentarians (7.7 per cent), and to 21 (3.9 percent) in 2004.
The above picture on trade unions in India is incomplete and it only shows some salient trends. There are a large number of central trade unions with smaller size of membership but they also have a significant presence and influence in the trade union movement, for example, All India Centre of Trade Unions (Marxist Communist Party of India (United), All India Federation of Trade Unions, Bharatiya Kamgar Sena (Shiv Sena), Bharatiya Mazdoor Sabha (Provisional Central Committee, Communist Party of India (Marxist-Leninist), Hind Mazdoor Kisan Panchayat (Janata Dal United), Indian Confederation of Labour, Indian Federation of Trade Unions (Communist Party of India (Marxist-Leninist) New Democracy), Indian National Trinamool Trade Union Congress, Socialist Trade Union Centre (SNDP), Trade Union Centre of India (Communist Party of India (Marxist-Leninist), United Trade Union Congress (Bolshevik) (Revolutionary Socialist Party (Bolshevik), Confederation of Free Trade Unions of India (CFTUI), and United Trade Union Congress (Marxist) (Revolutionary Socialist Party (Marxist), etc. There are also a number of national level platforms of informal sector workers including National Centre for Labour (NCL) and New Trade Union Initiative (NTUI) with a number of affiliate organizations, and federations of informal sector workers like National Forum of Forest People and Forest Workers (NFFPFW), National Fish Workers Forum (NFF), etc. with considerable presence in many states of India.
There are also a large number of strong state level unions, for example, Andhra Pradesh Federation of Trade Unions (Communist Party of India (Marxist-Leninist), Anna Thozhil Sanga Peravai (All India Anna Dravida Munnetra Kazhagam), Working Women’s Forum, Tamil Nadu, Pattali Trade Union (Pattali Makkal Katchi-PMK), Marumalarchi Labour Front–MLF (Marumalarchi Dravida Munnetra Kazhagam-MDMK), Bihar-Jharkhand State Sales Representatives' Union BSSR Union (BSSRU), Kerala
CONCLUDING REMARKS
Available online at www.lsrj.in 11
A PICTURE OF TRADE UNIONS IN INDIA

Trade Union Congress, Pravasi League, Pravasi Sangham, Maharashtra General Kamgar Union (Kamgar Aghadi), Telugu Nadu Trade Union Council (Telugu Desam Party), Telangana Boggu Ghani Karmika Sangham-TBGKS (Telangana Rashtra Samiti-TRS), Bahujan Kamgar Federation-BKF (Bahujan Samajwadi Party-BSP), Jharkhand Mazdoor Sangha, etc.
This is not all. There are numerous state level mass organizations working in various states of India and there are large numbers of small grassroots mass organization across states.
Research is required to know more about these organizations and their role in Indian economy and society.
1.Ahn, Pong-Sul (2010), The Growth and Decline of Political Unionism in India: The Need for a Paradigm Shift, International Labour Organization, Geneva. 2.Datt, Ruddar (2008), “Regional and Industrial Spread of Trade Unions in India”, The Indian Journal of Labour Economics, Vol. 51, No. 4.3.GoI (2001), Census of India, Ministry of Home affairs, Government of India;http://censusindia.gov.in/(S(clfdfhq1yp0bsh4535gedj45))/Census_And_You/economic_activity.aspx4.GoI (2008a), Order of Verification of Membership of Trade Unions affiliated to CTUOs, as of 31 Dec. 2002, Ministry of Labour and Employment, Government of India.5.GoI (2008b), Verification of Membership of Trade Unions affiliated to Central Trade Union Organisations (CTUOs), as on 31.12.2002; http://clc.gov.in/estb/Verification%20of%20Membership2002.pdf6.GoI (2008c), Trade Unions in India, Labour Bureau, Chandigarh, Ministry of Labour & Employment, Government of India.7.GoI (2011), Report of the Working Group on Employment, Planning & Policy for the Twelfth Five Year Plan (2012-2017), Government of India, Labour, Employment & Manpower Division, Planning Commission, December; http://planningcommission.gov.in/aboutus/committee/wrkgrp12/wg_emp_planing.pdf 8.GoI (2013), Notice for Verification of Membership of Central Trade Union Organizations; http://clc.gov.in/estb/pdf/Verification,Notice.pdf9.NCEUS (2007), The Report on Conditions of Work and Promotion of Livelihoods in Unorganized Sector, National Commission for Enterprises in the Unorganized Sector, Government of India.10.NCEUS (2009), The Challenge of Employment in India, An Informal Economy Perspective, National Commission for Enterprises in the Unorganised Sector, Government of India.
REFERENCES
Available online at www.lsrj.in
Surendra Pratap
Annavajhula J.C. Bose
Center for Workers Education, New Delhi.
Department of Economics, Shri Ram College of Commerce, Delhi .
12
A PICTURE OF TRADE UNIONS IN INDIA

Publish Research ArticleInternational Level Multidisciplinary Research Journal
For All Subjects
Dear Sir/Mam, We invite unpublished Research Paper,Summary of Research Project,Theses,Books and Book Review for publication,you will be pleased to know that our journals are
Associated and Indexed,India
¬
¬OPEN J-GATEInternational Scientific Journal Consortium
Associated and Indexed,USA
?Google Scholar?EBSCO
DOAJIndex CopernicusPublication IndexAcademic Journal DatabaseContemporary Research IndexAcademic Paper DatabseDigital Journals DatabaseCurrent Index to Scholarly JournalsElite Scientific Journal ArchiveDirectory Of Academic ResourcesScholar Journal IndexRecent Science Index
?Scientific Resources Database?Directory Of Research Journal Indexing
?
?
?
?
?
?
?
?
?
?
?
?
Indian Streams Research Journal 258/34 Raviwar Peth Solapur-413005,Maharashtra
[email protected]/[email protected]
Website : www.isrj.org