Embed Size (px)
Citation preview
RESEARCH ARTICLE Kanu Saini et.al / IJIPSR / 2 (6), 2014, 1168-1191
Department of Pharmaceutics ISSN (online) 2347-2154
Available online: www.ijipsr.com June Issue 1168
e
DESIGN, DEVELOPMENT AND EVALUATION OF NANO-
EMULSION GEL OF SALICYLIC ACID
1Kanu Saini*,
2Punam Gaba,
3Jasvir Singh
1,2Amar Saheed Baba Ajit Singh Jujhar Singh Memorial College of Pharmacy, Bela-Ropar,
Punjab-140 001, INDIA 3School of Pharmaceutical Sciences, Shoolini University, Solan (HP), Oachghat -173 212,
INDIA
Corresponding Author:
Kanu Saini
M.Pharmacy Student
Amar Saheed Baba,
Ajit Singh Jujhar Singh Memorial College of Pharmacy,
Bela-Ropar, Punjab-140 001, INDIA
Email: [email protected]
Phone: +91-9569221501
International Journal of Innovative
Pharmaceutical Sciences and Research www.ijipsr.com
Abstract
The objective of this work was to increase the solubility, permeability and also stability of nanoemulsion
formulation of salicylic acid. Using pseudo-ternary phase diagram nanoemulsion area was selected and
according to that ratio of oil, surfactant and cosurfactant nanoemulsion was optimized. Optimized salicylic acid
loaded nanoemulsion was prepared successfully by spontaneous self-emulsification method and characterized
for viscosity, droplet size and transmission electron microscopy (TEM). Further the optimized nanoemulsion
was incorporated into 0.75% Carbopol 980 to get a gel for improving convenience in superficial application of
the drug. The particle size of the nanoemulsion prepared ranging from 100nm-500nm. In vitro drug release was
performed upto 12 hours. Further compatibility studies were performed to confirm any drug polymer interaction
and it was found that there were no special peaks indicating no drug polymer interaction that is significant. The
optimized formulation showed 52.19% release in about 12 hours but the marketed formulation showed 17.81%
release in about 12 hours. The release studies of optimized formulation was fitted in different kinetic models
and found that they are following Zero order release. This work showed for the first time that salicylic acid can
be formulated into nanoemulsions.
Key words: Salicylic acid, nanoemulsions, topical delivery.
RESEARCH ARTICLE Kanu Saini et.al / IJIPSR / 2 (6), 2014, 1168-1191
Department of Pharmaceutics ISSN (online) 2347-2154
Available online: www.ijipsr.com June Issue 1169
INTRODUCTION
Salicylic Acid (SA) or 2-Hydroxybenzoic acid is commonly referred to as a beta hydroxyl acid
(BHA). Today, Salicylic Acid continues to play an important role as an active ingredient in over-
the counter (OTC) topical drug products. SA is in a class of medications called keratolytic agents
that induces corneocyte disaggregation in the upper stratum corneum, thereby enhancing the
shedding of scales and softening the stratum corneum. SA is readily absorbed from the skin and
may induce toxicity (Salicylism). A limitation of the currently available keratolytic topical
formulations is their potential to cause such unwanted reactions as stinging, burning, peeling,
dryness and erythema due to their rapid absorption [1-3]. These reasons lead to the study of
nano-emulsion based gel of salicylic acid. Nanoemulsions (NE) have received a growing
attention as colloidal drug carriers for pharmaceutical applications. Nanoemulsions are a class of
emulsions with very small and uniform droplet size, typically in the range of 20-500nm and are
thermodynamically stable [4], transparent (or translucent), dispersion of oil and water stabilized
by an interfacial film of surfactant molecules having the droplet size in nanometer range. These
system require relatively appropriate amount of surfactant is stabilize the large interfacial area
created by the nano-droplets often addition of cosurfactant such as alcohol is also required to
attain appropriate fluidity or viscosity of the interface. Nanoemulsion provides ultra low
interfacial tension and large o/w interfacial areas. Nanoemulsion have a higher solubilization
capacity than simple micellar solutions and their thermodynamic stability offers advantages over
unstable dispersions, such emulsions and suspensions, because they can be manufactured with
little energy input (heat or mixing) and have a long shelf life. However long term physical
stability of nanoemulsion (which no apparent flocculation or coalescence) make them unique and
they are sometime referred as approaching thermodynamic stability [5,6]. The use of
nanoemulsions could be a very good carrier for topical delivery of highly lipophilic drugs. It was
also found that the excipients which are used to developed nanoemulsion helps to augment the
solubilizing and permeation capacity. Because of the smaller droplets contained in nanoemulsion
there by facilitate close contact with the statum corneum. That is why the amount of
encapsulated agent penetrating into the viable skin facilitates the drug transport by changing the
vehicle/stratum corneum partition coefficient. Salicylic acid having shorter half-life (2-4 hours),
lower molecular weight (< 138.12g/mol), low aqueous solubility & high lipophilicity (Partition
co-efficient, 2.2) eventually becomes a suitable candidate for the topical delivery.
RESEARCH ARTICLE Kanu Saini et.al / IJIPSR / 2 (6), 2014, 1168-1191
Department of Pharmaceutics ISSN (online) 2347-2154
Available online: www.ijipsr.com June Issue 1170
MATERIALS AND METHOD
Materials
Salicylic acid (SA) was kindly supplied from Central Drug House, New Delhi, India. Oleic acid
was purchased from Molychem, Mumbai, India. Tween-20 was obtained from Thomas baker,
chemicals, Mumbai, India. Polyethylene glycol 200 (PEG 200) was purchased from Finar
Chemicals Ltd., Ahmedabad, India. Carbopol 980 was obtained from Lubrizol Advanced
Materials, Europe. All chemicals and solvents used in this study were of analytical reagent grade.
Freshly distilled water was used throughout the work.
Methods
Solubility Studies of Salicylic Acid
To find out the appropriate oils, surfactants and co-surfactants as a composition of nanoemulsion
the solubility of salicylic acid in various oils (Castor oil, Sunflower oil, IPM, Myritol, MCT oil,
Oleic acid, Olive oil), surfactants (Cremophor RH 40, Kolliphor ELP, Tween 80, Tween 60,
Tween 20, Span 80, Span 20) and co-surfactants (Glycerin, Propylene Glycol, Ethanol, PEG 400,
PEG 200, Propanol) was determined by using shake flask method. Briefly, an excess amount of
salicylic acid (10mg) was added to each vial containing 5 mL of the selected vehicle, i.e. oil,
surfactant and co-surfactant. After sealing, the mixture was vortex for 5 min and sonicated by
using bath sonicator for 3 mins in order to facilitate proper mixing of salicylic acid with the
vehicles and reduce the particle size of the drug. Mixtures were shaken for 72 hrs in an
isothermal shaker (Remi, Mumbai, India), maintained at 37±1ºC, and afterwards, mixtures were
centrifuged at 1500 rpm for 10 min and then supernatant was filtered through membrane filter
(0.45µm) to remove the remaining salicylic acid. After the appropriate dilution with methanol
the concentration of SA in the filtrate was determined at 304 nm by UV spectrophotometer and
solubility of SA in different oils, surfactants, and co-surfactants was calculated with the help of
standard calibration curve [7].
Selection of Oil, Surfactant and Co-Surfactant
On the basis of solubility studies oil, surfactant and co-surfactant were selected for nano-
emulsion formulation.
Screening of Surfactants
Different surfactants were screened for emulsification ability. For this study, 150mg of surfactant
were added to 150mg of oily phase and then this mixture was heated at 50ºC for homogenization
RESEARCH ARTICLE Kanu Saini et.al / IJIPSR / 2 (6), 2014, 1168-1191
Department of Pharmaceutics ISSN (online) 2347-2154
Available online: www.ijipsr.com June Issue 1171
of the components. Then from each mixture prepared 100 mg was withdrawn and diluted to
100ml in a volumetric flask. The ease of emulsification was judged by the number of flask
inversions required to yield homogeneous emulsion. The emulsions were allowed to stand for 24
hrs and then % transmittance was evaluated at 604nm by using UV spectrophotometer. They
were also observed for turbidity or phase separation visually [7].
Screening of Co-Surfactants
For screening of co-surfactants the best combinations of oil and surfactant as before were
selected depending on the stability and %transmittance. For which the oil: surfactant: co-
surfactant were taken as 600mg: 400mg: 200mg i.e. in the ratios of 3:2:1. Out of the total
1200mg of the mixture 100 mg was withdrawn and then added dropwise in a 100 ml volumetric
flask containing distilled water dropwise; then it was inverted 50-60 times and kept overnight.
After which the % transmittance was determined by scanning in the range from 800-200 nm
(wavelength 604 nm) using UV-visible spectrophotometer. After the completion of screening the
next step was to optimize the combination showing good % transmittance. For this purpose the
effect of oil, surfactant and co-surfactant on transmittance was studied using different mass
ratios. The various excipients were analyzed and finally optimized for construction of pseudo-
ternary phase diagram. Therefore, the effect of the components on formation of nano-emulsion
was chosen as the criteria for optimization [7].
Construction of Pseudo-Ternary Phase Diagram
On the basis of the solubility studies, Oleic acid was selected as the oil phase. Tween 20 and
PEG 200 were selected as surfactant and cosurfactant, respectively. Distilled water was used as
an aqueous phase. Phase diagrams involve the plotting the three components surfactant: co-
surfactant (Smix), oil and water each of them representing an apex of triangle. Ternary mixtures
with varying compositions of the components were formed. For any ternary mixture formed the
total of surfactants, co-surfactants and oil concentrations always added to 100%. The required
amount of the three components were weighed accurately and then sonicated for 3 minutes. The
mixture was then gently heated at 45–50ºC and vortex to form homogenous mixture. To this
mixture distilled water was added drop by drop until a transparent solution was formed. The
surfactant and co-surfactant was varied in mass ratios 1:1, 1:2, 2:1. The different concentration
ratios of oil and mixture of surfactant and cosurfactant were taken as 0.5:9.5, 0.5:9, 2:8, 3:7, 4:6,
5:5, 6:4, and 7:3. Ternary mixtures were formed in these ratios and then quantity of water
forming transparent solution was plotted in the pseudo-ternary phase diagram [8,9]. According to
RESEARCH ARTICLE Kanu Saini et.al / IJIPSR / 2 (6), 2014, 1168-1191
Department of Pharmaceutics ISSN (online) 2347-2154
Available online: www.ijipsr.com June Issue 1172
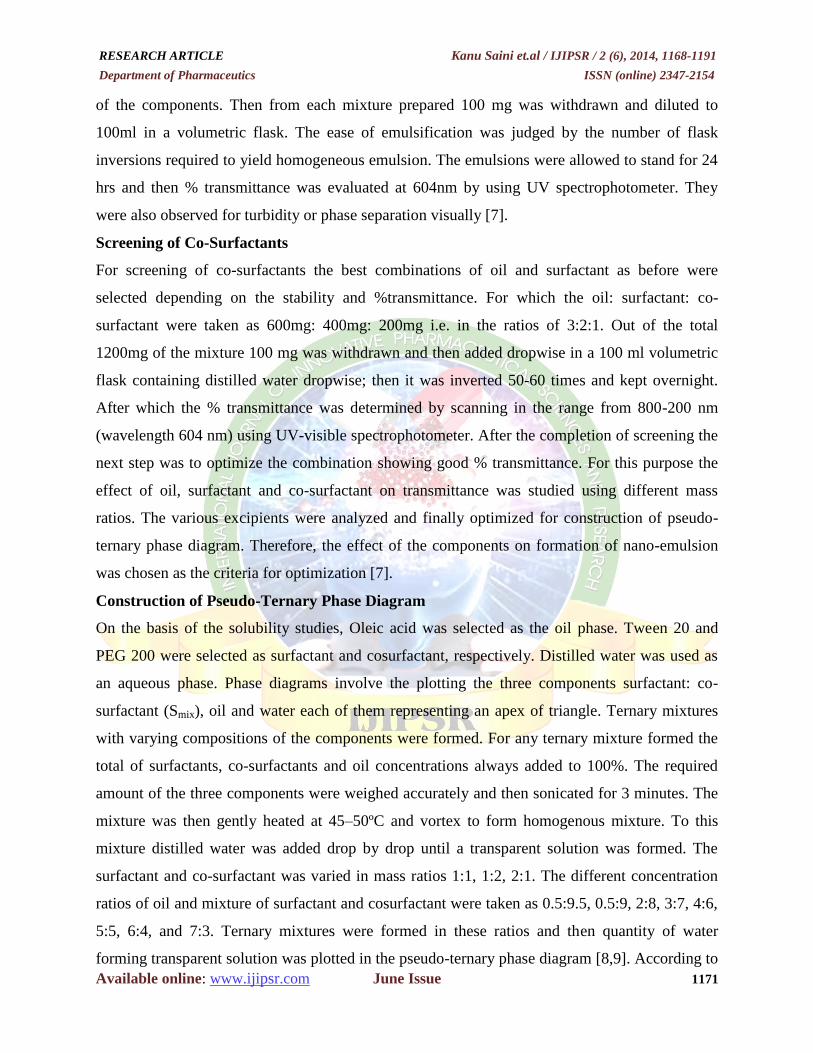
the mass ratio distribution the following distribution was formed of the formulation out of which
10mg (1%w/w) was API rest formulation. The calculations as per the mass ratio of the various
combinations for construction of pseudo-ternary diagram are shown in tables 1 to 3.
Table No. 1: Smix Ratio 1:1(Oleic acid+Tween 20+PEG 200)
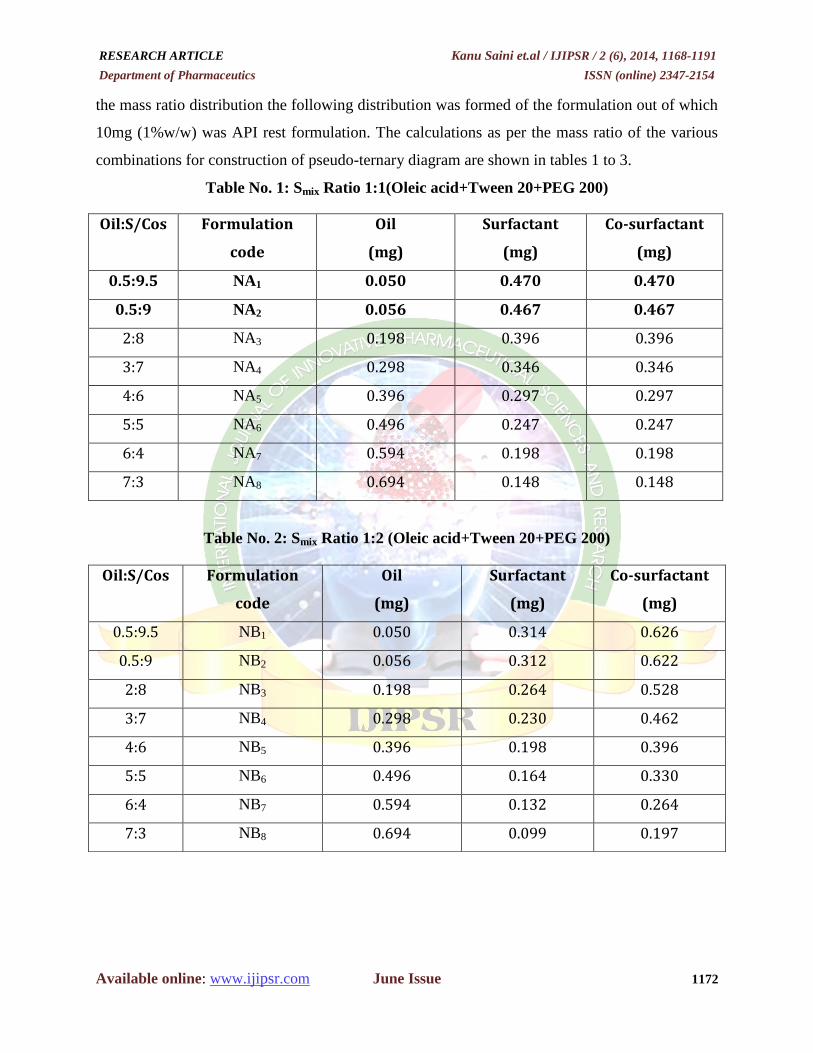
Table No. 2: Smix Ratio 1:2 (Oleic acid+Tween 20+PEG 200)
Oil:S/Cos Formulation
code
Oil
(mg)
Surfactant
(mg)
Co-surfactant
(mg)
0.5:9.5 NA1 0.050 0.470 0.470
0.5:9 NA2 0.056 0.467 0.467
2:8 NA3 0.198 0.396 0.396
3:7 NA4 0.298 0.346 0.346
4:6 NA5 0.396 0.297 0.297
5:5 NA6 0.496 0.247 0.247
6:4 NA7 0.594 0.198 0.198
7:3 NA8 0.694 0.148 0.148
Oil:S/Cos Formulation
code
Oil
(mg)
Surfactant
(mg)
Co-surfactant
(mg)
0.5:9.5 NB1 0.050 0.314 0.626
0.5:9 NB2 0.056 0.312 0.622
2:8 NB3 0.198 0.264 0.528
3:7 NB4 0.298 0.230 0.462
4:6 NB5 0.396 0.198 0.396
5:5 NB6 0.496 0.164 0.330
6:4 NB7 0.594 0.132 0.264
7:3 NB8 0.694 0.099 0.197
RESEARCH ARTICLE Kanu Saini et.al / IJIPSR / 2 (6), 2014, 1168-1191
Department of Pharmaceutics ISSN (online) 2347-2154
Available online: www.ijipsr.com June Issue 1173
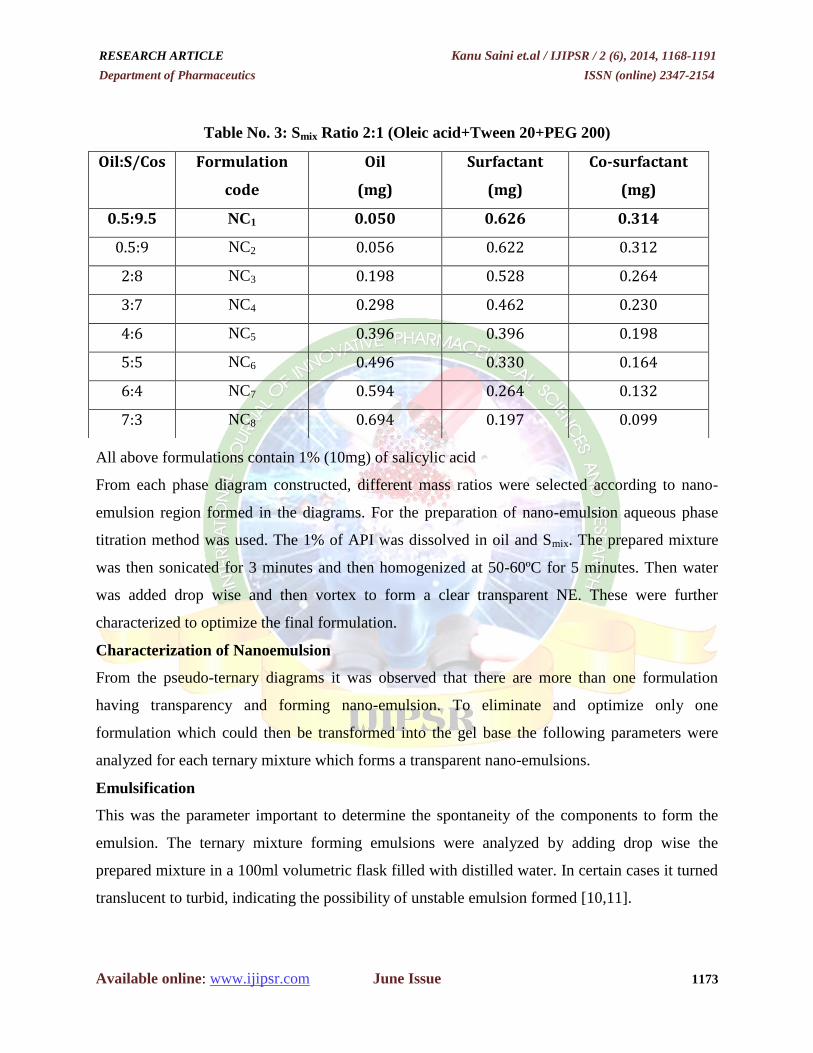
Table No. 3: Smix Ratio 2:1 (Oleic acid+Tween 20+PEG 200)
All above formulations contain 1% (10mg) of salicylic acid
From each phase diagram constructed, different mass ratios were selected according to nano-
emulsion region formed in the diagrams. For the preparation of nano-emulsion aqueous phase
titration method was used. The 1% of API was dissolved in oil and Smix. The prepared mixture
was then sonicated for 3 minutes and then homogenized at 50-60ºC for 5 minutes. Then water
was added drop wise and then vortex to form a clear transparent NE. These were further
characterized to optimize the final formulation.
Characterization of Nanoemulsion
From the pseudo-ternary diagrams it was observed that there are more than one formulation
having transparency and forming nano-emulsion. To eliminate and optimize only one
formulation which could then be transformed into the gel base the following parameters were
analyzed for each ternary mixture which forms a transparent nano-emulsions.
Emulsification
This was the parameter important to determine the spontaneity of the components to form the
emulsion. The ternary mixture forming emulsions were analyzed by adding drop wise the
prepared mixture in a 100ml volumetric flask filled with distilled water. In certain cases it turned
translucent to turbid, indicating the possibility of unstable emulsion formed [10,11].
Oil:S/Cos Formulation
code
Oil
(mg)
Surfactant
(mg)
Co-surfactant
(mg)
0.5:9.5 NC1 0.050 0.626 0.314
0.5:9 NC2 0.056 0.622 0.312
2:8 NC3 0.198 0.528 0.264
3:7 NC4 0.298 0.462 0.230
4:6 NC5 0.396 0.396 0.198
5:5 NC6 0.496 0.330 0.164
6:4 NC7 0.594 0.264 0.132
7:3 NC8 0.694 0.197 0.099
RESEARCH ARTICLE Kanu Saini et.al / IJIPSR / 2 (6), 2014, 1168-1191
Department of Pharmaceutics ISSN (online) 2347-2154
Available online: www.ijipsr.com June Issue 1174
Visual Assessment
The samples giving good emulsification were further analyzed for turbidity initially and after 24
hours. It would indicate phase separation of the emulsion.
%Transmittance
The samples kept for 24 hrs at room temperature were also analyzed for % transmittance which
would determine the clarity of the solution. % Transmittance was analyzed by using UV
spectrophotometer.
Drug Content
Drug content was the important criterion for optimization of formulation as it indicates the
amount of drug entrapped in the nano-size globules of nano-emulsion. This study was carried out
by diluting each ternary mixture with methanol and then centrifuged for 2 hrs at 1000-1500rpm
which was then analyzed using UV spectrophotometer [12-14].
pH
The topically delivered formulations have a pH generally between 6-8 which is similar to the
skin pH. The samples were analyzed for pH using pH meter. 5 ml of the sample was transferred
into a beaker and the pH meter probe was immersed into the container. Then the pH reading was
recorded. The pH meter was calibrated before using it to measure the pH of the nanoemulsion.
The pH of the freshly prepared formulation was measured and was used to compare the change
in pH of the formulation after specified time intervals at the different temperatures studied.
TEM
This was done to analyze the morphology and structure of the formed nanoemulsion droplets
which was studied using transmission electron microscopy Malvern version 6.30 and it is
capable of point to point resolution. In order to carry out the study a drop of the nanoemulsion
was deposited on the holey film grid and studied after drying.
Droplet Size Analysis
This study is mainly carried out by using photon correlation spectroscopy; the technique
analyzes the fluctuations in light scattering due to Brownian motion of the particles. The
instrument used was a Zetasizer 1000 HS Malvern Instruments, UK (Light scattering was
monitored at temp 25°C and at 90° angle). The studies were performed at a fixed refractive index
that depends on the formulation involved in the study.
RESEARCH ARTICLE Kanu Saini et.al / IJIPSR / 2 (6), 2014, 1168-1191
Department of Pharmaceutics ISSN (online) 2347-2154
Available online: www.ijipsr.com June Issue 1175
FT-IR Studies
FTIR spectrums of drug and mixture of drug and excipients formulation were obtained by means
of a FTIR spectrophotometer. The samples were prepared by the potassium bromide disk method
and measurements were attempted with the accumulation of 20 scans and a resolution of 4 cm-1
over the range of 400–4000cm-1
. After running the spectra, significant peaks relating to major
functional groups were identified; spectra of the subsequent sample of the same compound were
compared with the original.
Optimization of Nanoemulsion Based Gel
After optimization of the nano-emulsion formulation it was given a gel base as for topical
delivery the nano-emulsion has very low viscosity. The gel was formed by varying the
concentration of carbopol 980 (NF) as 0.75%, 1%, 2%. Carbopol 980 forms very good
consistency transparent gel at low concentration. Carbopol 980 is not toxic and does not cause
any irritation on skin. So carbopol 980 was selected as a gelling agent. For the preparation of gel
the required amount of carbopol was dipped in sufficient amount of water for 24 hrs and the
nano-emulsion formulation was added after neutralising the pH of carbopol.
Evaluation of Nano-Emulsion Based Gel
pH
The pH of the gel was determined by using Labindia Pvt. Ltd pH meter. 5 ml of the sample was
transferred into a beaker and the pH meter probe was immersed into the container. Then the pH
reading was recorded. The pH meter was calibrated before using it to measure the pH of the
nanoemulsion. The pH of the freshly prepared formulation was measured and was used to
compare the change in pH of the formulation after specified time intervals at the different
temperatures studied.
Viscosity
Viscosity measurements were carried out using a Brookfield viscometer DV III ultra V6.0 RV
cone and plate rheometer (Brookfield Engineering Laboratories, Middleboro, MA, USA). 20 ml
of nanoemulsion was filled in the cylindrical tube and the dial reading was noted at 10, 20, 50
and 100 rpm. The speed was then successively lowered and the corres-ponding dial readings
were noted. Direct multiplication of the dial readings with factors given in the Brookfield
viscometer catalogue gave the viscosity in centipoises (cp).
RESEARCH ARTICLE Kanu Saini et.al / IJIPSR / 2 (6), 2014, 1168-1191
Department of Pharmaceutics ISSN (online) 2347-2154
Available online: www.ijipsr.com June Issue 1176
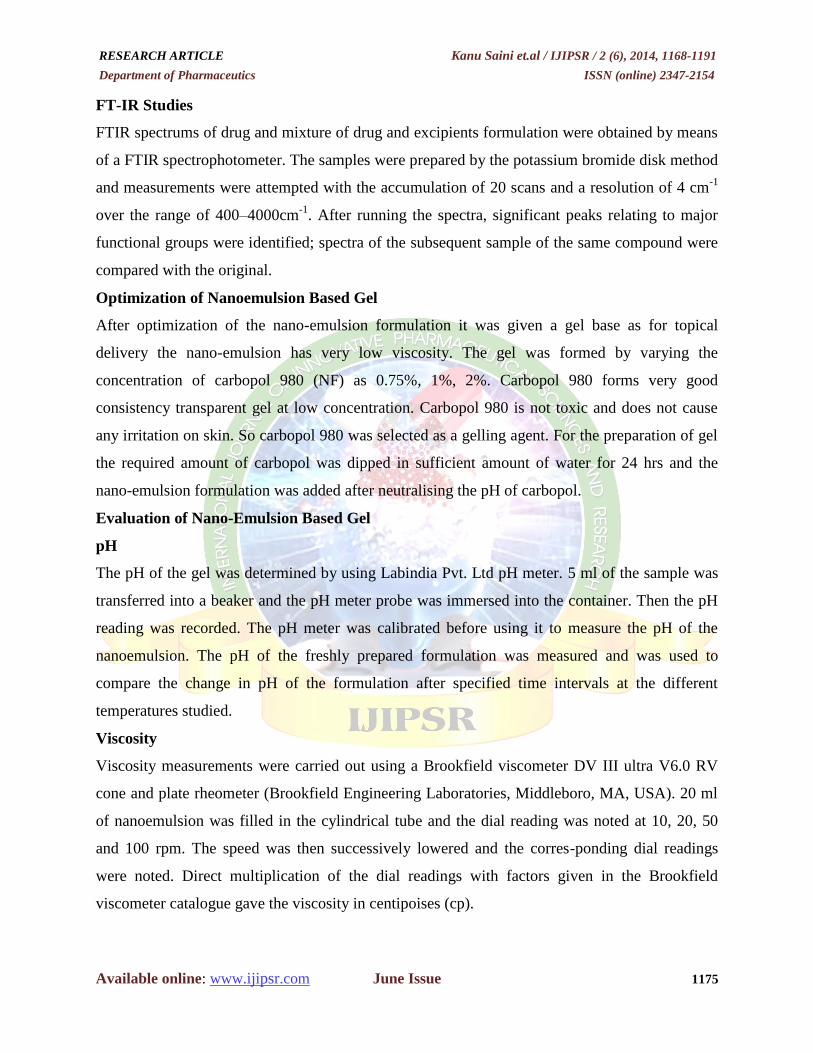
In-vitro Drug Release and Permeation Studies
Figure 1: Franz-Diffusion Cell Assembly
In-vitro study is performed using Franz-Diffusion Cell Assembly. The jacked cell embodied two
limb reservoirs that involve a donor compartment, receptor compartment and a sampling port.
The area of donar compartment exposed to receptor compartment i.e. diffusion cross sectional
area is 19.63cm2 and the total capacity of the receptor compartment is 30 ml. the receptor
compartment is stirred throughout the study at 100rpm employing a magnetic stirrer. The
temperature of the receptor medium is maintained at 37±2ºC by circulating hot water in the outer
jacket of cell employing a thermostatic water circulator. The release study was carried out using
Egg membrane cut off range 12-18 kD.
Prior to permeation experiment, membrane was thawed and clamped in donor and the receptor
compartment of the jacketed vertical Franz Diffusion Cell. The receptor compartment was filled
with the Phosphate buffer pH 7.4. The prepared gel formulation was applied on the membrane.
The donor chamber and sampling port were covered by parafilm to prevent evaporation during
the study. Aliquots of 1 ml were withdrawn periodically and replaced with equal volume of the
receptor medium to maintain the receptor phase volume at the constant level. Samples are
suitable diluted and analyzed for salicylic acid in UV-spectroscopy at 296nm. The study was
carried out for 12 hrs.
Comparison with Marketed Preparation
The comparison was carried out to determine that the developed formulation is at power with the
already marketed formulation. For this determination the parameters were selected on the basis
of which the comparison between the two could be carried out. The parameters are described as
follows:
Viscosity

RESEARCH ARTICLE Kanu Saini et.al / IJIPSR / 2 (6), 2014, 1168-1191
Department of Pharmaceutics ISSN (online) 2347-2154
Available online: www.ijipsr.com June Issue 1177
In vitro-studies
The procedures employed for the determination of these parameters are the same as described in
the appropriate places in this chapter.
Kinetic Analysis of Drug Release
To analyze the mechanism of drug release from salicylic acid nanoemulsion based gel the in
vitro dissolution data were fitted to zero order, first order, Higuchi release model, and
Korsemeyer-Peppa’s model and the model with higher correlation coefficient (R2) was
considered to be the best model [15].
Accelerated Stability Studies
The optimized formulation was subjected to accelerated stability test over a period of three
months as per ICH guidelines at a temperature of 40 ± 2ºC, 75% RH, 25 ± 2ºC, 60% RH and 50
± 3ºC. The optimized formulation was analyzed for changes in appearance, pH and drug content.
RESULTS AND DISCUSSION
Solubility Studies
Solubility of salicylic acid in different oil,surfactant and co-surfactant was determined. From the
table 4 it was observed that sunflower oil has certain solubility but oleic acid has the highest
solubility. The possibility of an oil to form a transparent nano-emulsion is based on the carbon
chain length of the oils. From the above data it was concluded that almost all oils have poor
solubility; so oleic acid and sunflower oil which have medium chain length were selected based
on the solubility and for further screening procedure. From the table 5 it was observed that
Tween 20 has the best solubility and was thus selected for further study. From the table 6 it was
observed that PEG 200 has maximum solubility as compared to others.
Table No. 4: Solubility of salicylic acid in various oils
Sr. No Oil Solubility (mg/ml) (Mean±SD)
1 Castor Oil 1.7±0.61
2 Sunflower Oil 9.4±0.46
3 Isopropyl Myristate (IPM) 0.61±0.59
4 Myritol 0.36±1.14
5 Medium Chain Triglycerides
(MCT) Oil 0.4±0.66
6 Oleic acid 89.09±0.39
7 Olive Oil 2.9±0.57
RESEARCH ARTICLE Kanu Saini et.al / IJIPSR / 2 (6), 2014, 1168-1191
Department of Pharmaceutics ISSN (online) 2347-2154
Available online: www.ijipsr.com June Issue 1178
Table No. 5: Solubility of salicylic acid in various surfactants
Sr. No. Surfactant Solubility (mg/ml) (mean±SD)
1 Cremophor RH 40 0.67±0.44
2 Kolliphor ELP 5.81±0.51
3 Tween 80 122.07±0.10
4 Tween 60 112±0.23
5 Tween 20 215.63±0.31
6 Span 80 15.23±0.67
7 Span 20 12.98±0.89
Table No. 6: Solubility of salicylic acid in various co-surfactants
Sr. No. Co-surfactant Solubility (mg/ml) (Mean±SD)
1 Glycerin 16.54±0.78
2 Propylene Glycol 8.61±0.53
3 Ethanol 367.54±0.21
4 PEG 400 314.54±0.40
5 PEG 200 423.63±0.26
6 Propanol 330.54±0.28
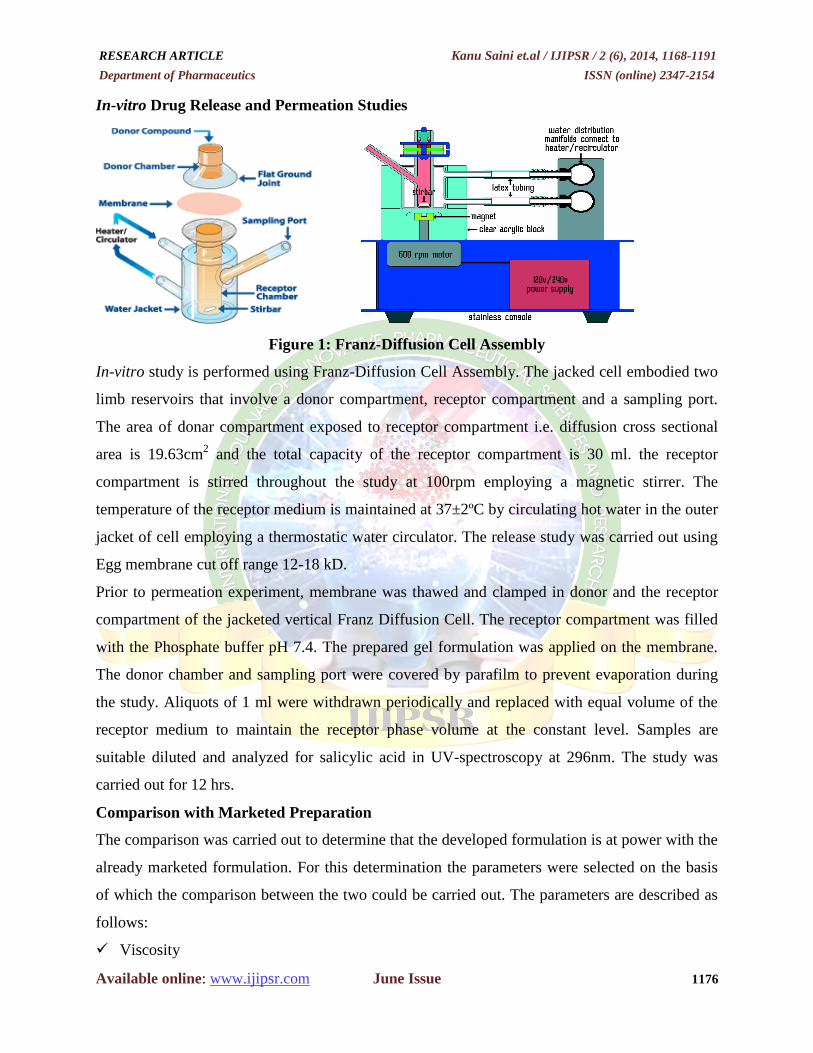
Pseudo-Ternary Phase Diagram
The pseudo-ternary phase diagrams were constructed by using water titration method to obtain
the o/w nano-emulsion region, within which the concentration range of the components (oil,
surfactant and co-surfactant) was identified. The mass ratio of surfactant to co-surfactant were
varied as 1:1, 1:2, and 2:1 and the ratio of oil: Smix were varied as 0.5:9.5, 0.5:9, 2:8, 3:7, 4:6,
5:5, 6:4, and 7:3.
Figure 2: TPD of Smix ratio 1:1 (Oleic acid+Tween-20+PEG-200)
RESEARCH ARTICLE Kanu Saini et.al / IJIPSR / 2 (6), 2014, 1168-1191
Department of Pharmaceutics ISSN (online) 2347-2154
Available online: www.ijipsr.com June Issue 1179
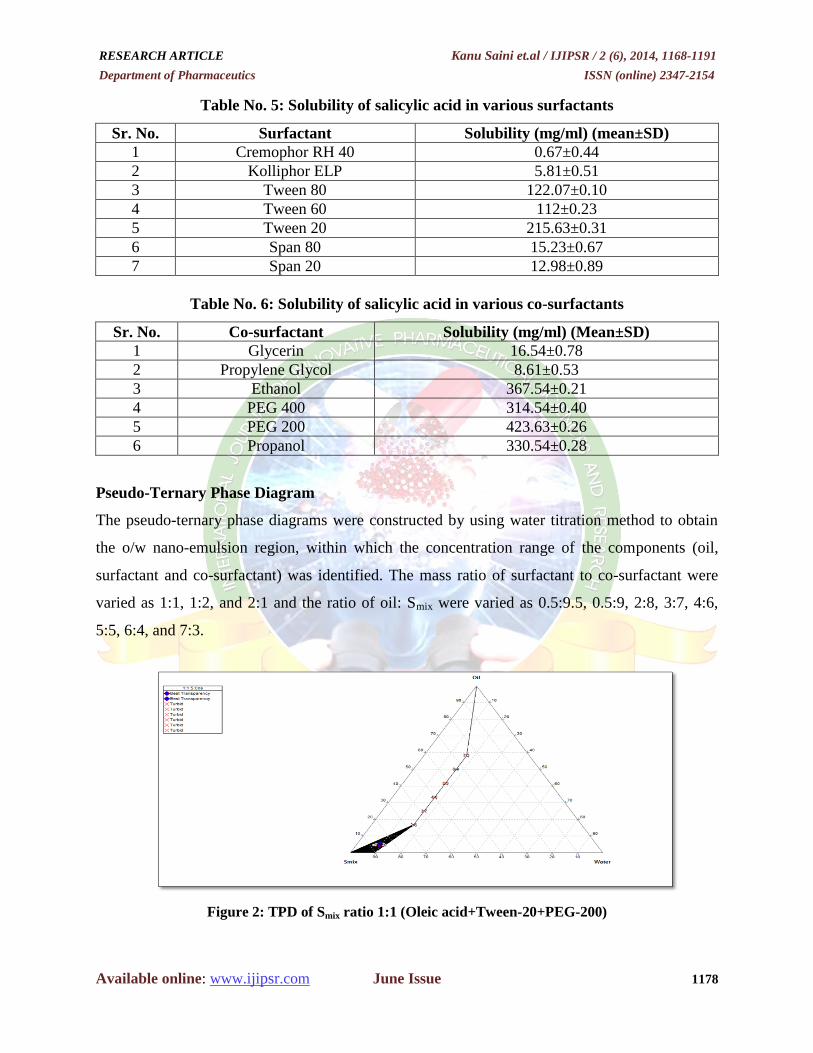
Figure 3: TPD of Smix ratio 1:2 (Oleic acid+Tween-20+PEG-200)
Figure 4: TPD of Smix ratio 2:1 (Oleic acid+Tween-20+PEG-200)
Nano-emulsion region: The nano-emulsion region was found only in NA1, NA2, NC1
formulations i.e. clear and transparent liquid this is because in the initial stage of titration with
water the ratio of Oil:Smix is 0.5:9.5 and 0.5:9 means conc. of oil is very less as compared to Smix.
When water is added drop wise due to high conc. of surfactant, the oil and water disperse in each
other properly and no phase separation of oil and water molecules and hence clear and
transparent nano-emulsion was formed.
Coarse emulsion or Turbid region: The coarse emulsion or turbid region was found in all
formulations other than NA1, NA2, NC1 i.e. turbid liquid this is because in these formulation the
ratio of Oil:Smix is 2:8, 3:7, 4:6, 5:5, 6:4, 7:3 means conc. of oil increases as compared to Smix.
When water is added drop wise due to low conc. of surfactant, the oil and water molecule do not
RESEARCH ARTICLE Kanu Saini et.al / IJIPSR / 2 (6), 2014, 1168-1191
Department of Pharmaceutics ISSN (online) 2347-2154
Available online: www.ijipsr.com June Issue 1180
disperse in each other properly and hence phase separation of oil and water molecules takes
place and hence turbid solution (coarse emulsion) was formed.
Characterization of Nanoemulsion Formulation
The construction of pseudo-ternary diagrams the all four combinations which should be included
in the optimum ratio of 1:1 and 2:1. In these also there were two ratios having a clear solution on
visual assessment i.e. ratios 0.5:9.5 and 0.5:9; out of these the selection was done on the basis of
following parameters and the results are tabulated in table 7.
Table No. 7: Results of characterization of nano-emulsion
From the table 7, the formulation NC1 which has oleic acid as an oil phase, Tween-20 as a
surfactant and PEG-200 as a co-surfactant was selected as the final formulation because of
higher transmittance and drug content and it has Smix ratio of 2:1. Oleic acid is unsaturated
medium chain fatty acid moiety containing carbon chain length of 16 and 18, respectively. Oleic
acid has HLB (hydrophilic-lipophilic balance) value 1. Oleic acid, a fatty acid with one double
bond in the chain structure, perturbs the lipid barrier in the stratum corneum by forming separate
domains which interfere with the continuity of the multilamellar stratum corneum and may
induce highly permeable pathways in the stratum corneum.
In general, the surfactant for Nanoemulsion should be very hydrophilic with HLB value of 16.7.
The higher the HLB is, the easier to dissolve in water. Tween 20 is capable to form
nanoemulsion in combination with oleic acid. These results indicate that HLB is important
parameter determining the surfactant’s ability to form nano-emulsion. The structure of the
surfactant also played an important role. Tween 20 is a polyoxyethylene derivative of sorbitan
monolaurate, and is distinguished from the other members in the polysorbate range by the length
of the polyoxyethylene chain and the fatty acid ester moiety. It has branched alkyl structure
whereas polysorbate has linear chain alkyl structure. It was reported that alkyl chain structure of
surfactant impact an effect on penetration of oil onto the curved surfactant film thus resulting in
F.C.
Name of
Compon-
ents
Smix
Ratio
Oil:Smix
Ratio
Emulsi-
fication
Visual
Assessment %T %D.C pH
NA1
O.A+
Tween20
+PEG 200
1:1
0.5:9.5 Slow Clear 98%
17.09 5.5
NA2 0.5:9 Slow Clear 96.3%
11.04 5.0
NC1 2:1 0.5:9.5 Rapid Clear 99.9%
73.18 5.9
RESEARCH ARTICLE Kanu Saini et.al / IJIPSR / 2 (6), 2014, 1168-1191
Department of Pharmaceutics ISSN (online) 2347-2154
Available online: www.ijipsr.com June Issue 1181
the self-nanoemulsion formation. Co-surfactant helps the surfactant to form stable nano-
emulsion. It is amphiphilic with an affinity for both oil and aqueous phases and partitions to an
appreciable extent into the surfactant interfacial monolayer present at the oil-water interface. Co-
surfactant provides very low interfacial tension required for the stability and formation of
nanoemulsion. In this present study, PEG-200 was suitable as co-surfactant.
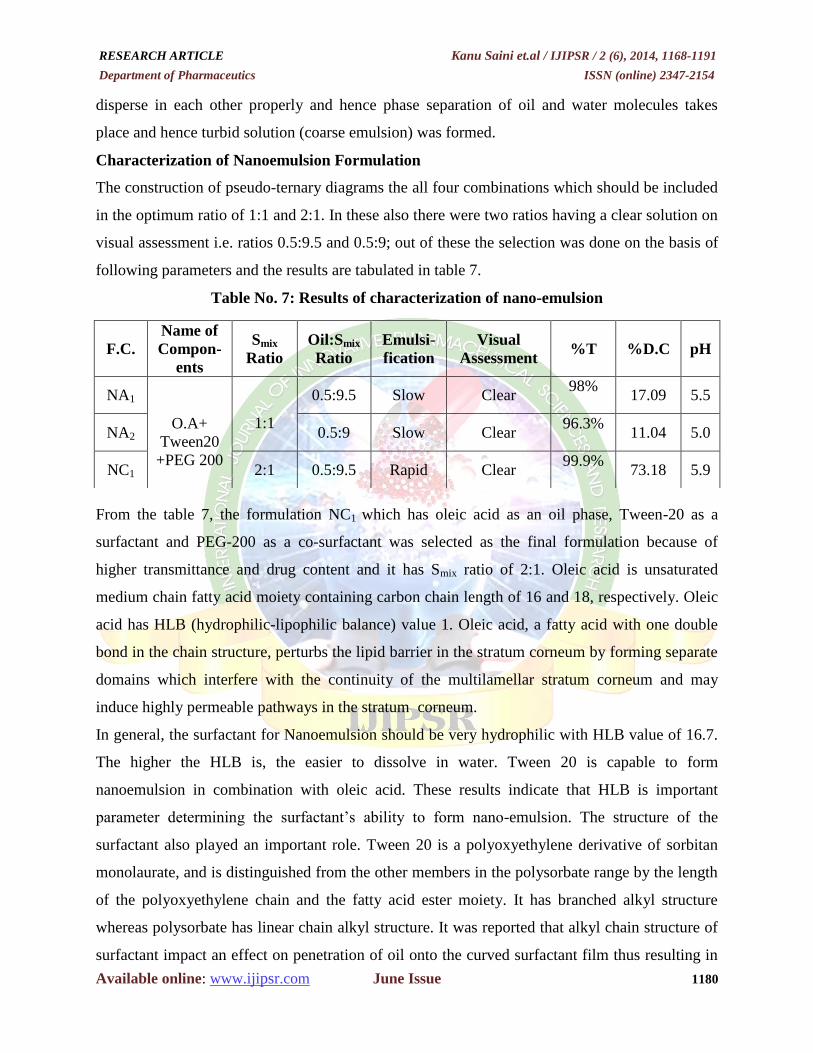
TEM
Figure 5: Result of TEM
Morphology and structure of the nano-emulsions were studied using a transmission electron
microscope. To perform the TEM observations, 1 ml of the nano-emulsion was diluted to 100 ml
using distilled water and a drop of the resultant system was deposited on the film grid and
observed after drying. Figure 5 showing the droplets of nano-emulsion.
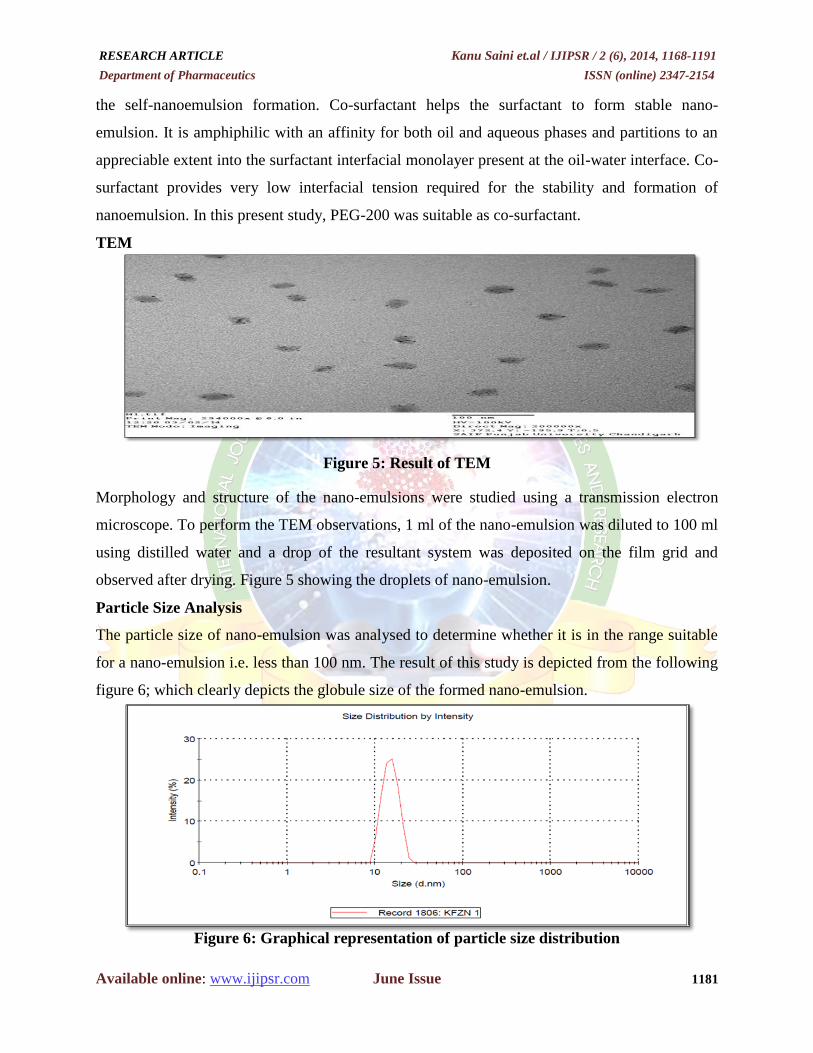
Particle Size Analysis
The particle size of nano-emulsion was analysed to determine whether it is in the range suitable
for a nano-emulsion i.e. less than 100 nm. The result of this study is depicted from the following
figure 6; which clearly depicts the globule size of the formed nano-emulsion.
Figure 6: Graphical representation of particle size distribution
RESEARCH ARTICLE Kanu Saini et.al / IJIPSR / 2 (6), 2014, 1168-1191
Department of Pharmaceutics ISSN (online) 2347-2154
Available online: www.ijipsr.com June Issue 1182
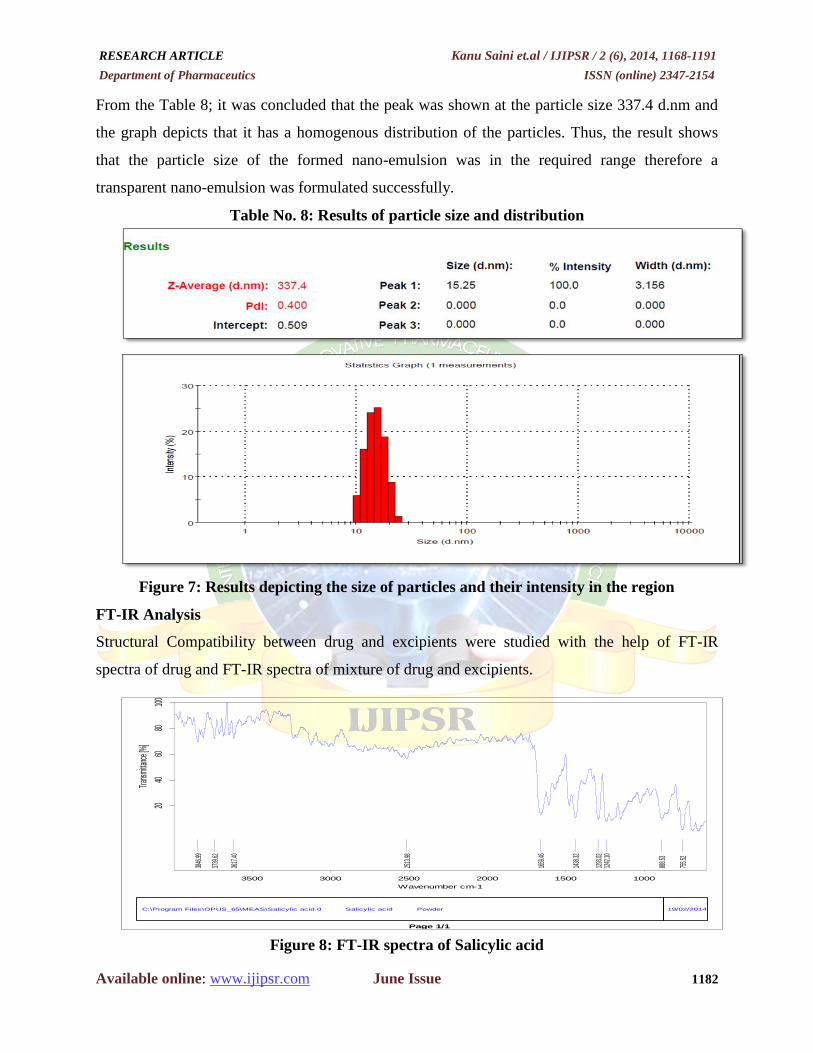
From the Table 8; it was concluded that the peak was shown at the particle size 337.4 d.nm and
the graph depicts that it has a homogenous distribution of the particles. Thus, the result shows
that the particle size of the formed nano-emulsion was in the required range therefore a
transparent nano-emulsion was formulated successfully.
Table No. 8: Results of particle size and distribution
Figure 7: Results depicting the size of particles and their intensity in the region
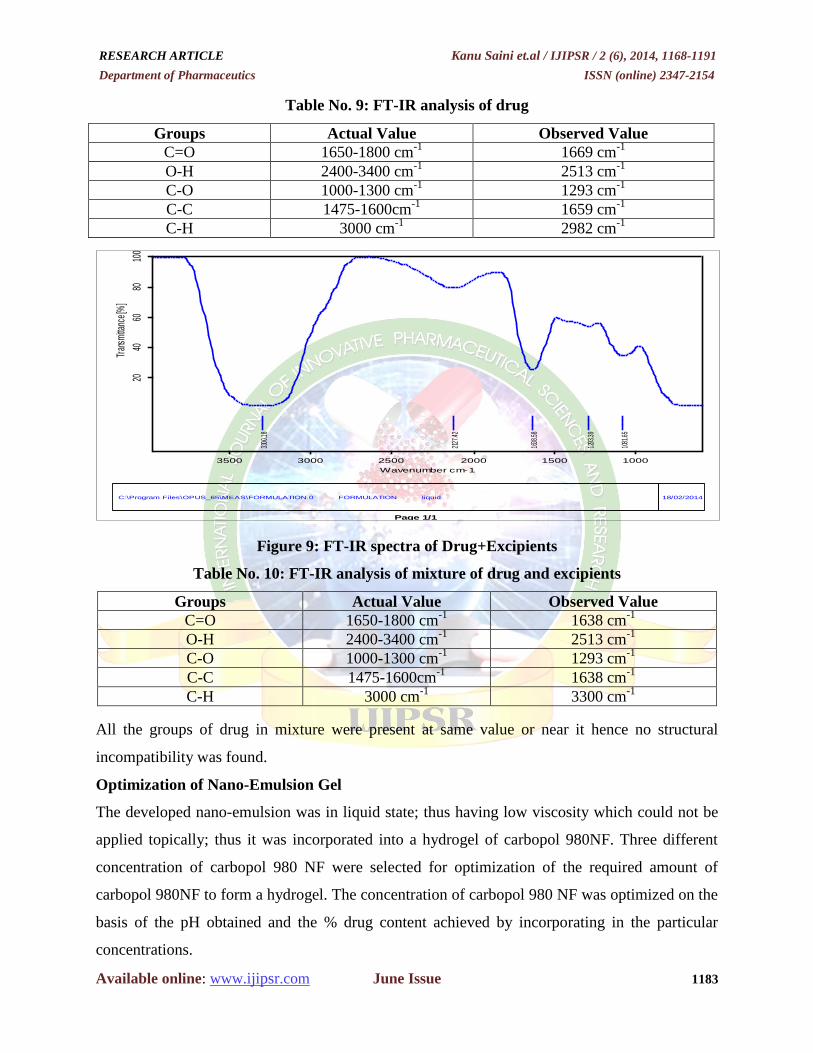
FT-IR Analysis
Structural Compatibility between drug and excipients were studied with the help of FT-IR
spectra of drug and FT-IR spectra of mixture of drug and excipients.
Figure 8: FT-IR spectra of Salicylic acid
C:\Program Files\OPUS_65\MEAS\Salicylic acid.0 Salicylic acid Powder 19/02/2014
3846
.99
3739
.62
3617
.40
2513
.98
1659
.46
1438
.32
1293
.0212
42.10
888.5
3
755.5
2
100015002000250030003500
Wavenumber cm-1
2040
6080
100
Tran
smitta
nce [
%]
Page 1/1
RESEARCH ARTICLE Kanu Saini et.al / IJIPSR / 2 (6), 2014, 1168-1191
Department of Pharmaceutics ISSN (online) 2347-2154
Available online: www.ijipsr.com June Issue 1183
Table No. 9: FT-IR analysis of drug
Figure 9: FT-IR spectra of Drug+Excipients
Table No. 10: FT-IR analysis of mixture of drug and excipients
Groups Actual Value Observed Value
C=O 1650-1800 cm-1
1638 cm-1
O-H 2400-3400 cm-1
2513 cm-1
C-O 1000-1300 cm-1
1293 cm-1
C-C 1475-1600cm-1
1638 cm-1
C-H 3000 cm-1
3300 cm-1
All the groups of drug in mixture were present at same value or near it hence no structural
incompatibility was found.
Optimization of Nano-Emulsion Gel
The developed nano-emulsion was in liquid state; thus having low viscosity which could not be
applied topically; thus it was incorporated into a hydrogel of carbopol 980NF. Three different
concentration of carbopol 980 NF were selected for optimization of the required amount of
carbopol 980NF to form a hydrogel. The concentration of carbopol 980 NF was optimized on the
basis of the pH obtained and the % drug content achieved by incorporating in the particular
concentrations.
Groups Actual Value Observed Value
C=O 1650-1800 cm-1
1669 cm-1
O-H 2400-3400 cm-1
2513 cm-1
C-O 1000-1300 cm-1
1293 cm-1
C-C 1475-1600cm-1
1659 cm-1
C-H 3000 cm-1
2982 cm-1
C:\Program Files\OPUS_65\MEAS\FORMULATION.0 FORMULATION liquid 18/02/2014
3300
.18
2127
.42
1638
.58
1293
.39
1081
.65
100015002000250030003500
Wavenumber cm-1
2040
6080
100
Tran
smitta
nce [
%]
Page 1/1
RESEARCH ARTICLE Kanu Saini et.al / IJIPSR / 2 (6), 2014, 1168-1191
Department of Pharmaceutics ISSN (online) 2347-2154
Available online: www.ijipsr.com June Issue 1184
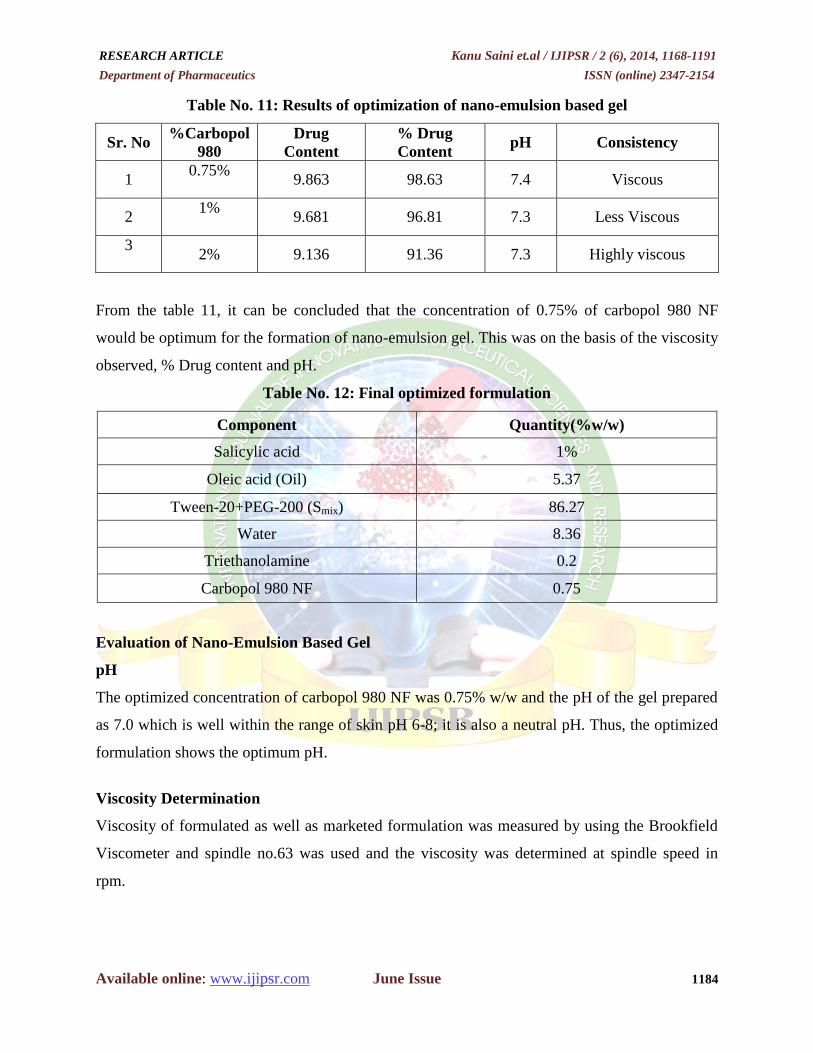
Table No. 11: Results of optimization of nano-emulsion based gel
Sr. No %Carbopol
980
Drug
Content
% Drug
Content pH Consistency
1 0.75%
9.863 98.63 7.4 Viscous
2 1%
9.681 96.81 7.3 Less Viscous
3
2% 9.136 91.36 7.3 Highly viscous
From the table 11, it can be concluded that the concentration of 0.75% of carbopol 980 NF
would be optimum for the formation of nano-emulsion gel. This was on the basis of the viscosity
observed, % Drug content and pH.
Table No. 12: Final optimized formulation
Component Quantity(%w/w)
Salicylic acid 1%
Oleic acid (Oil) 5.37
Tween-20+PEG-200 (Smix) 86.27
Water 8.36
Triethanolamine 0.2
Carbopol 980 NF 0.75
Evaluation of Nano-Emulsion Based Gel
pH
The optimized concentration of carbopol 980 NF was 0.75% w/w and the pH of the gel prepared
as 7.0 which is well within the range of skin pH 6-8; it is also a neutral pH. Thus, the optimized
formulation shows the optimum pH.
Viscosity Determination
Viscosity of formulated as well as marketed formulation was measured by using the Brookfield
Viscometer and spindle no.63 was used and the viscosity was determined at spindle speed in
rpm.
RESEARCH ARTICLE Kanu Saini et.al / IJIPSR / 2 (6), 2014, 1168-1191
Department of Pharmaceutics ISSN (online) 2347-2154
Available online: www.ijipsr.com June Issue 1185
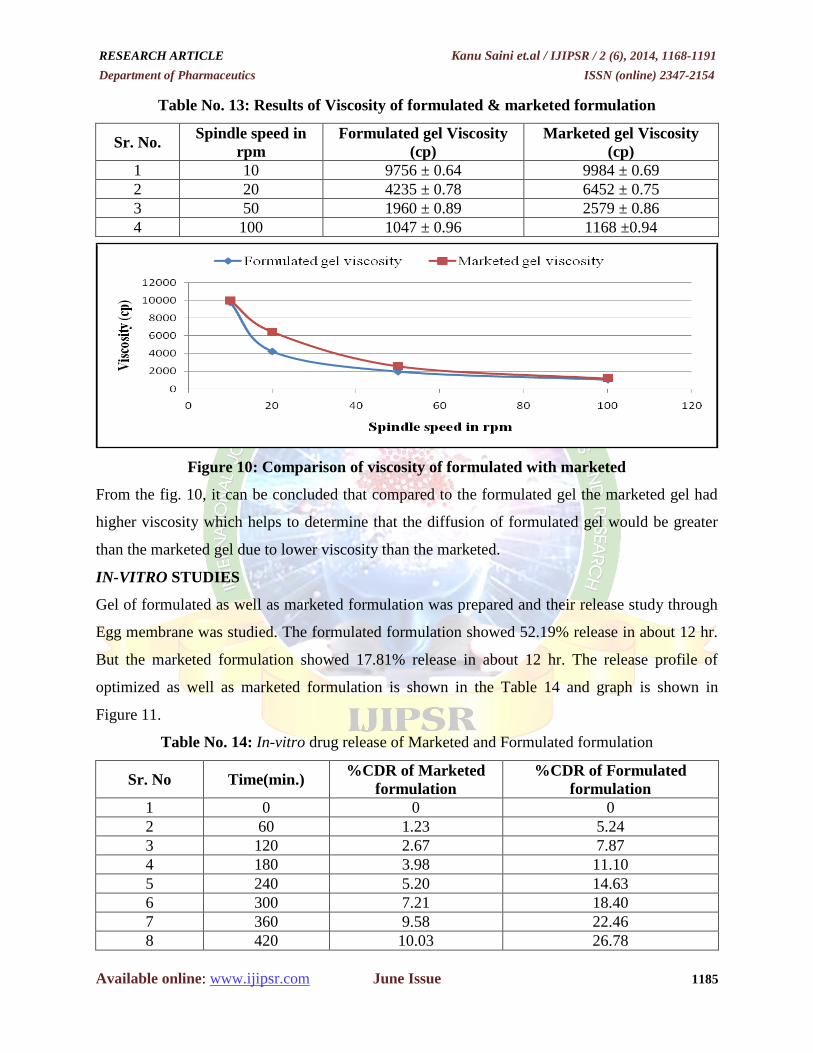
Table No. 13: Results of Viscosity of formulated & marketed formulation
Sr. No. Spindle speed in
rpm
Formulated gel Viscosity
(cp)
Marketed gel Viscosity
(cp)
1 10 9756 ± 0.64 9984 ± 0.69
2 20 4235 ± 0.78 6452 ± 0.75
3 50 1960 ± 0.89 2579 ± 0.86
4 100 1047 ± 0.96 1168 ±0.94
Figure 10: Comparison of viscosity of formulated with marketed
From the fig. 10, it can be concluded that compared to the formulated gel the marketed gel had
higher viscosity which helps to determine that the diffusion of formulated gel would be greater
than the marketed gel due to lower viscosity than the marketed.
IN-VITRO STUDIES
Gel of formulated as well as marketed formulation was prepared and their release study through
Egg membrane was studied. The formulated formulation showed 52.19% release in about 12 hr.
But the marketed formulation showed 17.81% release in about 12 hr. The release profile of
optimized as well as marketed formulation is shown in the Table 14 and graph is shown in
Figure 11.
Table No. 14: In-vitro drug release of Marketed and Formulated formulation
Sr. No Time(min.) %CDR of Marketed
formulation
%CDR of Formulated
formulation
1 0 0 0
2 60 1.23 5.24
3 120 2.67 7.87
4 180 3.98 11.10
5 240 5.20 14.63
6 300 7.21 18.40
7 360 9.58 22.46
8 420 10.03 26.78
RESEARCH ARTICLE Kanu Saini et.al / IJIPSR / 2 (6), 2014, 1168-1191
Department of Pharmaceutics ISSN (online) 2347-2154
Available online: www.ijipsr.com June Issue 1186
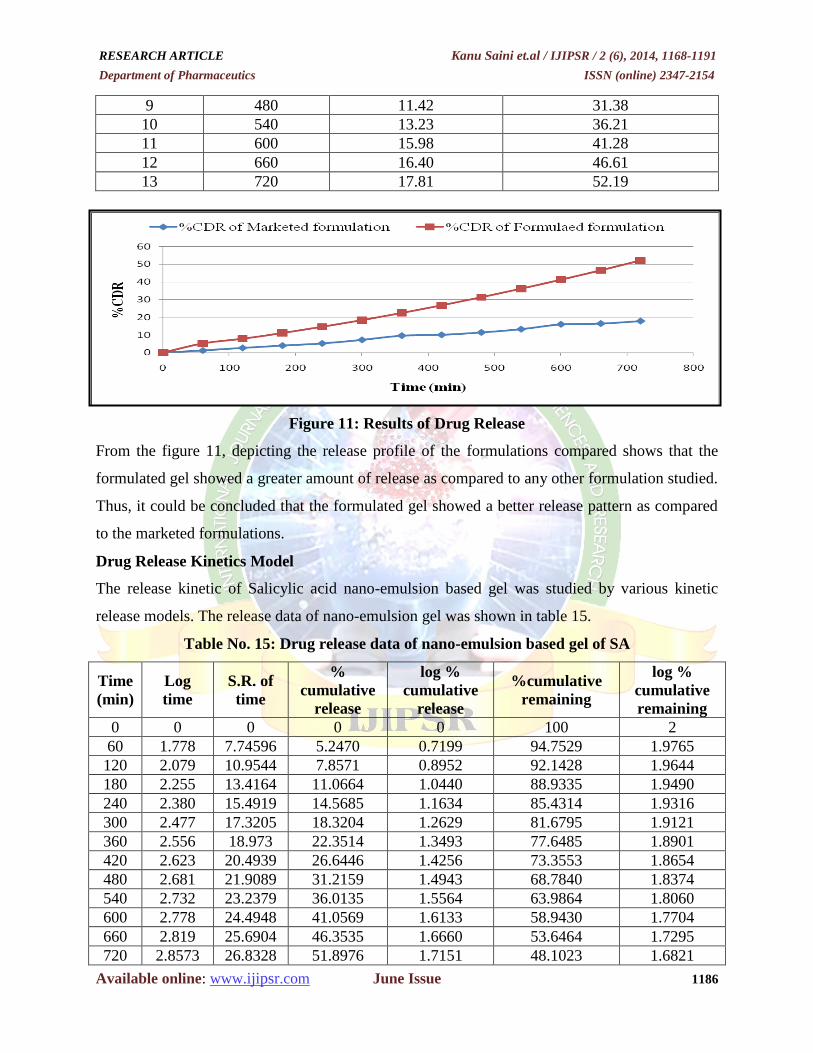
9 480 11.42 31.38
10 540 13.23 36.21
11 600 15.98 41.28
12 660 16.40 46.61
13 720 17.81 52.19
Figure 11: Results of Drug Release
From the figure 11, depicting the release profile of the formulations compared shows that the
formulated gel showed a greater amount of release as compared to any other formulation studied.
Thus, it could be concluded that the formulated gel showed a better release pattern as compared
to the marketed formulations.
Drug Release Kinetics Model
The release kinetic of Salicylic acid nano-emulsion based gel was studied by various kinetic
release models. The release data of nano-emulsion gel was shown in table 15.
Table No. 15: Drug release data of nano-emulsion based gel of SA
Time
(min)
Log
time
S.R. of
time
%
cumulative
release
log %
cumulative
release
%cumulative
remaining
log %
cumulative
remaining
0 0 0 0 0 100 2
60 1.778 7.74596 5.2470 0.7199 94.7529 1.9765
120 2.079 10.9544 7.8571 0.8952 92.1428 1.9644
180 2.255 13.4164 11.0664 1.0440 88.9335 1.9490
240 2.380 15.4919 14.5685 1.1634 85.4314 1.9316
300 2.477 17.3205 18.3204 1.2629 81.6795 1.9121
360 2.556 18.973 22.3514 1.3493 77.6485 1.8901
420 2.623 20.4939 26.6446 1.4256 73.3553 1.8654
480 2.681 21.9089 31.2159 1.4943 68.7840 1.8374
540 2.732 23.2379 36.0135 1.5564 63.9864 1.8060
600 2.778 24.4948 41.0569 1.6133 58.9430 1.7704
660 2.819 25.6904 46.3535 1.6660 53.6464 1.7295
720 2.8573 26.8328 51.8976 1.7151 48.1023 1.6821
RESEARCH ARTICLE Kanu Saini et.al / IJIPSR / 2 (6), 2014, 1168-1191
Department of Pharmaceutics ISSN (online) 2347-2154
Available online: www.ijipsr.com June Issue 1187
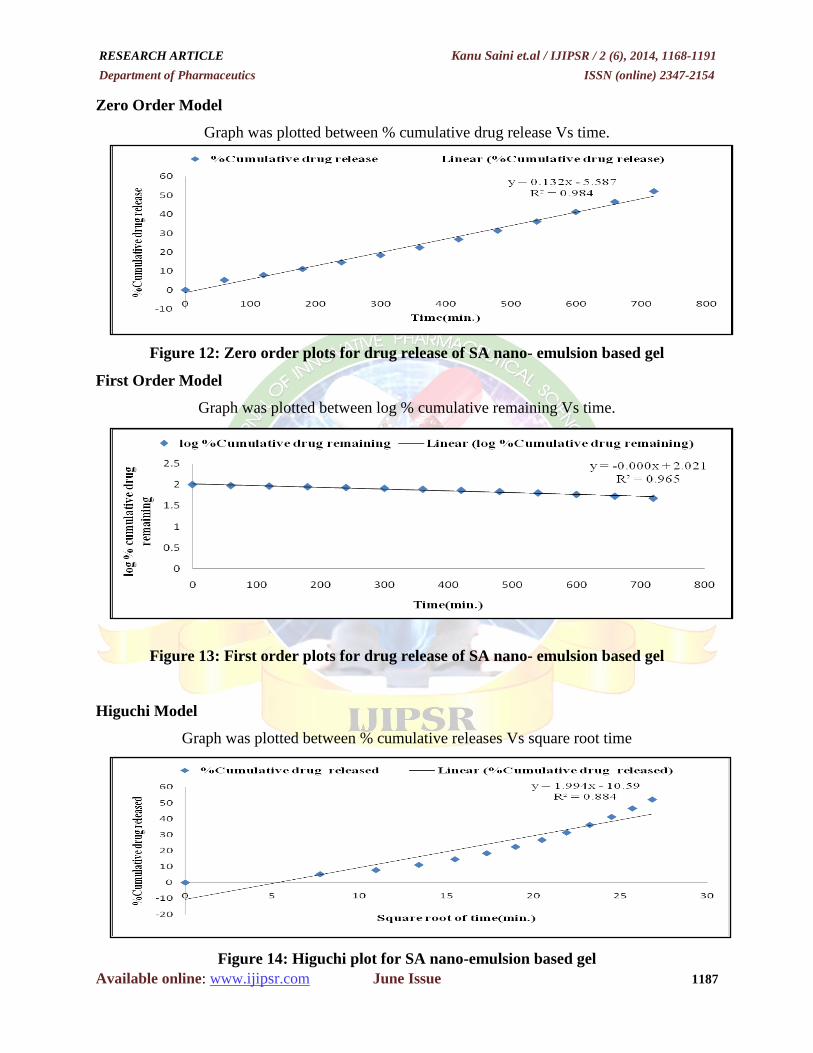
Zero Order Model
Graph was plotted between % cumulative drug release Vs time.
Figure 12: Zero order plots for drug release of SA nano- emulsion based gel
First Order Model
Graph was plotted between log % cumulative remaining Vs time.
Figure 13: First order plots for drug release of SA nano- emulsion based gel
Higuchi Model
Graph was plotted between % cumulative releases Vs square root time
Figure 14: Higuchi plot for SA nano-emulsion based gel
RESEARCH ARTICLE Kanu Saini et.al / IJIPSR / 2 (6), 2014, 1168-1191
Department of Pharmaceutics ISSN (online) 2347-2154
Available online: www.ijipsr.com June Issue 1188
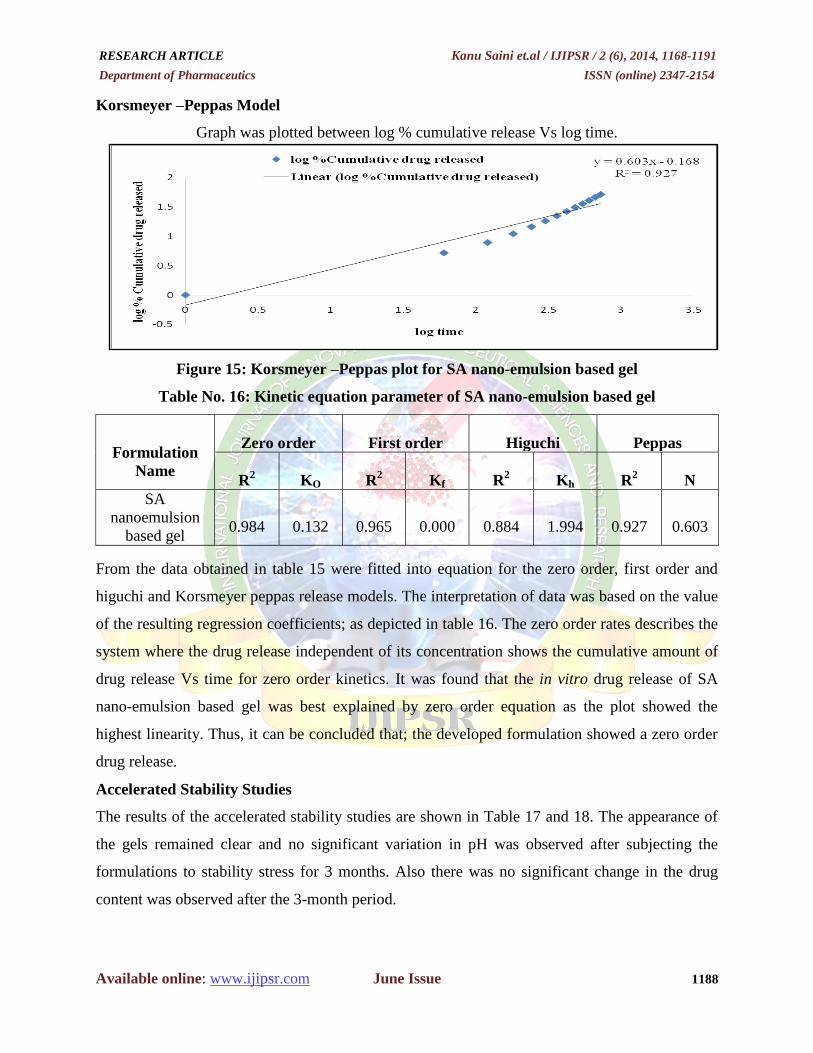
Korsmeyer –Peppas Model
Graph was plotted between log % cumulative release Vs log time.
Figure 15: Korsmeyer –Peppas plot for SA nano-emulsion based gel
Table No. 16: Kinetic equation parameter of SA nano-emulsion based gel
Formulation
Name
Zero order
First order
Higuchi
Peppas
R2
KO
R2
Kf
R2
Kh
R2
N
SA
nanoemulsion
based gel
0.984
0.132
0.965
0.000
0.884
1.994
0.927
0.603
From the data obtained in table 15 were fitted into equation for the zero order, first order and
higuchi and Korsmeyer peppas release models. The interpretation of data was based on the value
of the resulting regression coefficients; as depicted in table 16. The zero order rates describes the
system where the drug release independent of its concentration shows the cumulative amount of
drug release Vs time for zero order kinetics. It was found that the in vitro drug release of SA
nano-emulsion based gel was best explained by zero order equation as the plot showed the
highest linearity. Thus, it can be concluded that; the developed formulation showed a zero order
drug release.
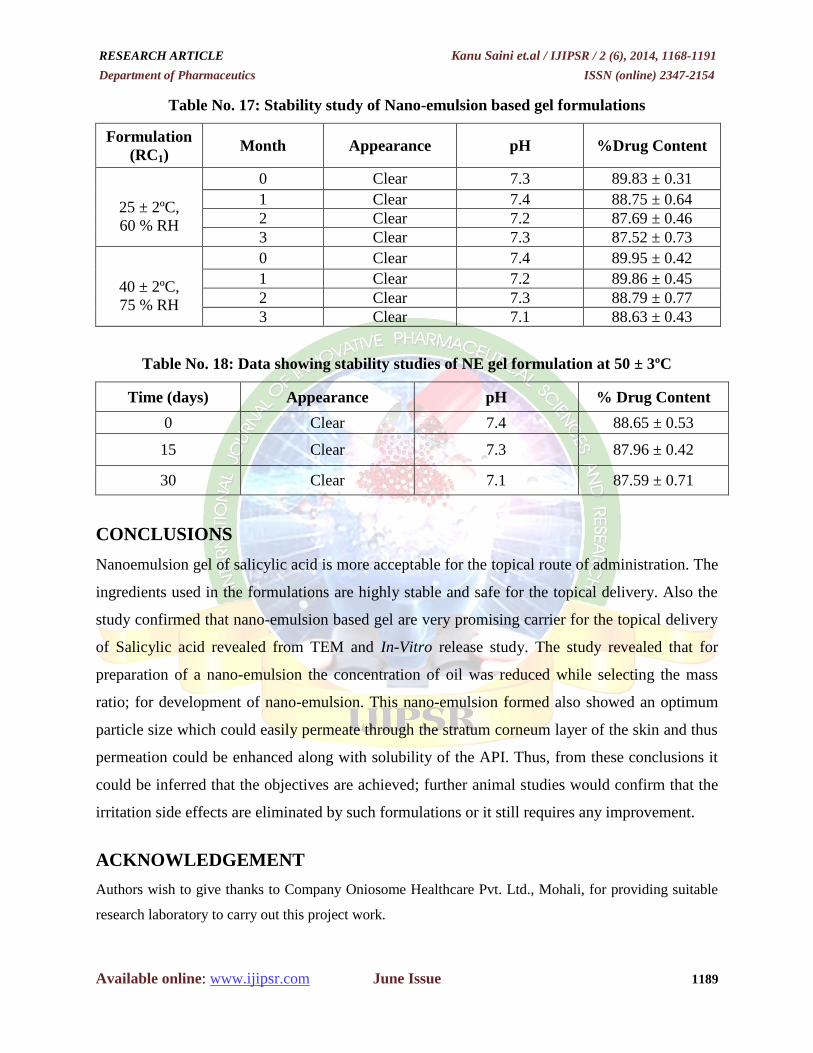
Accelerated Stability Studies
The results of the accelerated stability studies are shown in Table 17 and 18. The appearance of
the gels remained clear and no significant variation in pH was observed after subjecting the
formulations to stability stress for 3 months. Also there was no significant change in the drug
content was observed after the 3-month period.
RESEARCH ARTICLE Kanu Saini et.al / IJIPSR / 2 (6), 2014, 1168-1191
Department of Pharmaceutics ISSN (online) 2347-2154
Available online: www.ijipsr.com June Issue 1189
Table No. 17: Stability study of Nano-emulsion based gel formulations
Formulation
(RC1) Month Appearance pH %Drug Content
25 ± 2ºC,
60 % RH
0 Clear 7.3 89.83 ± 0.31
1 Clear 7.4 88.75 ± 0.64
2 Clear 7.2 87.69 ± 0.46
3 Clear 7.3 87.52 ± 0.73
40 ± 2ºC,
75 % RH
0 Clear 7.4 89.95 ± 0.42
1 Clear 7.2 89.86 ± 0.45
2 Clear 7.3 88.79 ± 0.77
3 Clear 7.1 88.63 ± 0.43
Table No. 18: Data showing stability studies of NE gel formulation at 50 ± 3ºC
Time (days) Appearance pH % Drug Content
0 Clear 7.4 88.65 ± 0.53
15 Clear 7.3 87.96 ± 0.42
30 Clear 7.1 87.59 ± 0.71
CONCLUSIONS
Nanoemulsion gel of salicylic acid is more acceptable for the topical route of administration. The
ingredients used in the formulations are highly stable and safe for the topical delivery. Also the
study confirmed that nano-emulsion based gel are very promising carrier for the topical delivery
of Salicylic acid revealed from TEM and In-Vitro release study. The study revealed that for
preparation of a nano-emulsion the concentration of oil was reduced while selecting the mass
ratio; for development of nano-emulsion. This nano-emulsion formed also showed an optimum
particle size which could easily permeate through the stratum corneum layer of the skin and thus
permeation could be enhanced along with solubility of the API. Thus, from these conclusions it
could be inferred that the objectives are achieved; further animal studies would confirm that the
irritation side effects are eliminated by such formulations or it still requires any improvement.
ACKNOWLEDGEMENT
Authors wish to give thanks to Company Oniosome Healthcare Pvt. Ltd., Mohali, for providing suitable
research laboratory to carry out this project work.
RESEARCH ARTICLE Kanu Saini et.al / IJIPSR / 2 (6), 2014, 1168-1191
Department of Pharmaceutics ISSN (online) 2347-2154
Available online: www.ijipsr.com June Issue 1190
REFERENCES
1. Jennings MB, Alfieri D, Ward K. Comparison of salicylic acid and urea versus
ammonium lactate for the treatment of foot xerosis: a randomized, double-blind, clinical
study. J Am Podiatr Med Assoc.1998; 88: 332-336.
2. Dayan N, Basak K. A delivery system for salicylic acid to overcome the drawbacks of its
use in topically applied formulas. Cos.Toiletr. Manuf. Worldwide 2003.
3. Espinoza R. inventor; Healthpoint, assignee. Multivesicular Emulsion Drug Delivery
System. US patent 2004; 6,709: 633.
4. Tadros T; in: P. Becher (Ed.), Encyclopedia of emulsion Technology, vol.1 Marcel
Deckker: New York1983;129-285.
5. Tadros T, Izquierdo P, Esquena J, Solans C. Formation and stability of nanoemulsions.
Adv in Coll and Int Sci.2004;108: 303-318.
6. Girad N, Tadros TF, Bailey AI. Original contribution: Styrene and methycrylate oil-in-
water microemulsion. Colloid Poly Sci.1997; 175: 698-704.
7. Bora DK, Borude P, Bhise K. Formulation and Evaluation of Self microemulsifying drug
delivery system of low solubility drug for enhanced solubility and dissolution. Asian J
Biomed. Pharm. Sci.2012; 2(15): 7-14.
8. Modi JD, Patel JK. Nanoemulsion-Based Gel Formulation of Aceclofenac for Topical
Delivery. Int.J.P.Pharm.Sci.Res.2011; 1(1): 6-12.
9. Chen Huabing, Chang Xueling, Weng Ting, Zhao Xiaozhi, Gao Zhonghong. A study of
microemulsion systems for transdermal delivery of triptolide. J. Cont. Rel.2004; 98: 427–
436.
10. Eman A, Albert AB. Formulation and in vitro and in vivo characterization of a phenytoin
self-emulsifying drug delivery system, Euro.J.Pharm.Sci.2008; 35: 257–263.
11. Kim JY, Young SK. Enhanced absorption of Indomethacin after oral or rectal
administration of Self emulsifying system containing Indomethacin torats,
Int.J.Pharm.2000; 194: 81- 89.
12. Charman SA, Charman WN, Rogge MC, Wilson TD, Pouton CW. Selfemulsifying drug
delivery systems: formulation and biopharmaceutical evaluation of an investigational
lipophilic compound. Pharm Res.1992; 9: 87-93.
RESEARCH ARTICLE Kanu Saini et.al / IJIPSR / 2 (6), 2014, 1168-1191
Department of Pharmaceutics ISSN (online) 2347-2154
Available online: www.ijipsr.com June Issue 1191
13. Patil P, Joshi P, Paradkar A. Effect of formulation variables on preparation and
evaluation of gelled self-emulsifying drug delivery system of ketoprofen. AAPS
Pharm.Sci.Tech.2004; 5(3): E 42.
14. Nazzal S, Nutan M, Palamakula A, Shah R, Zaghloul AA, Khan MA. Optimization of
self-nanoemulsified tablet dosage form of ubiquinone using response surface
methodology: effect of formulation ingredients. Int. J. Pharm.2002; 240: 103-114.
15. Dash Suvakanta, Murthy PN, Nath LK, Chowdhury P. Kinetic modeling on drug release
from controlled drug delivery systems. Acta Poloniae Pharmaceutica- Drug Research
210; 67: 217-223.


![Pterodon emarginatus oleoresin-based nanoemulsion as a promising tool … · 2017. 4. 11. · and its terpenoids against Aedes aegypti [3334, ], a prom-ising larvicidal nanoemulsion](https://img.dokumen.tips/doc/110x75/5fe19409c8d55a722c527079/pterodon-emarginatus-oleoresin-based-nanoemulsion-as-a-promising-tool-2017-4-11.jpg)