Embed Size (px)
Citation preview

3303
www.ijifr.com Copyright © IJIFR 2015
Original Paper
International Journal of Informative & Futuristic Research ISSN (Online): 2347-1697
Volume 2 Issue 9 May 2015
Abstract Artificial neural networks (ANN) are biologically inspired i.e., they are composed of elements that perform in a manner that is analogous to the most elementary function of the biological neuron. These elements are then organized in a way that may be related to the anatomy of the brain. Despite this superficial resemblance ANNs exhibit a surprising number of the brains characteristics. An ANN is also called a simulated neural network, which is an interconnected group of artificial neurons that uses a mathematical or computational model for information processing based on a connectionist approach to computation. In most cases ANN is an adaptive system that changes its structure based on external or internal information that flows through the network. In this context using artificial neural network (ANN) from Mat Lab software, the results are predicted by using experimental data and also the properties of materials. Here to prepare the ANN models with different input neurons and also provide different data for training depending upon these properties will get the particular graphs and regression models. The network used in the present study is 2-10-2 architecture model. It consists of an input layer having 2 neurons, one hidden layer with arbitrary neurons and an output layer with 2 neurons. Two input neurons take two input data: % of polymer and % of silica fume. Similarly, 2 outputs: compressive strength and split tensile strength. The data for the training of ANN are divided into two parts. One set of parameters is known as training data which are used for learning or training of ANN whereas second part of data known as test data, are used for testing of the extent of learning of the network while the network is being trained. In the present study, 50 % of the data is used for training and the remaining 50 % of the data is used for testing.
Performance Comparison of experimental
Analysis through ANN for Different Hidden
Neuron with MSE goal and epochs Paper ID IJIFR/ V2/ E9/ 064 Page No. 3303-3317 Subject Area
Structure
Engineering
Key Words Matlab Software, Polymer Modified Silica Fume Concrete, Polymer,
Compressive Strength, Split Tensile Strength, Artificial Neural Network
Satalingappa P. Deshamukh1
Assistant Professor Department Of Civil Engineering Dr. J. J. Magdum College Of Engineering And Technology, Jayasingpur-Maharashtra
Vinayak B.K 2
Assistant Professor Department Of Civil Engineering D.Y.Patil College Of Engineering And Technology Akrudi - Pune

3304
ISSN (Online): 2347-1697 International Journal of Informative & Futuristic Research (IJIFR)
Volume - 2, Issue - 9, May 2015 21st Edition, Page No: 3303-3317
S. P. Deshamukh,Vinayak B.K :: Performance Comparison of experimental Analysis through ANN for Different Hidden Neuron with MSE goal and epochs
1. Introduction
Artificial neural networks (ANN) are biologically inspired i.e., they are composed of elements that
perform in a manner that is analogous to the most elementary function of the biological neuron.
These elements are then organized in a way that may be related to the anatomy of the brain. Despite
this superficial resemblance ANNs exhibit a surprising number of the brains characteristics. An
ANN is also called a simulated neural network, which is an interconnected group of artificial
neurons that uses a mathematical or computational model for information processing based on a
connectionist approach to computation. In most cases ANN is an adaptive system that changes its
structure based on external or internal information that flows through the network. These
biologically inspired methods of computing are thought to be the next major advancement in the
computing industry (Haykins, 1999). Even simple animal brains are capable of functions that are
currently impossible for computers. Computers do things well, like keeping ledgers or performing
complex mathematics. But computers have trouble in recognizing even simple patterns much less
generalizing those patterns of the past into actions of the future.
2. Materials and Methodology
2.1 Materials Used
Cement
In this experiment 43 grade ordinary portland cement (OPC) with brand name Vijay Shakti was used
for all concrete mixes. The cement used was fresh and without any lumps. The testing of cement was
done as per IS:8112-1989. The specific gravity of cement was found to be 3.15. The physical
properties of cement used are as given in table 1.
Table 1: Physical properties of cement
Particulars Experimental Result As Per Standard
1.Fineness 268 m2/kg 225 m
2/kg
2.Soundness
a) By Le Chatelier mould 1.00 mm 10 mm
b) By Autoclave 0.16 0.8 maximum
3.Setting time (minutes)
a) Initial set 200 minutes 30 minutes minimum
b) Final set 270 minutes 600 minutes maximum
4.Comp strength (M Pa)
a) 3 days 34 23 MPa
b) 7 days 44 33 MPa
c) 28 days 58 43 MPa
Temperature during testing 27.810 C 27° C 2%
Fine Aggregate
The sand used for the experimental program was locally procured and was confirming to zone-II.
The specific gravity of fine aggregate was found to be 2.62.
Coarse Aggregate

3305
ISSN (Online): 2347-1697 International Journal of Informative & Futuristic Research (IJIFR)
Volume - 2, Issue - 9, May 2015 21st Edition, Page No: 3303-3317
S. P. Deshamukh,Vinayak B.K :: Performance Comparison of experimental Analysis through ANN for Different Hidden Neuron with MSE goal and epochs
Locally available coarse aggregate having the maximum size of 10 mm were used in the present
work. The specific gravity of coarse aggregate was found to be 2.89.
SBR latex
The polymer used in the experimentation was Styrene Butadiene Rubber Latex. It is manufactured by Pidilite
Construction Chemicals Division. The properties of SBR latex are summarized below in the table 2. The
dosages of SBR latex adopted in the experimentation are 0%, 1%, 2%, 3%, 4%, 5%, 6%, 7% and 8%.
Table 2: Properties of SBR latex
Property Description
Type Styrene Butadiene Polymer (SBR) liquid.
Colour White
Specific gravity 1.02 + 0.02
Solid content 44+1%
Silica fume
The silica fume used in the experimentation was obtained from Elkem laboratory, Navi
Mumbai.10% & 15% of cement by its weight is replaced by silica fume in all the mixes. The
chemical composition of silica fume is shown in table 3.
Table 3: Chemical composition of silica fume
Chemical composition Percentages
Silica (SiO2) 89
Alumina (Al2O3) 0.50
Iron oxide (Fe2O3) 2.50
Alkalies (Na2o+K2O) 1.20
Calcium oxide (CaO) 0.50
Magnesium oxide (Mgo)
0.60
Water
Portable tap water was used for the preparation of specimens and for the curing of specimens.
Superplasticizer
To induce workability Conplast 430 Superplasticizer was used.
ANN Model
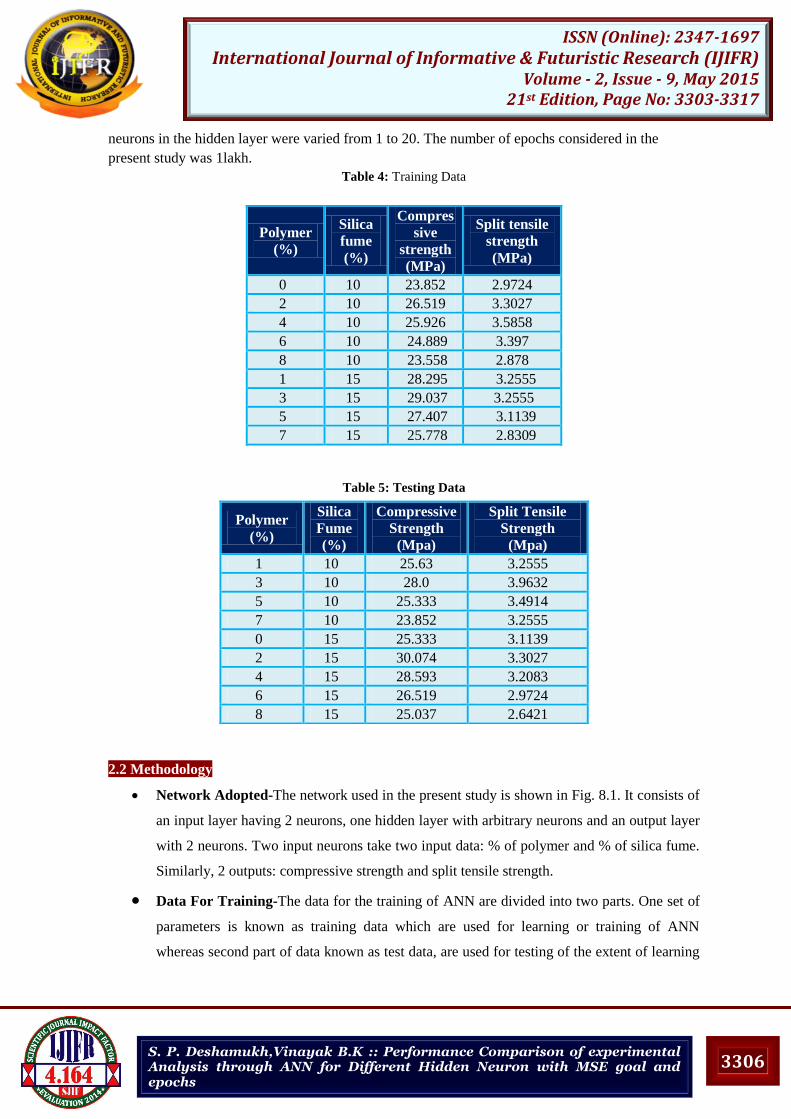
The experimental data of the tests conducted on PMSF Concrete are used for the analysis. Out of 18
experimental data, 9 data are used for training as given in Table 4 and remaining 9 data are used for
testing as given in Table 5. The dependency of strength parameters of PMSFC on various parameters
is given as
)( , fp SPfS
Where S = Strength parameters; Pp = % of polymer; Sf = % of silica fume.
The neural network was trained with an MSE goal level of 10-3
. The training parameters,
such as learning rate and momentum constant, were kept constant at 0.5 and 0.85. The numbers of
3306
ISSN (Online): 2347-1697 International Journal of Informative & Futuristic Research (IJIFR)
Volume - 2, Issue - 9, May 2015 21st Edition, Page No: 3303-3317
S. P. Deshamukh,Vinayak B.K :: Performance Comparison of experimental Analysis through ANN for Different Hidden Neuron with MSE goal and epochs
neurons in the hidden layer were varied from 1 to 20. The number of epochs considered in the
present study was 1lakh.
Table 4: Training Data
Polymer
(%)
Silica
fume
(%)
Compres
sive
strength
(MPa)
Split tensile
strength
(MPa)
0 10 23.852 2.9724
2 10 26.519 3.3027
4 10 25.926 3.5858
6 10 24.889 3.397
8 10 23.558 2.878
1 15 28.295 3.2555
3 15 29.037 3.2555
5 15 27.407 3.1139
7 15 25.778 2.8309
Table 5: Testing Data
2.2 Methodology
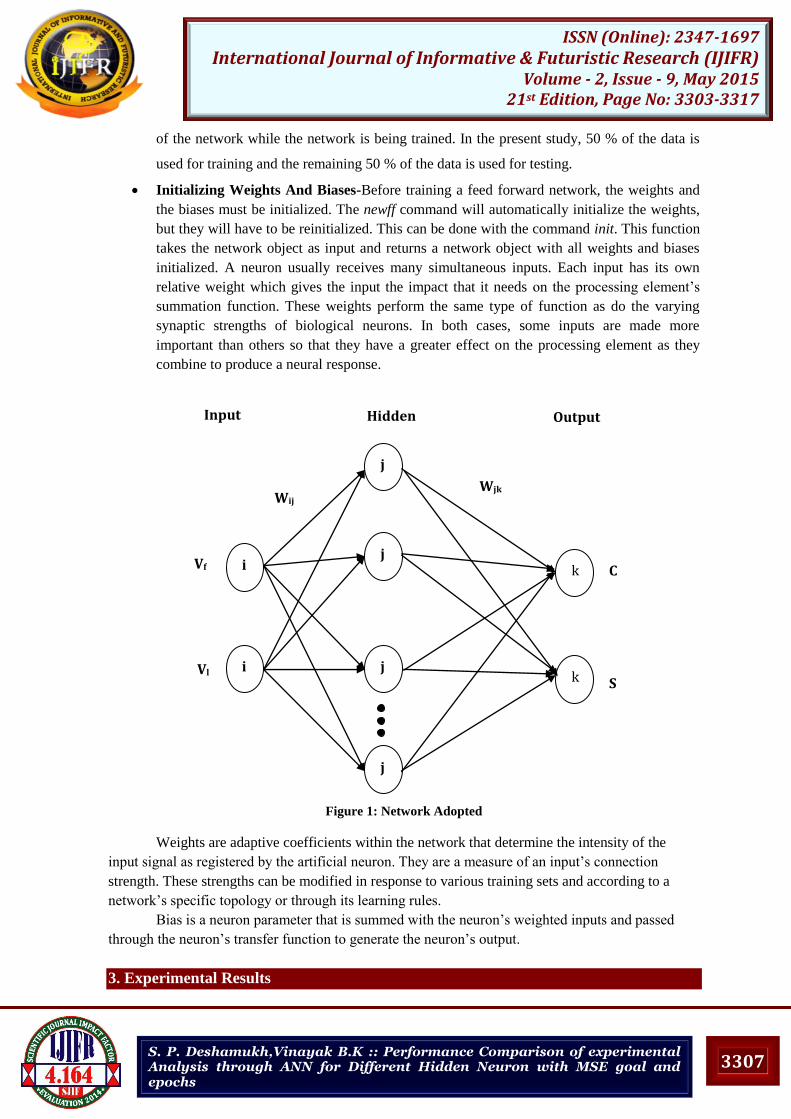
Network Adopted-The network used in the present study is shown in Fig. 8.1. It consists of
an input layer having 2 neurons, one hidden layer with arbitrary neurons and an output layer
with 2 neurons. Two input neurons take two input data: % of polymer and % of silica fume.
Similarly, 2 outputs: compressive strength and split tensile strength.
Data For Training-The data for the training of ANN are divided into two parts. One set of
parameters is known as training data which are used for learning or training of ANN
whereas second part of data known as test data, are used for testing of the extent of learning
Polymer
(%)
Silica
Fume
(%)
Compressive
Strength
(Mpa)
Split Tensile
Strength
(Mpa)
1 10 25.63 3.2555
3 10 28.0 3.9632
5 10 25.333 3.4914
7 10 23.852 3.2555
0 15 25.333 3.1139
2 15 30.074 3.3027
4 15 28.593 3.2083
6 15 26.519 2.9724
8 15 25.037 2.6421
3307
ISSN (Online): 2347-1697 International Journal of Informative & Futuristic Research (IJIFR)
Volume - 2, Issue - 9, May 2015 21st Edition, Page No: 3303-3317
S. P. Deshamukh,Vinayak B.K :: Performance Comparison of experimental Analysis through ANN for Different Hidden Neuron with MSE goal and epochs
of the network while the network is being trained. In the present study, 50 % of the data is
used for training and the remaining 50 % of the data is used for testing.
Initializing Weights And Biases-Before training a feed forward network, the weights and
the biases must be initialized. The newff command will automatically initialize the weights,
but they will have to be reinitialized. This can be done with the command init. This function
takes the network object as input and returns a network object with all weights and biases
initialized. A neuron usually receives many simultaneous inputs. Each input has its own
relative weight which gives the input the impact that it needs on the processing element’s
summation function. These weights perform the same type of function as do the varying
synaptic strengths of biological neurons. In both cases, some inputs are made more
important than others so that they have a greater effect on the processing element as they
combine to produce a neural response.
Figure 1: Network Adopted
Weights are adaptive coefficients within the network that determine the intensity of the
input signal as registered by the artificial neuron. They are a measure of an input’s connection
strength. These strengths can be modified in response to various training sets and according to a
network’s specific topology or through its learning rules.
Bias is a neuron parameter that is summed with the neuron’s weighted inputs and passed
through the neuron’s transfer function to generate the neuron’s output.
3. Experimental Results
i
1
i
2
j
n
j
3
j
2
j
1
k
2
k
1
Input Hidden Output
Wij Wjk
Vf
Vl
C
S

3308
ISSN (Online): 2347-1697 International Journal of Informative & Futuristic Research (IJIFR)
Volume - 2, Issue - 9, May 2015 21st Edition, Page No: 3303-3317
S. P. Deshamukh,Vinayak B.K :: Performance Comparison of experimental Analysis through ANN for Different Hidden Neuron with MSE goal and epochs
The actual MSE goal reached, the corresponding number of epochs taken to reach these goals and
correlation coefficient for each runs are furnished in Table 6
Table 6: Performance of ANN for Different Hidden Neuron with MSE goal and epochs
Neurons MSE Goal (10-3
) Epochs Correlation
coefficient
1 0.404906 6 -1.9722e-031
2 0.108294 8373 0.76254
3 0.00117714 100000 0.99941
4 0.00217825 94081 0.99982
5 0.000852298 39 0.99853
6 0.000836753 28 0.99894
7 0.000686066 12 0.99916
8 0.000324886 5 0.99981
9 0.000631713 94 0.99957
10 0.000119466 4 0.99987
11 0.000633382 8 0.99941
12 7.1982e-005 4 0.99993
13 0.00038711 3 0.99929
14 0.00041785 3 0.99977
15 1.30314e-006 3 1.0
16 2.06564e-005 5 0.99998
17 6.32711e-005 3 1.0
18 6.05744e-007 3 1.0
19 6.40978e-005 2 0.99987
20 4.42904e-005 2 0.99999
From Table 6, the optimum number of neurons in the hidden layer with the MSE level of 10-3
,
considering both performance level and correlation coefficient, is 10.
Figure 1 shows the performance goals reached by the network during training. The number
of epochs for this network with the MSE levels of 10-3
is 10. The goal is reached within short
number of epochs indicating the good training pattern of the considered architecture.
Further, the regression graph, showing the comparison of strength parameters (i.e.,
compressive strength and split tensile strength) during testing is depicted in Figure 2. From Figure2
it can be observed that the comparison between the predicted data and experimental data is very
promising with the MSE goal level of 10-3
having 10 neurons in the hidden layer giving regression
coefficient of 0.99987 and performance level of 0.000119466 with 4 epochs.
The error graphs for training and testing for the optimum number of neurons in the hidden
layer are presented in Figure 4 and 5 respectively. The comparison between the target data and the
predicted data from ANN during training are shown in Figure 5. These figures show the good
training pattern of the network. Similarly the comparison of strength parameters during testing is
shown in Figure 6.
The plots of comparison of experimental values with predicted values for the training and
testing pattern are shown in Figure 7 and Figure 8 respectively. The graph in Figure 9 shows the
comparison between Experimental and Predicted values for total data.

3309
ISSN (Online): 2347-1697 International Journal of Informative & Futuristic Research (IJIFR)
Volume - 2, Issue - 9, May 2015 21st Edition, Page No: 3303-3317
S. P. Deshamukh,Vinayak B.K :: Performance Comparison of experimental Analysis through ANN for Different Hidden Neuron with MSE goal and epochs
The co-relation co-efficient and standard error between experimental and ANN model
values for training, testing and the total data are presented in the Table 6
Table 6: Correlation co-efficient and standard error
4. Regression Model
Using the total experimental data, the Regression models are obtained and the equations for
various strength parameters are as follows:
1972.00576.0427.17 yxC
(1)
241.00598.036.6 yxS
(2)
where, C = Compressive strength; S = Split tensile strength; x = % of polymer; y = % of silica fume.
Compressive strength and split tensile strength of all the specimens are also computed by
substituting various % of polymer ( ) and % of silica fume ( ) in the regression equations (1) and
(2) respectively. The values so obtained are compared with the experimental and ANN model values
and the following graphs are plotted.
The comparison of values obtained from regression model and the experimental values are
shown in Figure 10. The comparison of values obtained from regression model and the ANN model
are shown in Figure 11.
The correlation coefficient and standard error between experimental and regression model
values are presented in the Table 7.
Table 7: Correlation coefficient and Standard Error
Correlation
coefficient
Standard
error
Compressive
strength 0.797 0.934
Training data Testing data Total data
Co
rrel
ati
on
coef
fici
ent
Sta
nd
ard
erro
r
Co
rrel
ati
on
coef
fici
ent
Sta
nd
ard
erro
r
Co
rrel
ati
on
coef
fici
ent
Sta
nd
ard
erro
r
Compressive
strength 0.999 0.0146 0.789 1.315 0.893 0.880
Split tensile
strength 0.999 0.0043 0.781 0.241 0.849 0.165

3310
ISSN (Online): 2347-1697 International Journal of Informative & Futuristic Research (IJIFR)
Volume - 2, Issue - 9, May 2015 21st Edition, Page No: 3303-3317
S. P. Deshamukh,Vinayak B.K :: Performance Comparison of experimental Analysis through ANN for Different Hidden Neuron with MSE goal and epochs
Split tensile
strength 0.639 0.167
Figure 1: Performance graph for training for MSE goal of 10-3
with 10 neurons in hidden layer

3311
ISSN (Online): 2347-1697 International Journal of Informative & Futuristic Research (IJIFR)
Volume - 2, Issue - 9, May 2015 21st Edition, Page No: 3303-3317
S. P. Deshamukh,Vinayak B.K :: Performance Comparison of experimental Analysis through ANN for Different Hidden Neuron with MSE goal and epochs
Figure 3: Regression graph showing comparison between experimental data and ANN values for
testing: for MSE goal of 10-3
with 10 neurons in hidden layer
(a)

3312
ISSN (Online): 2347-1697 International Journal of Informative & Futuristic Research (IJIFR)
Volume - 2, Issue - 9, May 2015 21st Edition, Page No: 3303-3317
S. P. Deshamukh,Vinayak B.K :: Performance Comparison of experimental Analysis through ANN for Different Hidden Neuron with MSE goal and epochs
(b)
Figure 4: Error graph for training: (a) Compressive strength; (b) Split tensile strength
(a)
(b)

3313
ISSN (Online): 2347-1697 International Journal of Informative & Futuristic Research (IJIFR)
Volume - 2, Issue - 9, May 2015 21st Edition, Page No: 3303-3317
S. P. Deshamukh,Vinayak B.K :: Performance Comparison of experimental Analysis through ANN for Different Hidden Neuron with MSE goal and epochs
Figure 5: Error graph for testing: (a) Compressive strength; (b) Split tensile strength
(a)
(b)
Figure 6: Comparison of strength parameters for the training pattern: (a) Compressive strength; (b)
Split tensile strength
(a)

3314
ISSN (Online): 2347-1697 International Journal of Informative & Futuristic Research (IJIFR)
Volume - 2, Issue - 9, May 2015 21st Edition, Page No: 3303-3317
S. P. Deshamukh,Vinayak B.K :: Performance Comparison of experimental Analysis through ANN for Different Hidden Neuron with MSE goal and epochs
(b)
Figure 7: Comparison of strength parameters for the testing pattern: (a) Compressive strength; (b) Split
tensile strength
(a)

3315
ISSN (Online): 2347-1697 International Journal of Informative & Futuristic Research (IJIFR)
Volume - 2, Issue - 9, May 2015 21st Edition, Page No: 3303-3317
S. P. Deshamukh,Vinayak B.K :: Performance Comparison of experimental Analysis through ANN for Different Hidden Neuron with MSE goal and epochs
(b)
Figure 8: Comparison of experimental values with predicted values for the training pattern: (a)
Compressive strength; (b) Split tensile strength
(a)
Total data
15
20
25
30
35
15 20 25 30 35
Experimental compressive strength
Pred
icte
d c
ompr
essi
ve s
tren
gth

3316
ISSN (Online): 2347-1697 International Journal of Informative & Futuristic Research (IJIFR)
Volume - 2, Issue - 9, May 2015 21st Edition, Page No: 3303-3317
S. P. Deshamukh,Vinayak B.K :: Performance Comparison of experimental Analysis through ANN for Different Hidden Neuron with MSE goal and epochs
(b)
Figure 9: Comparison of experimental values with predicted values:(a) Compressive strength; (b) Split
tensile strength
(a)
(b)
Figure 10: Comparison of regression model values and experimental values (a) Compressive strength;
(b) Split tensile strength
Total data
0
1
2
3
4
5
0 1 2 3 4 5
Experimental split tensile strength
Pre
dic
ted
sp
lit t
ensi
le s
tren
gth

3317
ISSN (Online): 2347-1697 International Journal of Informative & Futuristic Research (IJIFR)
Volume - 2, Issue - 9, May 2015 21st Edition, Page No: 3303-3317
S. P. Deshamukh,Vinayak B.K :: Performance Comparison of experimental Analysis through ANN for Different Hidden Neuron with MSE goal and epochs
Figure 11: Comparison of regression model values and ANN model values (a) Compressive strength; (b)
Split tensile strength
5. Conclusion
The ANN model with 2-10-2 architecture is found to predict the strength properties of PMSFC
promisingly. The comparisons show that ANN can suitably be used for such predictions.
Also, the regression models are developed to compute the strength parameters of PMSFC. The
results of the regression equations compared with ANN model are found to be satisfactory.
ANN models with 2 hidden layers of neurons can be tried to further improve the results.
Other soft computing tools such as Genetic algorithm (GA), Fuzzy logic (FL) and Machine
learning (ML) can be used to compare the ANN results.
References
[1] Chapman, S. J. (2002), MATLAB programming for engineers, Thomson learning, Singapore.
[2] Fausett, L (1994). Fundamentals of neural networks, prentice Hall, Englewood Cliffs, N. J.
[3] Haykin, S. (1999). Neural networks: a comprehensive foundation, MacMillan, New York.
[4] MATLAB manual.
Split tensile strength
0
1
2
3
4
5
0 1 2 3 4 5
ANN Model values
Reg
ress
ion
mod
el v
alue
s

![Untitled-2 [sitcoe.ac.in]sitcoe.ac.in/images/2018-19-VOLUME-4-ISSUE-1.pdfAishwarya Mahaveer Patil,Rutuja Pramod Magdum, Supriya Praddep Magdum, Rakshanda Annaso Chougule Mr.M.H.Mota](https://img.dokumen.tips/doc/110x75/5e69c617439dd945677034d9/untitled-2-aishwarya-mahaveer-patilrutuja-pramod-magdum-supriya-praddep-magdum.jpg)