Embed Size (px)
Citation preview

International Journal of Fisheries and AquacultureVolume 7 Number 6 June 2015
ISSN 2006-9839

ABOUT IJFA The International Journal of Fisheries and Aquaculture (IJFA) (ISSN: 2006-9839) is an open access journal that
provides rapid publication (monthly) of articles in all areas of the subject such as algaculture, Mariculture,
fishery in terms of ecosystem health, Fisheries acoustics etc.
The Journal welcomes the submission of manuscripts that meet the general criteria of significance and
scientific excellence. Papers will be published shortly after acceptance. All articles published in the IJFA are
peer-reviewed.
Contact Us
Editorial Office: [email protected]
Help Desk: [email protected]
Website: http://www.academicjournals.org/journal/IJFA
Submit manuscript online http://ms.academicjournals.me/

Editors
Prof. Ashraf Mohamed Abd El-Samee Goda Dr. Kostas Kapiris
Fish Nutrition Research Laboratory, Institute of Marine Biological
National Institute of Oceanography and Resources of H.C.M.R.,
Fisheries (NIOF), Cairo, Athens, Hellas
Egypt. Greece.
Prof. Upali S. Amarasinghe Dr. Masoud Hedayatifard
Department of Zoology, Department of Fisheries Sciences and Aquaculture
University of Kelaniya, College of Agriculture and Natural Resources
Kelaniya 11600, Sri Lanka. Advanced Education Center
Sri Lanka. Islamic Azad University, Ghaemshahr,
PO Box: 163,
Iran.
Dr. V.S. Chandrasekaran
Central Institute of Brackishwater Aquaculture
(ICAR) Dr. Zhang Xiaoshuan
75, Santhome High Road, R.A.Puram 209#, China Agricultural University(East campus),
Chennai-600028, No.17 Qinghua Donglu,
India. Beijing, China
Dr Joseph Selvin
Prof. Nihar Rajan Chattopadhyay Marine Bioprospecting Lab
Department of aquaculture, Dept of Microbiology
Faculty of Fishery Sciences, Bharathidasan University
West Bengal University of Animal & Fishery Tiruchirappalli 620 024
Sciences, India.
5. Buderhat Road,
P.O. Panchasayar, Kolkata 700094,
West Bengal, India.
Dr. Lourdes Jimenez-Badillo
Ecology and Fisheries Centre, General
Direction of Investigation,
Universidad Veracruzana,
Hidalgo 617, Col. Río Jamapa,
Boca del Río, Veracruz, México ZP 94290.

Editorial Board Dr. Dada Adekunle Ayokanmi Dr. Harikrishnan
Department of Fisheries and Aquaculture Faculty of Marine Science
Technology, Federal University of College of Ocean Sciences
Technology, P.M.B 704, Jeju National University, Jeju, 690-756
Akure, Ondo State, South Korea .
Nigeria.
Dr. Ramasamy Harikrishnan Prof. Ratha Braja Kishore
KOSEF Post Doctoral Fellow, Faculty of Department of Zoology
Marine Science, College of Ocean Sciences, Biochemical Adaptation Laboratory
Jeju National University, Banaras Hindu University
Jeju city, Jeju 690 756, Varanasi 221005
South Korea. India.
Dr. Kawser Ahmed Dr. Esmaile AM Shakman
Lab. of Ecology, Environment and Am Vögenteich,13/ 3.09.618057 Rostock
Climate Change, Department of Fisheries, Germany .
University of Dhaka, Dhaka-1000,
Bangladesh. Prof B. Sharma
Department of Biochemistry
Dr. Maxwell Barson Coordinator, Centre for Biotechnology
Biological Sciences Department University of Allahabad
University of Zimbabwe PO Box MP 167 Allahabad-U.P.,
Mount Pleasant Harare, India.
Zimbabwe. Dr. Sebastián Villasante
Dr. Christopher Marlowe Arandela Caipang Fisheries Economics and Natural Resources Research Unit
Faculty of Biosciences and Aquaculture, Bodø University University of Santiago de Compostela, A Coruña.
College, Bodø 8049, Spain.
Norway. Dr. Mohamed Hamed Yassien
Dr. William S. Davidson National Institute of Oceanography and Fisheries, Suez
Department of Molecular Biology and Biochemistry branch,
Simon Fraser University 8888 University Drive P.O. Box (182), Suez,
Burnaby, British Columbia Egypt.
Canada V5A 1S6. Dr. Abhay Bhalchandra Thakur
Dr. Babak Ghaednia 2/9 Mai Krupa Sagar Society Opp. Catering College
Iran Shrimp Research Center ( ISRC) Veer Savarkar Marg Dadar, Mumbai -400 028
Taleghani High Way, P.O.Box 1374 Maharashtra,
Bushehr, India.
Iran.
Dr. Riaz Ahmad
Dr. Ramachandra Bhatta Department of Zoology
Animal and Fisheries Sciences University, Aligarh Muslim University
College of Fisheries, Aligarh- 202002, (UP)
Kankanady Mangalore 575 002 India.
India.

International Journal of Fisheries and Aquaculture Table of Contents: Volume 7 Number 6 June 2015
ARTICLES
Research Articles
Ecological investigation of zooplankton abundance in the Bhoj wetland, 81
Bhopal of central India: Impact of environmental variables
Najeeb Ahmad Bhat, Rajni Rainaand and Ashwani Wanganeo
Influence of environmental variables on the relative abundance and 94
habitat use of two sympatric notobranchiid fishes in a tropical stream
B. D. Olaosebikan, S. L. Lamai and O. Ibikunle

Vol. 7(6), pp. 81-93, June 2015
DOI: 10.5897/IJFA14.0431
Article Number: 8F87A2253578
ISSN 2006-9839
Copyright ©2015
Author(s) retain the copyright of this article http://www.academicjournals.org/IJFA
International Journal of Fisheries and Aquaculture
Full Length Research Paper
Ecological investigation of zooplankton abundance in the Bhoj wetland, Bhopal of central India: Impact of
environmental variables
Najeeb Ahmad Bhat1*, Rajni Rainaand2 and Ashwani Wanganeo1
1Department of Environmental Sciences and Limnology, Barkatullah University, Bhopal (M.P) -462026, India.
2Department of Zoology, Govt. Benazeer Science and Commerce College, Bhopal (MP) India.
Received 3 July, 2014; Accepted 24 April, 2015
The influence of physicochemical properties of wetland, on its zooplankton composition and abundance were investigated for two years between February 2008 and January 2010. In both the years, total of 62 species of zooplankton were identified. At all the stations of the water body Rotifera recorded the highest percentage of 45% followed by cladocera (29%), Protozoa (13%), Copepoda and Ostracoda (8 and 4%) respectively. In terms of density, total zooplanktonic density during 1st year was 7395 Ind.l-1 that increased to 8543 Ind.l-1 in the 2nd year. In the first year, Copepoda (2 Ind.1-1 to 2415 Ind.1-1) constituted the largest group making up 63.41% of the zooplankton population density, this was followed by Cladocera (21.27%) with having numerical density ranges between (3 Ind.1-1 to546 Ind.1-1) and Rotifera group (14.15%) having a density varied from 2 to 207 Ind.1-1. The genus Bosmina (34.7%) dominated the Cladoceran group and Polyarthra and Brachionus (19.8 and 18.7%) recorded highest in terms of percentage among the Rotifera group, while as the genus Cyclops (51.5%) recorded the highest number among the Copepoda group and was also dominant genus among the zooplankton genera. During second year of study period, the Copepoda (70.08%) which had a density variation between 2 Ind.1-1 to 4491 Ind.1-1 and this was followed by Cladocera (18.67%) with numerical density ranges between 3 to 337 Ind.1-1 and Rotifera (9.08%) having density between 2 Ind.1-1 to 171 Ind.1-1. The genus Chydorus (21.1%) dominated the Cladoceran group and genus Lecane (22.0%) recorded highest in terms of percentage among the Rotifera group, while as the genus Cyclops (75.0%) recorded the highest number among the Copepoda group and was also dominant genus among the zooplankton genera. The water body is receiving domestic discharge leading to large amount of nutrient inputs and high amount of phosphate and nitrate in the water body indicates that water is eutrophic in nature. Key words: Zooplankton, abundance, diversity, Shannon –Weaver Index, Bhoj wetland.
INTRODUCTION Zooplankton are the major trophic link in food chain and being heterotrophic organisms it plays a key role in
cycling of organic materials in aquatic ecosystem. In addition, their diversity has assumed added importance
. *Corresponding author. E-mail: [email protected], Tel: +91-9419425309.
Author(s) agree that this article remain permanently open access under the terms of the Creative Commons Attribution
License 4.0 International License
82 Int. J. Fish. Aquac. during recent years due to the ability of certain species to indicate the deterioration in the quality of water caused by pollution or eutrophication. Monitoring the zooplankton as biological indicators could act as forewarning, when pollution affects food chain (Mahajan, 1981). The species composition, distribution and abundance of zooplankton in any water body depend upon the chemical and physical properties of water. The dependence of trophic status of lakes onzooplankton grazing capacity were studied by Baruah et al. (1993), Alfred and Thapa (1996) and Salaskar and Yeragi (2003). Planktons are considered as indicator of the trophic status of a water body because of their specific qualitative features and their capacity to reproduce in large number under environmental conditions that are favourable to them (Vollenweider and Frei, 1953). Similarly, changes in the water quality as well as zooplankton quality are indicators of rate and magnitude of cultural eutrophication (Kulshrestha et al., 1989; Chari and Abbasi, 2003). Zooplankton diversity and density refers to variety within the community. These are often an important link in the transformation of energy from producers to consumers due to their large density, drifting nature, high group or species diversity and different tolerance to the stress. Zooplankton plays an important role in lake ecosystem, as grazers that control algal and bacterial populations, as a food source for higher trophic levels and in the excretion of dissolved nutrients. The organization of biological communities in aquatic ecosystems is closely dependent on the variations of physical and chemical conditions linked to natural and anthropogenic factors (Pourriot and Meybeck, 1995).
The zooplankton communities, very sensitive to environmental modifications, are important indicators for evaluating the ecological status of these ecosystems (Magadza, 1994). They do not only form an integral part of the lentic community but also contribute significantly, the biological productivity of the fresh water ecosystem (Wetzel, 2001). The presence and the relative predominance of various copepod species have been used to characterize the eutrophication level of aquatic ecosystems (Park and Marshall, 2000; Bonecker et al., 2001). Herbivorous zooplankton is recognized as the main agent for the top-down control of phytoplankton, and the grazing pressure exerted by cladocerans and copepods on algae and cyanobacteria is sometimes an important controlling factor of harmful algal blooms (Boon et al., 1994). STUDY AREA
Bhopal, the capital city of the state of Madhya Pradesh, India is famous for its numerous lakes. Of these the most important are the Upper and Lower Lakes, which have commonly been designated as Bhoj Wetland. The Bhoj Wetland is a wetland of international importance. The Upper Lake basin comprises of a submergence area of
about 31.0 sq. km and a catchment area of 361 sq. km., whereas the Lower Lake basin comprises of a submergence area of 0.9 sq. km and catchment area of 9.6 sq. km. While Lower Lake is surrounded on all sides by dense urban settlements, only about 40% of the fringe area of Upper Lake has dense human settlement and the rest is sparsely populated having cropping as the major land use. The Upper Lake spread over longitude 77°18’00” to 77°24’00” E and latitude 23°13’00” to 23°16’00” N, whereas the considerably smaller Lower Lake is spread over 77°24’00” to 77°26’00” E and latitude 23°14’30” to 23°15’30” N. The Upper Lake was created in the 11th century by constructing an earthen dam across Kolans River, the main feeding channel of the lake with the objective of supplying potable water for the city dwellers. The wetland also supports a wide variety of flora and fauna. Several species of phyto and zooplankton, macrophytes, aquatic insects, amphibians, fishes and birds (resident as well as migratory) are found in these wetlands. Considering its ecological importance, Ramsar site declared by the Government of India in 2002. Increase in anthropogenic activities in the catchment during the second half of the last century resulted in environmental degradation of the lakes.
Investigations on the ecology of Bhoj wetland of Madhya Pradesh indicate that this man- made wetland is under severe degradation pressure. Siltation, solid waste disposal and weed infestation, dumping of agricultural waste, hospital waste disposal and idol immersion in the wetland during the festival season pollutes the wetland ecosystem beyond the tolerable limits of any aquatic system (Figure 1). MATERIALS AND METHODS Water samples were collected on monthly basis for a period of two year. For the present study nine sampling points in the wetland were selected and each point, taking into account the human activities such as washing, bathing, fishing and boating etc. the outlets, inlets, morphometric features and growth of aquatic vegetation etc., and other important factors considered during the selection of the sampling sites. Some of the feature of the sampling sites. Station I (Kamla Park) - This station is situated on eastern end of the wetland. It is subjected to maximum anthropogenic pressure. The idol immersion activity at this site has been reduced after developing Prempura Ghat particularly for immersion activity. Station II (Gandhi Medical College) - It is situated close to the inlet of Shaheed Nagar Nallah adjacent to Gandhi Medical College. Station III (Koh and Fiza) - There is an intake point for water supply in this area. This station is also the site of Tazia immersion. Station IV (Van Vihar) - This station represents the area that comes under protected forest (Van Vihar). The station is comparatively free from human intervention and other anthropogenic activities. Station V (Yatch Club) - This is the boating station, where maximum human interaction takes place. Tourists start their motor and paddle boats from this station, and a crowd of tourists can be observed from morning till evening at this station. Station VI (Bairagarh) - This station of Bhoj wetland is situated near Bairagarh where substantial inflow of domestic sewage can be

Bhat et al. 83
Figure 1. Catchment area of Bhoj wetland Bhopal.
seen. The area has become shallow due to high density of free floating, emergent, and submerged macrophytes. Station VII (Sehore side) - A lot of agricultural land surrounds this station in Bhoj wetland. Most of the catchment area consists of agricultural land. Because of this all the fertilizers, pesticides and agricultural residues used in the fields find their way as run off into the wetland waters. Station VIII (Prempura Ghat) - This is the idol immersion station. During the Hindu religious festivals, lots of idols are immersed in water. Station IX (Nehru Nagar) - This station is highly influenced by anthropogenic and cattle activities. The run-off from the catchment area adds nutrients to the wetland. The region is covered with high density of emergent/submerged macrophytes. The run-off from the catchment area also adds considerable quantities of nutrients to the wetland.
The water samples have been collected in one liter polyethylene canes of the surface waters by the boat between 8 AM to 12 PM from the selected sites of the Bhoj wetland. For the quantitative analysis of zooplankton, water was collected from the surface with minimal disturbance and filtered through a No. 25 bolting silk cloth, net of mesh size 63 µm. Ten liters of water were filtered and concentrated to 100 ml and were preserved by adding 2 ml of 4% formalin simultaneously. The quantitative analysis of zooplankton was done by using Sedgwick-Rafter cell with dimensions of 50 mm x 20 mm x 1 mm, following the method given in APHA (2000). 1 ml of concentrated sample was taken in a Sedgwick-Rafter counting cell and the entire contents were counted. The identification of aquatic biota (zooplankton) have been done following the standard works and methods of Edmonson (1959), Needham and Needham
(1962), Pennak (1978), Victor and Fernando (1979), Michael and Sharma (1988), Battish (1992) and Sharma (1999). The results have been expressed as individuals (Wanganeo and Wanganeo, 2006).
C = Number of organisms recorded A = Area of field of microscope D = Depth of field (SRC depth) in mm E = Number of fields counted.
Shannon diversity index
This index is an index applied to biological systems derived from a mathematical formula used in communication area by Shannon in 1948. H’ = -Σ [(ni / N) x (ln ni / N)] H’: Shannon Diversity Index ni : Number of individuals belonging to i species N : Total number of individuals
Number of zooplankton “n” = C x 1000 mm
2
A x D x E
Number of zooplankton/l = n x Vol. of concentrate (ml)
Vol. (litres) of water filtered

84 Int. J. Fish. Aquac. Table 1. Physico-chemical parameters on annual mean basis of Bhoj wetland, Bhopal.
Parameter Units First year Second year
Summer Monsoon Winter Summer Monsoon Winter
Air temperature °C 37.31 30.63 24.94 30.13 28.77 22.48
Water temperature °C 25.07 24.02 20.78 27.08 25.17 19.82
pH Units 8.46 7.86 8.22 8.26 8.16 8.20
Total Dissolved Solids mg L-1
169.26 197.61 177.28 182.08 149.26 140.37
Elect. Conductivity mg L-1
254.07 268.98 324.44 285.83 239.35 220.74
Dissolved Oxygen mg L-1
7.04 6.93 5.34 5.72 5.39 5.73
Total Alkalinity mg L-1
80.48 79.86 95.94 78.67 66.61 53.70
Total Hardness mg L-1
96.59 85.93 113.00 98.67 93.76 87.19
Calcium Hardness mg L-1
74.26 64.25 77.88 63.88 72.78 65.18
Magnesium Hardness mg L-1
5.33 5.26 8.53 8.45 5.09 5.34
Chloride mg L-1
31.06 32.70 42.21 36.95 26.74 19.51
Nitrate nitrogen mg L-1
0.50 0.57 0.48 0.53 0.87 0.59
Total Phosphorus mg L-1
0.21 0.26 0.33 0.26 0.31 0.30
RESULTS AND DISCUSSION The physico-chemical parameters of water at upper basin of Bhoj wetland have been given in the Table 1. The atmospheric temperature ranged from 24.94°C (winter) to 37.31°C (summer) and 22.48°C (winter) to 30.13°C (summer) in the first and second year of study period. Water temperature recorded in the first and second year varied between 20.78°C (winter) to 25.07°C (summer) depending on the seasonal atmospheric temperature. Similarly in the pH value ranges between 7.86 units (monsoon) to 8.45 units (summer) units in the first year of study while in the second year of study period, pH ranges from 8.16 to 8.26 units in the monsoon and summer season, it indicates alkaline nature of water body in both years. Das (1978) considered pH values ranging from 7.3 to 8.9 units to favour the growth of planktonic organisms. In summer, increased photosynthesis regulated the pH towards alkaline side (Singhal et al., 1986). In the present investigation of first year, electrical conductivity (EC) values ranged from 254.07 µS/cm (summer) to 324.44 µS/cm (winter) at 25°C while during second year electrical conductivity fluctuated from 220.74 to 285.83 µS/cm in the winter and summer seasons respectively. Increase in conductivity value during summer season was due to increased water evaporation and churning action of wind and waves. Lashari et al. (2009) while working on Keenjhar Lake reported electrical conductivity range from 320 to 496 µS/cm, during post monsoon and summer-winter season. Total dissolved solids fluctuated from 169.26 to 197.61 mgL
-1 in the summer and monsoon
of first year while during second year it varied from 140.37 mgL
-1 (winter) to 182.08 mgL
-1 (summer).The
maximum total dissolved solids concentration was found during monsoon on account of catchment interaction (surface inflow) from the surrounding human habitation. Gonzalves and Joshi (1946) also recorded rise in total
dissolved solids values during monsoon. Minimum dissolved oxygen content of water samples to be 5.34 mgL
-1 in the winter season and maximum 7.04 mgL
-1
(summer) of first year study while during second year of study it fluctuated from 5.39 mgL
-1 (monsoon) to 5.73
mgL-1
(winter). Low level of dissolved oxygen indicates the high level of organic load. Fluctuation in dissolved oxygen is also due to fluctuation in water temperature and addition of sewage waste demanding oxygen (Koshy and Nayar, 2000). Dissolved oxygen levels were higher in the monsoon season as compared to summer season due to the increased current flow that enhances the diffusion rate and mixing of oxygen into the water. Present findings are in agreement with those reported by Welcomme (1979) Offem and (Akpan) 1993 who observed that tropical African aquatic systems generally have low dissolved oxygen in the summer season than the wet season. The total alkalinity values ranged between 79.86 to 95.94 mgL
-1 in the monsoon and winter
during first year of study while minimum total alkalinity value to be 53.70 mgL
-1 was noted during winter season
and maximum of 78.67 mgL-1
in the summer season in the second year. Increase in alkalinity values may be due to decrease in the water level. Alkalinity increases, with decreases in water levels have also been reported by Singhal et al. (1986). The higher alkalinity values may be due to the discharge of municipal and domestic sewage. As per Sorgensen (1948) and Moyle (1949) classification, Bhoj wetland falls under nutrient rich category. The value of total hardness fluctuated from 85.93 mgL
-1 (monsoon)
to 113.0 mgL-1
(winter) in the first year and in the second year it varied from 87.19 mgL
-1 during winter to 98.67
mgL-1
during summer season. High concentration of total hardness recorded in winter of first year may be attributed to the decomposition of submerged macrophytes. Iqbal and Katariya (1995) however, reported higher hardness values in summer and lower in

monsoon in the same water body. Bhatt et al. (1999) reported a total hardness range of 280 mgL
-1 (monsoon)
to 352 mgL-1
(summer) in Taduaha Lake, Katmandu. In the first year, the average values of calcium hardness in waters varied from 64.25 mgL
-1 (monsoon) to 77.88 mgL
-1
(winter) and in the second year it varied from 63.88 to 72.78 mgL
-1 in the summer and monsoon season. During
winter months calcium concentration reached maximum, which may be due to the low water level and additional amount of detergents added by way of human activities and incoming domestic waste. However, during 2nd year, calcium hardness varied between 64 mgL
-1 (summer) to
74 mgL-1
, monsoon which is in agreement with the reports of Wanganeo (1998) who found minimum value of calcium hardness during summer months and maximum during monsoon months in the same wetland. On the other hand, minimum magnesium hardness was noted to be 5.26 mgL
-1 as against maximum value of 8.53 mgL
-1 in
the monsoon and winter season of first year similarly in the second year the minimum and maximum values were recorded to be 5.09 and 8.45 mgL
-1 in the monsoon and
summer season. High magnesium hardness during winter season may be due to the low water level and human activities in the catchment area which led to the entry of domestic waste into the wetland. As in the case of calcium, there was a general increase in the average concentration of magnesium ions in water. The chloride concentrations in the wetland waters ranged between 31.06 mgL
-1 (summer) and 42.21 mgL
-1 (winter) during
first year of study. However, during second year of study the values ranged from 19.51 mgL
-1 (winter) to 36.85
mgL-1
(summer). High values during winter may be due to low water level, which is in accordance with the findings of Gonzalves and Joshi (1946) and Osborne et al., (1987). During IInd year it varied from a lowest value of 19.5 mgl
-1 (winter) to a highest of 36.9 mgL
-1 in summer.
Singh and Balasingh (2011) also observed maximum chloride in summer. Rajshekhar et al. (2007) related high chloride in summer to rise in temperature and evaporation. Shinde et al. (2010) recorded higher values of chlorides during summer and lower during winter season in Harsool Savangi water body. The nitrate nitrogen content water varied aberrantly throughout the lake. Maximum value of nitrate nitrogen was 0.57 mgL
-1 in
the monsoon and minimum amount was found to be 0.48 mgL
-1 during winter of first year of study, while during
second year it varied between 0.53 mgL-1
(summer) to 0.85 mgL
-1 (monsoon). The most important source of
NO3-N in waters is biological oxidation of nitrogenous organic matter of both autochthonous and allochthonous origin, which include domestic sewage, agricultural run-off and effluents from industries (Wanganeo, 1998; Saxena, 1998). Mostly higher values of nitrate content were recorded in the ambient waters during rainy season. This may be attributed to the influx of nitrogen rich storm water that brings large amount of contaminated sewage water from the surrounding areas, which is densely
Bhat et al. 85 populated by human population and rural agri-catchment area. Phosphorus the most vital nutrient effecting productivity of natural water, the total phosphorus concentration in surface waters of Bhoj wetland fluctuated between 0.21 mgL
-1 (summer) to 0.33 mgL
-1
(winter) in the first year of study and in the second year it fluctuated from 0.26 mgL
-1 (summer) to 031 mgL
-1
(monsoon) respectively. The increased total phosphorus concentration was mainly by flood washing and mixing of fertilizers from nearby agricultural land (Wanganeo, 1998; Sharma and Sarang, 2004; Kumar et al., 2006; Singh and Balasingh,2011). The minimum concentration of total phosphorus during the summer season may be due to the abundance of phytoplankton population which utilizes it. Such findings have also been reported by Kataria et al. (1996). Zooplankton species composition In an aquatic ecosystem, interaction occurs between living and non-living components. Environmental factors comprising physical and chemical components have been reported in several studies to have a great influence on the well-being of aquatic species, plankton inclusive (Kawo, 2005; Okogwu and Ugwumba, 2006). Strong relationships exist between phytoplankton and zooplankton. For instance, the main systematic groups of zooplankton include many taxa, which feed on phytoplankton. Selective grazing by zooplankton is an important factor affecting the structure of phytoplankton communities. However, phytoplankton structure also influences the taxonomic composition and dominance of the zooplankton. These animal components are mainly filtrators, sedimentators or raptorial predators (Karabin, 1985). Among them, filtrators usually exert the strongest effect on phytoplankton abundance in lakes. Grazing by cladocerans creates a selective pressure on the phytoplankton community, causing elimination of organisms that do not exceed a precisely defined size (Gliwicz, 1980). As a result inedible large-sized algae dominate phytoplankton communities (Kawecka and Eloranta, 1994). The rotifera plays significant role in the food chain and biological productions of waters such as aqua pollution indicators or and water quality monitor (Pontin, 1978; Sladecek, 1983). In many cases, predatory copepods exert a strong influence on the phytoplankton composition. The copepods suppress large phytoplankton, whereas nano-planktonic algae increase in abundance (Sommer et al., 2003). The algal species that are resistant to grazing and predation are more likely to survive, but also can make filter feeding more difficult. Because of the constant feeding pressure of zooplankton on phytoplankton, the more resistant algae may become more and more abundant during the growing season. This, in combination with the pressure exerted by fish on large-sized zooplankton, results in the restructuring of the

86 Int. J. Fish. Aquac.
Table 2. List of zooplankton species obtained in two years of investigation in Bhoj Wetland.
Cladocera 1st year 2nd Year 1st year 2nd Year
Alona sp. √ √ Monostyla sp. √ √
Alonella sp. √ √ Mytilinasp. √ √
Bosmina sp. √ √ Philodinasp. √ √
Bosminopsisdeitersi
√ Platyias sp. √ √
Ceriodaphnia sp. √ √ Ploesoma sp. √
Chydorussp √ √ Polyarthra sp. √ √
Conochiloidessp. √
Rotariasp. √ √
Daphnia sp. √ √ Scaridiumsp. √ √
Diaphanosoma sp. √ √ Synchaeta sp. √
Leydgia sp. √ √ Tetramastixapoliensis
√
Macrothrix sp. √ √ Trichocerca sp. √ √
Moina sp. √ √ Trichotriasp. √ √
Moinadaphnia sp. √ √ Triploceros limnias √
Pleuroxusaduncus
√ Trochosphaerasp.
√
Scapholebris sp. √ √ Copepoda
Sida sp. √ √ Cyclopoid copepod √
Simocephalussp √ √ Cyclops sp. √ √
Streblocerus sp. √ √ Diaptomus sp. √ √
Rotifera
Mesocyclops sp. √ √
Asplanchnasp. √ √ Nauplius larvae √ √
Asplanchnopsis sp. √ √ Ostracoda
Ascomorphasp. √ √ Cyprinotus sp. √ √
Brachionus Angularis √ √ Cypris sp. √ √
Cephalodella sp. √ √ Stenocypris sp. √
Colurella sp. √ √ Protozoa
Conochilus sp. √ √ Actinophyrussp. √
Filinia sp. √ √ Arcella sp.
√
Gastropus sp. √ √ Centropyxix sp. √ √
Harringiasp. √ √ Climacostomum sp.
√
Hexarthrasp. √ √ Coleps sp. √
Keratella sp. √
Colpidium sp. √ √
Lecane sp. √ √ Oxytricha sp. √ √
Lepodella sp. √ √ Verticella sp.
√
community of zooplankton towards the dominance of small-sized organisms resistant to disturbances and trophic interactions (Gulati, 1990; Meijer, 2000; Kozak and Gołdyn, 2004).
In the two years of study period, total of 62 species of zooplanktons were identified among them 55 species were recorded during the 1
styear (2008-2009) of study,
while as 54 species of zooplanktons were documented during the 2
ndyear (2009-2010) of study period (Table 2).
At all the nine stations during first year group Rotifera recorded the highest number of species (47%) followed by Cladocera (29%), which in turn was followed by Copepoda (9%), Protozoa (9%) and Ostracoda (5%). Similarly in the second year of investigation at all the nine stations, Rotifera group again recorded the highest number of species (44%) followed by Cladocera (31%),
which in turn was followed by Protozoa (11%), Copepoda (9%) and Ostracoda (4%).
The dominance of rotifer species was due to its reference for warm waters as highlighted by Dumont (1983) and Segers (2003). High rotifer species in the water body indicates enrichment due to direct inflow of untreated domestic sewage from adjacent areas into the wetland, as was suggested by Arora (1966). Chandrashekhar (1998) recorded diversity of rotifers to be influenced by the different water quality and other chemical factors. The diversity patterns greatly depend on the water temperature and availability of food in the water body. The sufficient nutrient availability and other favourable conditions result in dominance of rotifers. Phytoplankton populations constituting the essential component of the rotifera dietary spectrum, increase with

higher water temperature in summer that influences species diversity in the wetland. Further, high nutrients like (nitrate annualX�=0.59 mgL
-1 and phosphate X�=0.27
mgL-1
) and favourable temperature and dissolved oxygen conditions particularly at station VIII resulting from decomposition of macrophytes enables higher diversity of zooplankton particularly rotifera. Similar trend has also been reported by Subla et al. (1992) and Padmanabha and Belagali (2006). The progressive decrease in the zooplankton diversity at station VII might be attributed to drought conditions. The highest rotifera species diversity was observed by Robinson (2004) in Geordian wetlands, characterized by dense well developed macrophyte stands, which provides shelter, varied niches and comparatively good quality water. High species diversity of rotifera has also been recorded with the peaks of phytoplankton, which suggests that the increase in zooplankton production may be attributed to greater availability of food in form of phytoplankton coupled with enabling temperature (Wadajo, 1982; Wadajo and Belay, 1984; Webber and Roff, 1995; Christou, 1998; Uyeet al., 2000). The dominance of genus Brachionus is an indication that the Bhoj wetland is eutrophic and their abundance was due to the presence of high levels of organic matter in the water body.
The available amount of food for Cladocerans is also considered to influence the morphology of individuals (Richman, 1958). And it grows continuously at high food concentrations, but stops growth after maturation at low food concentrations (Urabe, 1991). Usha (1997) observed that among total zooplanktonic population, cladocera come second in order of abundance in Gandhisagar reservoir. In the present study 11 species of Cladocerans have been recorded. Iqbal and Kazmi (1990) have recorded 15 species of cladocerans from Hub Dam Lake. The population was comparatively higher during the high temperature, but was low during rainy seasons of the year.
In the present study, the total zooplanktonic density during 1
styear was 7395 Ind.l
-1 that increased to 8543
Ind.l-1
in the 2nd
year (Table 3). There was variation in zooplankton density during two years which may be attributed to low water volume caused by drought conditions in the second year (Table 3). The maximum population density recorded in the 2
ndyear also reflected
a positive relationship with temperature, nitrate and phosphate concentrations. Similar observations were recorded by Paliwal (2005). The maximum population density of zooplankton in the 2
ndyear may also be
attributed to greater availability of food viz., phytoplankton. The factors like temperature, dissolved oxygen play an important role in controlling the diversity and density of zooplankton (Edmondson, 1965; Baker, 1979). According to Kurbatova (2005) and Tanner et al. (2005) pH more than (8 units) means highly productive nature of a water body, in the present study, the average pH recorded was 8.3 units , indicating water highly
Bhat et al. 87 productive for zooplankton population.
In terms of density Copepoda (2 to 2415 Ind.1-1
) constituted the largest group making up 63.41% of the zooplankton population density, this was followed by Cladocera (21.27%) with having numerical density ranges between (3 to 546 Ind.1
-1) and Rotifera group
(14.15%) having a density varied from 2 to 207 Ind.1-1
and least contribution from the groups Protozoa and Ostracoda (0.66% and 0.52 %)(Table 3). The genus Bosmina (34.7%) dominated the Cladoceran group and Polyarthra and Brachionus(19.8 and 18.7%) recorded highest in terms of percentage among the Rotifera group, while as the genus Cyclops (51.5%) recorded the highest number among the Copepoda group and was also dominant genus among the zooplankton genera. On an overall total zooplankton density were recorded to be 7395 Ind.1
-1 during first year of investigation period in the
Bhoj wetland. During second year of study period, the Copepoda
(70.08%) which had a density variation between 2 to 4491 Ind.1
-1 and this was followed by Cladocera
(18.67%) with numerical density ranges between 3 to 337Ind.1
-1 and Rotifera (9.08%) having density between 2
to 171 Ind.1-1
, while least contribution density from the groups Protozoa and Ostracoda (1.86 and 0.3%)(Table 3). The genus Chydorus (21.1%) dominated the Cladoceran group and genus Lecane (22.0%) recorded highest in terms of percentage among the Rotifera group, while as the genus Cyclops (75.0%) recorded the highest number among the Copepoda group and was also dominant genus among the zooplankton genera. On an overall total zooplankton density were recorded to be 8543 Ind.1
-1 during second year of investigation period in
the Bhoj wetland. The optimal temperature requirement varied for
different groups of zooplankton suggesting their abundance in different seasons. Copepoda during the entire period was mainly represented by Cyclops sp. and nauplii larvae. This was attributed to enriched nature of waters. Verma et al. (1984) and Ahmad et al. (2011) observed that Cyclops sp. and nauplii were sensitive to pollution and increase with an increase in nutrients. Copepods were directly related to nitrogen and phosphorus and showed tolerance to different physico-chemical characteristics (Kulshreshta et al., 1992). Joshi (1987) reported dominant population of Copepoda (Cyclops sp.) throughout the year from Sagar lake while Gupta (1989) reported similar condition in Gulabsagar and Ganglooan water bodies of Jodhpur. Syuhei (1994) stated that individual growth rate of Copepoda may also depend on temperature conditions. Khan (2002) also reported dominance of copepoda in floodplain wetlands of west Bengal. Hansson et al. (2007) opined Copepoda to be more tolerant to harsh environmental conditions. Thus, copepods were found to be dominant at sites which were densely infested by macrophytes in the present study.

88 Int. J. Fish. Aquac.
Table 3. Zooplankton Composition and abundance in Bhoj Wetland Bhopal.
Cladocera 2008-2009 First year Second year
Ind./l sp. % in class sp. % in total zoo class % in zoo Ind./l sp. % in class sp. % in total zoo Class % in Zoo
Alona sp. 53 3 0.7
21.27
49 3.1 0.6
18.67
Alonella sp. 47 3 0.6 17 1.1 0.2
Bosmina sp. 546 35 7.4 284 17.8 3.3
Bosminopsisdeitersi 6 0.4 0.1
Ceriodaphnia sp. 106 7 1.4 58 3.6 0.7
Chydorus sp 163 10 2.2 337 21.1 3.9
Conochiloides 10 1 0.1
Daphnia sp. 29 2 0.4 11 0.7 0.1
Diaphanosoma sp. 205 13 2.8 51 3.2 0.6
Leydgia sp. 30 2 0.4 52 3.3 0.6
Macrothrix sp. 20 1 0.3 3 0.2 0.0
Moina sp. 98 6 1.3 129 8.1 1.5
Moinadaphnia sp. 72 5 1.0 263 16.5 3.1
Pleuroxusaduncus 60 3.8 0.7
Scapholebris sp. 3 0 0.0 9 0.6 0.1
Sida sp. 3 0 0.0 13 0.8 0.2
Simocephalussp 169 11 2.3 237 14.9 2.8
Streblocerus sp. 19 1 0.3 16 1.0 0.2
Total 1573 100
1595 100
Rotifera
Asplanchna sp. 43 4.1 0.6
14.15
9 1.2 0.1
9.08
Asplanchnopsis 8 0.8 0.1 7 0.9 0.1
Ascomorpha sp. 5 0.5 0.1 7 0.9 0.1
Brachionus Angularis 196 18.7 2.7 86 11.1 1.0
Cephalodella sp. 15 1.4 0.2 2 0.3 0.0
Colurella sp. 5 0.5 0.1 5 0.6 0.1
Conochilus sp. 6 0.6 0.1 6 0.8 0.1
Filinia sp. 120 11.5 1.6 85 11.0 1.0
Gastropus sp. 10 1.0 0.1 15 1.9 0.2
Harringia sp. 15 1.4 0.2 2 0.3 0.0
Hexarthra sp. 25 2.4 0.3 8 1.0 0.1
Keratella sp. 39 3.7 0.5
Lecane sp. 106 10.1 1.4 171 22.0 2.0
Lepodella sp. 30 2.9 0.4 16 2.1 0.2

Bhat et al. 89
Table 3. Contd.
Monostyla sp. 77 7.4 1.0
154 19.8 1.8
Mytilina sp. 14 1.3 0.2 5 0.6 0.1
Philodina sp. 2 0.2 0.0 2 0.3 0.0
Platyias sp. 5 0.5 0.1 12 1.5 0.1
Ploesoma sp. 2 0.2 0.0
Polyarthra sp. 207 19.8 2.8 53 6.8 0.6
Rotaria sp. 7 0.7 0.1 7 0.9 0.1
Scaridium sp. 15 1.4 0.2 7 0.9 0.1
Synchaeta sp. 10 1.0 0.1
Tetramastixapoliensis 12 1.5 0.1
Trichocerca sp. 80 7.6 1.1 99 12.8 1.2
Trichotria sp. 2 0.2 0.0 2 0.3 0.0
Triploceros limnias 2 0.2 0.0
Trochosphaera sp. 4 0.5 0.0
Total 1046 100
776 100
Copepoda
Cyclopoid copepod 10 0.2 0.1
63.41
70.08
Cyclops sp. 2415 51.5 32.7 4491 75.0 52.6
Diaptomus sp. 82 1.7 1.1 167 2.8 2.0
Mesocyclops sp. 2 0.0 0.0 2 0.0 0.0
Nauplius larvae 2180 46.5 29.5 1327 22.2 15.5
Total 4689 100
5987 100
Ostracoda
Cyprinotus sp. 8 21.1 0.1
0.52
9 35 0.1
0.3 Cypris sp. 20 52.6 0.3 17 65 0.2
Stenocypris sp. 10 26.3 0.1
Total 38 100
26 100
Protozoa
Actinophyrus sp. 5 10.2 0.1
0.66
1.86
Arcella sp. 5 3 0.1
Centropyxix sp. 24 49.0 0.3 143 90 1.7
Climacostomum sp. 3 2 0.0
Coleps sp. 15 30.6 0.2
Colpidium sp. 2 4.1 0.0 4 3 0.0
Oxytricha sp. 3 6.1 0.0 2 1 0.0
Verticella sp. 2 1 0.0
Total 49.0 100
159 100

90 Int. J. Fish. Aquac. High population density of Cladocera was recorded in the wetland during the present study period. Among Cladocera genus Bosmina recorded dominant which has been considered a good indicator of trophic conditions for a long time (Swar and Fernando, 1980). This is usually a littoral species which becomes abundant in the limnetic habitat only when larger competing species are reduced or eliminated by some factors other than shortage of food (Selgeby, 1974). This species is very common in eutrophic lakes having abundant macrophytic vegetation and also found abundant in Ikeda lake (Baloch, 1995). Maximum population of Chydorus was also recorded in the lake ecosystem in the present study.
Among the species identified as indicators of eutrophication in this wetland as well as in other regions, the rotifer Brachionus sp. stands in its great tolerance to extremely eutrophic environments (Sladecek, 1983) and to high conductivity (Berzins and Pejler, 1989). Nogueira (2001) reported that the index of eutrophic waters is above 15 species and that its abundance is considered as a biological indicator for eutrophication. Brachionus sp. was frequently observed at all sampling sites and seasons in the Bhoj wetland. This species is considered to be an indicator of eutrophication (Sampaio et al., 2002). The results indicate that the Bhoj wetland water has already reached the stage of eutrophication. Nogueira (2001) reported Brachionus sp.to be an indicator of sewage and industrial pollution. Polyarthra sp.occurred throughout the year. Sladeček (1983) considered it as a permanent inhabitant of all types of fresh water, while Sharma and Pant (1985) regarded it as a good indicator of eutrophication. According to our results, the factors that explained the greatest percentage of the variations were nitrogen and phosphorus (also noted for the river Po (Ferrari et al., 1989), as well as water pH and oxygen which are also known to influence zooplankton abundance (Allan, 1976; Wetzel, 1983). Alkaline pH was also found to favor zooplankton growth and abundance in the river, as seen from the direct relationship with pH. Byars (1960) reported that zooplankton prefer alkaline waters. Both conductivity and total dissolved solids promoted high zooplankton growth and abundance. This agrees with the findings of Hujare (2005).
The zooplankton composition of the Bhoj wetland showed the water body to be productive and capable of supporting diverse species and populations of fish. The assemblage was strongly influenced by the physico-chemical factors which showed the water quality to be good, according to APHA (1998). The alkaline pH, food abundance and nutrients were some of the factors that could limit zooplankton growth, composition and abundance in the aquatic ecosystem. Maintenance of good water quality in the water body will enhance the structure of the zooplankton community and population dynamics. This is of great significance for fish production in the wetland since the energetic trophic foundation
that supports fish are is well-established.
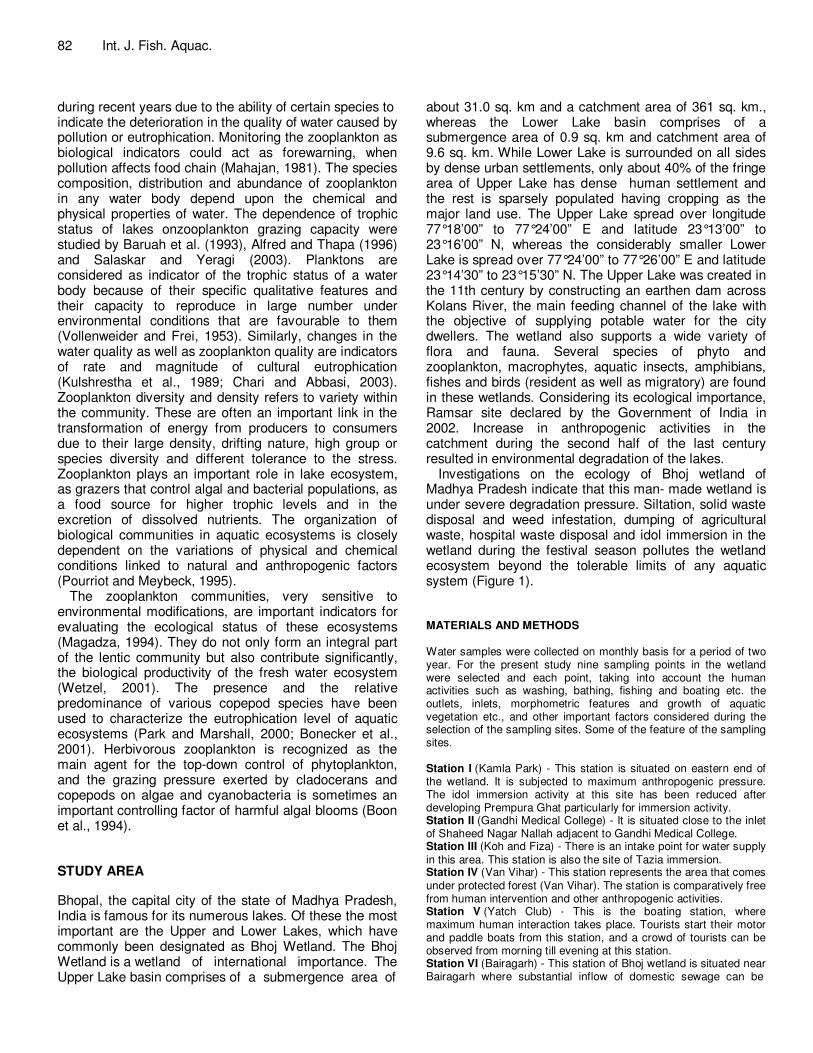
Despite the presence of a high nutrient load, other different chemical factors might have been responsible for checking the excess growth of autotrophs, leading to eutrophication. This study concluded that the water of Bhoj wetland is highly polluted by the direct contamination of sewage from nearby residential (domestic) and agricultural activities. Therefore, the water body has to be preserved for its intended use, and a sustainable and holistic management planning is necessary for the conservation of this water body. The present results provide useful information on zooplankton diversity particularly in view of the paucity of a detailed community analysis in the Indian floodplain lakes. In order to acquire better understanding of holistic environmental heterogeneity of this Ramsar site, investigations, however, need to be extended to more sampling stations with particular reference to variations in the macrophyte associations. Diversity of zooplankton species The diversity indices are all based on two assumptions: (a) stable communities have a high diversity value and unstable ones a low diversity, and (b) stability in diversity is an index of environmental integrity and wellbeing. As a consequence, the diversity value decreases with environmental degradation (Magurran, 1988). Shannon-Weaver Index is a combination of the number of species and the evenness of distribution of individuals among taxa. It may function as a sensitive indicator for pollution (Klemm et al., 1990). In the present investigation, Shannon-Wiener diversity index ranged between 0.96 in the month of January 2010 to 2.75 in the month of October 2009 during the two years of study (2008-2010) (Figure 2). The above trend can be attributed to the surrounding disturbances in the riparian zone and also increasing anthropogenic interaction in the lake. Bhoj wetland can be classified as less diverse as Shannon-Wiener index (H’) is > 2; it also indicates poor quality or pollution in the water body. McDonald (2003) stated that the value of the index ranging from 1.5 to 3.4 has low diversity and species richness while value above 3.5 has high diversity and species richness. The present study implicating that limnological processes affecting net zooplankton species diversity operated almost equally throughout the surface water column of the water body and across all seasons.
Zooplankton assessment is an important indicator of aquatic community structuring and water conditions. Zooplankton is directly or indirectly influenced by seasonal variation of complex limnological factors. The annual quantitative study of zooplankton population depends on the succession, appearance and disappearance of component species. Periods of quantitative increase and decrease of individuals do not
Bhat et al. 91
Figure 2. Shannon-Weiner diversity index of Zooplankton species during 2008-2010.
coincide with seasonal minima and maxima of the total zooplankton. Three main zooplankton groups were identified in the study (Rotifers, Cladocera and Copepoda) constitute the zooplankton population and contributed significantly to secondary production of the wetland. Some species increases slowly and more or less uniformly to the maximum while others show an almost starting burst of development visiting from an apparent absence to a numerical dominance of the whole net zooplankton within a very short period of time. The nature of wetland is closely related with the fluctuations of the zooplankton density. The analysis of species richness and diversity indices revealed clearly the status of the water body. The rapid modification of the planktonic communities in response to environmental stress confirms the strong instability of tropical shallow ecosystems and reinforces the interest of their ecological monitoring, particularly when, as for Bhoj wetland, they have multipurpose and potentially conflicting uses (drinking water, irrigated agriculture and fishing). Conflict of Interest The authors have not declared any conflict of interest. ACKNOWLEDGEMENTS The authors deem their heartfelt gratitude to Prof. Ashwani Wanganeo, Head Department of Environmental Sciences and Limnology, Barkatullah University, Bhopal for providing necessary facilities and valuable time during manuscript preparation for his help. REFERENCES Ahmad U, Parveen S, Khan AA, Kabir HA, Mola HRA, Ganai AH (2011). Zooplankton population in relation to physico-chemical factors of a
sewage fed pond of Aligarh (UP), India. Biol. Med. 3(2):336-341. Akpan ER, Offem JO (1993). Seasonal variation in water quality of the
Cross River, Nig. Rev. Hydrobiol. Trop. 26(2):95-103. Alfred JRB, Thapa MP (1996). Limnological investigations on Ward’s
Lake-A wetland in Shillong, Meghalaya, W. E. India. Rec. Zool. Surv. India. Occa. 169:1-125.
Allan JD (1976). Life history patterns in zooplankton. Am. Natu. 110:165-180.
APHA (1998). Standard methods for the examination of water and wastewater. Washington D.C.: American Public Health Association.
APHA (2000). Standard methods for the examination of the water and waste water.21th edition. American Public Health Association.Washington Aquac. Eng. P. 19.
Arora HC (1966). Rotifera as indicators of trophic nature of environments. Hydrobiolology 27:146-149.
Baker SL (1979). Specific status of Keratella cochlearis (Gosse) and Keratella ahlastrar (Rotifera: Brachionidae): Ecological considerations. Can. J. Zool. 7(9):1719-1722.
Baloch WA (1995). Species composition, abundance and seasonal variation of zooplankton in lake Ikeda, Japan. M.Sc. Thesis, Univ. of Kagoshima, Kagoshima. pp. 87-91.
Baruah A, Singh DK, Sinha AK, Sharma UP (1993). Plankton variability of a tropical wetland, Kawar Lake (Begusarai), Bihar. J. Freshwat. Biol. 5(1):27-32.
Battish SK (1992). Freshwater zooplankton of India Oxford & IBH Publishing Co. P. 233.
Berzins B, Pejler B (1989). Rotifer occurrence in relation to temperature. Hydrobiol. 175:223-231.
Bhatt LR, Lacoul P, Lekhak HD, Jha PK (1999). Physico-chemical characteristics and phytoplanktons of Taudaha Lake, Kathmandu. Poll. Res. 18(4):353-358.
Bonecker CC, Lansac-Tôha FA, Velho LFM, Rossa DC (2001).The temporal distribution pattern of copepods in Corumbá Reservoir, State of Goiás, Brazil. Hydrobiology 454:375–384.
Boon PI, Bunn SE, Green JD, Shiel RJ (1994). Consumption of cyanobacteria by freshwater zooplankton: Implications for the success of ‘top-down’ control of cyanobacterial blooms in Australia. Aust. J. Mar. Freshw. Res. 45:875–887.
Byars JA (1960). A freshwater pond in New Zealand.Aust. J. Mari. Fres. Res.11:220-240.
Chandrashekhar SVA (1998). Ecological studies on Saroornagar communities. Ph D. Thesis (Unpublished), Osmania University, Hyderabad.
Chari KB, Abbasi SA (2003). Assessment of impact of land use changes as on the plankton community of shallow freshwater lake in South India by GIS andremotesensing. Chem. Environ. Res. 12(1-2):93-112.
Christou ED (1998). Interannual variability of copepods in a Mediterranean coastal area (Saronikkos Gulf Aegean Sea). J. Mar.

92 Int. J. Fish. Aquac.
Syst. 15:523-532. Das SS (1978). Algal weeds and their chemical control. A review. Ind. J.
Plant Prot. 4:201-208.
Dumont HJ (1983). Biogeography of rotifers. Hydrobiology 104:19-30. Edmondson WT (1959). Fresh Water Biology.2nd edition. John Willey
and Sons. New York, pp. 127-169. Edmondson NT (1965). Reproductive rates of planktonic rotifers related
to food temperature in nature. Ecology 5:61-68. Ferrari I, Farabegoli A, Mazzoni R (1989). Abundance and diversity of
planktonic rotifers in the Po river. Hydrobiology 186:201-208. Gliwicz ZM (1980). Filtering rates, ford size selection, and feeding rates
in cladocerans-another aspect of interspecific competition in filter-feeding zooplankton. In: Kerfoot W. C., editor. Evolution and Ecology of Zooplankton Communities. Hanover, NH: University Press of New England. pp. 282-291.
Gonzalves EA, Joshi DB (1946). Fresh water algae near Bombay.The seasonal succession of algae in a tank of Bandra.J. Bomb. Nat. Hist. Soc. 46:154-176.
Gulati RD (1990). Structural and grazing response of zooplankton community to biomanipulation of some Dutch water bodies. Hydrobiologia. 201:99-118.
Gupta S (1989). Pollution ecology of some ponds in urban vicinity of Jodhpur. Ph. D. Thesis (Unpublished) University of Jodhpur, P. 234.
Hansson LA, NicolleN, BrodersenJ, Romare P, Nilsson PA, Brönmark C (2007). Consequences of fish predation, migration, and juvenile ontogeny on zooplankton spring dynamics. Limnol. Oceanogr. 52:696-706.
Hujare MS (2005). Hydrobiological studies on some eater reservoirs of HatkanangaleTahsil (Maharashtra). Ph.D Thesis, Shivaji University, Kolhapur, India.
Iqbal M, Kazmi A (1990). Cladocera of Hub with notes on species and size composition. Sarhad J. Agric. 6(1):85-88.
Iqbal SA, Katariya HC (1995). Physico-chemical analysis and water quality assessment of Upper lake of Bhopal. Ind. J. Environ. Protect. 15(7):504-509.
Joshi G (1987). Diurnal studies of physico–chemical properties of limnological importance. Ph. D. Thesis (Unpublished). Vidhyalaya, Sagar, P. 204.
Karabin A (1985). Pelagic zooplankton (Rotatoria+Crustacea) variation in the process of lake eutrophication. II. Modifying effect of biotic agents. Ekol. Pol. 33:617-644.
Kataria HC, Quershi HA, Iqbal SA, Shandilya AK (1996). Assessment of water quality of Kolar reservoir in Bhopal (M.P.). Poll. Res. 15(2):191-193.
Kawecka B, Eloranta PVW (1994). PWN Scientific Publishers. The outline of algae ecology in freshwater and terrestrial environments. pp. 1-252.
Kawo AH (2005). Algal Dynamics and Limnological parameters of Salanta River, Kano, Nigeria. Biological and Environmental Sciences J. Trop. BEST 2(1):101-104.
Khan RA (2002).The ecology and faunal diversity of two floodplain ox-bow lakes of southeastern west Bengal.Zool. Survey of India. 194:1-104.
Klemm DJ, Lewis PA, Fulk F, Lazorchak JM (1990). Macroinvertebrate field and laboratory methods for evaluating the biological integrity of surface waters.U.S Environmental Protection Agency, Environmental Monitoring and Support Laboratory, Cincinnati, Ohio, P. 99.
Koshy M, Nayar TV (2000). Water quality of River Pamba at Kozencherry. Poll. Res.19(4):665-668.
Kozak A, Gołdyn R (2004). Zooplankton versus phyto- and bacterio plankton in the Maltański Reservoir (Poland) during an extensive biomanipulation experiment. J. Plankton. Res. 26:37-48.
Kulshrestha SK, Adholia UN, Bhatnagar A, Khan AA, Saxena M,Baghail M(1989). Studies on pollution in River Kshipra: Zooplanktons in relation to waterquality. Int. J. Ecol. Environ. Sci. 15:27-36.
Kulshrestha SK, George MP, Saxena R, Johri M,Shrivsatava M (1992). Seasonal variation in the limno-chemical characteristics of Mansarovar reservoir of Bhopal. In: Mishra, S.R and Saksena, D.N (eds), Aquatic Ecology. Ashish Publishing House, New Delhi, pp. 275-292.
Kumar DS, Sukumar NC, Jana C, Philipose MT (2006). Study on physico-chemical characteristics of Thunga River. Phykos. 32:27-39.
Kurbatova SA (2005). Response of microcosm zooplankton to
acidification; Izv.Akad.Nauk. Ser. Biol. 1:100-108. Lashari KH, Korai AL, Sahato GA, Kazi TG (2009). Limnological studies
of Keenjhar Lake, District, Thatta, Sindh, Pakistan. Pak. J. Anal. Environ. Chem. 10(1&2):39-47.
Magadza CHD (1994). Evaluation of eutrophication control in Lake Chivero, Zimbabwe, by multivariate analysis of zooplankton. Hydrobiology 272:277–292.
Magurran A (1988). Ecological diversity and its measurement.Princeton University Press.
Mahajan CL (1981). Zooplankton as indicators for assessment of water pollution. In WHO sponsored workshop on Biological Indicators and Indices of Environmental Pollution. Cent. Bd. Prev. cont. Poll./ Osmania University, Hyderabad, India. pp. 138- 148.
McDonald K (2003). The abundance of herbivorous and predatory fishes in relation to Diademaantillarumalong the west coast of Dominica.ITME Research Reports. pp. 11-21.
Meijer LL (2000). The Netherlands: Ministry of Transport, Public Works and Water Management, Institute for Inland Water Management and Waste Water Treatment (RIZA). Biomanipulation in the Netherlands. 15 years of experience.
Michael RG, Sharma BK (1988). INDIAN CLADOCERA (Crustacea: Branchiopoda: Cladocea). Fauna of India and adjacent countries.Zool. Sur. India, P. 261.
Moyle JB (1949). Some indices of lake productivity. Tran. Am. Fish Soc. 76:322-334.
Needham GT, Needham PR (1962).A guide to study of fresh water biology.Pub.Holden-Day.San.Fransisco, USA.
Nogueira MG (2001). Zooplankton composition dominance and abundance as indicators environmental compartmentalization in Jurumirim reservoir (Paranapanema river), Sao Paulo, Brazil. Hydrobiology 455:1-18.
Okogwu OI, Ugwumba OA (2006).The Zooplankton and Environmental Characteristics of Ologe Lagoon, South West Nigeria. The Zoologist, 1(4):6-92.
Osborne PL, Kyle JH, Abramski MS (1987). Effects of seasonal water level changes on the chemical and biological limnology of Lake Murray, Papua New Guinea. Aust. J. Mar. Freshwat. Res. 38(3):397-408.
Padmanabha B, Belagali SL (2006). Comparative study on population dynamics of rotifers and water quality index in the lakes of Mysore.J. Nature Environ. Poll. Tech. 5:107-109.
Paliwal AK (2005). Seasonal variation in freshwater protozoans in Kali-Nadi, District Etah, U.P. India, Pawar, S. K and J. S. Pulle (eds). Daya Publishing House, Delhi, Ecol. Plankton. P. 294.
Park GS, Marshall HG (2000). Estuarine relationships between zooplankton community structure and trophic gradients. J. Plankton Res. 22:121–135.
Pennak RW (1978). Freshwater invertebrates of the United State. 2nd Ed., John Willy and Sons, New York, USA, P. 803.
Pontin RM (1978). A key to the freshwater plankton and semi-planktonic rotifer of the British Isles: Freshwater Biological Association Scientific Publication, P. 38.
Pourriot R, Meybeck M (1995). Zonation physique, chimiqueetécologiquedans les lacs. In: R. Pourriot and M. Meybeck
(eds.), Limnologiegénérale. Masson.Collection d’Ecologie. pp. 404–410.
Rajshekhar AU, Lingaiah MS, Satyanarayana R, Ravi SP (2007). The studies on water quality parameters of minor reservoir, Nadergul, Rangareddydistict. A. P. J. Aqua. Biol. 21(2):113-117.
Richman S (1958). The transformation of energy by Daphnia pulex.
Ecol. Monogr. .28:273-291. Robinson C (2004). Evaluating the applicability of the Wetland
Zooplankton Index (WZI) to Georgian Bay Wetlands, Final Report for Biology, 4F06.
Salaskar PB, Yeragi SG (2003). Seasonal fluctuations of plankton population correlated with physico-chemical factors in Powai Lake, Mumbai, Maharastra. J. Aquat. Biol. 18(1):19-22.
Sampaio EV, Rocha O, Matsumura T, Tundisi JG (2002). Composition and abundance of zooplankton in the limnetic zone of seven reservoirs of the Paranapanema River, Brazil. Braz. J. Biol. 62:525-545.

Saxena S (1998). Settling studies on pulp and paper mill
wastewater.Ind. J. Environ. Hlth. 20:273-270. Segers H (2003). A biogeographical analysis of rotifers of the genus
Trichocerca Lamarck, 1801 with notes on taxonomy. Hydrobiology 500:103-114.
Selgeby JH (1974). Littoral zooplankton of the Apostle Islands region of Lake Superior, May–December, 1971.Great Lakes Fish. Lab. Admin. Rep. U.S. Fish and Wildlife Service, Ashland, WI.
Shannon CE, Weaver W (1949).The mathematical theory of communication. University of Illinois Press, Urbana, IL.
Sharma BK (1999). Freshwater Rotifers (Rotifera: Eurotatoria) Zoological Survey of India. State Fauna Series 3, Fauna of West Bengal, Part 11: 341-468.
Sharma LL, Sarang S (2004). Physico-chemical limnology and productivity of Jaisamandlake, Udaipur (Rajasthan). Poll. Res.
23(1):87-92. Sharma PC, Pant MC (1985). Species composition of zooplankton in
two Kumaun Himalayan lakes (UP, India). Arch Hydrobiol. 102:387-
403. Shinde SE, Pathan TS, Raut KS, More PR,Sonawane DL (2010).
Seasonal variations in physico-chemical characteristics of Harsool-Savangi Dam, District Aurangabad, India. The Ecosca. 4(1):37-44.
Singh RP, Balasingh GSR (2011).Limnological studies of Kodaikanallake (Dindugal District), in special reference to phytoplankton diversity. Ind. J. Fund. Appl. Life Sci. 1(3):112-118.
Singh RN, Jeet S, Davies RW (1986). The physico-chemical environment and the plankton of managed ponds in Haryana, India. Proc. Indian Acad. Sci. India 95(B):353-363.
Singh RN, Jeet S, Davies RW (1986). The physico-chemical environment and the plankton of managed ponds in Haryana, India. Proc. Indian Acad. Sci. India 95(B):353-363.
Sladecek V (1983). Rotifer as indicators of water quality. Hydrobiology 100:169-171.
Sommer U, Sommer F, Santer B (2003).Daphnia versus copepod impact on summer phytoplankton: functional compensation at both trophic levels. Oecologia 135:639-647.
Sorgensen H (1948). Studies on the ecology of Danish water and bog mosses, Dansk. Bot. Ar. K. pp. 12:10.
Subla BA, Wanganeo A, Raina R, Vishen N, Zutshi DP (1992). Studies on zooplankton of Jammu and Kashmir State. In S. Nath (ed.). Rec. Advan. Fish Ecol. Conserv. pp. 33-49.
Swar DB, Fernando CH (1980). Some studies on the ecology of limnetic crustacean zooplankton in lake Begnas and Rupa, Pokhara valley, Nepal. Hydrobiology 70:235-245.
Syuhei B (1994). Effect of temperature and food concentration on post- embryonic development, egg production and adult body size of calanoid copepod Eurytemora affinis. J. Plankton Res. 16(6):721-735.
Tanner CC, Craggs RJ, Sukias JP, Park JB (2005). Comparison of maturation ponds and constructed wetlands as the find stage of an advanced pond system. Water Sci. Technol. 51:307-314.
Urabe J (1991). Effect of food concentration on growth, reproduction and survivorship of Bosmina longirostris (Cladocera): an experimental study. Fresh Wat. Biol. 25:1-8.
Usha C (1997). Observations on community analysis of zooplankton from Gandhi Sagar reservoir. Mandsaaur M. P. India. pp. 21-32.
Uye S, Shimazu T, Yamamuro M, Ishitobi Y, Kamiya H (2000). Geographical and seasonal variations in mezozooplankton abundance and biomass in relation to environmental parameters in lake Shinji-Ohashi River-Lake Nakaumibrackisw water system Japan. J. Mar. Syst. 26(2):193-207.
Verma SR, Sharma P, Tyagi A, Rani S, Gupta AK,Dalela RC (1984). Pollution and saprobic status of Eastern Kalinandi.Limnologia. 15:69-133.
Victor R, Fernando CH (1979). The fresh water Ostracoda (Crustacea: Ostracoda) of India. Records of the zoological survey of India. 74(2):147-242.
Vollenweider RA, Frei M (1953). Vertikale and ZeitlicheVerteilung der Leitfahigkeit in einemeutrophen Gewasserwahrend der sommerstagnation. Schweiz. Z. Hydrology 15:58-67.
Bhat et al. 93 Wadajo K (1982). Comparative limnology of lake Abiata and lake
Langano in relation to primary and secondary production M.Sc. Thesis (Unpublished) Addis Abeda University Ethiopia, P. 162.
Wadajo K, Belay S (1984). Species composition and seasonal abundance of zooplankton in two Ethiopian Rift Valley lakes, Abiata and Langano. Hydrobiology 113:129-136.
Wanganeo A, Wanganeo R (2006). Variation in zooplankton population in two morphologically dissimilar rural lakes of Kashmir Himalayas. Proc. Nat. Acad. Sci. India. 76:222-239.
Wanganeo A (1998). Impact of anthropogenic activities on Bhoj wetland with particular emphasis on nutrient dynamics. Project report submitted to MOEF, New Delhi.
Webber MK, Roff JC (1995).Annual biomass and production of the oceanic copepod community off Discovery Bay Jamaica.Mar. Biol. 123:481-495.
Welcomme RL (1979). Fisheries ecology of flood plain rivers. Longmans, London.
Wetzel RG (2001). Limnology: Lake and River Ecosystems. 3rd ed. Academic Press 277 N.Y. P. 1006.
Wetzel RG (1983). Limnology. Sanders College Publishing, New York, P. 753.

Vol. 7(6), pp. 94-106, June 2015
DOI: 10.5897/IJFA14.0461
Article Number: 4E9E4F253580
ISSN 2006-9839
Copyright ©2015
Author(s) retain the copyright of this article http://www.academicjournals.org/IJFA
International Journal of Fisheries and Aquaculture
Full Length Research Paper
Influence of environmental variables on the relative abundance and habitat use of two sympatric
notobranchiid fishes in a tropical stream
B. D. Olaosebikan1*, S. L. Lamai2 and O. Ibikunle2
1Federal College of Freshwater Fisheries Technology, PMB 1500, New-Bussa, Nigeria.
2Department of Water resources Aquaculture and Fisheries Technology (WAFT), Federal University of Technology,
Minna, Nigeria.
Received 14 November, 2014; Accepted 21 April, 2015
Effect of environmental variables on the population dynamics of two sympatric notobranchiid fishes, Epiplatys bifasciatus and E. spilargyreius in the seasonal Monai Stream of the Kainji Lake Basin in Nigeria were studied for 24 months. In all, 2,544 and 937 specimens of E. bifasciatus and E. spilargyreius were collected respectively. E. bifasciatus was more abundant of the two species throughout the study period. For both species, monthly abundance followed the same pattern; May to October (rainy season) was a period of low abundance while November to April (dry season) was a period of high abundance. Relative abundance was correlated with physical, chemical, and biological factors using regression analyses. The relationship between 12 environmental variables (temperature, transparency, conductivity, hydrology, dissolved oxygen, pH, nitrogen, phosphate, potassium, sodium, CaCO3, chlorine) and abundance of the two species showed that E. spilargyreius abundance was strongly correlated with water conductivity (Pearson’s coefficient, r = 0.884, P<0.01) but correlated negatively with temperature (Pearson’s coefficient, r = -0.559 at P< 0.05). E. bifasciatus abundance had a slight positive correlation with alkalinity (r = 0.501 at P< 0.05). Three habitat types (vegetated pool, vegetated riffle, and marsh) were preferred by both species, whilst unvegetated habitats were avoided. E. spilargyreius was fairly specific in its habitat preference, with a significant positive correlation (r = 0.65, P < 0.05) to marshy habitat, whereas E. bifasciatus showed some flexibility in habitat-use. Key words: Epiplatys bifasciatus, Epiplatys spilargyreius, population, abundance, killifish, stream fishes, environmental variables, habitat-use.
INTRODUCTION Biodiversity, species richness, density of populations are results of a multitude of environmental variables (Wagner et al., 2000). Different studies have investigated the relationships between biotic and abiotic factors, including
geological factors, land cover and land use types, hydrological factors, stream habitat characteristics, stream order, and water quality on the biodiversity, individual species and even populations (Shahadat
*Corresponding author. E-mail: [email protected]
Author(s) agree that this article remain permanently open access under the terms of the Creative Commons
Attribution License 4.0 International License

et al., 2012; Barros et al., 2013; Yong-Su Kwon et al., 2012; Humpl and Pivnicka, 2006; Kouamélan et al., 2003). According to Yong-Su Kwon et al. (2012), these environmental factors are considered in a hierarchical structure ranging from large scale to small scale. Large-scale factors (that is, landscape features) affect small-scale factors (that is, microhabitat conditions and water quality, which have important influences on the distribution and abundance of organisms). These studies are of importance to fisheries managers and for engineers dealing with stream and river channels (Yong-Su Kwon et al., 2012; Park et al., 2005, 2006; Maret et al., 1997).
Studies on the influence of environmental variables on the existence and abundance of stream fishes has been done in the temperate regions but few has been conducted in the tropics especially Africa (Koel and Peterka, 2003; Toham and Teugels, 1997; Barros et al., 2013; Yong-Su Kwon et al., 2012; Humpl and Pivnicka, 2006; Kouamélan et al., 2003). Streams, swamps, small rivers and seasonal pools are generally extreme and highly variable even when not anthropogenically influenced (Ostrand and Wilde, 2002). Evaluation of the impact of environmental variables on fish in human-altered stream especially in the tropics has been largely overlooked.
Studies on interspecific competition among stream fishes in Africa has received little attention even when such studies provide insight into coexistence of different species in an assemblage and addresses the more general question of how biodiversity is created and maintained. Opinion differs over the major processes affecting coexistence among stream fishes especially among sympatric species, which some investigators attribute to partitioning of resources such as food, space and risk of predation (Paine et al., 1982; Herbold, 1984; Schlosser, 1987; Persson and Greenberg, 1991; Hayse and Wissing, 1996; Jordan et al., 2000; Jordan, 2002; Santos et al., 2004). Others however maintain that resource partitioning may not be of major importance to stream fishes, due to frequency of natural disturbances such as flood and drought (Grossman et al., 1982; Grossman and Freeman, 1987; Heck and Crowder, 1991; Grossman and de Sostoa, 1996; Kramer et al., 1983). Most studies on habitat use have been on temperate fishes while in most tropical streams, habitat preference or factors causing it have received little interest (Grossman and Freeman, 1987; Baltz et al., 1991).
Habitat alteration is one of the consequences of man-made lakes resulting in the loss of diversity, habitat degradation, destruction or the loss of specific habitats. The ecological study of the ichthyofauna confined in reservoirs compared with their counterparts inhabiting streams is of high scientific value, because this constitutes a natural reference for investigating adaptations adopted by species (Oliva-Paterna et al., 2003). Prior to the construction of Kainji Dam in Nigeria
Olaosebikan et al. 95 (West Africa) and subsequent formation of Kainji Lake in 1968, the order Cyprinodontiformes was represented in the Kainji Lake area (Niger River, Nigeria) by two nothobranchiids (Two-striped panchax, Epiplatys bifasciatus (Steindachner, 1881) and the Senegal or green panchax Epiplatys spilargyreius (Duméril, 1861), and a poeciliid, Poropanchax normani Ahl 1928 (Daget, 1962; Banks et al., 1965). However, following the inundation of the extensive swamps and some tributaries of the Niger River by the newly created lake, these species disappeared in the new lentic environment (Imevbore and Bakare, 1974). In 2001, E. bifasciatus and E. spilargyreius were located in a small grassy stream, approximately 1.9 km long, flowing into the lower western portion of the lake at 9°53′45′′ N, 4°33′14′′ E near Monai village, a few kilometers upstream from the Kainji Dam. The Monai Stream is annually inundated by the lake up to half its length, during which period the two species can be found in the lake itself. A survey of the streams around the lake basin shows E. bifasciatus alone occurring in perennial riparian streams and E. spilargyreius in small marginal swamps but nowhere did the two species occur together except in the Monai Stream. It thus indicates that Kainji Lake constituted in part a geographical barrier that created their sympatry and also prevents the two populations from colonizing and dispersing into nearby adjourning streams. The two populations therefore represent isolated unique relic and the stream, a refuge where both species are found together with potential inbreeding depression and interspecific hybridization.
The existence of these two notobranchiid species in a reservoir locked stream provided a natural laboratory to study the impact of man-made lake on inundated streams. The life history and population dynamics of these two fish populations has been studied (Olaosebikan et al., 2006; Olaosebikan, 2007; Olaosebikan et al., 2009; Nwafili et al., 2009). The objective of this present study is to investigate the environmental factors that are important in the survival and abundance of these two fishes in Monai Stream. We hypothesize that: (i) relative abundance of E. bifasciatus and E. spilargyreius is directly related to environmental factors (Temperature, Transparency, Conductivity, Hydrology, Dissolved oxygen, pH, Nitrogen, Phosphate, Potassium, Sodium, CaCO3, Chlorine); (ii) relative abundance of E. bifasciatus and E. spilargyreius is directly related to their species-specific microhabitat use. MATERIALS AND METHODS Description of the Monai Stream
The Monai Stream in which the Epiplatys bifasciatus and E.
spilargyreius are found is at the narrow lower portion of the Lake Kainji, Nigeria near the dam site at latitude 09° 53 45’N and longitude 04° 33 14’E by Monai village (Figure 1). Kainji Lake has
been described by many authors (Lelek, 1972; Imevbore and Bakare, 1974; Ita, 1978; Sagua and Fregene, 1979). The stream is

96 Int. J. Fish. Aquac.
Figure 1. Map showing the location of the Monai
Stream.
a seasonal first order stream of about 2 km in length and it can be divided into two parts; the lower half that is flooded annually by Lake Kainji from September to March and upper portion that is fed by rainfall and leaking municipal water pipes. It has ten perennial pools with average surface area of 25 m
2 and average depth of 0.4
m. Two of these pools are located upstream of the leaking
municipal water pipes and are usually dry from February to June; the third is situated under the first leaking pipes while the rest are downstream of the two municipal water pipes. The first four pools are never flooded with the lake’s water throughout the year while the others are flooded between September and February. The rate of flow is negligible except at the height of rainy season. In between the pools are a narrow ripple of one meter maximum width and marshes. The bottom is muddy in the pools with a lot of decaying organic matter while the ripple bottom is compact clay and sand. The marshy and the stream banks that is sometimes used for rice farming is covered with dense grasses (Leersia hexandra,
Alternanthera sessilis) and Cyperus (Mariscus longibracteatus). The in-stream vegetation include emergent plants (Ecliptica alba,
Echinocloa spp. Ipomoea aquatica and Ludwigia spp.), floating plants (Azolla, Nympha lotus) and submerged plants (Ceratophyllum spp. and filamentous algae).
The composition of fauna varies seasonally but consists
principally of Clarias anguillaris, Hemichromis bimaculatus, H.
fasciatus, Oreochromis niloticus, Coptodon zilli, Parachanna
obscura, and Polyterus senegalus whilethe invertebrates include rotifer (Filinia, Brachionus and Asplanchna); copepods, Cladocerans, Gastropod (Pila and Bulinus), insects of the orders; Diptera, Coleoptera, Odonata and Hemiptera and aquatic mites. Sampling design
Four sampling stations were chosen on the longitudinal gradient of the stream: station I (This is situated at pool 2 and is located
upstream of the leaking pipes); station II (this is located at pool 3 situated under the first leaking pipes); station III located 50 m downstream of the leaking pipes and station IV situated at the last pool (no. 10) nearest to the Lake. These stations were chosen taking into account the different terrestrial land use, the influence of municipal water pipe leakages and lakes’ hydrology. Fish population abundance estimate
Sampling was conducted monthly from January 2003 to December 2004. Sample reaches (Figure 1) ranged from 10 to 30 m depending on the stream hydrology. On each sampling occasion,
both E. bifasciatus and E. spilargyreius were netted using a scoop-net with a mouth diameter of 30 cm, a net basket of 45 cm in length and a 2 mm mesh size, operated for 30±5 min. The sampling was done by the same person throughout the study to reduce bias in fishing efficiency. A scoop-net was used because the shore-hugging and surface-dwelling habit of these fishes makes them visible and easy to catch, whereas the abundance of aquatic vegetation in the stream makes it difficult to use a seine net and traps are ineffective because the species cannot be attracted into
them by bait. The fishes are released back to the stations where they were caught after length, weight and other biological parameters of each fish have been taken. This was done in order not to deplete their population. Simple descriptive statistics were used to report the monthly abundance of the two species. Physicochemical parameters
Physico-chemical parameters of the stream were taken monthly between the hours of 9.00 - 11.00 a.m. for three years (2002 to 2004). Three 1 L plastic containers were used to take monthly water sample at each site and were analyzed for dissolved Oxygen (DO), pH, Nitrogen, Phosphate, Potassium, Sodium, CaCO3 (mg/L) and Chlorine (mg/L) at the Department of Water Resources Aquaculture and Fisheries (WAFT) Laboratory, Federal University of Technology, Minna, Nigeria.
Stream structure The stream width was measured using tape rule at every 100 m along the stream length while the depths of the stations were measured using calibrated (0.1 m) stick. Temperature The average of three readings of Mercury in glass thermometer (-10 to 110°C) was used as the surface temperature at each site. Transparency
A secchi disc of 20 cm diameter fitted with calibrated (0.1 m) line was lowered into the water until it just disappears and then raised up to be visible. The average reading of when the disc disappeared and when it reappeared was taken as the transparency of the water at each station. In any station where the stream depth is too shallow to use secchi disc, it is recorded as clear to bottom or the turbidity is inferred from data from other stations.
Conductivity This was measured using a benchtop conductivity meter, Jenco -
Model EC3175. The average of three readings of conductivity meter (ohms) calibrated to read a value at a standard temperature of 25°C was used as the water conductivity at each station. Dissolved oxygen (DO) The dissolved oxygen was measured with a portable Hanna DO meter. The probe was placed in the stream water after calibration at ambient temperature. The average of three readings of DO meter was used as the dissolved oxygen levels at each station.
pH
This was measured using a portable pH meter (TechPro model). The probe was placed in the stream water after calibration at the ambient temperature. The average of three readings of pH meter was used as the pH of the water at each station. Other chemical parameters
Nitrogen, phosphate and alkanility: Nitrogen and Phosphate
were determined colorimetrically using phenol disulfurnic acid and ascorbic acid methods respectively (APHA, 1995). Potassium and sodium: These were determined using a flame
photometer. A little volume of the water sample poured into 50 ml beaker and aspirated into the photometer and digitally read out.
CaCO3 (mg/L): was determined by atomic absorption
spectrophotometer. Alkalinity (mg/L): The method that was used for this water
parameter is those described by APHA (1995). Chlorine (mg/L): The free chlorine in the water was measured using Chlorine colorimeter 1200 Lamotte. The chlorine content of
municipal water was compared to those taken at the sampling stations). The data of physico-chemical parameters were standardized, Correlation matrix (Pearson’s method) was performed to know the inter-relationship between these parameters and the abundance of the two killifishes. Hydrology and precipitation
The hydrological regime of the Lake Kainji from year 2001 were obtained from National Electric Power Authority (NEPA) while the mean monthly rainfall of New Bussa area were obtained from National Institute for Freshwater Fisheries Research (N.I.F.F.R.), New Bussa meteorological station in order to investigate the effect of the Lake hydrology and rainfall on the Monai Stream.
Descriptive statistics were used to describe the relationship between rainfalls, stream and lake hydrology on the abundance of E. bifasciatus and E. spilargyreius. Habitat preference
Fish habitat data were collected from January to December, 2003 at four sites – pool 3, 6, 7, 9 and when the Lake floods the stream
in the Lake. The stream was separated into microhabitats of pools, riffles and marshes. Except in the Lake where there is no riffle, all the other sites have these macro-units though their sizes vary with
Olaosebikan et al. 97 the hydrology of the stream. Five microhabitat types were used to know the habitat preference of the two species. They are: Open water of pool; Vegetated portion of pool; Riffle portion with weed; Riffle portion without weed and Marshes. Fish were collected using scoop-net for 30 min at each site divided into 6±1 min at each microhabitat types. The surface dwelling habit of these fish makes it easy to know where a specimen is found and recorded accordingly, even when they escape to another microhabitat before being caught.
Analysis of variance (ANOVA) was used to determine the effects of sites, micro-habitat, month, and the interaction between habitat and month on the abundance of two species.
Subsequently, simple correlations were used to examine
relationship between micro habitat, site, month, and fish abundance. RESULTS Population dynamics of E. bifasciatus and E. spilargyreius in Monai Stream Monthly sampling by catch per unit time of 30 min at each station was done for 24 months from January 2003 to December 2004 and the result is given in Figure 2. In all, 2,544 and 937 specimens of E. bifasciatus and E. spilargyreius respectively were collected. Figure 2 indicates that E. bifasciatus is the most abundant of the two species throughout the 24 months sampling period. The abundance in year 2003 is lower than that of 2004 even though the monthly abundance followed the same pattern of high abundance from October to April and low abundance from May to September. Physicochemical parameters of Monai Stream and their relationship to fish abundance Water quality parameters varied from one site to another especially when the stream is not flowing and reduced to series of pools. The average physicochemical parameters of the Monai Stream are given in Table 1.
Mean depth varied on the average with the season and site but not very significantly. Mean temperatures (Table 1) were significantly different by months, and were highest in the months of February to May (32°C), average in months of June to October (27°C) and were lowest when northwest winds of harmattan prevailed from November to January, with a minimum of 21ºC. No site variation was observed (P>0.05). The pH and transparency of Monai Stream did vary significantly from the mean of 7.12 and 0.241 m respectively throughout the sampling period. Dissolved oxygen varied with season being lowest in the months of March, April, May and June and highest from July to February. The lowest mean values occurred in March (4 mg/L). Conductivity indicated significant variations with the season with values ranging from 7.3 to 33 mS/cm. Other variables (Nitrate, Phosphate, Chlorine, Alkalinity, Potassium, Sodium, CaCO3 (Hardness) showed significant

98 Int. J. Fish. Aquac.
Figure 2. Relative abundance of E. bifasciatus and E. spilargyreius in Monai Stream.
Table 1. Average physicochemical parameters of Monai Stream.
Parameter Range Mean Standard Error (±)
Stream depth (m) 0.25 - 0.92 0.65 0.16
Temperature (°C) 21 - 32 27.29 0.49
pH 6.25 - 7.6 7.12 0.10
Transparency (m) 0.1 - 0.45 0.241 0.015
Dissolved Oxygen (mg/L) 4 - 7 5.96 0.14
Nitrate (ppm) 2.92 - 86.15 20.71 3.81
Phosphate (ppm) 0.0015 - 5 2.56 2.06
Conductivity (mS/cm) 7.3 - 33.7 18 0.87
Chlorine (mg/L) 3.55 - 10.65 8.48 0.63
CaCO3 (Hardness) (mg/L) 0.03 - 9.4 0.070 0.041
Alkalinity (mg/L) 0.69 - 9.05 1.35 0.15
Potassium (mg/L) 0.05 - 13.5 7.95 0.94
Sodium (mg/L) 12.63 - 121.5 31.85 3.56
variation with season as shown in Table 1.
Correlation between abundance of E. bifasciatus, E. spilargyreius, twelve environmental factors (temperature, transparency, dissolved Oxygen, Nitrate, Phosphate, pH, Rainfall, conductivity, Sodium, Potassium, Alkalinity and Calcium carbonate), and the intercorrelations between these variables are presented in Table 2. Abundance of E. spilargyreius is highly correlated with conductivity (Pearson’s coefficient, r = 0.829 at P< 0.01) but negatively correlated with temperature (Pearson’s coefficient, r = -0.559 at P< 0.05). Linear relationship
between E. spilargyreius abundance and conductivity is given in Figure 3. On the other hand, E. bifasciatus abundance had a slight positive correlation with Alkalinity (Pearson’s coefficient, r = 0.501 at P< 0.05). Microhabitat preference Five microhabitat types were considered (1- Open water of pool; 2- vegetated portion of Pool; 3- Riffle portion with weed; 4- Riffle portion without weed and 5- Marshes) but
0
50
100
150
200
250
300
350
J F M A M J J A S O N D J F M A M J J A S O N D
Num
ber
of
fish
2003 2004
bifas
spil

Olaosebikan et al. 99
Figure 3. Linear relationship between E. spilargyreius abundance and water
conductivity.
Table 2. Correlation matrix of Epiplatys bifasciatus and E. spilargyreius abundance and environmental variables (Pearson’s correlation coefficient).
Environmental factors Temperature Transparency Dissolved Oxygen Nitrate Phosphate pH Rainfall Conductivity Na+ K+ Alkalinity CaCO3
Temperature 1.00
Transparency -0.202 1.00
DO -0.468 0.530 1.00
Nitrate 0.241 -0.375 -0.420 1.00
Phosphate 0.522 -0.171 -0.580* 0.737** 1.00
pH -0.492 -0.133 0.115 -0.046 -0.411 1.00
Rainfall 0.263 0.354 0.142 -0.153 -0.189 0.005 1.00
Conductivity -0.670* 0.115 0.771** -0.370 -0.554 0.333 -0.212 1.00
Na+ 0.734** 0.043 -0.112 -0.046 0.243 -0.411 0.026 -0.431 1.00
K+ -0.582* -0.502 -0.086 0.306 -0.080 0.544 -0.661* 0.265 -0.403 1.00
Alkalinity 0.435 -0.345 -0.399 -0.065 0.174 -0.196 -0.377 -0.425 0.739** 0.144 1.00
CaCO3 -0.313 0.479 0.576* 0.591* -0.686* -0.337 0.442 0.507* 0.202 -0.258 -0.373 1.00
E. bifasciatus -0.124 -0.567 -0.130 -0.184 -0.291 0.193 -0.458 0.255 0.050 0.490 0.501* 0.171
E. spilargyreius -0.559* -0.216 0.461 -0.354 -0.451 0.252 -0.297 0.829** -0.496 0.376 -0.229 0.399
(*) Denotes significant at P< 0.05 and (**) denotes significant at P<0.01.
0
10
20
30
40
50
60
70
80
5 10 15 20 25 30N
um
ber
of fish
Water Conductivity (mS/cm)

100 Int. J. Fish. Aquac. analysis could only be performed for three sites (vegetated portion of Pool; Riffle portion with weed and Marshes) where fishes were found abundant enough to merit analysis. Both species afford open pools without vegetation except when they are driven out from the vegetated areas or got stranded in a receding pool. Fish using riffle habitat without weed is uncommon, only two E. spilargyreius were recorded from this habitat in the whole year. A total of 1,157 E. bifasciatus were collected between January and December, 2003 and One-way Analysis of Variance (ANOVA) was used to determine the effects of habitat, location, month, the interaction between habitat and month, habitat and site on the abundance of the E. bifasciatus. There was significant variation in microhabitat preference of E. bifasciatus in Monai Stream (F = 4.937, P = 0.0133 at 95% significance level). More of E. bifasciatus were found in the vegetated pool microhabitat followed by vegetated riffles and least in the marshes. E. bifasciatus were rarely found in the open non- vegetated part of pools and riffles. Habitat type and month interacted weakly (F= 0.65, p = 0.768) to affect E. bifasciatus abundance. This means that the abundance of E. bifasciatus did not vary significantly between the 12 months in the three habitat types (Figure 4). Abundance of E. bifasciatus did not vary between the five sampling locations (F = 1.0127, P = 0.4518) although the availability of these habitat types varies between sampling locations..
There is also significant difference in the microhabitat use of E. spilargyreius (F=5.09, p=0.0118) between the three habitats (Vegetated portion of Pool; Riffle portion with weed; and Marshes) analyzed. There is significant difference in the preference of E. spilargyreius for the three microhabitats as shown in the LSD in Table 3. This panchax is more abundant in marshes and least in riffle with vegetation. E. spilargyreius also showed a significant variation in habitat – month interaction (F=1.18, p= 0.034) with the months of August, September, October, November, December, January, and February differing significantly from other months. The variation between months is graphically represented in Figure 5. Abundance of E. spilargyreius varies significantly between the five sampling locations (F = 1.643, P = 0.023) with more fish found in site 11 and 3, sites where marsh is more available.
Table 4 gives the summary of the relationship between abundance of the two fish in the three habitats and the month of the year. The relationship between abundance in the three habitats and months is not significant at p = 0.05 for E. bifasciatus. However, the abundance of E. spilargyreius is positively correlated to marsh microhabitat (r = 0.65, p = 0.022). Effect of rainfall on fish abundance The average rainfall in New-Bussa area is 1500 mm per
annum spread over 6 months. The rainy season is between May and October while the dry season can be divided into harmattan (November to January) and heat (February to April) periods. The monthly abundance of the two killifish in 2003 and 2004 are compared with the monthly rainfall for the same period (Figure 6). The effect of precipitation on Monai Stream is shown by high water flow during the rainy season and non-flow with the stream breaking into series of pools in the dry season.
It can be deduced that the two species make use of the rainy season for recruitment as can be seen from the increase in their abundance at the height of rainy season from September. The period of least abundance is June and July when the effect of the rainfall is only reflected in stream flow and not in the flooding of the suitable vegetated breeding sites of the two species. The poor rainfall in 2002 that was not enough for the stream to have water precluded the recruitment of the two species during the rainy season of that year resulting in the low abundance of E. spilargyreius in early 2003. E. bifasciatus on the other hand was able to use the flood of the lake to recruit in 2002/2003 and is indicated by their abundance early 2003 and 2004. Effect of Kainji Lake hydrology on E. bifasciatus and E. spilargyreius populations in Monai Stream Kainji Lake experiences two flood regimes namely the white (flood resulting from rainfall within Nigeria characterized by high turbidity) and black floods (flood resulting from upper reaches of Niger River characterized by high transparency) , the intensity of each flood for the years 2001 to 2004 are shown in Figure 7. The amplitude of the local white flood is usually bigger but is not enough to flood the stream habitat of the killies whereas the black flood resulting from rainfall in the upper catchment of River Niger gets to Nigeria in December and persist enough to flood the Monai Stream.
Kainji Lake has effects on the two populations of notobranchids in Monai Stream in two ways: Firstly, they utilize the lake flood for recruitment (mainly E. bifasciatus) as mentioned earlier. Secondly, the lake acts as a geographical barrier preventing lateral connectivity between the Monai Stream and other streams thereby impeding the two killifish from colonizing other streams in the area. The only connection between these streams is the Lake. Although the conditions in these other streams may not be able to sustain these fishes in the dry season as they dry up completely and lack perennial pools that can serve as refugia for these fish in the dry season. During the rainy season when these streams are flowing, the lake on the other hand is at its lowest level and being devoid of protective aquatic plants at this period it presents a hostile corridor for these fish to disperse into adjoining streams. It is at this time also that the two fishes experience their lowest population abundance.

Olaosebikan et al. 101
Figure 4. Monthly abundance of E. bifasciatus within three habitats types.
Table 3. LSD test for means of habitats at 95% level of significance.
Species Habitat Difference between Means LSD Declaration
E. bifasciatus
Marshes 13.75 20.92 Not significant
Riffle + vegetation 18.50 20.92 Not significant
*Pool + vegetation 48.75 20.92 Significant
E. spilargyreius
*Marshes 17.25 7.66 Significant
Riffle + vegetation 4.25 7.66 Not significant
Pool + vegetation 6.00 7.66 Significant
Figure 5. Monthly abundance of E. spilargyreius within three habitat types.
0
20
40
60
80
100
120
J F M A M J J A S O N D
Nu
mb
er
of
ind
ivid
uals
p
er
CP
UE
Month
pool +veg.
riffles + weed
Marshes
0
5
10
15
20
25
30
35
40
45
50
J F M A M J J A S O N D
Nu
mbe
r of i
ndi
vidu
als
per C
PU
E
Months
pool +veg.
riff les + weed
Marshes

102 Int. J. Fish. Aquac.
Table 4. The relationship between E. bifasciatus and E. spilargyreius abundance and different microhabitats (Asterisks denote statistically significant correlation when P< 0.05).
Species Habitat R P<0.05
E. bifasciatus
Pool + Vegetation 0.276 0.38
Riffles + Vegetation -0.21 0.50
Marsh 0.50 0.096
E. spilargyreius
Pool + Vegetation 0.28 0.378
Riffles + Vegetation 0.19 0.545
Marsh 0.65 0.022*
Figure 6. Comparative abundance of E. bifasciatus, E. spilargyreius and rainfall in New Bussa area.
Figure 7. Monthly water inflow into the Kainji Lake from 2001 to 2004.
DISCUSSION Species could not persist in a specific ecosystem if they are intolerant of the range of variation in environmental
and biological conditions that the system naturally faces or creates (Leveque, 1997). Every freshwater ecosystem experiences a combination of ecological factors which include hydrological regime, water chemistry regime,
0
50
100
150
200
250
300
350
J F M A M J J A S O N D J F M A M J J A S O N D
Rain
fall
(mm
)
num
ber
of fish
2003 2004
bifas
spil
rainfall
0
500
1000
1500
2000
2500
3000
3500
4000
Volu
me (
M3/s
ec.
)
2001 2002 2003 2004
Vo
lum
e (m
3/s
)

physical habitat condition, connectivity and biological composition. It is these factors that were studied in relation to the habitat restricted populations of Epiplatys bifasciatus and E. spilargyreius in Monai Stream of Kainji Reservoir in Nigeria. Water quality attributes are prime factors that influences fish survival, abundance, reproduction, growth performance and overall biological production (Harding et al., 1999; Odulate et al., 2014). Of the 12 environmental variables studied in relationship with relative abundance of these two notobranchiids relatively few variables have profound effects them in this stream. The abundance of E. spilargyreius which had a strong correlation with conductivity is consistent with its microhabitat preference of marshes. Marshes are characterized by high nutrient load and low dissolved oxygen. The anatomical features of notobranchiids generally, such as flattened head, small body size and upturned mouth enables them to exploit the oxygen-rich surface film of water which is relatively rich in oxygen because of diffusion from the atmosphere. Other fishes like Synodontis membranaceous and S. batensoda (Green, 1977), as well as Sarotherodon (Benech and Lek, 1981) behaviorally utilized the same rich surface oxygen. The Synodontis do this by turning upside down and gulping at water surface. The result obtained for E. spilargyreius is similar to those of Ostrand and Wilde (2001) study on the streams of Texas, which shows that two cyprinodonts (Red River pupfish and Plain Killifish), the most abundant fishes in the system have strong relationship with high conductivity, low current flow and turbidity and shallow sites. Gratwicke et al. (2003) also observed similar relationships between conductivity and number of species in Manyame catchment of Zimbabwe, except that the number of species declined above 400 µS cm
-1. Taylor et al. (1993) studied the relationships
between fish species and environmental factors in the upper Red River basin, southwestern Oklahoma and predicted communities along gradients which were similar to those found important in the present study, including conductivity, stream size, and water clarity.
Olaosebikan (2007) and Olaosebikan et al. (2009) reported that E. bifasciatus and E. spilargyreius have a density-independent have recruitment patterns, which depended on abiotic factors like the availability of food, space, rainfall and flood seasonality. The importance of environmental factors on recruitment is widely recognized (Eckmann et al., 1988; Welcomme, 2001). Loftus and Kushlan (1987) observed that small-sized fishes living in an unstable environment such as an intermittent stream, recruit throughout the year, with the effect of seasonality usually mediated by such factor like the water level. Hydrology is one of the main driving forces in aquatic ecology and this is strongly depended on the amount of rainfall, its fate and distribution patterns. Small streams generally show considerable variation in flow rate in relation to rainfall over the year and in Nigeria savannah region tends to concentrate within the June to September
Olaosebikan et al. 103 of each year. The two nothobranchiids exhibit flexibility in utilizing both the stream and lake hydrology for their recruitment. Although the lake’s hydrological regime produces more recruits into the populations of the two fishes than does the stream, many of them usually ended up in the in hostile environment of the lake when the water draws down between March and July. The bulk of these recruits are therefore not available when the stream’s water level is conducive for recruitment in July and September. Besides at drawdown the exposed stream channel is devoid of in-stream vegetations cover for these fish thus exposing them to aerial predation from birds and other animals. Increasing multi-sectoral demands on water resources have led to water abstraction and transfer activities, and the construction of dams and embankments that have significantly altered the flood regimes of rivers throughout the world resulting in the loss of fish production and biodiversity (Welcomme, 2001). According to Rosenfeld (2003), understanding and managing human impacts on fish require a clear understanding of the relationship between a species and it environment. Despite a long history of study, predicting and assessing the impact of anthropogenic activities on stream fish communities is still difficult (Wootton et al., 2000). The current emphasis on sustainable development and biodiversity conservation is leading efforts to mitigate these impacts by means of interventions such as the release of artificial floods downstream of dams and the manipulation of water levels within impounded floodplains (Matthews et al., 1992). Whilst much work has been done to determine the hydrological requirements for the maintenance of salmonid populations, few equivalent studies are available from which to develop criteria for the management of hydrological regimes for fishes and fisheries in river systems (Welcomme, 2001). There were about 500 km
2 of seasonal swamps in the Niger River
area now covered by Lake Kainji. Though they had an annual life of six to nine months, they had a great effect on the general biological economy of the river (Imevbore and Bakare, 1974). Reed et al. (1967) estimated that these swamps contributed over 50% of fish catch made by the fishermen in the middle Niger valley besides serving as both breeding and feeding ground for most of the riverine fishes. However, the large drawdown of the Lake water prevented the formation of marginal swamps resulting in the decline of swamp species (Imevbore and Bakare, 1974). In Southern Florida, small-sized fishes (<50 mm mainly cyprinodonts) like E. bifasciatus and E. spilargyreius, that have short life span and respond quickly to environmental perturbations have been used as indicators of habitat alteration and ecosystem function (Jordan et al., 1997, 1998).
The abundance of the two notobranchiids in synchrony with increase in water level and precipitation agreed with what has been observed for cyprinodonts of Okavango River, Namibia by Hoccut and Johnson (2001).
Microhabitat use is among the most easily observed

104 Int. J. Fish. Aquac. manifestations of specialization and plasticity in freshwater fishes, and availability of suitable habitat can influence fish behaviour and metabolism (Fischer, 2000). Recent studies of patterns of habitat use include (Jordan et al., 1998; Jordan et al., 2000; Mallet et al., 2000; Yu and Lee, 2002; Copp, 1992; Santos et al., 2004; Gursoy et al., 2010). In the Monai Stream studied, E. bifasciatus and E. spilargyreius are found in vegetated pool, vegetated riffle and marshes depending on the availability of these habitats in the year. However, there is clear preference for a particular habitat by the two species in months in which the three habitat types are available. This study indicates that E. bifasciatus prefers vegetated pool followed by vegetated riffle while E. spilargyreius on the other hand prefers marshes followed by vegetated pool. Observation of the microhabitat use of other E. bifasciatus populations in Shagwa and Auna (northeast of Kainji Lake) indicated they prefer ripples with weeds. However in Monai Stream, which is not perennial in terms of flow, the two tend to use vegetated pool, which is available throughout the year in the stream, especially during the dry season when other preferred habitats are scarce. This agrees with Grossman and Freeman (1987) that when habitat is largely unstable and unpredictable due to occurrence of natural or human disturbances, species display high microhabitat overlap. Guma’a (1982) reported that E. bifasciatus in southern Sudan are restricted to slow-flowing and stagnant waters, usually taking shelter underneath floating weeds such as Eichhornia crassippes and water lilies and never recorded from open water. Loiselle (1969) found them in both shallow areas and fringes of dense masses of Ceratophyllum sp. and Myriophyllum of Zio River in Togo. Considering that E. bifasciatus and E. spilargyreius have the same geographical range (Wildekamp, 1996) and belongs to the same genus it will suggest that they will have similar pattern of in-stream distribution and abundance but E. bifasciatus is more abundant in Monai Stream and widely distributed among perennial streams around the Kainji lake basin than E. spilargyreius. This may be due to greater specialization in microhabitat preference, which is reflected in E. spilargyreius relative rarity in the streams around the Lake and its low abundance in Monai Stream. Even though many environmental variables have been considered to be important for influencing habitat preference by fish in aquatic ecosystems, fish innately still prefers one to others (Hynes, 1970; Moyle and Cech, 1988; Yu and Lee, 2002). Yu and Peters (1997) indicate that habitat availability affects habitat selection by fish. There is considerable overlap between the habitat preferences of these two species even when having their preferred habitat available.
Preference for vegetated portion of stream by the two fishes appears to be either an innate or learned anti-predatory response. This is confirmed by the study of Jordan (2002) on the rainwater killifish (Lucania parva) in
the St. Johns River Estuary, Florida. This may also account for inability of the two species to disperse into streams adjourning Monai Stream through the Lake. According to Gilliam and Fraser (2001), predators fragment stream fish on two spatial scales, emigration from predator-occupied pools in streams and increased abundance of prey fish in riffles or shallow areas than deeper water.
Differences in the risk of predation, availability of food resources, and physiological conditions among these habitats may result in a specific form of risks and opportunities for organisms and often generate patterns of differential habitat use (Jordan, 2002). In Monai Stream the choice of habitat may be to reduce interspecific competition for space and food. E. bifasciatus have succeeded in adapting to the lentic environment even though it cannot survive in it during the yearly drawdown it’s able to utilize the annual flood to recruit.
Habitat fragmentations or loss of habitat connectivity have been shown to have harmful influence on population persistence (Wilcox and Murphy, 1985). The damming of Niger River at Kainji resulted in alteration of the stream habitat of Epiplatys bifasciatus and E. spilargyreius populations in the Monai Stream by reducing its availability, changing it flow regime and curtailing routes of dispersal. This study suggest that relatively few environmental variables have profound effects on the abundance of these short-lived, small-sized, early-maturing and multiple spawning notobranchiids. Their life history traits however enables them to adapt to changes in their altered habitat meanwhile their continuous existence depend on the persistence of the stream which is presently threatened by adjoining terrestrial land use and water abstraction for farming and domestic use.
Conflict of Interest The authors have not declared any conflict of interest. REFERENCES APHA (American Public Health Association) (1995). Standard methods
for the examination of water and wastewater, 19th edition. Port City Press, Baltimore, MD.
Baltz DM, Vondracek B, Brown LR, Moyle PB (1991). Seasonal
changes in microhabitat selection by rainbow trout in a small stream. Trans.Am. Fish. Soc. 120:166-176.
Banks JW, Holden MJ, Lowe-McConnell RH (1965). Fishery report.In:
White E (ed.), The first scientific report of the Kainji biological research team. Ife-Ife, Nigeria: University of Ife. pp 21–24.
Barros DF, Albernaz ALM, Zuanon J, Espírito Santo HMV, Mendonça
FP, Galuch AV (2013). Effects of isolation and environmental variables on fish community structure in the Brazilian Amazon Madeira-Purus interfluves. Braz. J. Biol. 73(3): 491-499.
Benech V, Lek S (1981). Resistance a l’hypoxie et observations écologiques pour seize espèces de poisons du Tchad. Revue d’Hydrobiologie tropicale 14:153-168.

Copp GH (1992). Comparative microhabitat use of cyprinid larvae and
juveniles in a lotic floodplain channel. Environ. Biol. Fishes 33:181-193.
Daget J (1962). Niger dam project. Federal government of Nigeria: Electricity Corporation. Fisheries 6(8):1-44.
Duméril AHA (1861). Poissons de la côte occidentale d'Afrique.
Archives du Muséum National d’Histoire Naturelle 10:241-268. Eckmann R, Gaedke U, Wetzlar HJ (1988). Effects of climatic and density
–dependent factors on year-class strength of Coregonus lavaretus in
Lake Constance. Can. J. Fisheries Aquatic Sci. 45:1088-1093. Fischer P (2000). An experimental test of metabolism and behavioural
responses of benthic fishes to different types of substrate. Can. J.
Aquat. Sci. 57:2336-2344. Gilliam JF, Fraser DF (2001). Movement in corridors: Enhancement by
predation threat, disturbance and habitat structure. Ecology
82(1):258-273. Gratwicke B, Marshall BE, Nhiwatiwa T (2003). The distribution and
relative abundance of stream fishes in the upper Manyame River,
Zimbabwe, in relation to land use, pollution and exotic predators. Afr. J. Aquatic Sci. 28:25-34.
Green J (1977). Haematology and habitats in catfish of the genus Synodontis. J. Zool. London 182:39-50.
Grossman GD, de Sostoa A (1996). Microhabitat use by fish in the upper Rio Matarrana, Spain. Ecol. Freshwater Fishes 3:141-152.
Grossman GD, Freeman MC (1987). Microhabitat use in a stream fish assemblage. J. Zool. 212:151-176.
Grossman GD, Moyle PB, Whitaker Jr. JO (1982). Stohasticity in
structural and functional characteristics of an Indiana stream fish assemblage: test of community theory. American Naturalist 120:423-454.
Guma’a SA (1982). On the biology of Epiplatys bifasciatus
(Cyprinodontidae) from Southern Sudan. Hydrobiologia 8 285-300. Gursoy GC, Tarkan AS, Gaygusuz O (2010). The Diel Changes in
Feeding Activity, Microhabitat Preferences and Abundance of Two Freshwater Fish Species in Small Temperate Streams (Omerli, Istanbul) Ekoloji 19(76):15-24.
Harding JS, Young RG, Hayes JW, Shearer KA, Stark JD (1999). Changes in agricultural intensity and river health along a river continuum. Freshwater Biol. 42:345-357.
Hayse JW, Wissing TE (1996). Effects of stem density of artificial vegetation on abundance and growth of age-0 blue-gills and predation by largemouth bass. Trans. Am. Fisheries Soc. 125:422-
433. Heck KL, Crowder LB (1991). Habitat structure and predator-prey
interactions in vegetated aquatic systems. In S.S. Bel, E.D. McCoy
and J. Mushinsky (eds) Habitat structure: the physical arrangement of objects in space. Chapman and Hall, New York. pp. 281-298.
Herbold B (1984). Structure of an Indiana stream fish association: choosing an appropriate model. Am. Naturalist 124:561-572.
Hocutt CH, Johnson PN (2001). Fish response to the annual flooding regime in the Kavango River along the Angola/Namibia border. South Afr. J. Marine Sci. 23: 449-464.
Humpl M, Pivnicka M (2006). Fish assemblages as influenced by environmental factors in streams in protected areas of the Czech Republic. Ecol. Freshwater Fish 15:96-103.
Hynes HBN (1970). The ecology of running waters. Toronto University Press. Toronto. 555 p.
Imevbore AMA, Bakare O (1974). A pre-impoundment studies of
swamps in the Kainji Lake basin. Afr. J. Trop. Hydrobiol. Fish. 3(1):79 -92.
Ita EO (1978). An analysis of the fish distribution in Kainji Lake, Nigeria.
Hydrobiologia 58(3):233-244. Jordan F, Coyne S, Trexler JC (1997). Sampling fishes in vegetated
habitats: Effect of habitat structure on sampling characteristics of the
1m2 throw trap. Trans. Am. Fish. Soc. 126:1012-1020.
Jordan F, Babbitt KJ,d McIvor CC (1998). Seasonal variation in habitat use by marsh fishes. Ecol. Freshwater Fish 7(4):159-166
Jordan F, Babbitt KJ, McIvor CC, Miller SJ (2000). Contrasting patterns of habitat use by prawns and crayfish in a headwater marsh of the St Johns River, Florida. J. Crustacean Biol. 20(4):769-776.
Jordan F (2002). Field and Laboratory Evaluation of Habitat Use by Rainwater Killifish (Lucania parva) in the St. Johns River Estuary,
Olaosebikan et al. 105
Florida. Estuaries. Colombia SC. 25(2):288-295. Koel TM, Peterka JJ (2003). Streamfish communities and environmental
correlates in the Red River of North, Minnesota and North Dakota.
Environ. Biol. Fishes 67(2):137-155. Kouamélan EP, Teugels GG, N’Douba V, Bi GG, Koné T (2003). Fish
diversity and its relationships with environmental variables in a West
African basin. Hydrobiologia 505:139-146. Kramer DL, Manley D, Bourgeois R (1983). The effects of respiratory
mode on oxygen concentration on the risk of aerial predation in
fishes. Can. J. Zool. 61:653-655. Lelek A (1972). Fish populations of Kainji Lake, trends in their
development and utilization. FAO Technical report 2 FI: SF/NIR 24.
Loftus WF, Kushlan JA (1987). Freshwater fishes of southern Florida. Bulletin of the Florida State Museum. Biol. Sci. 31:147-344.
Loiselle PV (1969). The biology of Epiplatys bifasciatus (Steindachner,
1881) (Teleostomi: Cyprinodontidae: Rivulinae) in Southern Togo. J. Am. Killifish Ass. 6:40-45.
Mallet JP, Lamouroux N, Sagnes P, Persat H (2000). Habitat
preferences of European grayling in a medium size stream, the Ain River, France. J. Fish Biol. 56:1312-1326.
Maret TR, Robinson CT, Minshall GW (1997). Fish assemblages and
environmental correlates in least-disturbed streams of the Upper Snake River Basin. Transactions of the American Fisheries Society 126: 200–216.
Matthews WJ, Hough DJ, Robison HW (1992). Similarities in fish distribution and water quality patterns in streams of Arkansas: congruence of multivariate analysis. Copiea 1992:296-305.
Moyle PB, Cech JJ (1988). Fishes: introduction to ichthyology. Prentice Hall, NJ: Englewood Cliffs Press.
Nwafili SA, Gao T, Olaosebikan BD (2009). mtDNA Diversity among remnant populations of two Epiplatys species in Kainji lake Basin
inferred from D-loop and 16SrRNA gene sequences. J. Fisheries Int. 4(3):40-44.
Odulate OD, Akegbejo-Samson Y, Omoniyi IT (2014). Multivariate analysis of fish species and environmental factors in marine coastal waters of the gulf of Guinea, Southwest Nigeria. Croatian J. Fisheries
72: 55-62. Olaosebikan BD (2007). The ecological studies of two nothobranchiid
fishes (Epiplatys bifasciatus, Steindachner, 1881 and E.
spilargyreius, Dumeril, 1861) in Monai Stream, Kainji Lake
basin,Nigeria. PhD thesis, Federal University of Technology, Minna, Nigeria. 210 pp.
Olaosebikan BD, Lamai SL, Bankole NO, Musschoot T (2006). An evaluation of fluorescent elastomer for marking killifish, Epiplatys bifasciatus and E. spilargyreius in abundance and growth studies. J.
Aquatic Sci. 2(1):29-31. Olaosebikan BD, Lamai SL, Musschoot T (2009). Population dynamics,
life-history traits of and habitat use of two sympatric Notobranchiid fishes in a tropical stream, Kainji Lake basin, Nigeria. Afr. J. Aquatic
Sci. 34(1):45-56. Oliva-Paterna FJ, Vila-Gispert A, Torralva M (2003). Condition of
Barbus sclateri from semi-arid aquatic Systems: effects of habitat
quality disturbances. J. Fish Biol. 63:699-709. Ostrand KG, Wilde GR (2001). Temperature, dissolved oxygen, and
salinity tolerances of five prairie stream fishes and their roles in
explaining fish assemblage patterns. Trans. Am. Fish. Soc. 130:742-749.
Ostrand KG, Wilde GR (2002). Seasonal and spatial variation in a
prairie stream-fish assemblage. Ecol. Freshwater Fish 11:137-149. Paine MD, Dodson JJ, Power G (1982). Habitat and food resource
partitioning among four species of darters (Percidae: Etheostoma) in
a southern Ontario stream. Can. J. Zool. 60:1635-1641. Park YS, Oberdorff T, Lek S (2005). Patterning Riverine Fish
Assemblages Using An Unsupervised Neural Network. In Modelling
Community Structure in Freshwater Ecosystems, Lek S, M Scardi, PFM Verdonschot, JP Park, Y.S., Eds.; Springer: Berlin, Germany pp. 43–53.
Persson B, Greenberg LA (1991). Habitat use and feeding behavior of thirteen species of benthic stream fishes. Environ. Biol. Fishes 31:389-401.
Rosenfeld J (2003). Assessing the habitat requirements of stream fishes: An overview and evaluation of different approaches. Trans.

106 Int. J. Fish. Aquac.
Am. Fish. Soc. 132:953-968. Sagua VO, Fregene SP (1979). Kainji Dam and the hydrology of the
River Niger. In: Proceedings of the International conference on Kainji
Lake and River Basins Development in Africa. Kainji Lake Research Institute 11:223-233.
Santos JM, Godinho FN, Ferreira MT (2004). Microhabitat use by Iberian nase Chondrostoma polylepis and Iberian chub Squalius carlitertii in three small streams, north-west Portugal. Ecol.
Freshwater Fish 13:223-230.
Schlosser IJ (1987). A conceptual framework for fish communities in a small warmwater stream. In: Community and evolutionary ecology of North American streams (Matthews, W.J. and D.C. Heins, eds)
Norman, Oklahoma University Press, pp. 17-24. Shahadat HM, Nani GD, Subrata S, Rahaman MZ (2012). Fish diversity
and habitat relationship with environmental variables at Meghna river
estuary, Bangladesh. Egypt. J. Aquatic Res. 38:213-226. Steindachner F (1881). Ichthyologische Beiträge (X). Sitzungsberichte
der Akademie der Wissenschaften in Wien 83(1):179-219.
Taylor CM, Winston MR, Mathews WJ (1993). Fish species-environmental and abundance relationships in a Great Plains River system. Ecography 16:16-23.
Toham AK, Teugels GG (1997). Patterns of microhabitat use among fourteen abundant fishes of Lower Ntem River basin (Cameroon). Aquat. Living Resour. 10:289-298.
Wagner HH, Wildi O, Ewaild KC (2000). Additive partitioning of plant species in an agricultural mosaic landscape. Landscape Ecology 15:219-227.
Welcomme RL (2001). Inland fisheries, Ecology and management. Oxford: Fishing News Books, Blackwell Science, 358 pp.
Wilcox BA, Murphy D (1985). Conservation strategy: the effect of
fragmentation on extinction. Am. Naturalist 125:879-887. Wildekamp RH (1996). A World of Killies - atlas of the oviparous
cyprinodontiform fishes of the world Vol. III. Ed. Brian R. Watters.
Published by The American Killifish Association, Inc.
Wootton RJ, Elvira R, Baker JA (2000). Life-history evolution, biology
and conservation of stream fish: introductory note. Ecol. Freshwater Fish 9:90-91.
Yong-Su Kwon, Fengqing Li, Namil Chung, Mi-Jung Bae, Soon-Jin Hwang, Myeong-Seop Byoen, Sang-Jung Park, Young-Seuk Park (2012). Response of Fish Communities to Various Environmental
Variables across Multiple Spatial Scales. Int. J. Environ. Res. Public Health 9:3629-3653.
Yu SL, Lee T-W (2002). Habitat preference of the stream fish, Sinogastromyzon puliensis (Homalopteridae) Zoological studies
41(2): 183-187. Yu SL, Peters EJ (1997). Use of Frounde numbers to determine habitat
selection by fishes. Rivers 6:10-18.

International Journal of Fisheries and Aquaculture
Related Journals Published by Academic Journals
■ Journal of Plant Breeding and Crop Science■ African Journal of Agricultural Research■ Journal of Horticulture and Forestry■ International Journal of Livestock Production■ International Journal of Fisheries and Aquaculture■ Journal of Cereals and Oilseeds■ Journal of Soil Science and Environmental Management■ Journal of Stored Products and Postharvest Research