Embed Size (px)
Citation preview
International Journal of Engineering Research and General Science Volume 4, Issue 1, January-February, 2016 ISSN 2091-2730
593 www.ijergs.org
Experimental Investigations of Nappe Profile and Pool Depth for Broad
Crested Weirs
1Mohammed Gamal Abdalla,
2 Mohamed Tarek Shamaa
1Associate Professor, Mansoura University, faculty of Engineering, Mansoura, Egypt
2Assistant Professor, Department of Irrigation and Hydraulics, Mansoura University
ABSTRACT- There are relatively few investigations for computing the required stilling basin length for broad weirs structures. This
length is mainly divided into two parts, the first one is the length at which the falling nappe strikes the basin floor “Drop Length”, and
the second part is the hydraulic jump length. This research work deals mainly with the determination of the drop length and some
characteristics of free-nappe in case of broad crested weirs. Theoretical and experimental studies were carried out for smooth
horizontal rectangular channel having subcritical approaching flow condition. The experiments for different models were carried out
using different values of discharge per unit width (q) in Lit./sec./m to determine the brink depth (he) in cm, the average pool depth
beneath the nappe (hp) in cm, the upstream water depth over the upstream channel bed (ho) in cm, the horizontal length of lower nappe
profile (LL) in cm, the horizontal length of upper profile (Lu) in cm, and the upper nappe angle with the stilling basin floor () in
degrees. Experimental results of the present investigation were represented in the form of tables and graphs. Comparative study
between other research works and both the suggested design formulae and experimental results of this investigation was performed.
Key words: Broad crested weirs, Nappe profile, Drop length, Subcritical flow.
1. INTRODUCTION
The water velocity downstream the drop is relatively high and the excessive amount of kinetic energy carried in the flow may be of
danger to the outlet structure or its surroundings. A drop structure-stilling basin is used to change the exit supercritical flow
downstream the drop to a subcritical state by both the jump and circulation in pool beneath the nappe Abdul (Abdul Khader et. al.,
1970).
The drop structure may be low or high, Little and Murphey (1982) defined the low drop as the drop, in which the relative drop height
(P/hc) (P = drop height, hc = critical depth) is equal to or less than one, conversely a high drop is the one with a relative drop height
greater than one.
The problem of the free overfall has attracted considerable interest for almost 70 years, and a large number of theoretical and
experimental studies has been carried out by many investigators. outstanding contributors to the present field are Rouse, Diskin,
Smith, Rajaratnam and Muralidhar, Schwartz, Bauer and Graf, Neogy, Kraijenhoff and Dommerholt, Naghdi and Rubin , Little and
Murphey, Tung and Mays , Keller and fong, Terzidis and partheniou, Gupta et al., Ferro, and Dey. (Chamani and Beirami, 2002)
Donnelly and Blaisdaell (1965) presented a significant work on vertical drop spillway stilling basin. Hager (1983) used an analytical
approach to solve the Bernoulli equation, extended to take account of curvature effects, and applied it to a rectangular free overfall.
Bohrer et al. (1998) predicted the velocity decay of free falling jet while the energy loss at free overfall was discussed by Rajaratnam
and Chamani (1995).

International Journal of Engineering Research and General Science Volume 4, Issue 1, January-February, 2016 ISSN 2091-2730
594 www.ijergs.org
Numerical solutions include the works of Chow and Han, Khan et al., and Davis et al.
Ali and Sykes (1972) applied free vortex theory to free overfall in rectangular, triangular, and parabolic channels while Marchi (1993)
used a relaxation method to integrate the potential flow equations and obtained solutions for the nappe profile and upstream profile in
rectangular free overfall.
Recently, Watson et al. (1998), and Rajaratnam (1998) presented the aeration performance of free falling jet.
Abdul Khader et. al., (1970). Stated that Birkhoff in 1961 presented a brief survey of the approximate methods available for solving
the free surface problems in which boundary layer separation is not likely to play an important role, the employed methods are: 1-
Relaxation technique; 2- Complex function theory and conformal mapping technique; 3- Conformal mapping and singularity
distribution; 4- Matching technique (inner and outer expansion); and 5- Electrolytic model.
Hydraulics of Falling Jet: The brink section divides the flow into the upstream zone, bounded by the channel with straight bottom,
and the unbounded downstream jet zone. Two types of jets have been evaluated, a fully air entrained developed jet and non-aerated
undeveloped one. The free overfall studies have been restricted to jets with atmospheric pressure conditions on both the upper and
lower boundaries (Dey and Kumar, 2002)
Drop Length: Donnelly and Blaisdaell (1965) deduced a theoretical equation to compute the vertical drop stilling basin length. They
presented a design chart to determine the drop length. (Ferro, 1992)
The following types of nappe are classified according to the extent of vacuum and ventilation, Fig. (1):
Free nappe: the atmospheric pressure exists beneath the nappe. The discharge through this type of nappe is the same as given by the
theoretical analysis.
Depressed nappe: the nappe is partially ventilated, the negative pressure below the nappe tried to drag the lower portion of the nappe.
The discharge of the nappe depends upon the amount of ventilation and the negative pressure. Generally, the discharge of this type of
nappe is 6% to 7% more than that of a free nappe.
Clinging nappe: in this type of nappe where no air is left below the water and the nappe clings to the wall of the drop. The discharge
over such drop is 25% to 30% more than that of a free nappe.
Drowned nappe: this type of nappe occurs under high heads when there is practically no ventilation. The entire space between the
lower face of the nappe and the drop is filled with eddying mass of water. The discharge is 10 to 20 percent more than that in a free
nappe.

International Journal of Engineering Research and General Science Volume 4, Issue 1, January-February, 2016 ISSN 2091-2730
595 www.ijergs.org
1- Free Nappe
P
3- Clinging Nappe
P
2- Depressed Nappe
P
4- Drowned Nappe
P
Fig. (1): Types of nappe (after, Arora, 1973).
2. THEORITICAL APPROACH
The flow over broad crested weirs is analyzed by the one-dimensional momentum equation and Newton’s laws of motion in smooth
prismatic horizontal channel. The horizontal distance from the crest of weir to the point at which the nappe strikes the stilling basin
floor is termed as the drop length, (Ld). For computing the drop length, the momentum equation is applied between the upstream
section and the brink section, the following assumptions are considered:
- The case of ventilated jet into the downstream zone is considered.
- The pressure distribution at the upstream section is hydrostatic.
- The pressure at the brink section is zero.
- The horizontal component of the velocity at the beginning of jet is the effective amount, while the vertical component is neglected.
- The coefficient of non-uniform velocity distribution, the energy coefficient ( = 1.0) and the momentum coefficient ( = 1.0).
- The crest width, 4h1, (h1 = water depth over the weir crest).
According to these assumptions, for one-dimensional flow, the theoretical relationships for the average drop length, (Ld) will be
deduced.
On the basis of previous assumptions, the conservation of momentum in x-direction between section I-I and section II-II, Fig. (2), can
be applied as:

International Journal of Engineering Research and General Science Volume 4, Issue 1, January-February, 2016 ISSN 2091-2730
596 www.ijergs.org
Fig. (2): Broad crested weir.
121 0.0 VVQF (1)
2
11 b 2
1hF (2)
Substituting Eqn. (2) into Eqn. (1) noting that (Q = q*b) and
( = /g), Eqn. (1) becomes:
12
2
1 b 2
1VVbq
gh
(3)
Eliminating () and (b) from Eqn. (3), the following equation is obtained:
2
2
112
hVV
g
q (4)
from the continuity equation in rectangular channel where: (V1 = q/h1), then Eqn. (4) will be:
1
3
1
2
22
2
qh
ghqV
(5)
using Newton’s laws of motion for a particle at the point of intersection of axes, Fig. (2), the following equations hold:
tVX 2 (6)

International Journal of Engineering Research and General Science Volume 4, Issue 1, January-February, 2016 ISSN 2091-2730
597 www.ijergs.org
2 2
1tgY (7)
Substituting Eqn. (7) into Eqn. (.6) for (t) value gives:
g
YVX
22 (8)
2
2
22 V
qP
hPY (9)
Substituting Eqn. (5) into Eqn. (9) yields:
3
1
2
1
2
2 ghq
hqPY
(10)
Substituting Eqns. (5) and (10) into Eqn. (8) using the boundary condition (X = Ld) yields:
3
1
2
1
2
1
3
1
2
d2
2
2
2L
ghq
hqP
gqh
ghq (11)
If section I-I is considered critical then:
3
2
1hg
qhc (12)
c2 gh1.5=V (13)
Substituting Eqns. (12) and (13) into Eqn. (3.11) and simplifying:
ccd hPhL 33.012.2 (14)
International Journal of Engineering Research and General Science Volume 4, Issue 1, January-February, 2016 ISSN 2091-2730
598 www.ijergs.org
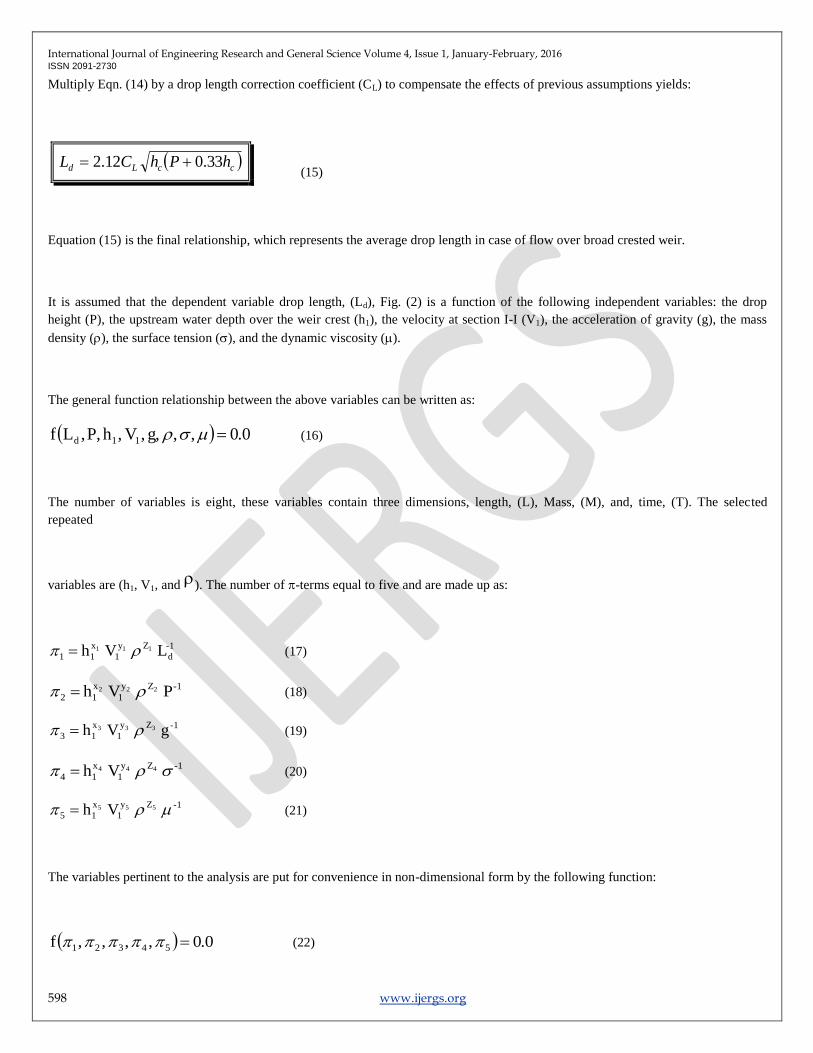
Multiply Eqn. (14) by a drop length correction coefficient (CL) to compensate the effects of previous assumptions yields:
ccLd hPhCL 33.012.2 (15)
Equation (15) is the final relationship, which represents the average drop length in case of flow over broad crested weir.
It is assumed that the dependent variable drop length, (Ld), Fig. (2) is a function of the following independent variables: the drop
height (P), the upstream water depth over the weir crest (h1), the velocity at section I-I (V1), the acceleration of gravity (g), the mass
density (), the surface tension (), and the dynamic viscosity ().
The general function relationship between the above variables can be written as:
0.0 , , g, ,V ,h P,,Lf 11d (16)
The number of variables is eight, these variables contain three dimensions, length, (L), Mass, (M), and, time, (T). The selected
repeated
variables are (h1, V1, and ). The number of -terms equal to five and are made up as:
-1
d
Zy
1
x
11 L V h 111 (17)
-1Zy
1
x
12 P V h 222 (18)
-1Zy
1
x
13 g V h 333 (19)
-1Zy
1
x
14 V h 444 (20)
-1Zy
1
x
15 V h 555 (21)
The variables pertinent to the analysis are put for convenience in non-dimensional form by the following function:
0.0 , , , ,f 54321 (22)

International Journal of Engineering Research and General Science Volume 4, Issue 1, January-February, 2016 ISSN 2091-2730
599 www.ijergs.org
0.0 , , ,1
,1
f 543
21
1
(23)
0.0h
,h
,,,L
f 11
2
11
1
1
11
d1
VV
gh
V
h
P
h (24)
the surface tension (Weber number, W = h1V12/) has a negligible effect due to the dimensions of the flume.
Reynolds number (Re = h1V1/) in all runs is bigger than (2000), turbulent flow then the effect of viscosity could be neglected. If the
upstream water depth over the crest is considered critical depth then the value of ( 11o VFr gh ) is equal to unity then Eqn. (24)
may be written as:
cc h
Pf
h2
dL (25)
Equation (25) represents the drop length is dimensionless form cd hL as a function of relative drop height chP .
3. EXPERIMENTAL WORK
The present experiments were conducted in a rectangular flume with a mild slope of 0.40 m wide, 0.40 m deep, and 12.0 m long, with
2.0 m long Perspex sides, Fig. (3), in irrigation and hydraulics laboratory of the faculty of engineering, El-Mansoura University.
Fig. (3): The Apparatus view.

International Journal of Engineering Research and General Science Volume 4, Issue 1, January-February, 2016 ISSN 2091-2730
600 www.ijergs.org
The experimental work in this study was performed on two groups of models with different shapes. These models were made of wood
at the faculty workshop and painted several times to be watertight.
The first group: Consists of four models with different heights for the broad crested weir.
The second group: Consists of three models with different slopes for the downstream side of broad crested weir.
Aeration was provided to the downstream face of the model by means of an orifice of diameter 19 mm approximately, connected with
a hose and located near the top of the model face. The definition sketches for these groups of models are shown in Figs. (4) to (5).
Fig. (4): Definition sketch for the first group of broad crested weir.
Fig. (5): Definition sketch for the second group of broad crested weir with an inclined downstream face.

International Journal of Engineering Research and General Science Volume 4, Issue 1, January-February, 2016 ISSN 2091-2730
601 www.ijergs.org
Data of the first group
Data of the second group
Experimental Preparation
The experiments were performed using different models with different values of discharge to determine the following items, Fig. (6):
- The horizontal length of lower nappe profile, LL.
- The horizontal length of upper nappe profile, Lu.
- The average drop length, Ld.
- The brink depth, he.
- The upstream water surface profile.
- The upper nappe angle, .
- The average pool depth beneath the nappe, hp.
Eight runs were carried out for every model with a discharge ranged from (3 to 20) Lit./sec. During these runs, the flow was subcritical
and the nappe was ventilated.
Model
No.
Model
Height
P (cm)
Model
Width
b (cm)
Model
Length
L (cm)
Fir
st G
rou
p
1
2
3
4
10.0
14.5
20.0
25.0
40
40
40
40
100
100
100
100
Model
No.
Model
Height
P (cm)
Model
Width
b (cm)
Model
Length
L (cm)
Inclinatio
n
Z : 1
Th
ird
Gro
up
1
2
3
20.0
20.0
20.0
40
40
40
95.00
93.33
90.00
0.25 : 1
0.33 : 1
0.50 : 1

International Journal of Engineering Research and General Science Volume 4, Issue 1, January-February, 2016 ISSN 2091-2730
602 www.ijergs.org
H hp
H he
AirVentP
H hcQ
Fig. (6): Definition sketch for models.
Experimental Procedure
1- A steady flow of water over the weir is established.
2- Care is taken to ensure that the nappe is ventilated.
3- The discharge is measured using the flow meter and the stopwatch.
4- The upper nappe profile, the lower nappe profile, and the pool profile beneath the nappe are drawn on the millimeter
translucent paper.
5- The upstream water surface profile along the centerline of the model is determined by using the movable point gauge
at 5.0 cm intervals, starting from the crest of the weir and proceeding upstream.
6- Fluctuation of the water surface is observed during the experimental work. To obtain a proper depth, the reading of
the point gauge is adjusted so that the point is submerged and exposed for equal intervals of time at the water surface.
7- After completion of the experiment, another model is placed in the flume and the experiment is repeated.
4. RESULTS AND ANALYSIS
Nappe profiles
The upper nappe profile, the lower nappe profile, and pool profile beneath the nappe were obtained from the experimental work for all
groups.
All of these nappe profiles are illustrated in this section in order to calculate the horizontal length for upper and lower nappe profiles
and the average drop length (Ld). eight runs for every model were carried out using different discharges.
During the experimental work, it was noticed that the oscillations in the pool profile beneath the nappe were decreased in the first
group with vertical downstream face, while these oscillations were increased in second group with inclined downstream face. This is
mainly due to the area of ventilation under the nappe profile.
Figs. (7) to (10) present the nappe profiles in case of first group.

International Journal of Engineering Research and General Science Volume 4, Issue 1, January-February, 2016 ISSN 2091-2730
603 www.ijergs.org
Figs. (11) shows the nappe profiles in case of broad crested weir with the maximum inclined downstream face (second group) in case
of model No. (III), P = 20.0 cm, Z = 0.50 only.
The best fitting for the experimental data shown in these figures is the third order polynomial equations for the upper and lower nappe
profiles.
Run No.( 7)
q = 18.53 Lit ./sec./m
0
4
8
12
16
0 4 8 12 16
Horizontal Distance, cm
Vert
ical D
ista
nce, cm
Run No.( 8)
q = 21.05 Lit ./sec./m
0
4
8
12
16
0 4 8 12 16
Horizontal Distance, cm
Vert
ical D
ista
nce, cm

International Journal of Engineering Research and General Science Volume 4, Issue 1, January-February, 2016 ISSN 2091-2730
604 www.ijergs.org
Fig. (7): Nappe profiles for the first group of broad crested weir
(Model No. (I), P = 10.0 cm).
Run No.( 7)
q = 39.68 Lit ./sec./m
0
4
8
12
16
20
24
0 4 8 12 16 20 24
Horizontal Distance, cm
Vert
ical D
ista
nce, cm
Run No.( 8)
q = 46.30 Lit ./sec./m
0
4
8
12
16
20
24
0 4 8 12 16 20 24
Horizontal Distance, cm
Vert
ical D
ista
nce, cm
Fig. (8): Nappe profiles for the first group of broad crested weir
(Model No. (II), P = 14.5 cm).

International Journal of Engineering Research and General Science Volume 4, Issue 1, January-February, 2016 ISSN 2091-2730
605 www.ijergs.org
Run No.( 7)
q = 40.33 Lit ./sec./m
0
4
8
12
16
20
24
28
0 4 8 12 16 20 24 28
Horizontal Distance, cm
Vert
ical D
ista
nce, cm
Run No.( 8)
q = 46.65 Lit ./sec./m
0
4
8
12
16
20
24
28
0 4 8 12 16 20 24 28
Horizontal Distance, cm
Vert
ical D
ista
nce, cm
Fig. (9): Nappe profiles for the first group of broad crested weir
(Model No. (III), P = 20.0 cm)

International Journal of Engineering Research and General Science Volume 4, Issue 1, January-February, 2016 ISSN 2091-2730
606 www.ijergs.org
Run No.( 1)
q = 9.80 Lit ./sec./m
0
4
8
12
16
20
24
28
32
0 4 8 12 16 20 24 28 32
Horizontal Distance, cm
Vert
ical D
ista
nce, cm
Run No.( 2)
q = 15.05 Lit ./sec./m
0
4
8
12
16
20
24
28
32
0 4 8 12 16 20 24 28 32
Horizontal Distance, cm
Vert
ical D
ista
nce, cm
Run No.( 3)
q = 20.00 Lit ./sec./m
0
4
8
12
16
20
24
28
32
0 4 8 12 16 20 24 28 32
Horizontal Distance, cm
Vert
ical D
ista
nce, cm
Run No.( 4)
q = 24.80 Lit ./sec./m
0
4
8
12
16
20
24
28
32
0 4 8 12 16 20 24 28 32
Horizontal Distance, cm
Vert
ical D
ista
nce, cm
Run No.( 5)
q = 30.35 Lit ./sec./m
0
4
8
12
16
20
24
28
32
0 4 8 12 16 20 24 28 32
Horizontal Distance, cm
Vert
ical D
ista
nce, cm
Run No.( 6)
q = 35.00 Lit ./sec./m
0
4
8
12
16
20
24
28
32
0 4 8 12 16 20 24 28 32
Horizontal Distance, cm
Vert
ical D
ista
nce, cm
Run No.( 7)
q = 37.88 Lit ./sec./m
0
4
8
12
16
20
24
28
32
0 4 8 12 16 20 24 28 32
Horizontal Distance, cm
Vert
ical D
ista
nce, cm
Run No.( 8)
q = 41.00 Lit ./sec./m
0
4
8
12
16
20
24
28
32
0 4 8 12 16 20 24 28 32
Horizontal Distance, cm
Vert
ical D
ista
nce, cm
Fig. (10): Nappe profiles for the first group of broad crested weir
(Model No. (IV), P = 25.0 cm).

International Journal of Engineering Research and General Science Volume 4, Issue 1, January-February, 2016 ISSN 2091-2730
607 www.ijergs.org
Run No.( 1)
q = 9.43 Lit ./sec./m
0
4
8
12
16
20
24
28
0 4 8 12 16 20 24 28
Horizontal Distance, cm
Vert
ical D
ista
nce,c
m
Run No.( 2)
q = 13.03 Lit ./sec./m
0
4
8
12
16
20
24
28
0 4 8 12 16 20 24 28
Horizontal Distance, cm
Vert
ical D
ista
nce,c
m
Run No.( 3)
q = 16.68 Lit ./sec./m
0
4
8
12
16
20
24
28
0 4 8 12 16 20 24 28
Horizontal Distance, cm
Vert
ical D
ista
nce,c
m
Run No.( 4)
q = 18.88 Lit ./sec./m
0
4
8
12
16
20
24
28
0 4 8 12 16 20 24 28
Horizontal Distance, cm
Vert
ical D
ista
nce,c
m
Run No.( 5)
q = 22.13 Lit ./sec./m
0
4
8
12
16
20
24
28
0 4 8 12 16 20 24 28
Horizontal Distance, cm
Vert
ical D
ista
nce,c
m
Run No.( 6)
q = 26.33 Lit ./sec./m
0
4
8
12
16
20
24
28
0 4 8 12 16 20 24 28
Horizontal Distance, cm
Vert
ical D
ista
nce,c
m
Run No.( 7)
q = 28.15 Lit ./sec./m
0
4
8
12
16
20
24
28
0 4 8 12 16 20 24 28
Horizontal Distance, cm
Vert
ical D
ista
nce,c
m
Run No.( 8)
q = 35.23 Lit ./sec./m
0
4
8
12
16
20
24
28
0 4 8 12 16 20 24 28
Horizontal Distance, cm
Vert
ical D
ista
nce,c
m
Fig. (11): Nappe profiles for the second group of broad crested weir with an inclined downstream face (Model No. (III), P = 20.0 cm,
Z = 0.50).

International Journal of Engineering Research and General Science Volume 4, Issue 1, January-February, 2016 ISSN 2091-2730
608 www.ijergs.org
Drop length
In Eqns. (15), the coefficient (CL) is presented to cover the total effects of the theoretical assumptions. Fig. (12), shows the
experimental drop length versus the calculated one for the first group of broad crested weir. In this figure, the linear correlation passes
through the origin is used and from this correlation, the coefficient (CL) is obtained, it is equal to 0.95 for broad crested weirs.
According to these values of (CL), could be written as follows:
ccd hPhL 33.0014.2 (6.1)
Fig. (12): Experimental drop length (Ld)e versus theoretical drop length (Ld)t for broad crested weir (First Group).
5. CONCLUSIONS
This study concerns with the determination of average drop length and some characteristics of nappe and brink section for broad
crested weirs. For a horizontal smooth rectangular channel, the experimental investigations were carried out under specific conditions
such as a free nappe, which occurred when the atmospheric pressure exists beneath the drop; different discharges; different model
dimensions and shapes; subcritical approaching flow; and no tail-water effect.
(Ld)e = 0.95(Ld)t R2 = 0.9953
0
3
6
9
12
15
18
21
24
27
30
0 3 6 9 12 15 18 21 24 27 30
Exp
eri
men
tal
Dro
p L
en
gth
, cm
Theoretical Drop Length, cm
H he
AirVent
Upper Nappe Profile
Lower Nappe Profile
P
H hc

International Journal of Engineering Research and General Science Volume 4, Issue 1, January-February, 2016 ISSN 2091-2730
609 www.ijergs.org
Two groups of models were made; the first group having height of 10, 14.5, 20 and 25 cm; the second group for broad crested weir
with an inclined downstream face with slopes of 1:2, 1:3, and 1:4 and all of these slopes having 20 cm height
Based on theoretical approach, under specific assumptions, an equation, which compute the average drop length for the broad crested
weir was developed.
The experimental drop length in all cases of this study was less than that given by the theoretical equations by an average difference
ranged from 5% to 7%. This difference is mainly due to the assumptions used for the derivation of the theoretical equation. A
coefficient, CL (drop length correction coefficient) was determined from the comparison between the theoretical and experimental
results and its value was found equal to 0.95.
REFERENCES:
[1] Abdul Khader, M.H., and Rao, H.S., (1970) "Discussion of “pattern of potential flow in a free overfall”, by Theodor Strelkoff and
Mohammed S. Moayeri, Journal of the Hydraulics Division, ASCE, Vol. 96, No.11, pp. 2397-2398.
[2] Ali, K.H.M., and Sykes, A., (1972) “Free-Vortex Theory Applied to Free Overfalls”, Journal of the Hydraulics Division, ASCE,
Vol. 98, No.5, pp. 973-979.
[3] Arora, K.R., (1973) “Fluid Mechanics, Hydraulics, and Hydraulic Machines”, Standard Publishers Distribution, Nai Sarak, Delhi.
[4] Bohrer, J.G., Abt, S.R., and Wittler, R.J., (1998) “Predicting Plunge Pool Velocity Decay of Free Falling Rectangular Jet”, Journal
of Hydraulic Engineering, ASCE, Vol. 124, No. 10, pp. 1043-1048.
[5] Chamani, M.R., and Beirami, M.K., (2002) “Flow Characteristics at Drops”, Journal of Hydraulic Engineering, ASCE, Vol. 128,
No.8, pp. 788-791.
[6] Dey, S., and Kumar, B.R., (2002) “Hydraulics of Free Overfall in -Shaped Channels”, Sadhana, Vol. 27, Part3, pp. 353-363.
[7] Donnelly, C.A., and Blaisdaell, F.W., (1965) “Straight Drop Spillway Stilling Basin”, Journal of the Hydraulics Division, ASCE,
Vol. 91, No.3, pp. 101-131.
[8] Ferro, V., (1992) “Flow Measurement with Rectangular Free Overfall”, Journal of Irrigation and Drainage Engineering, ASCE,
Vol. 118, No.6, pp. 956-964.

International Journal of Engineering Research and General Science Volume 4, Issue 1, January-February, 2016 ISSN 2091-2730
610 www.ijergs.org
[9] Hager, W.H., (1983) “Hydraulics of Plane Free Overfall”, Journal of Hydraulic Engineering, ASCE, Vol. 109, No.12, pp.1683-
1697.
[10] Little, W.C., and Murphey, J.B., (1982) “Model Study of Low Drop Grade Control Structures”, Journal of the Hydraulics
Division, ASCE, Vol. 108, No. 10, pp. 1132-1146.
[11] Marchi, E., (1993) “On the Free Overfall”, Journal of Hydraulic Research, IAHR, Vol. 31, No.6, pp.777-790.
[12] Rajaratnam, N., and Chamani, M.R. (1995) “Energy Loss at Drops”, Journal of Hydraulic Research IAHR, Vol. 33, No.3, pp.
373-384.
[13] Watson, C.C., Walters, R.W., and Hogan, S.A., (1998) “Aeration Performance of Low Drop Weirs”, Journal of Hydraulic
Engineering, ASCE, Vol. 124, No.1, pp. 65-71.


![International Journal of Engineering Research and General ...pnrsolution.org/Datacenter/Vol4/Issue6/30.pdf · The concept of two dimensional classical theories of lubrication [3],](https://img.dokumen.tips/doc/110x75/5d5212af88c993730d8b6c34/international-journal-of-engineering-research-and-general-the-concept-of.jpg)