Embed Size (px)
Citation preview

International Journal of Computing and ICT Research, Vol. 2 No. 1, June 2008
Contents Volume 2, No.1, June 2008. ISSN 1818-1139 (PRINT), ISSN 1996-1065 (ONLINE) (Print), ISSN 1996-1065 (Online) Staying the Course: The Steady Growth of the International Journal of Computing and ICT Research,
Joseph M. Kizza – Editor-in-Chief ……………………………………………………………………… 7 The Internet In Tertiary Education In Africa: Recent Trends
Ravinder Rena……………….………………………………………………………………… 9 Design Space Exploration of Network-On-Chip: A System Level Approach
Rabindra Ku. Jena and Prabhat K. Mahanti...………………………………………………… 17 Extraction of Interesting Association Rules Using Genetic Algorithms
Peter P. Wakabi-Waiswa and Venansius Baryamureeba ……………………………………………… 26 An Empirical Study to Compare Three Methods for Selecting COTS Software Components
Tom Wanyama and Behrouz H. Far……………………………………………………………….. 33
Challenges of Adaptive eLearning at Higher Learning Institutions: A Case Study in Tanzania. Vitalis Ndume , F.N.Tilya and H.Twaakyondo …………………………………………………….. 47
Network Intrusion Detection Based on Rough Set and k-Nearest Neighbour
Adebayo O. Adetunmbi, Samuel O. Falaki, Olumide S. Adewale and Boniface K. Alese………… 60
International Journal of Computing and
ICT Research

International Journal of Computing and ICT Research, Vol. 2 No. 1, June 2008
2
International Journal of Computing and ICT Research Editorial Board Editor-in-Chief: Prof. Joseph M. Kizza, Department of Computer Science and Engineering College of Engineering and Computer Science The University of Tennessee-Chattanooga, 615 McCallie Avenue, Chattanooga, Tennessee, USA [email protected] Managing Editors: Computer Science Prof. Bernard Manderick, Vrije Universiteit Brussel, Belgium. Information Technology Prof. Victor Mbarika, Southern University and A&M College, USA Information Systems. Prof. Erik Proper, Radboud University, Nijmegen, Netherlands Computer Engineering Prof. H.N Muyingi, Forthare University, South Africa Software Engineering Prof. P.K. Mahanti, University of New Brunswick, Canada Data Communications and Computer Networks Prof. Terry Fogarty, Umutara Polytechnic, Rwanda ICT for Sustainable Development Prof. Anthony Rodrigues, University of Nairobi, Kenya. Production Editor: Book Review Editor: Prof. Timothy Waema, School of Computing and Informatics, The University of Nairobi, Kenya. Journal Editorial Office: The International Journal of Computing and ICT Research Makerere University P.O. Box 7062, Kampala, Uganda. Tel: +256 414 540628 Fax: +256 414 540620 Email: [email protected] Web: http://www.ijcir.org

International Journal of Computing and ICT Research, Vol. 2 No. 1, June 2008
3
Volume 2, No.1, June 2008. The International Journal of Computing and ICT Research Makerere University P.O. Box 7062, Kampala, Uganda. Tel: +256 414 540628 Fax: +256 414 540628 Email: [email protected] Web: http://www.ijcir.org
International Journal of Computing and ICT Research

International Journal of Computing and ICT Research, Vol. 2 No. 1, June 2008
4
Volume 2, No.1, December 2008. Table of Contents Staying the Course: The Steady Growth of the IJCIR
Joseph M. Kizza – Editor-in-Chief …………………………………………………………………7 The Internet In Tertiary Education In Africa: Recent Trends
Ravinder Rena……………….…………………………………………………………. 9 Design Space Exploration of Network-On-Chip: A System Level Approach
Rabindra Ku. Jena and Prabhat K. Mahanti ..………………………………………..17 Extraction of Interesting Association Rules Using Genetic Algorithms
Peter P. Wakabi-Waiswa and Venansius Baryamureeba ………………………………………26 An Empirical Study to Compare Three Methods for Selecting COTS Software Components
Tom Wanyama and Behrouz H. Far………………………………………………………………..34
Challenges of Adaptive eLearning at Higher Learning Institutions: A Case Study in Tanzania.
Vitalis Ndume , F.N.Tilya and H.Twaakyondo ………………………………………….. 50 Network Intrusion Detection Based on Rough Set and k-Nearest Neighbour
Adebayo O. Adetunmbi, Samuel O. Falaki, Olumide S. Adewale and Boniface K. Alese………… 63

International Journal of Computing and ICT Research, Vol. 2 No. 1, June 2008
5
Book Reviews Every issue of the journal will carry one or more book reviews. This is a call for reviewers of books. The book reviewed must be of interest to the readers of the journal. That is to say, the book must be within the areas the journal covers. The reviews must be no more than 500 words. Send your review electronically to the book review editor at: [email protected]

International Journal of Computing and ICT Research, Vol. 2 No. 1, June 2008
6
International Journal of Computing and ICT Research The IJCIR is an independent biannual publication of Makerere University. In addition to publishing original work from international scholars from across the globe, the Journal strives to publish African original work of the highest quality that embraces basic information communication technology (ICT) that will not only offer significant contributions to scientific research and development but also take into account local development contexts. The Journal publishes papers in computer science, computer engineering, software engineering, information systems, data communications and computer networks, ICT for sustainable development, and other related areas. Two issues are published per year: June and December. For more detailed topics please see: http://www.ijcir.org. Submitted work should be original and unpublished current research in computing and ICT based on either theoretical or methodological aspects, as well as various applications in real world problems from science, technology, business or commerce. Short and quality articles (not exceeding 20 single spaced type pages) including references are preferable. The selection of journal papers which involves a rigorous review process secures the most scholarly, critical, analytical, original, and informative papers. Papers are typically published in less than half a year from the time a final corrected version of the manuscript is received. Authors should submit their manuscripts in Word or PDF to [email protected]. Manuscripts submitted will be admitted subject to adherence to the publication requirements in formatting and style. For more details on manuscript formatting and style please visit the journal website at: http://www.ijcir.org.

International Journal of Computing and ICT Research, Vol. 2 No. 1, June 2008
7
Staying the Course: The Steady Growth of the IJCIR Prof. Joseph M. Kizza∗ , Editor-in-Chief Department of Computer Science and Engineering, The University of Tennessee-Chattanooga, Tennessee, 37403, USA. IJCIR Reference Format: Kizza, Joseph. M. Staying the Course: The Steady Growth of IJCIR. International Journal of Computing and ICT Research, Vol. 2, No. 1, pp. 7 - 8. http:www.ijcir.org/volume2-number1/article1.pdf. It has been one year since we published the maiden issue of the International Journal of Computing and ICT Research (IJCIR). What a year it has been. Journals, especially academic journals are extremely difficult to sustain once they have started. This is because academic journals are rarely best sellers. They make little money, if at all, usually from either subscription and or advertising. Both of these sources depend on the credibility of the journal and the deep pockets of the founding institution. Without both of these together, it is difficult to grow an academic journal. In our case, however, we started without both of them.
When we started, we ploughed in a scientifically barren field of Africa with limited financial resources from Makerere University in Uganda, the anchoring university. In addition, we were and still are not yet a subscription journal and we are yet to start advertising. From these humble beginnings we set out our goals and corresponding milestones to build a world class journal of information and communication technology (ICT) research. A great task you can say. So far we have done one volume with two issues which has generated a growing callous of praises coming from scholars and indeed all readers from around the world.
As our reputation has grown, our sphere of readership has also grown to cover large swats of the globe. We probably attribute the fast moving acceptance and growing readership of our journal to the very forces of ICT that the journal set out to highlight.
Right from the start, the journal got a wide electronic dissemination and advertising through several online groups. Through memberships in these groups, we started getting paper submissions. First as a trickle then into a steady flow. Because of this unexpected growth, we have been made to change our focus from a dedicated journal highlighting African research in ICT to a global focus. As our readership grew, our kraal also grew to encompass the whole world. We are grateful to all these.
As we grow, we are mindful of our original mission of serving and creating a forum for African scholars, toward this goal, we intend to publish several special issues on selected topics that advance African development issues. So in the next five years, we are planning on publishing several special issues starting with a special issue on e-government highlighting the role ICT plays in advancing good governance, particularly in Africa, creating an environment, still lacking in a number of African countries, which fosters citizen participation, transparency, accountability, responsiveness, equity, effectiveness and efficiency, and the rule of law.
We also plan to publish a special issue on e-commerce to highlight the forces of globalization on African commerce as Africa emerges from the stagnation of the last decade and century to take its place and play its rightful role in global commerce.
∗ Author’s Address: Joseph M. Kizza, Department of Computer Science and Engineering, The University of Tennessee-Chattanooga, Chattanooga, TN 37403, USA. [email protected]. "Permission to make digital or hard copies of part or all of this work for personal or classroom use is granted without fee provided that copies are not made or distributed for profit or commercial advantage and that copies bear this notice and the full citation on the first page. Copyrights for components of this work owned by others than IJCIR must be honored. Abstracting with credit is permitted. To copy otherwise, to republish, to post on servers or to redistribute to lists, requires prior specific permission and/or a fee." © International Journal of Computing and ICT Research 2008. International Journal of Computing and ICT Research, ISSN 1818-1139 (Print), ISSN 1996-1065 (Online), Vol.2, No.1, pp. 7 - 8, June, 2008.

International Journal of Computing and ICT Research, Vol. 2 No. 1, June 2008
8
African health has been and still is the most critical and most painful sector of African development emanating undesirable images of Africa around the world. We want to play our part in the development of this sector by publishing a special issue that will highlight promising roles that ICT is playing and may play in moving the sector forward.
We promise and we are committed that along the way, IJCIR will play a positive role in the development of Africa based on ICT scholarship and best practices from around the world. Africa will never again be a black hole and ICT will help remove the Conrad’s image of Africa.
Your role in all this will be, and we are hoping, that you will be a reader of IJCIR and a contributor to its noble mission.
Once again let me end by calling on African researchers to consider submitting research papers with ICT application to the future issues of this journal. We are committed to bringing out the best of Africa to the global arena of researchers. The Journal, like its sister conference, The Annual International Conference on Computing and ICT Research, accept papers in computer science, computer engineering, software engineering, data communications and computer networks, information systems, information technology and ICT for sustainable development and other related areas.
In this issue, we have a collection of 7 papers covering a broad range of interests in Computing and ICT issues in Africa. These papers are coming from every corner of Africa and beyond, giving the journal an extended domain of researchers and practitioners to draw expertise from and to disseminate, grow and fertilize with new ideas and techniques.
The papers cover a wide area of computing and ICT including computer science, computer engineering, software engineering, data communications and computer networks, information systems, information technology and ICT for sustainable development. While I will not discuss each paper appearing here, I can assure you that each and every paper in this journal goes right to the core of the objectives of the journal. I call on you to relax and enjoy this and future issues of the journal.

International Journal of Computing and ICT Research, Vol. 2 No. 1, June 2008
9
THE INTERNET IN TERTIARY EDUCATION IN AFRICA: RECENT TRENDS Ravinder Rena* Department of Business Studies Papua New Guinea University of Technology ______________________________________________________________________________ Poor Internet connectivity is one of the pertinent issues in the digital divide between developing and industrialized countries, hampering the transition to the global information society. Recent emergence of national and regional research and education data communication networks in parts of the developing world has shown large benefits arising from collaboration amongst tertiary education institutes. Africa is currently the most under-served continent in terms of the information and communication technologies. Hence the collaboration amongst tertiary education institutes in Africa is imperative to make them key players in the enhancement of information and communication technologies for society. An attempt is made in this article to delve the recent trends that emerged from the higher educational institutes in Africa. The paper also highlights the key role of tertiary education and Internet that can induce social and economic developments. Categories and Subject Description: C.2 [Computer-Communication Networks]; C.2.1 Wireless communication. C.2.2 Routing protocols, K.4.1 [Computer and Society] General Terms: Tertiary education, ICT development, Africa, satellite, Internet. Additional Key Words and Phrases: IJCIR Reference Format: Ravinder Rena. The Internet In Tertiary Education In Africa: Recent. International Journal of Computing and ICT Research, Vol. 2, No. 1, pp. 9 - 16. http:www.ijcir.org/volume2-number1/article2.pdf. 1. INTRODUCTION Technological advancements, global telecommunication and automation have greatly contributed to economic growth in the world over the past fifteen years. However, not all regions, countries and people in the world have benefited equally from the opportunities that Information and Communication Technologies (ICT) offer. Especially rich industrialized countries and several countries in transition have profited from the information age and attained high economic growth figures. The advantages of the information era have been less for developing countries, which often lack favourable conditions for deployment of new technologies. The difference in access to ICT between the poor and the rich is referred to as the digital divide [Rena 2007]. Further, ICT is considered one of the key factors for sustainable development, not only as a means for automation of work processes in business and industry, a tool for education and scientific collaboration, and a platform for technological innovation, but also for communication and access to information, thus contributing to democratic empowerment and poverty reduction [Potter et al. 1999]. * Author’s address: Dr. Ravinder Rena, Head of Economics, Department of Business Studies, Papua New Guinea University of Technology, Private Mail Bag LAE 411; Morobe Province, Papua New Guinea. Email: [email protected] ; [email protected] . The Author would like to thank the anonymous referees for their useful insights on the draft copy of this article.
"Permission to make digital or hard copies of part or all of this work for personal or classroom use is granted without fee provided that copies are not made or distributed for profit or commercial advantage and that copies bear this notice and the full citation on the first page. Copyrights for components of this work owned by others than IJCIR must be honored. Abstracting with credit is permitted. To copy otherwise, to republish, to post on servers or to redistribute to lists, requires prior specific permission and/or a fee." © International Journal of Computing and ICT Research 2008. International Journal of Computing and ICT Research, ISSN 1818-1139 (Print), ISSN 1996-1065 (Online), Vol.2, No.1, pp. 9 - 16, June, 2008.
International Journal of Computing and ICT Research, Vol. 2 No. 1, June 2008
10
Poverty, poor access to education and lack of public investment capital are commonly believed to be the main causes for the digital divide, however, other causes may be of influence. A basic understanding of the mechanisms of the implementation and the role of ICT in society is necessary to reduce this digital divide, bearing in mind the local circumstances, differences and cultural context. This paper focuses on the most underserved African continent in terms of ICT.
In Africa, 29 countries have defined governmental policies to support ICT, in the past few years [Pehrson and Ngwira 2006]. Numerous ICT-initiatives and projects are taking place simultaneously in African countries, supported by the World Bank, the IDRC, the European Commission, the United Nations and many other donors [Hawkins 2005; Steiner 2005]. Further, 2007 was declared as the year for building up science and technology in Africa. African science ministers have backed a set of measures to promote science and technology across the continent. The ministers, who met in January 2007 in Cairo, Egypt, pledged the Heads of State create a Pan-African Intellectual Property Organisation, and to designate 2007 as a year for science, technology and innovation in Africa [CAIRO DECLARATION 2006].
To achieve this, Respective countries have to apportion at least one per cent of their GDP to promote research, development and innovation strategies in Africa. The African Union (AU) summit held in January 2007 in Cairo, Egypt asked to express support for South-South cooperation in science, technology and innovation, enhance the role of such cooperation in international partnerships, and move towards harmonizing national and regional regulations that promote the application and safe use of biotechnology [CAIRO DECLARATION 2006]. With Africa’s population expected to increase from 923 million to 1.3 billion by 2020, agricultural technology development and transfer become crucial [Africa-Wikipedia 2007]. Farmers, who form the bulk of this population, will only be able to improve their productivity and livelihoods if they have access to technology [Olawo 2005; Rena 2007].
Indeed, many African countries lack explicit national science and innovation policies. Some policies were developed in the 1970s or 1980s and do not reflect the realities of a rapidly globalising world and national imperatives of the new millennium, notes Africa’s Science and Technology Consolidated Plan of Action [2005]. In the developed and newly industrializing countries, there is ample evidence to suggest that economic advances are results of technological and organizational innovations. Globally, science and technology are recognized as drivers of increased wealth and improved standards of living [Pehrson and Ngwira 2006]. Information on market prices is critical for farmers to earn their bred. Indeed, the farmers have to reap the fruits of technological diffusion in Africa, thus they need to learn farming methods and crop protection techniques from the Internet. Although, farmers use cell phones in inquiring market prices where to buy or sell their produce but much has to be done to improve the situation in Africa [Olawo 2005; Muchanga 2005; Rena 2007]. It is to be noted that in Uganda, this kind of information gap is being bridged by Information Technology for African Rural Development (ICTARD) [Internet World Statistics 2007].
At the United Nations World Summit on the Information Society, held in Tunis, November 2005, goals were set for developing a “…people-centred, inclusive and development-oriented Information Society so that people everywhere can create, access, utilize and share information and knowledge… to attain the internationally agreed development goals and objectives, including the Millennium Development Goals ” [AAU 2005].
The contribution of education in bridging the digital divide is crucial. In this paper an attempt is made to describe the key role of tertiary education in their quest for good Internet access and accordingly to information and communication, that can induce social and economic developments. 2. THE INTERNET IN AFRICA The total African population consists of approximately 933.000.000 inhabitants, representing 14 per cent of the total world population [Africa - Wikipedia, the free encyclopedia]. The estimated number of Internet users in Africa in 2007, is 39.000.000, which represents 3 per cent of the Internet users in the world [Internet World Statistics 2007]. Excluding South-Africa (and the North African countries Morocco, Algeria, Tunisia and Egypt, who have much higher Internet usage figures), the penetration of Internet in Sub-Saharan African countries is an average of 0.2 per cent. Yet, Internet use is growing fast in Africa, for example, during the period 2000 to 2007, the Internet users increased by 638 per cent in the whole of Africa. The total world Internet usage growth in 2006 was 209 %, between 2000 and 2007 [Internet World Statistics 2007]. The number of Internet users in a country can be considered a “digital indicator” of the adoption of ICT in society. Table 1: Population per country, number of Internet users and penetration: percentage of Internet users relative to the total population: (Internet World Statistics 2007)

International Journal of Computing and ICT Research, Vol. 2 No. 1, June 2008
11
Area coverage Population Internet users in 2007 Penetration Total World 6.574.666.417 1.114.274.426 16.9% USA 301.967.681 211.108.086 69.9% China 1.317.431.495 137.000.000 10.4% Netherlands 16.447.682 12.060.000 73.3% Total North Africa 153.156.098 17.778.000 11.6% South Africa 49.660.502 5.100.000 10.3% SSA 729.629.334 1.274.400 0.2% Source: Internet World Statistics (2007) Note: SSA =Sub Saharan Africa Causes for the digital divide Indeed, poverty and lack of education are the main causes for the digital divide. In addition, low population density, and large distances between urban centres are unfavourable conditions for the expansion of a continent-spanning communication infrastructure as these require high investments. In such circumstances there is no promise of quick revenues for private investors in country-wide telecommunication infrastructures. Nevertheless, several studies have shown that lack of financial means for the investments in a regional Internet infrastructure are not the main reasons for the digital divide, as one might expect [Rena 2007].
A study of the availability of optical fibre connections on the African continent was carried out in 2004-2005, sponsored by the World Bank and the IDRC, for the south eastern countries, initiated by the Southern Africa Regional Universities Association [Muchanga 2005]. This revealed the existence of thousands of km of private high capacity transmission over optical fibre cabling, owned by power utility companies, and pipeline operators. However, closed governmental policies and regional regulations in many countries have until now prevented the use of this valuable infrastructure for public communication purposes [Pehrson and Ngwira 2006].
The real problem that holds back use of the Internet is the high cost for Internet connectivity for end-users in Africa. An African consumer pays on average 240 times as much for the same Internet connection as a person in the Netherlands [Internet World Statistics 2007]. The high pricing is the main obstacle for the deployment of Internet in Africa. The main challenge, therefore, is to bring the costs down. Causes for the high price of the Internet It is important to understand the market mechanisms that contribute to the excessive high prices for Internet connections in Africa. The Internet infrastructure in African countries is dominated by private telecommunication companies and some monopolistic state companies. In Sub-Saharan countries, the access to the rest of the global Internet is exclusively through wireless satellite connectivity called VSAT, or through submarine optical cable [Martin 2006]. The VSAT dishes connect via a satellite directly to dishes in the US or Europe, and subsequently with the large Internet exchanges in the world, located in Amsterdam, London, Paris or New York.
A submarine cabling system, called SAT-3/WASC/SAFE was completed in 2002, and has landing points at eight African countries mainly along the west coast (Senegal, Ivory Coast, Ghana, Benin, Nigeria, Cameroun, Gabon and South Africa), and it also connects to Spain, Portugal and to India and Malaysia. The landlocked countries in Africa and countries on the east coast are not connected to this submarine cabling system. The VSAT wireless Internet connection appears to be an adequate alternative for the Internet at places and countries that do not access the submarine system. A dish can be easily purchased and installed anywhere. Almost every university in Sub-Saharan Africa is already connected to the Internet via VSAT [Hawkins 2005].
The downside of VSAT connection is the high price, the inferior connectivity quality and lower bandwidth1, as compared to optical cable, plus the fact that no local infrastructure is being built. It is estimated that Africa spends 400 million US $ per year on VSAT connections, that are exploited by international, not African companies [Drouot 2005]. Take the case for example, when two users at the Asmara University send an email to each other, using email addresses from American providers such as hotmail.com (Microsoft Corporation) or yahoo.com (Yahoo). While both persons are located on the same campus, the email travels through the VSAT to the satellite and through the exchange point in Amsterdam, back to the satellite, and again to the campus. The whole travel of the email usually takes only a few seconds, but it represents a disinvestment in terms of local capital. The Internet providers and

International Journal of Computing and ICT Research, Vol. 2 No. 1, June 2008
12
satellite owners are international companies. All the budgets spent on VSAT –connections flow away from Africa, instead of being reinvested in local infrastructure. Glass (optical) fibre is the best medium for data transport, and is much more sustainable satellite wireless, but it requires high initial investments. One optical fibre pair (dark fibre) can nowadays carry 80 Gbps of data, which is 80.000 times the capacity of an Internet connection for an average university in Africa. In each glass fibre duct hundreds of fibre pairs are bundled together, giving a total connectivity of Terabits (1000 Gigabits) per second for one single duct. Still, the return on investment of optical cable infrastructure is often too risky for private investors.
One of the main goals of the SAT-3/WASC/SAFE cable was the reduction of connectivity costs to the Internet, for the participating nations. The lowering in price did not happen, because the connection was shared by a closed consortium of dominant telephone companies and telecom state monopolies [Gedye, 2006]. There was, unfortunately, no Open Access Model or governmental policy or enforcement regulation to break the monopolistic market position of the members, and thus lower the Internet prices [Drouot 2005].
The efforts are exerted to establish EASSY cable, the East African Submarine cable System, it and runs from Port Sudan (Sudan) in the north to Durban (South Africa). This will complete the fibre loop surrounding Africa, and will connect as well to Djibouti, Somalia, Eritrea, Ethiopia, Tanzania, Madagascar and Mozambique [Olawo 2005; Balancing Act, 2005; Steiner et al. 2005]. The submarine cabling systems are a good step forward in bringing Africa “on-line”, but additional infrastructure is required to connect the inland regions and landlocked countries to the landing points. As shown by several studies, including the SARUA fiber study [Muchanga 2005], power utility companies commonly use optical fibre for the operation of their core business; so many investments in expensive infrastructure are already done. This electricity fibre infrastructure might easily be shared by other companies, such as Internet providers, or public user consortia, without affecting the electricity business, and without technical or market constraints. The use of the infrastructure by several competing business partners, is not only common in the rest of the world, it is even enforced by Open Access policies and regulations in many countries to prevent monopolies (e.g. the OPTA and the NMA in the Netherlands, Independent Regulators Group (IRG) and the European Regulators Group (ERG) for the European Union). 3. COMPUTERS AND THE INTERNET IN EDUCATION The ICT and the Internet for tertiary education is imperative. The most effective way to increase the knowledge of ICT of a population is through education. To underline this statement, the following goal was set up by the Association of African Universities (AAU), at the Conference on African Research and Education Network Infrastructure, held in Tunis, in November 2005; Björn Pehrson, professor in Telecom Systems from the IT-University KTH in Sweden, stated that “No later than 2008, universities and research institutions in Southern Africa will have access to broadband services and the global Internet on the same level as peers in the developed parts of the world, with a quality of service in the Gbps rather than kbps”2 [AAU 2005].
Indeed, the Internet originated in the domain of higher education. Although, the technology for interconnection of computer networks was developed for the American military network, important applications such as email and http (i.e. the World Wide Web), emerged within higher education [Stanton and Stöver 2005; SURFnet 2002]. The Internet and the World Wide Web, in fact the largest knowledge data base in the world [SURFnet 2002]. The information is accessible through powerful search engines. The Internet can substitute expensive hard-copy libraries, and provide access to resources of scientific publications and scholarly information.
Distance learning is already in use at many African universities, and fills a clear need for education of people who work during the day, and live in remote areas without access to transportation. Distance learning can be improved significantly by the use of the Internet and electronic learning environments, when sufficient bandwidth is available.
Universities are the place where the future scientists, teachers, politicians and entrepreneurs are being prepared for their tasks in society. It is also the place where technological innovation initiates, and where new ideas emerge. Students need to have daily access to computers and the Internet, and sufficient bandwidth is necessary for downloading and exchanging documents over the network. Collaboration and frequent interaction with other research groups in other institutes, regions or countries through the Internet contributes to the quality of research and education. The availability of sufficient ICT equipment is indispensable as well as skilled teachers and ICT-support staff, and adequate and inexpensive broadband access to the Internet for students and researchers.
It is viable to bring the Internet to the African society via tertiary education, just like it happened in the rest of the world. The Association of African Universities (AAU) supports the need for the Internet

International Journal of Computing and ICT Research, Vol. 2 No. 1, June 2008
13
connectivity by stating:” African universities and researchers are often working in a silo model, insulated from regional actors and drivers of funding and requirements. Through establishing low cost high quality networks a platform for generative discourse can be created leading to improved policy advice, more effective cross pollination of best practices and lessons …”[ AAU 2007].
The Massachusetts Institute of Technology in Boston, USA (MIT) already made available through the Internet programmes like BSc. and MSc. level, curricula that can be accessed and downloaded through the Internet. Their statement on this is: "…While recognizing that people in the developing world—who may benefit most from the open sharing of knowledge—are hindered by a lack of Internet access and connectivity, we must not let this problem obscure our vision of the future, but rather, take it as a challenge: Can the decision-makers of the world's leading educational institutions use what we are doing on our campuses to improve the lives of people around the world? History has proved that education and discovery are best advanced when knowledge is shared openly. We believe the idea of opencourseware is an opportunity that we must seize during the next decade." [Massachusetts Institute of Technology 2001].
4. MAIN PROBLEMS IN THE DEPLOYMENT OF ICTs Connectivity, capacity and content are the three basic conditions for the use of the Internet. In their need for ICT, universities in Africa are hampered by problems such as high prices for Internet connectivity, poor local and regional infrastructure, and lack of ICT-skilled human resource capacity to manage the scarce Internet resources and make them available to the end-user community. Low remuneration is one of the causes for the lack of ICT-skilled staff at tertiary education. Moreover, lack of experience with ICT organization at management level can also lead to inefficiency in operational and management structures of ICT departments, and of poor ICT deployment at an institutional level. Additionally, high licence fees for software and other expensive resources can hinder the use of ICT. Connectivity is usually obtained through expensive VSAT connections, because of the lack of a regional optical backbone. The capacity of this VSAT is acceptable, but it is not comparable to an optical connection, and it is unsuitable for broadband document downloading, and data exchange and other bandwidth consuming applications. This capacity is narrowed by inadequate management of campus networks, causing frequent power outages, service denial, poor security, virus spread and lack of prioritising of usage, leading to even lower capacity of the Internet to the end-users. First the basic conditions of connectivity and capacity have to be improved to allow content exchange. Content provisioning through the Internet will enable African researchers to contribute and share their studies with the global communities. Hence, the collaboration amongst local, regional and international institutes can improve the ICT situation at every level. 5. OTHER TERTIARY EDUCATION NETWORKS IN THE WORLD There are several successful examples of how countries improved the ICT situation at tertiary institutes. In the Europe, the National Research and Education Networks (NRENs) were established in the 80’s and early 90’s to interconnect universities, mainly for use of email. Networking technologies upgraded every year, gradually enabling larger data exchange and more enhanced applications. In 1993, a consortium of European NRENs was formed, called DANTE (Delivery of Advanced Network Technology to Europe) and its first international network of networks was formed, named GÉANT. GÉANT has recently been connected to the Asian university networks forming TEIN (Trans-Eurasia Information Network). GÉANT2 and TEIN2, as the second generation networks are named, operate at high data transmission rates, up to 80 Gbps [Internet World Statistics 2007].
In Latin America (LA), a collaboration initiative between several universities led to the formation of a continent wide research and education network in 2005, RedCLARA, through the interlinking of seven existing NRENs (Brazil, Argentina, Chile, Costa Rica, Mexico, Uruguay and Venezuela) and the formation of seven new NREN’s (Colombia, Ecuador, Guatemala, Nicaragua, Panama, Peru, El Salvador). RedClara was then connected to GÉANT [Internet World Statistics 2007]. The project costs were € 12,5M and were financed by the European Commission (80%) and the governments of the participating countries (20%). The backbone is mainly composed of optical cable, and some copper wire [Stanton and Stover 2005; International Network of E-Communities 2006].
The RedClara network interconnects 600 universities in Latin America and 3500 universities across Europe. The first scientific collaboration projects between LA and EU which directly benefited form this new network were in the field of grid computing, astrophysics and life sciences. Six of the EUMEDCONNECT Mediterranean partners Algeria, Egypt, Jordan, Morocco, Palestine and Syria being have taken the first step towards forming an association of Mediterranean NRENS in 2006[EUMEDCONNECT 2007].

International Journal of Computing and ICT Research, Vol. 2 No. 1, June 2008
14
The EASSy cabling system that is currently being developed for the east coast of Africa was at risk of being a copy of the monopolistic system applied by the SAT-3 cable, in stead of an Open Access connectivity model [Zuckermann 2006]. With the aid of the Association of African Universities (AAU), a consortium was formed in 2006, called Ubuntunet Alliance, composed of 43 universities in south-eastern Africa, to negotiate with the EASSy operating companies to obtain a considerable bandwidth on this cable, against low price. This initiative is supported by the World Bank, who is willing to contribute financially to the EASSy project, on condition that the Open Access will be applied [Balancing Act 2005]. In West-Africa until present only a few consortia or NREN initiatives exist between universities, or countries. Yet, awareness is increasing, and this might happen in the very near future. Many countries were encouraged by the Ubuntunet Alliance initiative, and have expressed interest in contributing and subscribing to this consortium [Steiner et al. 2005]. These are currently Botswana, Burundi, Cote d'Ivoire, Democratic Republic of Congo, Egypt, Lesotho, Swaziland, Tanzania, Uganda, Zambia and Zimbabwe [UbuntuNet Alliance 2007].
6. DISCUSSION
The problems African universities are facing in their deployment of ICT seem to be aggravated by lack of communication and collaboration with peers and seem to become a vicious circle. The scientific field is a preferential ground to create a collaborative environment, ultimately promoting scientific and technological development.
Internet connectivity and pricing could be considerably improved by the formation of bandwidth consortia, which cooperate and emit tenders, insist on lower prices, and encourage competition between Internet providers. Consortia of tertiary education institutes consist of homogeneous user groups that can also lobby at governmental level. The high prices of Internet connectivity in Africa are a direct consequence of a producer dominated market, too few consumer organizations and lack of governmental policies and regulations enforcing competitiveness.
In many countries of the world, tertiary educational institutions have already organized themselves into consortia to obtain and share resources. These National Research and Education Networks consortia, (NRENs), are important organizations that can influence ICT policies on a national scale and benefit their member institutions [Dyer 2005]. The member institutions share the same need for good bandwidth and affordable Internet connectivity, forming a strong consumer group. Taking an example from the SARUA fibre study [Pehrson and Ngwira 2006], similar studies in other parts of Africa should be carried out, in order to map the available optical fibre connections that might be used as regional backbones.
The next step would be gaining access to these private closed infrastructures. This could be developed in public-private projects, where again consortia of tertiary education institutions can act as strong lobby groups to enforce Open Access, thus making these infrastructures also available for society. At remote sites where no optical backbone is available, consortia can negotiate for lower VSAT prices, through economics of scale. Moreover, tertiary education consortia can negotiate still other issues, such as favourable licence fees for software.
The infrastructure that connects research and educational institutions with one another constitutes an indisputable public good, donor investments can be applied without disadvantage and false competitiveness to the private companies. The enforcement of Open Access by governmental legislation policies on the communication infrastructure could be obtained by the lobbying consortium as well, using the examples of many countries where this kind of legislation has already been adopted. 7. CONCLUSION African countries need good and inexpensive Internet services, to become “information societies” in their search for more favourable social and economic conditions. Tertiary education institutions should be aware of their key role, as contributor to Open Connectivity and of their potential influence in market mechanisms. At this level, user awareness is important as well as knowledge of market mechanisms that control the telecommunication market. Examples from peer institutions in other countries are very important. Some countries in Africa are already joining forces, but many are still missing!
The human resource capacity problem in ICT must be addressed both at management and at technical and operational level. Collaboration between institutes should therefore be encouraged at regional and international levels. Governments should apply their legislative authorities to enforce “low price/ high connectivity” business models and encourages competitiveness, as to prevent monopolistic telecommunication markets. This is essential both for the connection to the global Internet, and for the formation of a regional communication infrastructure, which is now owned by private or state companies.

International Journal of Computing and ICT Research, Vol. 2 No. 1, June 2008
15
Donors should be aware of the importance of ICT and Internet connectivity as a motor for economic and social development and should focus attention on it in their development programmes. The private telecommunication sector should be aware of the business opportunities that may emerge when Internet penetration increases by low price/high volume business models for connectivity. Last, but not least, all the above mentioned stakeholders should collaborate and focus on the issue that will bring benefit to all: how to bring Africa online. NOTES 1. Bandwidth in kbps (kilobits per second), Mbps, or Gbps is the unity in which the amount of digital data transmission per time interval is expressed.
2. Professor Pehrson was referring to a difference of a factor 1000 in data transfer rate between African universities and other universities in the World. REFERENCES AFRICA - WIKIPEDIA, 2007. The free encyclopedia. Avaialbale: wikipedia.org/wiki/Africa [Accessed on 26 May 2007] ASSOCIATION OF AFRICAN UNIVERSITIES. 2005, Report of the Conference on African Research and Education Network Infrastructure, Tunis. November 14 and 15, 2005, [Online] Available: http://www.aau.org/tunis/presentation/Tunis%20Final%20report.doc [Accessed on May 15, 2007]. ASSOCIATION OF AFRICAN UNIVERSITIES.2007, Research and Education Networking, Available from http://www.aau.org/renu/index.htm [Accessed on May13, 2007]. BALANCING ACT NEWS UPDATE. 2005. WSIS Special: World Bank offers East African Fibre Consortium Easy funding, issue no 282, November 28, 2005, Available: http://www.balancingact- africa.com/news/back/balancing-act_282.html [Accessed on May15, 2007]. CAIRO DECLARATION. 2006. The Extraordinary Conference of The African Ministerial Council On Science And Technology Adopted on 24TH November 2006 Cairo, Arab Republic of Egypt. Available: http://www.bamako2008.org/en/docs/cairo-declaration-24-nov-2006.pdf [Accessed on 21 February 2007]. DROUOT, P. 2005. VSAT et sans-fil, des chances pour l’Afrique ? - Connecté avec le monde mais pas avec son voisin. – Africa Computing. Available: http://www.africacomputing.org/article543.html
[Accessed on May13, 2007]. DYER, J. 2005. Setting up an NREN, European Experiences. Conference on African Research & Education Networking Infrastructure, Tunis., Available: http://www.aau.org/tunis/presentation/wayforward/20051115-jd-african-REN-workshop-v1.pdf [Accessed on May15, 2007]. EUMEDCONNECT .2007. Mediterranean partners take the first step towards forming an association of Mediterranean NRENS. Available: http://www.eumedconnect.net/server/show/nav.118
[Accessed on May15, 2007]. GEDYE L.2006. Not so Easy, Mail Guardian Online, 19 March 2006., Available: http://www.mg.co.za/articlePage.aspx?articleid=267024&area=/insight/insight__economy__business/ [Accessed on May13, 2007]. HAWKINS, R. 2005. Enhancing Research and Education Connectivity in Africa- The findings of the African Tertiary Institution Connectivity Study (ATICS) and Lessons for the Future of Campus Networks. World Bank. Available: http://www.oecd.org/dataoecd/49/48/35765204.pdf [Accessed on May13, 2007]. INTERNATIONAL NETWORK OF E-COMMUNITIES .2006. INEC Declaration on Open Networks. Retrieved May 15, 2007, Available: www.smartcommunity.nl/.../205771/file/Stockholm%20INEC%20Declaration%20on%20Open%20Net works.draft.6.0.pdf [Accessed on May 12, 2007]. INTERNET WORLD STATISTICS .2007. World Internet Users and Population Statistics, Internet usage statistics - The Big Picture. Available: http://www.Internetworldstats.com/stats.htm [Accessed on May15, 2007]. MARTIN, D. 2006. The emerging NREN’s of Sub-Saharan Africa TERENA Networking Conference 2006 "FOLLOW THE USER” 15 – 18 May 2006, Catania, Sicily. Available: http://www.tenet.ac.za/Publications/Emerging_NRENs_of_sub-Saharan_Africa.pdf [Accessed on

International Journal of Computing and ICT Research, Vol. 2 No. 1, June 2008
16
May15, 2007]. MASSACHUSETTS INSTITUTE OF TECHNOLOGY. 2001. MIT to make nearly all course materials available free on the World Wide Web., Available: http://web.mit.edu/newsoffice/2001/ocw.html . [Accessed on May 17, 2007]. MUCHANGA, A. 2005. SARUA Fiber Study, Centro de Informática da Universidade Eduardo
Mondlane (CIUEM) Available: http://event-africa-networking.web.cern.ch/event-africa- networking/cdrom/Joint_Internet2_IEEAF_workshops/Progress_and_Challenges_in_building_an_African_Research_and_Education_Network/20050918-africa-muchanga.ppt [Accessed on May18, 2007].
PEHRSON, B. & NGWIRA, M. 2006. Optical fiber for Research and Education Networks in Eastern and Southern Africa. University of Malawi. Available: http://www.idrc.ca/uploads/user-S/11083295861PAREN_Reportv15.doc . Accessed on May17, 2007 POTTER R. B., BINNS, T., ELLIOTT, J.A., SMITH,D. 1999. Geographies of Development. Pearson Education Limited, London. RENA, RAVINDER 2007. Information and Communication Technologies, Education and Development in Eritrea. In ALLAM AHMED (Ed.) Science, Technology and Sustainability in the Middle East and North Africa. Inderscience Publishers, Brighton, UK. Vol.1, 80-90. STANTON, M.A.& STÖVER, C. 2005. RedCLARA: Integrating Latin America into global Research & Education networking. DANTE, UK. Available:
www.terena.nl/events/tnc2006/core/getfile.php?file_id=763 [Accessed on May 17, 2007]. STEINER, R., TIRIVAYI, A. TIRIVAYI, N., JENSEN, M. HAMILTON & P. BUECHLER, J. 2005.
PAREN, Promoting African Research and Education Networking. A study sponsored by IDRC. Available: http://www.idrc.ca/uploads/user-S/11083295861PAREN_Reportv15.doc [Retrieved May15, 2007]. SURFnet. 2002. Het Internet georganised. Available: https://www.surfnet.nl/publicaties/brochures/organisaties/ [Accessed on April 17, 2007]. OLAWO, S. 2005. Easy Project Summary, Easy Project Secretariat. Available:
http://www.itu.int/ITU-D/partners/Events/2004/Kampala_Oct-Nov04/Presentations/1_EASSy.ppt [Accessed on May15, 2007]. UBUNTUNET ALLIANCE FOR RESEARCH & EDUCATION NETWORKING. 2007. Working for Excellent Internet Connectivity for the Tertiary Education and Research Sectors in Africa. Available: http://www.ubuntunet.net/ . [Accessed on May18, 2007]. ZUCKERMANN, E. 2006. A peaceful Easy feeling. Available: http://ethanzuckerman.com/blog/?p=856 [Accessed on May 15, 2007].
International Journal of Computing and ICT Research, Vol. 2 No. 1, June 2008
17
DESIGN SPACE EXPLORATION OF NETWORK-ON-CHIP: A SYSTEM LEVEL APPROACH Rabindra Ku. Jena* Institute of Management Technology, Nagpur Prabhat K. Mahanti University of New Brunswick, The growing complexity of system-on-chip is requiring communication resources that can only be provided by a highly scalable communication infrastructure. This is simplified by Network on Chip (NoC) architectures. The problem of topological mapping of intellectual properties (IPs) on the tile of a mesh-based NoC to minimize energy and maximum bandwidth requirement is a NP-hard problem. So, in this paper, we address the problem of topological mapping of intellectual properties (IPs) on the tile of a mesh-based NoC to minimize energy and maximum bandwidth requirements using multi-objective genetic algorithm. We have also considered “many-many” mapping between switch and cores(tiles) instead of “one-one” mapping. The evaluation performed on three randomly generated benchmarks and a real application (an M-JPEG encoder) to conform to the efficiency, accuracy and scalability of the proposed approach. Categories and Subject Descriptors: B.7 [Integrated Circuit]: System Level Synthesis I.2 [Artificial Intelligence]: Multi-objective genetic algorithm General Terms: Design and Modeling Additional Key Words and Phrases: NoC optimization, Energy, Performance __________________________________________________________________________________ IJCIR Reference Format: Rabindra Ku Jena and Prabat K. Mahanti. Design Space Exploration of Network-On-Chip: A System Level Approach. International Journal of Computing and ICT Research, Vol. 2, No. 1, pp. 17 - 25. http:www.ijcir.org/volume2-number1/article3.pdf. ___________________________________________________________________________________
1. INTRODUCTION
Network on Chip (NoC) has been proposed as a solution for the communication challenges like propagation delays, scalability, infeasibility of synchronous communication etc. in a nano scale regime [5-6]. To meet these challenges under the strong time-to-market pressure, it is essential to increase the reusability of components and system architectures in a plug and play fashion (J. Hu and R. Marculescu. 2003). Simultaneously, the volume of data and control traffic among the cores grows. So, it is essential to address the communication-architecture synthesis problem through mapping of cores onto the communication architecture (K. Lahiri, A. Raghunathan, and S. Dey, 2000). Therefore this paper focuses on communication architecture synthesis to minimize the energy consumption and communication delay by minimizing maximum link bandwidth using many-many mapping between resources and switches.
The proposed communication synthesis task has been solved in two phases as shown in Figure1. The first phase (P-1) is called computational synthesis. The input to P-I is a task graph. The task graph
* Author’s Address: Rabindra Ku. Jena, Institute of Management Technology, Nagpur [email protected], Prabhat K. Mahanti, University of New Brunswick, [email protected] "Permission to make digital or hard copies of part or all of this work for personal or classroom use is granted without fee provided that copies are not made or distributed for profit or commercial advantage and that copies bear this notice and the full citation on the first page. Copyrights for components of this work owned by others than IJCIR must be honored. Abstracting with credit is permitted. To copy otherwise, to republish, to post on servers or to redistribute to lists, requires prior specific permission and/or a fee." © International Journal of Computing and ICT Research 2008. International Journal of Computing and ICT Research, ISSN 1818-1139 (Print), ISSN 1996-1065 (Online), Vol.2, No.1, pp. 17 – 25, June, 2008.

International Journal of Computing and ICT Research, Vol. 2 No. 1, June 2008
18
consists of tasks as vertices and direct edges represent volume of data flowing between two vertices and their data dependencies. The output of P-I is a core communication graph (CCG) characterized by a library of interconnection network elements and performance constraints. The core communication graph consists of processing and memory elements are shown by P/M in the Figure1. The directed edges between two blocks represent the communication trace. The communication trace is characterized by bandwidth (bsd) and volume (vsd ) of data flowing between different cores. The second phase (P-II) is basically called a communication synthesis. The input to the P-II communication synthesis problem is the CCG. The output of the P-II is the energy and throughput synthesizes NoC back bone architecture shown in Figure1.
In this paper we address the problem of mapping the core onto NoC architecture to minimize energy consumption and maximum link bandwidth. Both of the above stated objectives are inversely proportional to each other. The above stated problem is an NP-hard problem (M. R. Garey and D. S. Johnson 1979). So, genetic algorithm is a suitable candidate for solving the multi-objective problem ( Luca Benini and Giovanni De Micheli 2002). The optimal solution obtained by our approach saves more than 15% of energy on average in comparison to other existing approaches. Experimental result shows that our proposed model is superior in terms of quality of result and execution time in compare to other approaches. The paper is organized as follows. We review the related work in Section 2. Section 3 and Section 4 describes the problem definition and the energy model assumed in this paper. Section 5 represents the multi-objective genetic algorithm formulation for the problem. Section 6 discusses the basic idea and problem formulation for the proposed approach. Experimental results are discussed in Section 7. Finally, a conclusion is given in Section 8.
2. RELATED WORK
The problem of synthesis in mesh-based NoC architectures has been addressed by different authors. Hu and Marculescu (J. Hu and R. Marculescu. 2003) present a branch and bound algorithm for mapping IPs/cores on a mesh-based NoC architecture that minimizes the total amount of power consumed in communications. De Micheli (S. Murali and G. D. Micheli 2004) address the problem under the bandwidth constraint with the aim of minimizing communication delay by exploiting the possibility of splitting traffic among various paths. Lei and Kumar (T. Lei and S. Kumar 2003 ) present an approach that uses genetic algorithms to map an application on a mesh-based NoC architecture. The algorithm finds a mapping of the vertices of the task graph on the available cores so as to minimize the execution time. However these papers do not solve certain important issues. The first relates to the evaluation model used. In most of the approaches the exploration model decides the mapping to explore the design space without taking important dynamic effects of the system into consideration. Again in the above mentioned works, in fact, the application to be mapped is described using task graphs, as in (T. Lei and S. Kumar 2003 ), or
Figure 1: Mappings for NoC synthesis problems
International Journal of Computing and ICT Research, Vol. 2 No. 1, June 2008
19
simple variations such as the core graph in (S. Murali and G. D. Micheli 2004) or the application characterization graph (APCG) in (J. Hu and R. Marculescu. 2003). These formalisms do not, however, capture important dynamics of communication traffic. The second problem relates to the optimization method used. It refers in all cases to a single performance index (power in (J. Hu and R. Marculescu. 2003), performance in (S. Murali and G. D. Micheli 2004; T. Lei and S. Kumar 2003). So the optimization of one performance index may lead to unacceptable values for another performance index (e.g. high performance levels but unacceptable power consumption). Recently, Jena and Sharma (Jena, R.K, Sharma, G.K. 2006) proposed a model that consider “many-many” mapping between core and tiles using multi-objective genetic algorithm. But they used core communication graph as the input to their model. We therefore think that the problem of mapping can be more useful to solved in a multi-objective environment starting from the higher level of input as compared to the model discussed in (Jena, R.K, Sharma, G.K. 2006). The contribution we intend to make in this paper is to propose a multi-objective approach to solving the synthesis problem on a mesh-based NoC architecture, where we take the task graph as input. The approach, we will use is evolutionary computing techniques based on genetic algorithm to explore the mapping space with the goal to optimize maximum link bandwidth and energy consumption (both computational and communication). 3. PROBLEM DEFINITION
3.1. Task Graph (TG) A Task Graph (TG) is a digraph, G (V, E), where each vertex v Є V represents a task and each edge e Є E is a weighted edge, where weight signifies the volume of data flowing through the edge. Every edge also represents the data dependency between the connecting vertices. 3.2. Core Communication Graph (CCG) A Core Communication Graph (CCG) is a digraph, G(V,E), where each vertex v Є V represents a core and e Є E is a communication edge having two attributes, denoted by bsd and vsd . The bsd and vsd are the required bandwidth and total volume of communication for each edges respectively. 3.3 Communication Structure The 2-D mesh communication architecture has been considered for its several desire properties like regularity, concurrent data transmission and controlled electrical parameters (J. Hu and R. Marculescu. 2003;S. Kumar et al. 2002). Figure 2 shows how a tile (T) is binding with its surrounding switches(S) in a 2-D mesh NoC architecture. Each tile is a square surrounded by ‘4’ switches and links. A resource in a tile can be connected to maximum ‘4’ switches as shown in the Figure 2. Each switch is connected to its neighboring switches via two unidirectional links. To prevent the packet loss due to the multiple packets approaching to the same output port, each switch has small buffers (registers) to temporarily store the packets. Each resource has 4 Resource Network Interfaces (RNIs) to connect to the network via switches. RNIs are responsible for packetizing and depacketizing the communication data. We implement static XY wormhole routing in this paper because: i) it is easy to implement in a switch. ii) it doesn’t require packet ordering buffer at the destination. iii) it is free of deadlock and live lock (N. Banerjee, P. Vellanki, and K. S. Chatha 2004; S. Murali
and G. D. Micheli 2004). 4. ENERGY MODEL
Energy minimization is one of the major challenging tasks in NoC design. In (T. T. Ye, L. Benini, and G. D. Micheli 2002 ), Ye et al. first define the bit energy metric of a router as the energy consumed when a single bit of data goes through the router. In (J. Hu and R. Marculescu. 2003), Hu et al. modify the bit energy model so that it is suitable for 2D mesh NoC architecture. They derives mathematical expression for bit energy consume, when the data transfer from switch i to switch j is given by
E i ,j bit = (hij + 1) ESbit + hij ELbit (1)

International Journal of Computing and ICT Research, Vol. 2 No. 1, June 2008
20
Figure 2: Communication Structure
ESbit and ELbit are the energy consumed in the switches and links respectively. The variable hij represent the number of links on the shortest path. As per the expression, the energy consumptions depends on the hop distance (hij) between switch i and j because ESbit and ELbit are constants. Note ESbit is the energy consumption due to switches, depending on the number of ports in the switches. But in our case the total energy is the sum of communication and computation energies, i.e
E i ,j bit = (hij + 1) ESbit + hij ELbit + ECom (2)
EComp is the computational energy consumption. The following sections discuss the basic ideas of problem formulation using multi-objective optimization paradigm. 5. MULTI-OBJECTIVE OPTIMIZATION
Definition: A general multi-objective optimization problem is defined as: Minimize f (x) = (f1(x),….., fk(x)) subject to x Є X, where x represents a solution and X is a set of feasible solutions. The objective function vector f (x) maps a solution vector x in decision space to a point in objective space. In general, in a multi-objective optimization problem, it is not possible to find a single solution that minimizes all objectives simultaneously. Therefore, one is interested to explore a set of solutions, called the pareto optimal set, which is not dominated by any other solution in the feasible set. The corresponding objective vectors of these Pareto optimal points, named efficient points, form the Pareto front on the objective space. Definition: We say , a solution (x )dominates another solution ( x*) iff i Є {1,……,k} fi(x) ≤ fi(x*) and there exists at least one i Є {1,…., k} such that fi(x) < fi(x*). The most traditional approach to solving a multi-objective optimization problem is to aggregate the objectives into a single objective by using a weighting mean. However this approach has major drawbacks. It is not possible to locate the non-convex parts of the pareto front and it requires several consecutive runs of the optimization program with different weights. Recently, there has been an increasing interest in evolutionary multi-objective optimization. This is because of the fact that evolutionary algorithms (EAs) seem well-suited for this type of problems (C. A. Coello,2002), as they deal simultaneously with a set of possible solutions called population. This allows us to find several members of the pareto optimal set in a single run of the algorithm. To solve the synthesis problem as discussed in Section 4, we used the multi-objective genetic algorithm. 5.1 A Multi-Objective Genetic Algorithm In order to deal with the multi-objective nature of NoC problem we have developed genetic algorithms at different phases in our model. The algorithm starts with a set of randomly generated solutions

International Journal of Computing and ICT Research, Vol. 2 No. 1, June 2008
21
(population). The population size remains constant throughout the GA. Each iteration, the solutions are selected according to their fitness quality (ranking) to form new solutions (offspring). Offspring are generated through a reproduction process (Crossover, Mutation). In a multi-objective optimization, we are looking for all the solutions of best compromise. The best solutions encountered over generations are mapped (stored) into a secondary population called the “Pareto Archive”. In the selection process, solutions can be selected from this “Pareto Archive”(elitism). A part of the offspring solutions replace their parents according to the replacement strategy. In our study, we used elitist non-dominated sorting genetic algorithm NSGA-II by Deb et al. (Deb K,2002). 6. PROBLEM FORMULATION
6.1 Basic Idea Like other algorithms in the area of design automation, the algorithm of NoC communication architecture is a hard problem. Our attempt is to develop an algorithm that can give near optimal solution within reasonable time. Genetic algorithms have shown the potential to achieve the dual goal quite well (Jena, R.K, Sharma, G.K. 2006; K. Srinivasan and Karam S. Chatha 2005; T. Lei and S. Kumar 2003; A. D. Pimentel et al, 2002). As shown in Figure 3 and discussed in Section 1, the problem is solved in two phases. The first phase (P-I) is basically a task assignment problem (TA-GA). The input to the problem is a TG. We assume that all the edge delays are a constant and equal to Average Edge Delay (AED) (N. Banerjee, P. Vellanki, and K. S. Chatha 2004). The output of the first phase is a Core Communication Graph (CCG). The task of the second phase is Core-Tile-switch Mapping using genetic algorithm (CTS-GA). The next section discusses each of the phases in detail.
Figure 3: An overall design flow 6.1.1 Task Assignment Problem (TA-GA) Given a task graph (TG) ( with all edge delay are constant and equal to average edge delay) and IPs with specifications matrix containing cost and computational energy. The main objectives of this phase are to assign the tasks from the task graph to the available IPs in order to: (i) minimize the computational energy by reducing the power consumption. (ii) Minimize the total cost of the resources. The above said problem is a NP-hard multi-objective problem. We propose a multi-objective genetic algorithm based on principle of NSGA-II. Generally, in genetic algorithm, the chromosome is the representation of solution to the problem. In this case the length of each chromosome is proportional to the number of nodes in a task graph. The i-th gene in the chromosome identifies the IP which is assigns the i-th node in the task graph. One example of chromosome encoding is given in Figure 5. Each gene (node in TG) in the chromosome contains an integer which represents an IP. Every IP is chosen from the list of permissible IPs for that task. As shown in the Figure 4 the task number 2 in the task graph is assigned to IP number 7 which is chosen from set of IPs {7, 8, and 17}. We consider a single point crossover to generate the offspring’s. As for mutation operation, we consider the mutation by substitution i.e. at a time a gene in a chromosome is chosen with some random probability and the value in the gene is substituted by one of the best permissible values (i.e the index value of a IP) for the gene. The aim is to assign more tasks to a particular IP to reduce the communication between IPs i.e to minimize the number of IPs used for a task graph.
International Journal of Computing and ICT Research, Vol. 2 No. 1, June 2008
22
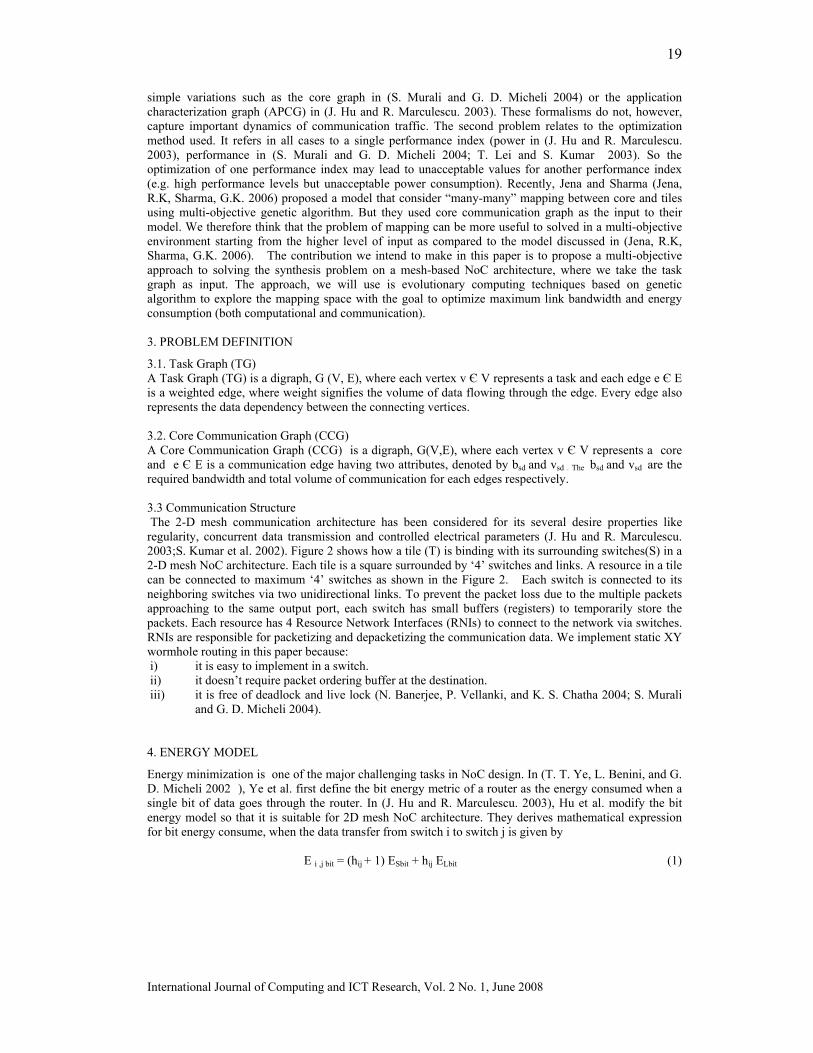
Figure 4: Chromosome encoding for task assignment .
6.1.2 Core-Tile-Switch Mapping (CTS-GA) After the optimal assignment of tasks to the IPs, we get a Core Communication Graph (CCG) as shown in the Figure4. The input to this mapping task CT-GA is a CCG and a structure of NoC back bone. In our case it is an n×m mesh. The objectives of the mapping are (i) to reduce the average communication distance between the cores (i.e to reduce number of switches in the communication path). (ii) to maximize throughput(i.e minimize the maximum link bandwidth) under the communication constraint. Core-tile mapping is a multi-objective mapping. So we use genetic algorithm based on NSGA-II. Here the chromosome is the representation of the solution to the problem, which in this case is described by the mapping. Each tile in the mesh has an associated gene which identified the core mapped to the tile. In n×m mesh, for example the chromosome is formed by n×m genes. The i-th gene identifies the core in the tiles ( row ( ⎡(i / n)⎤ ) and column (i % n)). The crossover and mutation operators for this mapping have been defined suitably as follows: Crossover: The crossover between two chromosomes C1 and C2 is generated a new chromosome C3 as follows. The optimal ( dominated) mapping between C1 and C2 is chosen. Its hot core (the hot core is the IP required maximum communication) is remapped to a random tile in the mesh, resulting a new chromosome C3. Algorithm Crossover (C1, C2) { If (C1 dominate C2) C3 = C1; e l s e C3 = C2; Swap (C3, Hot (C3), random({1,2,3,…….m×n})); Return (C3); } The function Swap(C, i, j) exchanges the i-th gene with j-th gene in the chromosome C. Mutation: The mutation operator act on a single chromosome (C ) to obtain a muted chromosome C0 as follows. A tile Ts from chromosome C is chosen at random. Indicating the core in the tile Ts as cs and ct as the core with which cs communicates most frequently, cs is remapped on a tile adjacent to Ts so as to reduce the distance between cs and ct., thus obtaining the mutated chromosome C0. The algorithm, given below describes the mutation operator. The RandomTile(C) function gives a tile chosen at random from chromosome C. The MaxCommunication(c), finds the core with which c communicates most frequently. The Row(C, T) and Col(C, T) functions give the row and column of the tile T in chromosome C respectively. Finally, the Uper, Lower, Left, Right(C, T) functions find the tile to the north, south, east and west of the tile T in chromosome C. Algorithm Mutate (C) { Chromosome C0 = C; Tile Ts = Random Tile (C0); Core cs = C0-1(Ts); Core ct = MaxCommunication (cs); Tile Tt = C0 (ct ); i f ( Row(C0 , Ts ) < Row(C , Tt ) ) T 0s = Upper (C0 , Ts ) ;
International Journal of Computing and ICT Research, Vol. 2 No. 1, June 2008
23
e l s e i f ( Row(C0 , Ts ) > Row(C0 , Tt ) ) T 0s = Lower(C0 , Ts ) ; e l s e i f ( Col(C0 , Ts ) < Col(C0 , Tt ) ) T 0s = Left(C0 , Ts ) ; e l s e T 0s = Right(C0 , Ts ) ; Swap (C0 , Ts , T 0s ) ; Return ( C0 ); }
7. EXPERIMENTAL RESULTS
This section presents the results of our multi-objective genetic formulation (MGA). The final results i.e the result obtained after completion of CTS-GA are compared with PBB algorithm (J. Hu and R. Marculescu. 2003) and MGAP algorithm (Jena, R.K, Sharma, G.K. 2006). For TA-GA, we consider NSGA-II multi-objective evolutionary algorithm technique with crossover probability 0.98 and mutation probability 0.01. For CT-GA, we consider NSGA-II with our introduced new crossover and mutation operator. Table 1 shows the bit-energy value of a link and a switch (4×4) assuming 0.18 µm technology.
ELbit ESbit
5.445pJ 0.43pJ
Table 1: Bit energy values for switch and link The value of ELbit is calculated from the following parameters. (1) length of link (2mm) (2) capacitance of wire (0.5fF/ µm) (3)voltage swing (3.3V) In our experiment, we consider three random applications, each consisting of 9, 14 and 18 cores respectively. After P-I, we found that the CCG of all three benchmarks consists of up less than 9 cores, which can be mapped on to a 3×3 mesh NoC architecture. It has been seen that the required bandwidth of an edge connected two different nodes is uniformly distributed over the range [0, 150Mbytes].The traffic volume of an edge also has been uniformly distributed over the range [0, 1Gbits]. Figure-5 shows the maximum link bandwidth utilization of three benchmarks. It is clear from the figure that our approach (MGA) saves more than 5% link bandwidth as compare to MGAP and around 15% in comparison to PBB. Figure-6 shows that our approach saves more than 70% of energy consumptions in compare to PBB( on average) and around 10% in comparision to MGAP. The real time application is a modified Motion-JPEG (M-JPEG) encoder. Which differs from traditional encoders in three ways: (i) it only supports lossy encoding while traditional encoders support both lossless and lossy encodings (ii) it can operate on YUV and RGB video data whereas traditional encoders usually operate on the YUV format, and (iii) it can change quantization and Huffman tables dynamically while the traditional encoders have no such behavior. We omit giving further details on the M-JPEG encoder as they are not crucial for the experiments performed here. Interested readers may refer to the paper by A. D. Pimentel et. al. Figure 7 shows the bandwidth requirements and energy consumptions for M-JPEG encoder application. From the figure it is clear that our approach out performs other approaches. Figure 8 shows the behavior of NSGA-II with respect to number of generations.

International Journal of Computing and ICT Research, Vol. 2 No. 1, June 2008
24
050
100150200250
1 2 3
BenchmarksM
axim
um L
ink
Ban
dwid
th(M
B/s
)
MGA PBB MGAP
Figure 5: Maximum Link Bandwidth comparisons for three random benchmarks
050
100150200250
1 2 3
Benchmarks
Enar
gy
Con
sum
ptio
ns(m
J)
MGA PBB MGAP
Figure 6: Energy comparisons for three random benchmarks
00.20.40.60.8
1
Energy Max. Link Bandwidth
Performance Matrices
Nor
mal
ized
Val
ues
MGA PBB MGAP
Figure 7: Maximum Link Bandwidth and Energy comparisons for M-JPEG
Figure 8 : M-JPEG Encoder performance using NSGA-II

International Journal of Computing and ICT Research, Vol. 2 No. 1, June 2008
25
8. CONCLUSION
In this paper we have proposed a model for topological mapping of IPs/cores in a mesh-based NoC architecture with many to many mappings between cores to switches. The approach uses heuristics based on multi-objective genetic algorithms (NSGA-II) to explore the mapping space and find the pareto mappings that optimize maximum link bandwidth and performance and power consumption. The experiments carried out with three randomly generated benchmarks and a real application (M-JPEG encoder system) confirms the efficiency, accuracy and scalability of the proposed approach. Future developments will mainly address the definition of more efficient genetic operators to improve the precision and convergence speed of the algorithm. Evaluation will also be made of the possibility of optimizing mappings by acting on other architectural parameters such as routing strategies, switch buffer sizes, etc.
9. REFERENCES
PIMENTEL, A. D, S. POLSTRA, F. TERPSTRA, A. W. VAN HALDEREN, J. E. COFFLAND, AND L. O. HERTZBERGER. 2002, Towards efficient design space exploration of heterogeneous embedded media systems. In E. Deprettere, J. Teich, and S. Vassiliadis, editors, Embedded Processor Design Challenges: Systems, Architectures, Modeling, and Simulation, volume 2268 of LNCS, Springer-Verlag, 7–73.
COELLO COELLO,., C. A, D. A. VAN VELDHUIZEN, AND G. B. LAMONT. 2002, Evolu-tionary Algorithms for Solving Multi-Objective Problems, Kluwer Academic Publishers, New York.
GLASS, C. J, AND L. M. NI 1992, The Turn Model for Adaptive Routing , In Proc.19th Ann. Int’l Symp. Computer Architecture,278-287.
DEB, K. 2002 , Multi-Objective Optimization using Evolutionary Algorithms, John Wiley and Sons Ltd, 245-253.
ZITZLER, E., AND L. THIELE 1999, Multi-objective evolutionary algorithms: A comparative case study and the strength pareto approach. IEEE Transactions on Evolutionary Computation, 4(3),.257–271.
HU, J. AND R. MARCULESCU 2003, Energy-aware mapping for tile-based NoC architectures under performance constraints. In Asia & South Pacific Design Automation Conference.
HU, J. AND R. MARCULESCU 2003(a), Exploiting the Routing Flexibility for Energy/Performance Aware Mapping of Regular NoC Architectures, In Proc. DATE’03, 688-693.
JENA, R.K, SHARMA, G.K. 2006, A multi-objective Optimization Model for Energy and Performance Aware Synthesis of NoC architecture, In Proceedings of IP/SoC, 477-482.
LAHIRI, K., A. RAGHUNATHAN, AND S. DEY 2000, Efficient Exploration of the SoC Communication Architecture Design Space, In Proc. IEEE/ACM ICCAD’00, 424-430.
SRINIVASAN, K. AND KARAM S. CHATHA 2005, ISIS : A Genetic Algorithm based Technique for Custom On-Chip Interconnection Network Synthesis, In Proceedings of the 18th International Conference on VLSI Design (VLSID’05).
LUCA BENINI AND GIOVANNI DE MICHELI 2002, Networks on Chips: A New SoC Paradigm, IEEE Computer, 70–78.
GAREY, M. R., AND D. S. JOHNSON 1979, Intractability: a guide to the theory of NP- completeness, Freeman and Company.
BANERJEE,N., P. VELLANKI, AND K. S. CHATHA 2004, A power and performance model for network-on-chip architectures, In Design, Automation and Test in Europe.
KUMAR , S., et al. 2002, A Network on Chip Architecture and Design Methodology, In Proc. ISVLSI’02, 105-112.
MURALI, S. AND G. D. MICHELI 2004, Bandwidth-constrained mapping of cores onto NoC architectures. In Design Automation, and Test in Europe, IEEE Computer Society, 896–901.
LEI, T. AND S. KUMAR 2003 , A two-step genetic algorithm for mapping task graphs to a network on chip architecture., In Euro micro Symposium on Digital Systems Design.
YE, T. T., L. BENINI, AND G. D. MICHELI 2002 , Analysis of Power Consumption on Switch Fabrics in Network Routers, In Proc. DAC’02, June, 2002,524-529.
WILLIAM J. DALLY AND BRIAN TOWLES 2002, Route Packet, Not Wires: On-Chip Interconnection Networks, In Proceedings of DAC.

International Journal of Computing and ICT Research, Vol. 2 No. 1, June 2008
26
EXTRACTION OF INTERESTING ASSOCIATION RULES USING GENETIC ALGORITHMS Peter P. Wakabi-Waiswa* Faculty of Computing and IT, Makerere University Venansius Baryamureeba, Faculty of Computing and IT, Makerere University ________________________________________________________________________ The process of discovering interesting and unexpected rules from large data sets is known as association rule mining. The typical approach is to make strong simplifying assumptions about the form of the rules, and limit the measure of rule quality to simple properties such as support or confidence. Support and confidence limit the level of interestingness of the generated rules. Comprehensibility, J-Measure and predictive accuracy are metrics that can be used together to find interesting association rules. Because these measures have to be used differently as measures of the quality of the rule, they can be considered as different objectives of the association rule mining problem. The association rule mining problem, therefore, can be modelled as a multi-objective problem rather than as a single-objective problem. In this paper we present a Pareto-based multi-objective evolutionary algorithm rule mining method based on genetic algorithms. Predictive accuracy, comprehensibility and interestingness are used as different objectives of the association rule mining problem. Specific mechanisms for mutations and crossover operators together with elitism have been designed to extract interesting rules from a transaction database. Empirical results of experiments carried out indicate high predictive accuracy of the rules generated..
Categories and Subject Descriptors: H.2.8 [Database Management]: Database Applications --- Data Mining; F.2.2 [Theory of Computation]: Analysis of Algorithms and Problem Complexity --- Non-numerical Algorithms and Problems --- Sorting and searching; G.4 [Mathematics of Computing]: Mathematical Software --- Algorithm design and analysis; G.3 [Mathematics of Computing]: Probability and Statistics --- Probabilistic algorithms I.2.8 [Artificial Intelligence]:Problem Solving, Control Methods, and Search - Heuristic methods; J.1 [Computer Applications]: Administrative Data Processing-- Business, education, marketing; General Terms: Association Rule Mining, Additional Key Words and Phrases: Interestingness, Multi-Objective Evolutionary Algorithms, Genetic Algorithms, Comprehensibility, interestingness and surprise. IJCIR Reference Format: Peter P. Wakabi-Waiswa and Venansius Baryamureeba. Extraction of Interesting Association Rules Using Genetic Algorithms. International Journal of Computing and ICT Research, Vol. 2, No. 1, pp. 26 – 33. http:www.ijcir.org/volume2-number1/article4.pdf.. ___________________________________________________________________________________
1. INTRODUCTION
Association rule mining (ARM) is one of the core data mining techniques. It aims to extract interesting correlations, frequent patterns, associations or casual structures among sets of items in the transaction databases or other data repositories. The major aim of ARM is to find the set of all subsets of items or attributes that frequently occur in many database records or transactions, and additionally, to extract rules on how a subset of items influences the presence of another subset. ARM algorithms * Author’s Address: Peter P. Wakabi, Department of Computer Science, Faculty of Computing and IT, Makerere University, P.O. Box 7062, Kampala, Uganda, [email protected] Venansius Baryamureeba, Department of Computer Science, Faculty of Computing and IT, Makerere University, P.O. Box 7062, Kampala, Uganda, [email protected] , www.cit.ac.ug "Permission to make digital or hard copies of part or all of this work for personal or classroom use is granted without fee provided that copies are not made or distributed for profit or commercial advantage and that copies bear this notice and the full citation on the first page. Copyrights for components of this work owned by others than IJCIR must be honored. Abstracting with credit is permitted. To copy otherwise, to republish, to post on servers or to redistribute to lists, requires prior specific permission and/or a fee." @International Journal of Computing and ICT Research 2008. International Journal of Computing and ICT Research, ISSN 1818-1139 (Print), ISSN 1996-1065 (Online), Vol.2, No.1, pp. 26 - 33, June 2008.

International Journal of Computing and ICT Research, Vol. 2 No. 1, June 2008
27
discover high-level prediction rules in the form: IF the condition of the values of the predicting attributes are true, THEN predict values for some goal attributes.
The task of mining association rules over market basket data was first introduced by Agrawal et al. [1993], can be formally stated as follows: Let I ={ i1 , i2, ..., im} be the set of database items and T={ t1, t2, ..., tm} be the set of transactions in the database, D, with each transaction ti having a unique identifier and containing a set of items, called an itemset. An association rule is a conditional implication among itemsets, X→Y, where X and Y are itemsets and X ∩ Y = �. An itemset can be a single item (e.g. sugar) or a set of items (e.g. runners, shorts, sugar and mineral water). An itemset with k items is called a k-itemset. A subset of k elements is called a k-subset. An itemset is said to be frequent or large if its support is more than a user specified minimum support value. The support of an itemset is the percentage of transactions in D that contain the itemset. The confidence of an association rule, given as
support (X U Y)/support (X), is the conditional probability that a transaction contains Y given that it also contains X.
In the following example of a bookstore sales database, the association rule mining task is exemplified. There are five different items (authors of novels that the bookstore deals in), I = {A, C, D, T, W}. There are six customers in the database who purchased books by these authors. The table below shows all frequent itemsets containing at least three authors (i.e. minimum − support = 50 %.). It also shows the set of all transactions
Item Abbreviation Transaction Items John Ayo A 1 ACTW Alfred Chihoma C 2 CDWBernard Dungu D 3 ACTW Thomas Babatunde T 4 ACDW Peter Walwasa W 5 ACDTWFig. 1: Items 6 CDT Fig. 2: Database Transactions Support Itemsets A → C(4/4) AC → W(4/4) TW → C(3/3) 100% C A → W(4/4) AT → C(3/3) AT→ CW(3/3) 83% W, CW A → CW(4/4) AT → W(3/3) TW→ AC(3/3) 67% A,D,T,AC,A, CD, CT,ACW D → C(4/4) AW → C(4/4) ACT→ W(3/3) 50% AT,DW,TW,ACT,ATW
CDW,CTW,ACTW T → C(4/4) DW → C(3/4) ATW→ C(3/3)
W → C(5/5) TW → A(3/3) CTW→ A(3/3)Fig. 3: Frequent Itemsets Fig. 4: Association Rules Considering the first association rule A → C [support =50%, confidence=67%], which says that 50% of people buy books authored by John Ayo (A) and those by Alfred Chihoma (C ) together, and 67% of the people who buy books written by John Ayo (A) also purchase those by Alfred Chihoma (C ).
According to Zaki [1999] the mining task involves generating all association rules in the database that have a support greater than the minimum support (the rules are frequent) and have a confidence greater than minimum confidence (rules are strong). The ARM problem is an NP-Hard problem because finding all frequent itemsets (FI’s) having a minimum support results in a search space of 2m , which is exponential in m, where m is the number of itemsets. The final step involves generating strong rules having a minimum confidence from the frequent itemsets. It also includes generating and testing the confidence of all rules. Since each subset of X as the consequent must be considered, the rule generation step’s complexity is O(r.2ℓ), where r is the number of frequent itemsets, and ℓ is the longest frequent itemset.
Traditionally, ARM was predominantly used in market-basket analysis but it is now widely used in other application domains including customer segmentation, catalogue design, store layout, and telecommunication alarm prediction. ARM is computationally and I/O intensive. The number of rules grows exponentially with the number of items. Because data is increasing in terms of both the dimensions (number of items) and size (number of transactions), one of the main attributes needed in an ARM algorithm is scalability: the ability to handle massive data stores. Sequential algorithms cannot provide scalability, in terms of the data dimension, size, or runtime performance, for such large databases.

International Journal of Computing and ICT Research, Vol. 2 No. 1, June 2008
28
In this paper, we shall deal with the ARM problem as a multi-objective problem rather than as a single one and try to solve it using multi-objective evolutionary algorithms (MOEA) with emphasis on genetic algorithms (GA). The main motivation for using GAs is that they perform a global search and cope better with attribute interaction than the greedy rule induction algorithms often used in data mining tasks. Multi-objective optimisation with evolutionary algorithms is well discussed by Fonseca and Fleming [1998] and Freitas [2003].
Throughout this paper, we use the following notation. The support of an itemset X, which is the number of transactions in which that itemset occurs as a subset, is denoted by σ(X). The rule’s support is
the joint probability of a transaction containing both X and Y, and is denoted by σ(X U Y). The confidence of the rule (also known as the predictive accuracy of a rule) is the conditional probability that a
transaction contains Y, given that it contains X and is given as σ(X U Y)/σ(X). !denotes a logical negation.
The rest of this paper is organised as follows. In Section 2 we provide an overview of work related to the association rule mining problem. In Section 3 we discuss the proposed MOEA. In Section 4, the proposed algorithm is presented. In Section 5 the analysis of the results is presented. Section 6 is the conclusion.
2. RELATED WORK
The Association Rule mining problem was introduced in 1993 by Agrawal et al. [1993]. Agrawal et al. [1993] developed the Apriori algorithm for solving the association rule mining problem. Most of the existing association rule mining algorithms are improvements to the Apriori algorithm [Ghosh and Nath 2004; Zhao and Bhowmick 2003], and are referred to as Apriori-based algorithms. These algorithms work on a binary database, termed as the market basket database. On preparing the market basket database, every record of the original database is represented as a binary record where the fields are defined by a unique value of each attribute in the original database. The fields of this binary database are often termed as an item. For a database having a huge number of attributes and each attribute containing a lot of distinct values, the total number of items will be huge. Storage requirements resulting from the binary database is enormous and as such it is considered one of the limitations of the existing algorithms. The Apriori-based algorithms work in two phases. The first phase is for frequent itemset generation. The itemsets are used for generating interesting rules. A rule is said to be interesting if its confidence is above a user’s specified minimum confidence. Frequent itemsets are generated by searching from all-possible itemsets the itemsets whose support is greater than the user specified minimum support. If the value of minimum support is too high, the number of frequent itemsets generated will be less, and thereby resulting in generation of few rules. And, if the value is too small, then almost all possible itemsets will become frequent and thus a huge number of rules may be generated. This causes inference basing on these rules to be difficult. After detecting the frequent itemsets in the first phase, the second phase generates the rules using minimum confidence. Confidence factor or predictive accuracy of a rule is defined as:
Confidence = σ(XU Y)/σ(X) (1)
Another limitation of the Apriori-based algorithms is the encoding scheme where separate symbols are used for each possible value of an attribute [Ghosh and Nath 2004]. This encoding scheme may be suitable for encoding the categorical valued attributes, but not for encoding the numerical valued attributes as they may have different values in every record. To avoid this situation, some ranges of values may be defined. For each range of values an item is defined. This approach is also not suitable for all situations. Defining the ranges will create yet another problem, as the range of different attributes may be different.
Existing Apriori-based algorithms, measure the quality of a generated rule by considering only one evaluation criterion, i.e., confidence factor or predictive accuracy [Ghosh and Nath 2004]. This criterion evaluates the rule depending on the number of occurrences of the rule in the entire database.
In this work we propose to develop an algorithm that uses comprehensibility, interestingness, and predictive accuracy as measures of the quality of the rules and apply them as objectives to model the association rule mining problem as a multi-objective problem. The details of these measures are given in the following section.

International Journal of Computing and ICT Research, Vol. 2 No. 1, June 2008
29
3. MULTI-OBJECTIVE OPTIMIZATION AND RULE MINING PROBLEMS
It is not an easy task to find a single solution for a multi-objective problem. In such situations the best approach is to find a set of solutions depending on non-dominance criterion. At the time of taking a decision, the solution that seems to fit better, depending on the circumstances can be chosen from the set of these candidate solutions. A solution, say a, is said to be dominated by another solution, say b, if and only if the solution b is better or equal with respect to all the corresponding objectives of solution a, and b is strictly better in at least one objective. Here solution b is called a non-dominated solution. So it will be helpful for the decision-maker, if a set of such non-dominated solutions can be found. Vilfredo Pareto suggested this approach for solving the multi objective problem. Optimization techniques based on this approach are called Pareto optimization techniques. Based on this idea, several genetic algorithms were designed to solve general multi-objective problems [Ghosh and Nath 2004]. In association rule mining, if the number of conditions involved in the antecedent part is less than the one in the consequent part, the rule is more comprehensible. We therefore require an expression where the number of attributes involved in both parts of the rule has some effect. The following expression can be used to quantify the comprehensibility of an association rule
Comprehensibility = log(1+ |Y|)+ log(1+ |XU Y|) (2)
Here, |Y| and |XU Y| are the number of attributes involved in the consequent part and the total rule, respectively. It is important that we extract only those rules that have a comparatively less occurrence in the entire database. Such a surprising rule may be more interesting to the users; which again is difficult to quantify. According to Liu et al. [2000], the interestingness issue has long been identified as an important problem in data mining. It refers to finding rules that are interesting/useful to the user, not just any possible rule. The reason for its importance is that, in practice, it is all too easy for a data mining algorithm to discover a huge range of rules most of which are of no interest to the user. To find interestingness, the data set is divided based on each attribute present in the consequent part. Since a number of attributes can appear in the consequent part and they are not predefined, this approach may not be feasible for association rule mining. So a new expression is defined which uses only the support count of the antecedent and the consequent parts of the rules, and is defined as
I = [σ(X U Y )/σ(X)] × [σ(| X U Y |)/σ(Y )] × [1 − σ(X U Y )/ |D|)] (3)
where I is interestingness and |D| is the total number of records in the database, σ(XU Y)/σ(X) gives the
probability of generating the rule depending on the antecedent part, σ(|XU Y|)/σ(Y )gives the probability
of generating the rule depending on the consequent part, and σ(XU Y )/|D|) gives the probability of generating the rule depending on the whole dataset. This means that the complement of this probability will be the probability of not generating the rule. Thus, a rule having a very high support count will be measured as less interesting. On top of comprehensibility, interestingness and support count there are other metrics that can be used in generating more informative rules. The other good metrics include J-Measure and entropy. The J-Measure is a good indicator of the information content of the generated rules. In rule inference we are interested in the distribution of the rule “implication” variable Y, and especially its two events y and
complement y . The purpose is to measure the difference between the priori distribution f(y), i.e. f(Y = y) and f(Y ≠ y), and the posteriori distribution f(Y | X). The J-Measure gives the average mutual information between the events y and f(Y = y). The J-Measure shows how dissimilar our a priori and posteriori beliefs are about Y meaning that useful rules imply a high degree of dissimilarity. The J-Measure is calculated as:
JM = ⎟⎟⎠
⎞⎜⎜⎝
⎛
−
−−+⎟
⎟⎠
⎞⎜⎜⎝
⎛
)(1))(1(
2log).(1()()(
2log).(yfxyf
xyfyfxyf
xyf
(4) where JM is the J-Measure. The entropy, on the other hand, measures the level of surprise in the rule(s). Entropy, also called surprisal, measures the amount of randomness or surprise or uncertainty. It is calculated as follows: Given probabilities p1, p2, ..., pn whose sum is 1:

International Journal of Computing and ICT Research, Vol. 2 No. 1, June 2008
30
Entropy H(pi) = ∑=
n
i
ipip0
2 )(.log)(
(5) 4 GENETIC ALGORITHMS WITH MODIFICATIONS We propose to solve the association rule-mining problem with a Pareto based multiple-objective genetic algorithm. The possible rules are represented as chromosomes and a suitable encoding/decoding scheme has been defined. Genetic algorithms (GAs) for rule discovery can be divided into two broad approaches, the Michigan approach and the Pittsburgh approach [Dehuri et al. 2006]. The biggest distinguishing feature between the two is that in the Michigan approach (also referred to as Learning Classifier Systems) an individual is a single rule, whereas in the Pittsburgh approach each individual represents an entire set of rules.
In the context of this research the use of the term Michigan approach will denote any approach where each GA individual encodes a single prediction rule. The choice between these two approaches strongly depends on which kind of rule is to be discovered. This is related to which kind of data mining task being addressed. Suppose the task is classification. Then evaluate the quality of the rule set as a whole, rather than the quality of a single rule. In other words, the interaction among the rules is important. In this case, the Pittsburgh approach seems more natural [Frietas 2002].
On the other hand, the Michigan approach might be more natural in other kinds of data mining tasks. An example is a task where the goal is to find a small set of high-quality prediction rules, and each rule is often evaluated independently of other rules. The Pittsburgh approach directly takes into account rule interaction when computing the fitness function of an individual. However, this approach leads to syntactically-longer individuals, which tends to make fitness computation more computationally expensive. In addition, it may require some modifications to standard genetic operators to cope with relatively complex individuals.
By contrast, in the Michigan approach the individuals are simpler and syntactically shorter. This tends to reduce the time taken to compute the fitness function and to simplify the design of genetic operators. However, this advantage comes with a cost. First of all, since the fitness function evaluates the quality of each rule separately, now it is not easy to compute the quality of the rule set as a whole - i.e. taking rule interactions into account. Another problem is that, since we want to discover a set of rules, rather than a single rule, we cannot allow the GA population to converge to a single individual which is what usually happens in standard GAs. This introduces the need for some kind of niching method. The need for niching in the Michigan approach may be avoided by running the GA several times, each time discovering a different rule. The drawback of this approach is that it tends to be computationally expensive.
We have, therefore, used a modified Michigan encoding/decoding scheme which associates two bits to each attribute. If these two bits are 00 then the attribute next to these two bits appears in the antecedent part and if it is 11 then the attribute appears in the consequent part. And the other two combinations, 01 and 10 will indicate the absence of the attribute in either of these parts. So the rule ACF → BE will look like 00A 11B 00C 01D 11E 00F. In this way we can handle variable length rules with more storage efficiency, adding only an overhead of 2k bits, where k is the number of attributes in the database. The decoding is performed as follows:
DV = minval + (maxval − minval) × (∑ (2i−1 × ith bitvalue)/(2n − 1)) (6) where DV is the decoded value; 1 ≤ i ≤ n and n is the number of bits used for encoding; minval and maxval are minimum and maximum values of the attribute; and bitvalue is the value of the bit in position i. For brevity, this encoding scheme will not deal with relational operators and as such the rules generated from this formula will not include relational operators.
Due to the fact that there may be a large number of attributes in the database, we propose to use multi-point crossover operator. There are some difficulties to use the standard multi-objective GAs for association rule mining problems. In case of rule mining problems, we need to store a set of better rules found from the database. Applying the standard genetic operations only, the final population may not contain some rules that are better and were generated at some intermediate generations. The better rules generated at intermediate stages should be kept. For this task, an external population is used. In this population no genetic operation is performed. It will simply contain only the non-dominated chromosomes of the previous generation. At the end of first generation, it will contain the non-dominated chromosomes of the first generation. After the next generation, it will contain those chromosomes, which are non-dominated among the current population as well as among the non-dominated solutions till the previous generation.

International Journal of Computing and ICT Research, Vol. 2 No. 1, June 2008
31
The scheme applied here for encoding/decoding the rules to/from binary chromosomes is that the different values of the attributes are encoded and the attribute names are not. For encoding a categorical valued attribute, the market basket encoding scheme is used. For a real valued attribute their binary representation can be used as the encoded value. The range of values of that attribute will control the number of bits used for it.
The archive size is fixed, i.e., whenever the number of non-dominated individuals is less than the predefined archive size, the archive is filled up by dominated individuals. Additionally, the clustering technique used does not loose boundary points. 4.1 Fitness Assignment As discussed earlier, we use a set of three complementary metrics as criteria for filtering out interesting rules. We combine these metrics into an objective fitness function. The complementary set of measures include confidence defined in equation (1), comprehensibility defined in equation (2) and J-Measure defined in equation (4). The fitness function is calculated as the arithmetic weighted average confidence, comprehensibility and J-Measure. The fitness function (f(x)) is given by:
( )
wwwwww ConfidenceMeasureJibilityComprehens
xf
321
321***
)(++
+−+=
(7)
where www 321,
are user-defined weights. 4.2 Environmental Selection Due to the fact that genetic algorithms (GA) are rooted in natural genetics, most of the terminologies in the GA field are analogous to that used in natural evolution. In a genetic algorithm, the environment is the problem under consideration and each of the organisms is a solution to the problem. Each potential solution to a GA problem is called an individual. Each individual is made up of genes (often represented as a set of numbers).
Two things must be determined in order to apply a genetic algorithm to a given problem: i) a genetic code representation and ii) a fitness or objective function, which assigns a quality measure to each solution according to its performance. The encoding of the parameters in genetic algorithms depends on the problems at hand.
A group of individuals, called a population, is stored and modified with each iteration of the algorithm. In GA’s iterations are referred to as generations. The selection of these individuals is based on their fitness. Individuals in each new generation carry forward genes from the previous generations, and the individuals which are more fit will tend to survive and reproduce.
The number of individuals contained in the archive is constant over time, and the truncation method prevents boundary solutions being removed. During environmental selection, the first step is to copy all non-dominated individuals, i.e., those which have a fitness lower than one, from archive and population to the archive of the next generation. If the non-dominated front fits exactly into the archive the environmental selection step is complete. In case the archive is too small, the best dominated individuals in the previous generation and population are copied to the new archive. Otherwise, truncate the archive.
5. EXPERIMENTS Experiments were conducted using real-world Zoo dataset*. For brevity, the data used is of a categorical nature. The Zoo database contains 101 instances corresponding to animals and 18 attributes. The attribute corresponding to the name of the animal was not considered in the evaluation of the algorithm. This was mainly due to its descriptive nature. The attribute from the datasets that were used for analysis include: hair [H], feathers [F], eggs [E], milk [M], predator [P], toothed [TH], domestic [D], backbone [B], fins [N], legs [L], tail [T], cat-size [C], airborne [A], aquatic [Q], breathes [BR], venomous [V], and type [Y].
Default values of the parameters are: Population size = 40, Mutation rate = 0.5, Crossover rate =0.8, Selection in Pareto Archive (elitism) = 0.5. The stopping criterion used is the non evolution of the archive during 10 generations, once the minimal number of generations has been over passed.
* UCI Machine Learning Repository; http://www.cs.uci.edu/mlearn/MLRepository.html, accessed June 2006

International Journal of Computing and ICT Research, Vol. 2 No. 1, June 2008
32
5.1 Results and Discussion
In the following table are the results of the experiments conducted. In the first column is the discovered rule, in the second column is the rule’s comprehensibility, in the third is the J-Measure of the rule and in the last column is the predicative accuracy of the rule. In these tests, different predictions were made by combining different attributes to determine a result.
The following are results from the given data
Discovered Rule Compre- J-Meas Predictive hensibility ure Accuracy
If (!H and E and !M and B and T and D) Then (!P) 0.97 0.84 0.90 If(!A and Q and B and C) Then (P) 0.95 0.77 0.94 If(E and A and P and !V) Then (!D) 0.96 0.66 0.98 If(!E and !Q and !T) Then (D) 0.97 0.93 0.50 If(!E and !V and !D) Then (Y=1) 0.95 0.87 0.98 If(F and !V and !D) Then (Y=2) 0.94 0.93 0.97 If(E and !Q and P and TH and !N and !D and !C) Then(Y=3) 0.94 0.97 0.83 If(Q and !BR and !V and T) Then(Y=4) 0.93 0.93 0.95 If(!A and Q and T and BR and !C) Then(Y=5) 0.94 0.98 0.80 If(A=1)and(!N)and(!T) Then(Y=6) 0.93 0.96 0.90 If(P)and(BR)and(!T)and (!D) Then(Y=7) 0.95 0.95 0.92
As it is indicated in the results table, overall the discovered rules have a high predictive accuracy and are quite interesting. Four rules have a predictive accuracy of over 90% while seven rules have a J-Measure of over 90%. Three rules have a high predictive accuracy of over 80%. Only two rules have a predictive accuracy of less than 50%. 6. CONCLUSION AND FUTURE WORK
We have dealt with a challenging NP-Hard association rule mining problem of finding interesting association rules. The results reported in this paper are very promising since the discovered rules are of a high comprehensibility, high predictive accuracy and of a high interestingness values. However, a more extensive empirical evaluation of the proposed multi-objective algorithm will be the objective of our future research. We also intend to extend the algorithm proposed in this paper to cope with continuous data since the current one handles only categorical data. The incorporation of other interestingness measures mentioned in the literature is also part of our planned future work.
References AGRAWAL, R., IMIELINSKI, T., AND SWAMI, A. 1993. Mining Association Rules Between Sets of
Items in Large Databases. Proc. of the 1993 ACM SIGMOD Conf. on Management of Data. AGRAWAL, R., SRIKANT, R.1994. Fast Algorithms for Mining Association Rules. Proc. of the 20th Int’l
Conf. on Very Large Data Bases. LIU, B., HSU, W., CHEN, S., AND MA, Y. 2000. Analyzing the Subjective Interestingness of Association Rules. IEEE Intelligent Systems. FONSECA, M. C., FLEMING J. P. 1998. Multi-objective Optimization and Multiple Constraint Handling
with Evolutionary Algorithms-Part I: A Unified Formulation. IEEE Transactions on Systems, Man and Cybernetics - Part A: Systems and Humans, 28(1):26-37
GHOSH, A., NATH, B. 2004. Multi-objective rule mining using genetic algorithms. Information Sciences 163 pp 123-133
FREITAS, A. A. 2003. A Survey of Evolutionary Algorithms for Data Mining and Knowledge Discovery. Advances in evolutionary computing: theory and applications, Pp 819 - 845
DEHURI, S., JAGADEV, A. K., GHOSH A. AND MALL R. 2006. Multi-objective Genetic Algorithm for Association Rule Mining Using a Homogeneous Dedicated Cluster of Workstations.
American Journal of Applied Sciences 3 (11): 2086-2095, 2006 ISSN 1546-9239

International Journal of Computing and ICT Research, Vol. 2 No. 1, June 2008
33
KHABZAOUI, M., DHAENES, C., AND TALBI, E. 2005. Parallel Genetic Algorithms for Multi- Objective rule mining. MIC2005. The 6th Meta-heuristics International Conference, Vienna,
Austria. LIU, B., HSU, W., CHEN, S. AND MA, Y. 2000. Analyzing the Subjective Interestingness of
Association Rules. IEEE Intelligent Systems. ZAKI, M.J. 2001. Generating non-redundant association rules. In Proceedings of the Sixth ACM-
SIGKDD International Conference on Knowledge Discovery and Data Mining, New York, NY: ACM, 34-43.
ZHAO, Q., BHOWMICK, S. S. 2003. Association Rule Mining: A Survey. Technical Report, CAIS, Nanyang Technological University, Singapore, No. 2003116 , 2003.
ZITZLER, E., DEB, K., AND THIELE,L. 1998. An evolutionary Algorithm for Multi-objective Optimization: The Strength Pareto Approach
ZITZLER, E., DEB, K., AND THIELE, L. 2000. Comparison of Multi-objective Evolutionary Algorithms: Empirical Results. Evolutionary Computation Vol. 8 Number 2 pp 173 -195
ZITZLER, E., LUAMANNS, M., AND THIELE, L. 2001. SPEA2: Improving the Strength Pareto Evolutionary Algorithm. Computer Engineering and Networks Laboratory (TIK), TIK-Report 103
International Journal of Computing and ICT Research, Vol. 2 No. 1, June 2008
34
AN EMPIRICAL STUDY TO COMPARE THREE METHODS FOR SELECTING COTS SOFTWARE COMPONENTS
Tom Wanyama* Department of Electrical and Computer Engineering Schulich School of Engineering, University of Calgary
Behrouz H. Far Department of Electrical and Computer Engineering Schulich School of Engineering, University of Calgary
_________________________________________________________________________________ Component Based Software Developers are faced with the challenge of selecting appropriate Commercial Off-The-Shelf (COTS) products, because the marketplace is characterized by a variety of products and product claims, extreme quality and capability differences between products, and many products incompatibilities. Although a multiplicity of COTS selection method have been proposed in literature, most developer still select COTS products using ad hoc methods. One of the main reason being, COTS selection method do not provide all or most of the required support and guidance required for carrying out the COTS selection process. Moreover, literature on COTS selection methods rarely mentions the limitations of the methods. Therefore, we carried out an empirical study to compare three COTS selection methods; the process and results of the study are presented in this paper. The main objective of the study was to point out the differences between the COTS selection methods, that is if any existed, and to determine the ability of each of the methods to provide adequate COTS selection support and guidance. The ability of a method to provide adequate COTS selection support and guidance was measured in terms of the user satisfaction and confidence in the selection process, as well as in the results of the process. Categories and Subject Descriptors: K.6 [Management of Computing and Information Systems]: Project and People Management - Systems analysis and design; Systems development; K.6.3 [Software Management]: Software development, D.2 [Software Engineering]: Requirements/Specifications - Methodologies (e.g., object-oriented, structured; Tools; D.2.10 [Design]: Methodologies General Terms: Design, Experimentation, Human Factors Additional Key Words and Phrases: Decision Support System; Negotiation; Selection, Group-Choice, Stakeholders; Preferences _________________________________________________________________________________ IJCIR Reference Format: Tom Wanyama and Behrouz H. Far. An Empirical Study to Compare Three Methods for Selecting Cots Software Components. International Journal of Computing and ICT Research, Vol. 2, No. 1, pp. 34 - 46. http:www.ijcir.org/volume2-number1/article5.pdf. __________________________________________________________________________
1. INTRODUCTION
The use of Commercial-Off-The-Shelf (COTS) is increasingly becoming common because of shrinking budgets, accelerating rates of COTS products enhancement, development time and effort constraints, and expanding system requirements. Generally, COTS software products have the ability to reduce time and * Author’s Address: Tom Wanyama, Department of Electrical and Computer Engineering, Schulich School of Engineering, University of Calgary, 2500 University Drive, N.W., Calgary, Alberta, Canada, T2N 1N4, www.enel.ucalgary.ca Behrouz H. Far, Department of Electrical and Computer Engineering, Schulich School of Engineering, University of Calgary, 2500 University Drive, N.W., Calgary, Alberta, Canada, T2N 1N4, www.enel.ucalgary.ca
"Permission to make digital or hard copies of part or all of this work for personal or classroom use is granted without fee provided that copies are not made or distributed for profit or commercial advantage and that copies bear this notice and the full citation on the first page. Copyrights for components of this work owned by others than IJCIR must be honored. Abstracting with credit is permitted. To copy otherwise, to republish, to post on servers or to redistribute to lists, requires prior specific permission and/or a fee." @International Journal of Computing and ICT Research 2008. International Journal of Computing and ICT Research, ISSN 1818-1139 (Print), ISSN 1996-1065 (Online), No.2, pp. 34 - 46, June 2008.

International Journal of Computing and ICT Research, Vol. 2 No. 1, June 2008
35
cost of software development (Wanyama et al., 2005)2. Moreover, they enable software buyers to acquire software made up of components, which have been tested many times by other users; hence ensuring improved software quality (Alves et al., 2003)2. However, in order to realize the benefits which COTS products bring to software development, it is imperative that the “right” products are selected for projects, because selecting inappropriate products may result in increased time, cost, and effort requirements for software development; which COTS-Based Software Development (CBSD) aims at reducing. The selection of COTS products is a major challenge to COTS-Based Software developers, due to the multiplicity of similar COTS products on the market with varying capabilities and quality differences. Moreover, COTS selection is a complex decision-making problem that is characterized by uncertainty, complexity, multiple stakeholders, multiple objectives (Wanyama et al., 2005)2. To address these challenges, it is generally agreed in literature that robust COTS selection methods are necessary (Alves et al., 2003)1 , (Bianchi et al., 2002), (Cavanaugh et al., 2002), (Kontio et al., 2000), (Ruhe, 2003). Consequently, many COTS selection methods have been proposed. Unfortunately, none of these methods is accepted as a standard selection method. Moreover, the selection of COTS products is largely still carried out using ad hoc methods (Ruhe, 2003), (Wanyama et al., 2005)2. The most unfortunate thing about all this is that researchers in COTS selection are continuously proposing new COTS selection methods without taking a break to evaluate available methods based of the users needs through empirical studies. This would assist in identifying the major COTS selection challenges that users of COTS selection methods need to be addressed.
Curious about why the industry had failed to adopt some of the proposed COTS selection methods in literature to address the challenges of COTS selection, we studied the COTS selection problem and identified the following major challenges associated with the problem:
• Generation of high-level information used for decision-making • Need for hierarchical decision-making • Many similar COTS products • Multiple COTS selection objectives • Changing COTS features due to updates • Multiple Stakeholders • Management of information for the current and previous COTS selection processes • Selection of COTS products for the different subsystems Thereafter, we evaluated the following eleven most prominent COTS selection methods based on how
they address the challenges that we identified: Off-The Shelf Option (Kontio et al., 2000), Comparative Evaluation Process (Cavanaugh et al., 2002), COTS-based Requirements Engineering (Alves et al., 2003)1 and (Alves, 2003), COTS-Aware Requirements Engineering (Chung et al., 2002), Procurement- Oriented Requirements Engineering (Ncube et al., 2003, COTS Acquisition Process (Ochs et al., 2000), QUESTA (Hansen, 2003), Storyboard (Comella-Dorda et al., 2002), and, Socio-Technical Approach to COTS Evaluation (Kunda et al., 1999), PECA (Comella-Dorda et al., 2002), and Combined Selection of COTS Components (Burgues et al., 2002). Furthermore, we reviewed the COTS selection methods to determine the extent each of them had been employed in industry. In this study we found out that none of the COTS selection methods that we evaluated addressed at least, 50% of the selection challenges. Moreover, we found out that most of the methods had never been applied in industry, and that the few that had been applied before, had been employed by the people who developed them or who sponsored their development (see Wanyama and Far (Wanyama et al., 2005)2).
Having identified the challenges of COTS selection and the shortfalls of the reviewed COTS selection methods, we developed a framework for COTS selection at the University of Calgary, which comprises of a process model as well as an associated Decision Support System (DSS) (See Wanyama and Far (Wanyama et al., 2005)1). This framework addresses the first seven challenges mentioned above. Thereafter we carried out an empirical study involving the framework we developed and three other prominent COTS selection methods to determine the views the users of COTS selection methods on the functionalities of the methods. Our concern at this moment was to determine the major concerns of the users of COTS selection method that would assist us to improve our framework for COTS selection. The focus of this paper is not the framework for COTS selection that we developed, but the empirical study that we carried out as part of the validation of the framework. Therefore, the main objective of this paper is to draw attention to the functionalities of COTS selection methods that people involved in the selection of COTS products find to be important. We believe that results of this study are needed to assist developers of COTS selection methods to identify the issues that need to be addressed.
This paper is arranged as follows; Section 2 presents work that is related to the focus of this paper, and in Section 3 we describe the COTS selection methods that were evaluated in the empirical study. Section 4 deals with the design of the empirical study, while Section 5 addresses the process of the study. In Section 6 we present the results and in Section 7 the results presented in Section 6 are discussed.

International Journal of Computing and ICT Research, Vol. 2 No. 1, June 2008
36
Section 8 deals with the threats and limitations of the empirical study, and Section 9 presents the conclusions and future work.
2. RELATED WORK
Empirical studies have been used in many cases to identify, to learn about, and to address various issues that affect CBSD. For example, Bianchi, Caivano, Conradi and Jaccheri (Bianchi et al., 2002) carried an empirical study to assess the COTS products’ characterization parameters that they proposed. The main objective of the assessment was to find any statistically significant relationship between the proposed parameters and the effectiveness of development and maintenance process. Li, Bjornson, and Conradi (Li et al., 2004) carried out an empirical study to determine the variations in the CBSD processes in the Norwegian Information Technology (IT) industry. The study identified four activities that were specifically associated with CBSD, namely: build vs. buy decision, selection of COTS products, learning and understanding COTS products, integration of COTS products. Furthermore, the study identified a new software development role, that of the knowledge keeper. Li, Conradi, Bunse, and Torchiano (Li et al., 2006) report an international survey that was carried out in Norway, Italy and Germany. The focus of the study was to determine why project decision-makers choose to use Open Sources Software (OSS) instead of COTS products and vice versa. The survey covered 83 projects that used COTS products only and 44 projects that used OSS only. This paper presents an empirical study that was carried out in the department of Electrical and Computer engineering at the University of Calgary, to validate a framework for COTS selection, which we developed. The validation process was carried out by comparing the framework with two COTS selection methods in literature, in terms of the ability to facilitate the process of COTS selection. The two methods: the Comparative Evaluation Process (CEP) and the COTS-based Requirements Engineering (CRE) were selected for the experiment because they are some of the few COTS selection methods that have been applied in practice.
3. DESCRIPTION OF THE COTS SELECTION METHODS THAT WERE STUDIED The following is a brief description of CEP, CRE, and the framework for COTS selection that was developed at the University of Calgary.
3.1 The Comparative Evaluation Process Selection
The Comparative Evaluation Process (CEP) is presented in detail in Cavanaugh and Polen (Cavanaugh et al., 2002). The COTS evaluation method is based on a spreadsheet model which assists decision maker when comparing similar COTS products based on the discrimination criteria. The decision model is based on the decision theory model of simple weighted averages. The simple averages model is applied to each evaluation criterion as follows:
• Define the importance weight (local weight) of the criteria categories • Define the importance weight (local weight) of every criterion in each criteria category. • For each criterion, determine the product of the criteria weight and the weight of the
corresponding criteria category to determine the global weight iw of the criterion i .
• Define the performance weight iP of every alternative COTS product in each evaluation criterion i .
• Select the credibility score ci of every criterion i for each product p from Table 1. The credibility score of a criterion is determined by the sources of information for the COTS product, about the features of the product associated with the evaluation criterion [9].
• Determine the performance score ( Pscore pK
) of each product p in every criteria category K using Equation 1.
Pscore pK=∑
i= 1
n Pi wi ci
100 , (1)
where n is the number of criteria in category K, and the one hundred in Equation 11.1 is a normalizing factor for maximum score of a hundred.
• The final score ( Fscore p ) of each product p , that reflects the ability of the product to satisfy the project conditions is determined using Equation 2.

International Journal of Computing and ICT Research, Vol. 2 No. 1, June 2008
37
Fscore p= ∑K = 1
M
Pscore pK
, (2)
• M is the number of criteria categories.
Credibility Value Description Verified 10 Verified by the decision maker Demonstrated 7 Witness in a demonstration Observed 5 Seen but have not been studied Heard/Read about 3 Described by another user or
vendor, or read about in vendor documentation
Table1: Rating of the Credibility of Information Sources Table 2 illustrates the process of defining the criteria global weights. The table shows that the quality criteria category has a local weight of 75% and the business concerns category has weight of 25%. In addition, the table shows that the local importance of reliability is 30%, thus the global weight of reliability is 22.5%.
First Level of Criteria Hierarchy (local weight)
Second Level of Criteria Hierarchy (local weight)
Global Weight
1. Reliability (30%) 22.5% 1. Quality (75%) 2. Security (70%) 52.5% 1. Products Price (50%) 12.5% 2. Business Concerns (25%) 2. License Conditions (50%) 12.5%
Total 100% Table 2: Example of Global Weight Calculation Since CEP does not have a specific model for information sharing, the subjects using it were allowed to use any of the following communication means for information sharing: face-to-face meetings, telephone, email and/or web page.
3.2 COTS-based Requirements Engineering
COTS-based Requirements Engineering (CRE) is presented in Alves, and Castro (Alves et al., 2003)1 and in Alves (Alves, 2003), The method requires that selection of COTS products be based on the balance between estimated cost and estimated benefit that the products may bring to the project. However, the method does not provide any guidance on how to achieve the balance between the estimated cost and benefit. Therefore, the subjects who used CRE were allowed to make their final COTS selection decision based on their view of balance between cost and benefit associated with the COTS products. The MCDM model in Equation 3 is used to estimate the ability of the alternative COTS products to satisfy the quality requirements of the project.
Score j=∑i= 1
k
a ji wi , (3)
where Score j is the ability of COTS product j to satisfy the project conditions, k is the number of
evaluation criteria, a ji is the strength of COTS product j in criterion i , and wi is the weight of criterion i . Moreover, the total estimated cost of each product was determined by adding up all the costs associated with the product. Since the method does not have a specific model for information sharing, the communication methods stated in Section 3.2 were used.
3.3 Framework for COTS Selection
The framework for COTS selection is presented in Wanyama and Far (Wanyama et al., 2005)1. It has a process model that guides the users through the various steps of COTS selection, as well as an integrated web-based Decision Support System (DSS) that has the following functionalities:
Support for defining the evaluation criteria and the criteria weights.

International Journal of Computing and ICT Research, Vol. 2 No. 1, June 2008
38
MCDM model for integrating the performance of the alternative COTS products in each evaluation criteria into scores that reflect the ability of the products to satisfy the project conditions.
Negotiation support for multiple stakeholders and for multiple selection objectives 1. Support for identification of agreement options, and for determining a balance among
selection objectives 2. Support for tradeoff.
Inbuilt discussions web-page Inbuilt email communication with auto notification capabilities Support for access to expert information. Support for access to lessons-learned from previous COTS selection processes
4. DESIGN OF THE EMPIRICAL STUDY Fifteen software engineering students in the Department of Electrical and Computer Engineering at the University of Calgary were the subjects of this study. Eleven of the students were in the final year of the undergraduate degree course, and four students were postgraduates. The target population of subjects was the senior students of Software Engineering, because such students have some background knowledge of COTS-based or at least component-based software development. Seventeen students applied to participate in the study as subjects of the study, and since we wanted to have three groups with equal number of subjects, we selected fifteen subjects by assigning numbers to all applicants, and then used a random number generator to select the applicants who participated in the study. To avoid bias, the subjects were assigned to the groups by assigning each of them a number then used the random number generator to randomly assign the numbers of the subjects to a randomly selected group. In addition, we made sure that none of the subjects had prior COTS selection experience, because such subjects would have expertise that was generally lacking with respect to most subjects. The subjects were required to select a COTS product for a project that had already been structured by the project manager (the principal author of this paper). Moreover, the alternative COTS products, as well as the grand set of the selection criteria had been identified. The experiment had three components, namely: COTS selection based on CEP, COTS selection based on CRE, and COTS selection based on the framework for COTS selection. The three components of the experiment were carried out concurrently. Therefore, the subjects were divided into three groups of five subjects, each. The COTS product being selected was meant to solve the problem that was used as an example in Wanyama and Far (Wanyama et al., 2005)1.
In the example, an organization dealing in Chinese food intends to change its business model from delivering food households based upon phone orders to building a webshop where orders can be placed. The system should be able to receive and process orders by telephone, email, SMS, and internet (Web site access). Moreover, it should process credit card payments, and allow for interconnection among outlets so that if a product requested by the customer is not available at one outlet, it forwards the order automatically to the nearest outlet where that product is available. The team developing the software for the webshop intends to use a COTS product to provide most of the functional requirements, then develop the extra requirements and interfaces inhouse. On noticing that the available COTS product alternatives fulfil the same functionalities, the team decides to evaluate the alternative basing on the quality and business concerns of the shop managers.
In the study, each subject played the role of outlet manager. Table 3 presents the features of the four alternative COTS products from which the managers (subjects) were to select a

International Journal of Computing and ICT Research, Vol. 2 No. 1, June 2008
39
COTS Product Evaluation
Criteria Product A Product B Product C Product D
Reliability 1. System is hosted by third party
2. Credit Card transactions are processed by a third party
3. Is used in some web shops
1. System is hosted by third party
2. Credit Card transactions are processed by a another third party
3. Is used in some web shops
1. No Third Party service provider
2. It has used in many web shops
1. No Third Party service provider
2. It is widely used 3. Backs up data
Maintainability Updates must be compatible with the hosting system
Updates must be compatible with the hosting system
Can be updated through online services
Can be updated through online services
Security 1. The system is hosted by a third party
2. Credit card transaction are processed by the hosting organization
1. The system is hosted by a third party
2. Credit card transaction are processed by a well known card processing organization
1. Runs on owners computer 2. Restrict access but does not
track access 3. Utilizes a card processing
software that is not well known internationally
1. Runs on owners computer 2. Restricts and tracks access 3. Utilizes ICverfy credit card
processing software
Portability Runs on windows systems only Runs on windows, Linux and BSD
Runs on windows, Linux and BSD
Runs on windows systems only
Compatibility Windows 2000 and above 1. Windows NT and above 2. Red Hat Linux 7.0 and above 3. Free BSD4.2 and above
1. Windows NT and above 2. Red Hat Linux 7.0 and above 3. Free BSD4.2 and above
Windows 2000 and above
Vendor Viability 1. Has been in business for 2 years
2. Is not nationally known 3. Is small size organization
1. Has been in business for 5 years
2. Is not nationally known 3. Is small size organization
1. Has been in business for 8 years
2. Is nationally known 3. Is medium size organization
1. has been in business for 15 years
2. Is internationally known 3. Is medium size organization
Initial product price $149 $549 $995 $1499 Initial Hardware Price
$1500 $1500 $2500 $3000
Implementation Costs
$500 $2100 $1000 $2500
Training Costs $138 $300 $600 $600 License Conditions 1. 3 months Money back
guarantee 2. No license fees
No license fees 1. 5years guarantee 2. No license fees
1. 2years guarantee 2. No license fees
Table 3: Features of the Alternative COTS Products and the Grand Set of the Evaluation Criteria product to solve the above problem. Moreover, the table presents the grand set of the criteria for evaluating the COTS products. The subjects were required to formulate their preference models by selecting the criteria they are interested in, from the grand set.
5. THE STUDY PROCESS The subjects under went a forty five minutes training session on how to use the three COTS selection methods. They were also given a questionnaire that they were required to fill at the end of the COTS selection process. Thereafter, the subjects were divided into three homogeneous groups, each with five members (stakeholders). The groups were named after the COTS selection method they were required to employ as follows: CEP-group which employed the CEP method, CRE-group which employed the CRE method, and FCS-group which was required to employ the framework for COTS selection. After receiving all the COTS selection submissions, a follow up meeting was held to discuss the general view of the subjects on COTS selection methods.
The questionnaire that was given to the subjects had the following three components: Component 1, which collected information concerning each COTS selection group. Component 2, which had statements that the subjects ranked on a scale of 0 to 10 depending to
their view of the issues addressed by the statements. Component 3, which collected the general comments of the subjects and the project manager.
The following section presents the analyzed results of each component of the questionnaire.
6. RESULTS This section presents analyzed results of the empirical study on COTS selection methods.
6.1 Results of the First Component of the Questionnaire
Table 4 presents the following information about the three groups, which participated in the COTS selection experiment:
• COTS selection method that was used by group • The product that was selected • The average net (working) time the group took to select a product. This is the average of the time
the group members spent on the project. For the FCS-group, the average time includes the extra 15 minutes, which the group required to comprehend the use of the decision support tool that the group used in the COTS selection process

International Journal of Computing and ICT Research, Vol. 2 No. 1, June 2008
40
• The gross time the group took to select a product. That is, the time between when the COTS selection processes started (when the training ended) and the end of the selection process (when results were submitted)
Group Method Average Time spent
on the Process (Net Time)
Period Within Which the COTS was Selected
(Gross Time)
Product Selected
CEP-Group CEP 4.0 hours 32 days D CRE-Group CRE 6.0 hours 19 days C FCS-Group FCS 1.0 hours 1 day C
Table 4: Time Taken by Each Group to Select the COTS Product
6.2 Results of the Second Component of the Questionnaire
The differences among the COTS selection methods, as well as the users’ satisfaction were measured using the statements in Table 5. The questionnaire was designed such that each subject was given statements, which he/she had to award scores between zero and ten. A score of zero meant that the subject does not agree with the statement at all, and a score of ten meant that the subject completely agrees with the statement. Results of this component of the questionnaire were analyzed using two techniques, namely data mining (Berkhin, 2005) and descriptive statistics (Hill, 2005). Descriptive statistics is the most basic and the most applied form of statistics (Hill, 2005). In the experiment reported in this paper, the statistics was applied to determine the means and the standard deviations of the responses of the subjects to the statements in Table 5. The results of the statistical analysis are also presented in the same table. Data Mining was employed to cluster the responses of the experiment subjects into groups of similar responses. The primary aim for doing this was to extract patterns in the responses and derive rules associated with the issues addressed by the statements in Table 5. The K-means algorithm (Berkhin, 2005) was used for the clustering process because of the following:
• It is simple to apply • It is the most well documented and used clustering algorithm (Berkhin, 2005)
Since the experiment involved three groups, we clustered the responses of the subjects into three groups.
6.3 Results of the Third Component of the Questionnaire
Table 6 presents the comments that were made by the subjects and the project manager, as well as the COTS selection method to which the comment is associated. In the table, the source of the comment is the group in which the subject was a stakeholder, the role that the person who made the comment played in the experiment, or the forum in which the comment was made.
7. DISCUSSION OF RESULTS
The results are discussed based on the fact that statements 1-5 of the questionnaire (see, Table 5) address the COTS selection process and the stakeholder (subject) confidence in the product that was selected. Statements 6-9 deal with issues related to the groups the individual stakeholders who participated in the COTS selection process. Lastly, statements 10-14 relate to the COTS selection methods that were involved in the experiment.

International Journal of Computing and ICT Research, Vol. 2 No. 1, June 2008
41
Results COTS Selection
Method No. Statement
CEP CRE FCS Mean 5.0 4.0 9.0 1. Your concerns were addressed during the COTS selection
process. Standard Deviation
1.9 1.0 0.9
Mean 5.0 3.0 9.0 2. All stakeholders participated significantly in the COTS selection process. Standard
Deviation 1.4 1.5 0.7
Mean 6.0 4.0 10.0 3. The product that was selected is the ‘best-fit’ for all the stakeholders. Standard
Deviation 2.9 1.9 0.7
Mean 7.0 5.0 10.0 4. Given what you now know about the alternative COTS products; if given another chance, you would selected the product your group selected.
Standard Deviation
2.2 0.9 0.0
Mean 7.0 5.0 10.0 5. You are confident about the product your group selected.
Standard Deviation
1.8 1.0 0.0
Mean 3.0 4.0 10.0 6. Your group members were comparative.
Standard Deviation
1.5 0.7 0.7
Mean 4.0 4.0 4.0 7. You found it important to know the preferences of others over the evaluation criteria. Standard
Deviation 1.1 0.5 0.5
Mean 9.0 7.0 7.0 8. You found it important to know why others preferred a different COTS product from the one you preferred. Standard
Deviation 1.1 0.7 0.9
Mean 6.0 4.0 9.0 9. Your group produced documentation that can be used for postmortem analysis. Standard
Deviation 2.9 0.5 0.9
Mean 7.0 7.0 7.0 10. It was easy to understand the COTS selection method your group used Standard
Deviation 1.9 0.7 0.5
Mean 7.0 4.0 10.0 11. It was easy to apply the COTS selection method your group used. Standard
Deviation 2.7 1.0 0.0
Mean 6.0 4.0 10.0 12. The decision support system associated with the method was helpful. Standard
Deviation 2.7 1.6 0.0
Mean 4.8 2.0 10.0 13. If given another COTS selection problem you would use the method your group used. Standard
Deviation 2.9 2.0 0.5
Mean 7.0 3.0 10.0 14. It is important to use a formal method to select COTS products. Standard
Deviation 2.6 1.7 0.7
Table 5: Questionnaire Results The responses of the subjects of the experiment and the results of the clustering process are shown in Figure 1.
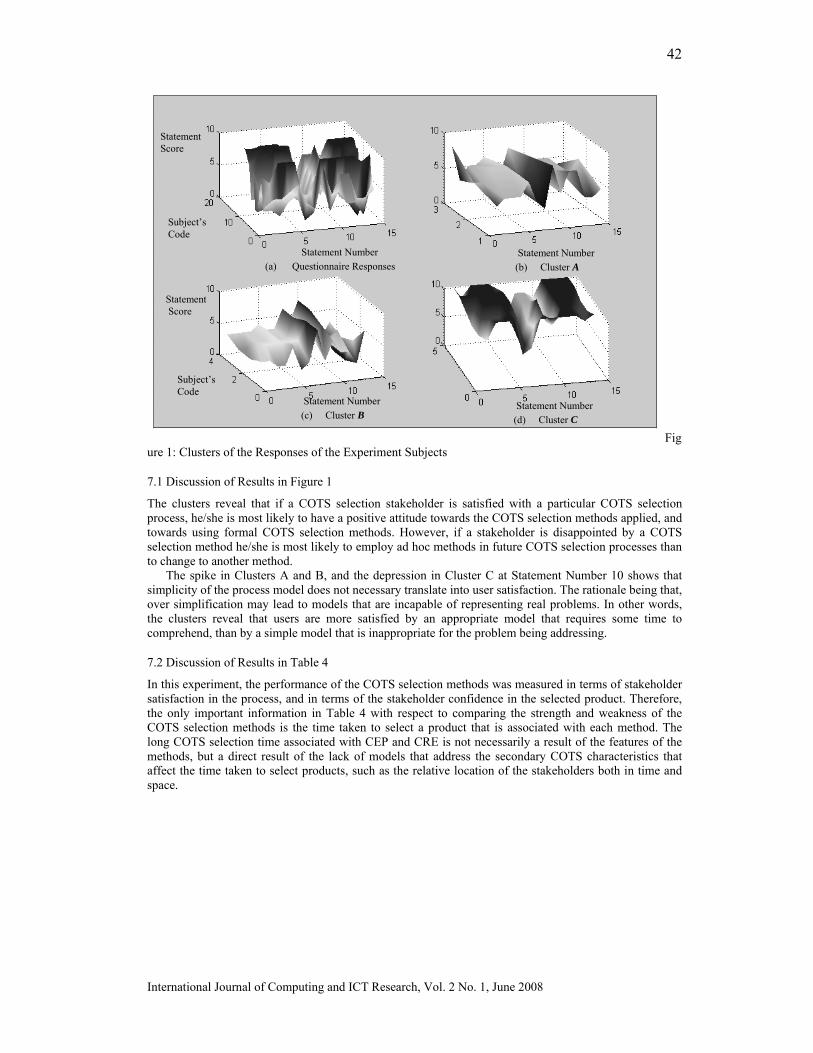
International Journal of Computing and ICT Research, Vol. 2 No. 1, June 2008
42
Subject’s Code
Statement Score
Statement Number
(a) Questionnaire Responses Statement Number
(b) Cluster A
Statement Number
(c) Cluster B Statement Number
(d) Cluster C
Statement Score
Subject’s Code
Figure 1: Clusters of the Responses of the Experiment Subjects
7.1 Discussion of Results in Figure 1
The clusters reveal that if a COTS selection stakeholder is satisfied with a particular COTS selection process, he/she is most likely to have a positive attitude towards the COTS selection methods applied, and towards using formal COTS selection methods. However, if a stakeholder is disappointed by a COTS selection method he/she is most likely to employ ad hoc methods in future COTS selection processes than to change to another method. The spike in Clusters A and B, and the depression in Cluster C at Statement Number 10 shows that simplicity of the process model does not necessary translate into user satisfaction. The rationale being that, over simplification may lead to models that are incapable of representing real problems. In other words, the clusters reveal that users are more satisfied by an appropriate model that requires some time to comprehend, than by a simple model that is inappropriate for the problem being addressing.
7.2 Discussion of Results in Table 4
In this experiment, the performance of the COTS selection methods was measured in terms of stakeholder satisfaction in the process, and in terms of the stakeholder confidence in the selected product. Therefore, the only important information in Table 4 with respect to comparing the strength and weakness of the COTS selection methods is the time taken to select a product that is associated with each method. The long COTS selection time associated with CEP and CRE is not necessarily a result of the features of the methods, but a direct result of the lack of models that address the secondary COTS characteristics that affect the time taken to select products, such as the relative location of the stakeholders both in time and space.
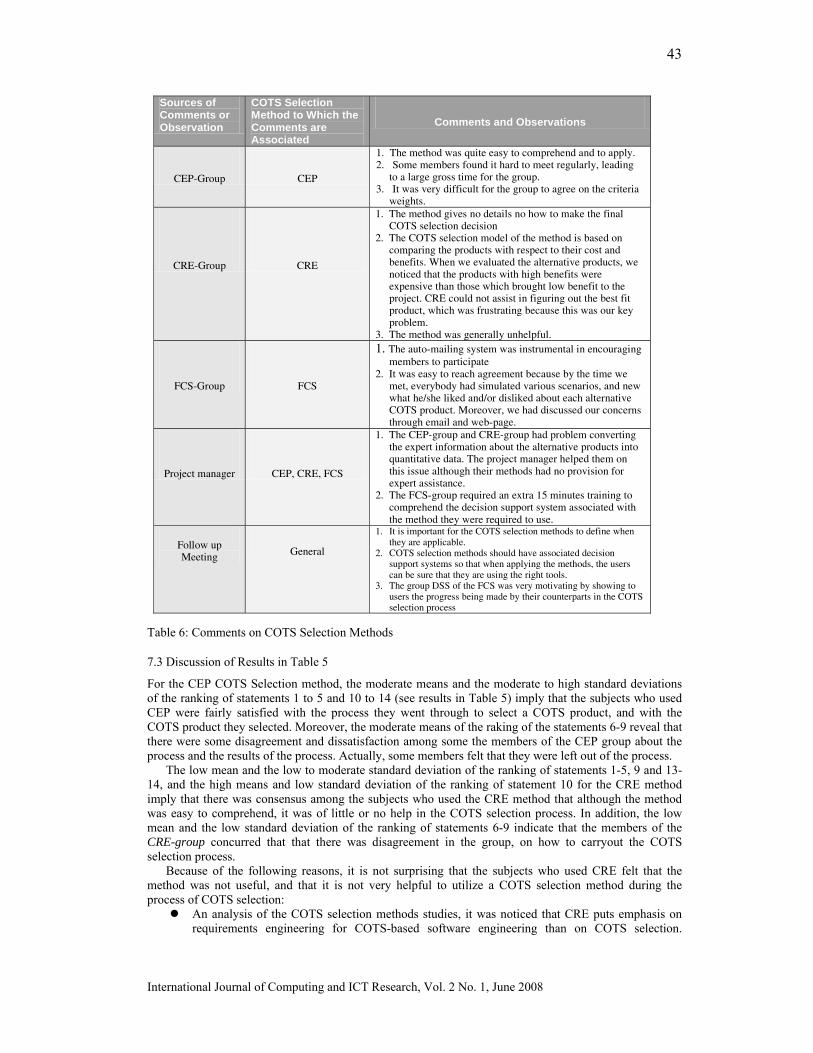
International Journal of Computing and ICT Research, Vol. 2 No. 1, June 2008
43
Sources of Comments or Observation
COTS Selection Method to Which the Comments are Associated
Comments and Observations
CEP-Group CEP
1. The method was quite easy to comprehend and to apply. 2. Some members found it hard to meet regularly, leading
to a large gross time for the group. 3. It was very difficult for the group to agree on the criteria
weights.
CRE-Group CRE
1. The method gives no details no how to make the final COTS selection decision
2. The COTS selection model of the method is based on comparing the products with respect to their cost and benefits. When we evaluated the alternative products, we noticed that the products with high benefits were expensive than those which brought low benefit to the project. CRE could not assist in figuring out the best fit product, which was frustrating because this was our key problem.
3. The method was generally unhelpful.
FCS-Group FCS
1. The auto-mailing system was instrumental in encouraging members to participate
2. It was easy to reach agreement because by the time we met, everybody had simulated various scenarios, and new what he/she liked and/or disliked about each alternative COTS product. Moreover, we had discussed our concerns through email and web-page.
Project manager CEP, CRE, FCS
1. The CEP-group and CRE-group had problem converting the expert information about the alternative products into quantitative data. The project manager helped them on this issue although their methods had no provision for expert assistance.
2. The FCS-group required an extra 15 minutes training to comprehend the decision support system associated with the method they were required to use.
Follow up Meeting General
1. It is important for the COTS selection methods to define when they are applicable.
2. COTS selection methods should have associated decision support systems so that when applying the methods, the users can be sure that they are using the right tools.
3. The group DSS of the FCS was very motivating by showing to users the progress being made by their counterparts in the COTS selection process
Table 6: Comments on COTS Selection Methods
7.3 Discussion of Results in Table 5
For the CEP COTS Selection method, the moderate means and the moderate to high standard deviations of the ranking of statements 1 to 5 and 10 to 14 (see results in Table 5) imply that the subjects who used CEP were fairly satisfied with the process they went through to select a COTS product, and with the COTS product they selected. Moreover, the moderate means of the raking of the statements 6-9 reveal that there were some disagreement and dissatisfaction among some the members of the CEP group about the process and the results of the process. Actually, some members felt that they were left out of the process. The low mean and the low to moderate standard deviation of the ranking of statements 1-5, 9 and 13-14, and the high means and low standard deviation of the ranking of statement 10 for the CRE method imply that there was consensus among the subjects who used the CRE method that although the method was easy to comprehend, it was of little or no help in the COTS selection process. In addition, the low mean and the low standard deviation of the ranking of statements 6-9 indicate that the members of the CRE-group concurred that that there was disagreement in the group, on how to carryout the COTS selection process. Because of the following reasons, it is not surprising that the subjects who used CRE felt that the method was not useful, and that it is not very helpful to utilize a COTS selection method during the process of COTS selection:
An analysis of the COTS selection methods studies, it was noticed that CRE puts emphasis on requirements engineering for COTS-based software engineering than on COTS selection.

International Journal of Computing and ICT Research, Vol. 2 No. 1, June 2008
44
Therefore, it is unfortunate that the method is presented in literature as a COTS selection method, instead of a requirements engineering method.
The method does not give guidance on how to handle stakeholder conflicts, yet this was one of the major problems that the CRE-group faced.
The method recommends balancing between cost and benefits of products as a basis for the final selection decision. However, the method does not have a model for determining the balance. Moreover, it does not address the issue of having multiple benefits that correspond to multiple COTS selection objectives.
The low mean and high standard deviation of the raking of statement 14 for the CRE method indicate that the group members generally have a low opinion about the importance of COTS selection methods in general, and that there is a high degree of disagreement among the members over the issue. The high means and low standard deviations of the ranking of statements 1 to 5 and 12 to 14 for Framework for COTS Selection or the FCS-group imply that the subjects who used the framework for COTS selection were more satisfied with the process they went through to select a COTS product for the problem, and with their selection than those who used the other methods. This is mainly because of the numerous COTS selection support capabilities possessed be the CSDSS associated with this method. The moderate mean and low standard deviation of the ranking of statement 10, the high mean and low standard deviation of the ranking of statement 11, and comment 2 of the project manager imply that although the FCS method required a little more effort to comprehend than the other methods, it was a lot easier to apply.
7.4 Discussion of Results in Table 6
The comments and observation from the CEP-group reveal that the method decomposes the COTS selection problem clearly and adequately. However, it does not address the secondary COTS selection issues such as information sharing and negotiation support. On the other hand, comments and observation from the FCS-group indicate that providing the COTS selection team with a DSS that facilitates asynchronous problem analysis and processing, hastens problem comprehension and assimilation of information about the solutions, which leads to reaching consensus quickly and objectively. This implies that it is necessary to breakdown the COTS selection problem into multiple smaller problems for easier comprehension and processing. However, without addressing the secondary issues, breaking down the problem is not sufficient to ensure selecting COTS products that satisfy all stakeholders as much as possible.
7.5 Overall Discussion of Results
The experiment results generally illustrate that it is necessary to specify when a COTS selection method works so that prospective users are enlightened upfront on possibility of the method to work in the prevailing project and COTS selection conditions. For example, CRE is a fairly good method for requirements elicitation and negotiation. However, it has limited capability for the purpose of COTS selection. Therefore, it would have been better if the method had been presented as a requirements elicitation method but not a COTS selection method. Users prefer COTS selection methods which are easy to comprehend and to apply, and which guide them through the COTS selection process. That is, the users become easily disappointed if they get into a dilemma and the method cannot guide them out of it. Moreover, if that happens, they prefer to use ad hoc methods to continue with the COTS selection process, than to employ another formal COTS selection method. Although simplicity of COTS selection methods is desirable, it should not be achieved at the cost of highly degraded capability. For example, the DSS associated with the FCS necessitated extra training for the FCS-group. Nevertheless, the group reached agreement much faster than the others. It is important that a COTS selection method has an associated DSS, so that the users can know upfront the kind of information they need to collect and the results that are expected at the different stages of the COTS selection process. Moreover, the technology of the CSDSS can be used to improve on, or increase the simplicity of the model of a COTS selection method. For example, the DSS associated with the FCS is based on agent technology. This makes it simple to comprehend and to apply, because agent technology has inherent capability to hide complexity. For example, instead of manually moving around information from one application to another, the agents move the information automatically from its source to wherever it is needed.
8. LIMITATIONS OF THE EMPIRICAL STUDY
The case study reported in this paper had the following threats and limitations that could have influenced the results:

International Journal of Computing and ICT Research, Vol. 2 No. 1, June 2008
45
• All subjects were students who participated in the study knowing that they were under no obligation to select the ‘right’ COTS product, meet deadlines, or complete the selection process.
• The selection process did not involve all the possible criteria that could be used to evaluate the COTS products. This denied the subjects the opportunity of applying only those criteria that were important to them. Moreover, it may have made the negotiation process to be very easy.
• It was assumed that the system requirements were complete. Yet in practice, COTS products are selected while the system requirements are still subject to change. This makes the actual COTS selection process to be much more complicated than the selection processes that were carried out in the study.
• Subjects were required to select a COTS product from a predefined set of products which may have made their work easier compared to the actual COTS selection process. Moreover, this denied them an opportunity to search and evaluate products of their own choice.
• We had no access to similar studies with which we could compare and contrast results. This makes the results of the study to be more of a reflection of the capability differences between the COTS selection method that were studied, than a measure of the absolute capabilities of the methods.
On the other hand, we mitigated the effects of the above limitations by ensuring that all the three COTS selection groups carried out the COTS selection process under similar conditions with respect to limitation 1-4. The fifth limitation of the study was mitigated by comparing our method to some of the best COTS selection methods in the reviewed literature (see Wanyama and Far (Wanyama et al., 2005)2). Furthermore, we believe that more reliable results could have been obtained if this case study had been carried out in industry over time and under less controlled conditions.
9. CONCLUSIONS AND FUTURE WORK
This paper presented a case study that compares the performance of three COTS selection methods, namely: The Comparative Evaluation Process (CEP), COTS-based Requirements Engineering (CRE), and the Framework for COTS Selection (FCS). In the experiment, the performance of the methods was not measured in terms of the COTS products that were selected; instead, it was measured in terms of user satisfaction and confidence in the results, because COTS selection is a highly subjective process such that what really matters at the end of the process is the satisfaction of the stakeholders. The paper concluded by discussing the results of the experiment, and by inferring the meaning of the results with respect to the capabilities of the COTS selection methods that were used in the empirical study. In the future, we would like to deploy the three COTS selection methods in industry, and evaluate them through an empirical study. We believe that this shall produce more dependable results.
10. REFERENCES
ALVES, C. and J. CASTRO, “CRE: A Systematic Method for Components Selection”, available at URL: http://www.cs.ucl.ac.uk accessed in April 2003. ALVES C. and A. FINKELSTEIN, ”Investigating Conflicts in COTS Decision-making”, International Journal of Software Engineering and Knowledge Engineering, Vol 13, No. 5, pp 473-495, 2003. ALVES, C. "COTS-Based Requirements Engineering" Chapter of the Book Component-Based
Software Quality – Methods and Techniques. Lecture Notes in Computer Science. Springer, 2003 BERKHIN, P. “Survey of Clustering Data Mining Techniques”, Report: Accrue Software Inc., Jan.
2005, Available at URL: http://www.ee.ucr.edu accessed in May 2005 BIANCHI,, A., D. CAIVANO, R. CONRADI and L. JACCHERI. COTS Products Characterization Proposal and Empirical Study, ESERNET Method Book, Chapter 13, Nov. 2002 BURGUES, X., C. ESTAY, X. FRANCH, J. A. PASTOR, and C. QUER, “Combined Selection of
COTS Components, Procurement of COTS Software Components”, Proceedings of ICCBSS, pp.54-64, Feb. 2002
CAVANAUGH, B. P., and S. M. POLEN, “Add Decision Analysis to Your COTS Selection Process”, The Journal of Defense Software Engineering, April 2002
CHUNG, L. and K. COOPER,” A knowledge-based COTS-aware requirements engineering approach”, SEKE 2002, pp. 175-182, 2002
COMELLA-DORDA, S., J. C. DEAN, and E. Morris, P. Oberndorf, “A Process for COTS Software Product Evaluation”, Proceedings of ICCBSS, pp.86- 96, Feb. 2002

International Journal of Computing and ICT Research, Vol. 2 No. 1, June 2008
46
GREGOR,S., J. HUTSON, and C. ORESKY, “Storyboard Process to Assist in Requirements Verification and Adaptation to Capabilities Inherent in COTS”, Proceedings of ICCBSS, pp.132- 141, Feb. 2002
HANSEN, W. J. A., “Generic Process and Terminology”, available at URL: http://www.sei.cmu.edu accessed in May 2003. HILL, J., ‘Introduction to Descriptive Statistics”, Jan. 2005, URL: http://www.mste,UIUC.edu KONTIO, J., S. F. CHEN, and K. LIMPEROS, “A COTS Selection Method and Experiences of its
Use”, Twentieth Annual Software Engineering Workshop, NASA Goddard Space Flight Center, Greenbelt, Maryland, Nov. 1995
KUNDA, D. and L. BROOKS, “Applying Socio-Technical Approach for COTS Selection”, Proceedings of 4th UKAIS Conference, University of York, McGraw Hill, April 1999
LI, J., F. O. BJORNSON, R. CONRADI. An Empirical Study of the Variations in the COTS-based Software Development Processes in the Norwegian IT Industry. In the proceedings of the 10th IEEE International Symposium on Software Metrics, pages 72-83, Chicago USA, September 2004
LI, J., R. CONRADI, C. BUNSE, M. TORCHIANO. An Empirical Study on Decision making in Off- The-Shelf Component-Based Development. In the proceedings of ICSE, Shanghai China, May 2006
MUSTAJOKI,J. and R. P. HAMALAINEN, “Web-HIPRE – Global Decision Support by ValueTree and AHP”, available at URL: http://www.hipre.hut.fi accessed in July 2005
NCUBE, C. and N. A. M. MAIDEN, “PORE: Procurement-Oriented Requirements Engineering Method for the Component-Based Systems Engineering Development Paradigm”, available at URL: http://www.soi.city.ac.uk, accessed in May 2003
OCHS, M. and G. CHROBOK-DIENING, “A COTS Acquisition Process: Definition and Application Experience”, ISERN Report, 2000 RUHE, G. “Intelligent Support for Selection of COTS Products”, Proceedings of the Net.ObjectDays 2002, Erfurt, pp 34-45, Springer 2003 WANYAMA, T. and B. FAR, “A Multi-Agent Framework for Conflict Analysis and Negotiation: Case of
COTS selection”, Transactions of the Institute of Electronics, Information and Communication Engineers: Special Issue on Software Agent and its Applications – Vol. E88-D, No.9, September, 2005, 2047-2058
WANYAMA, T. and B. FAR, “Towards Providing Decision Support for COTS Selection”, The proceedings of the Canadian Conference on Electrical and Computer Engineering, CCECE 2005, May 1-4, 2005, Saskatoon Saskatchewan, Canada
WITTEN, I. H. and E. FRANK, “Data Mining: Practical Machine Learning Tools and Technologies’, 2nd Edition, Elsevier, June 2005.

International Journal of Computing and ICT Research, Vol. 2 No. 1, June 2008
47
CHALLENGES OF ADAPTIVE ELEARNING AT HIGHER LEARNING INSTITUTIONS: A CASE STUDY IN TANZANIA Vitalis Ndume* Dar es Salaam Institute of Technology, F.N.Tilya and H.Twaakyondo University of Dar es Salaam ___________________________________________________________________
This paper reports on the research conducted with the purpose of establishing the acceptance of eLearning, analyses the challenges of eLearning and designs an assistive tool for people with disability at higher learning institutions in Tanzania. The information was gathered through documentary review. Primary data was collected from a sample survey by means of structured questionnaires and interviews. Study population was carried out at higher learning institutions conducting eLearning. The research identified several factors that challenge the implementation of adaptive eLearning at higher learning institutions. These include management support, methodology, technology, resource accessibility and availability, culture of education and learning styles, design of assistive tools, intellectual investment, and global business. It was concluded that eLearning is more highly accepted in higher learning institutions than in basic education. However, there are doubts about the certificates obtained from online courses. The factors that challenge implementation of eLearning are very interrelated in bringing the success or failure of eLearning projects. However, accessibility of resources of eLearning was found to affect disabled people more than normal person. General Terms: eLearning, Adaptive Learning, Adaptive computing, eLectronic for Visual impairments, Learning Management System. IJCIR Reference Format: Vitalis Ndume, F.N.Tilya and H.Twaakyondo. Challenges of Adaptive eLearning at Higher Learning Institutions: A Case Study in Tanzania. International Journal of Computing and ICT Research, Vol. 2, No. 1, pp. 47 - 59. http:www.ijcir.org/volume2-number1/article6.pdf. 1. INTRODUCTION The recent increase of up to 83.5% of primary school enrollment in Tanzanian education is a signal to call for innovative thinking for enlarging the means of education at secondary schools and then at tertiary levels (BEST, 2006). The government of Tanzania has attempted to solve this problem mostly by traditional means without much success. The government is challenged with a limited number of teachers, teaching materials, and accommodation for both teachers and students, and tools that assist disabilities in primary and secondary schools. Other challenges are defined in the Secondary Master Plan (SEMP, 2005) as access beneficiaries of public spending on education, gender access, family financial constrains, equity, boarding system and social cost for pupils being away from home. Therefore one possible way of solving this problem is to adapt eLearning in education system.
2. THEORETICAL BACKGROUND
* Author’s Address: Vitalis Ndume. Dar Es Salaam Institute of Technology, Box 2274, Dar es Salaam. [email protected], F.N.Tilya and H.Twaakyondo, University of Dar es Salaam, Box 35194 Dar es Salaam . "Permission to make digital or hard copies of part or all of this work for personal or classroom use is granted without fee provided that copies are not made or distributed for profit or commercial advantage and that copies bear this notice and the full citation on the first page. Copyrights for components of this work owned by others than IJCIR must be honored. Abstracting with credit is permitted. To copy otherwise, to republish, to post on servers or to redistribute to lists, requires prior specific permission and/or a fee." @International Journal of Computing and ICT Research 2008. International Journal of Computing and ICT Research, ISSN 1818-1139 (Print), ISSN 1996-1065 (Online), No.1, pp. 47 – 59, June 2008.

International Journal of Computing and ICT Research, Vol. 2 No. 1, June 2008
48
2.1 Concept of Adaptive Computing and Adaptive eLearning
There are many definitions of adaptations in eLearning system (Henze & Nejdl 2004). Usually the definition is focused on the student, although it sometimes involves tutors. Adaptive eLearning can be defined as a method to create a learning experience for students, but also for teachers, based on the configuration of a set of elements in a specific period aiming to increase performance of predefined criteria (Burgos, 2006). These criteria could be education, economic, time based, user satisfaction base, or others involved in e-Learning. The elements to adopt could be based on content; time orders assessments and interface.
The application of adaptive eLearning to education is mainly structured mainly into four issues. First, what part of the components of the learning process is adapted (pace of instructions, sequence of contents that can be modified). Second, what information does the system use for adaptation (user knowledge, preference, cognitive capabilities and learning goals). Third, how does the system gather the information to adapt to (didactics rules & layout standards). And last, what does the system adapt (pedagogical model), (Burgos, 2006; Burgos & Colin, 2005).
The traditional problems involved in authoring adaptive eLearning contents have been nearly resolved by the new generation of powerful authoring tools most of them being proprietary instead of Open Source Software (Brusilvsky, 2004). But not all modern authoring kits address the need of universities, teachers and administration. It is important to realize that the design of adaptive eLearning is not “One size fits all paradigms”. The resource developed in one environment will not fit all other environments in terms of hardware utilization, social perspective and outcomes based. The design of any adaptive eLearning tool should take into account both social aspects, and technology existing at learner’s site (Alessi, & Trolip, 2001).
In many eLearning projects including students face some challenges of bad perception during their studies; lack of pedagogy in their curriculum, lack of resources, lack of user touch and feel in their eLearning platform (Allen, 2003; Ostlund, 2005). Also most eLearners can’t manage to study at home as they are responsible for domestic activities like caring for their children and solving some household chores (Ostlund, 2005). Further, some instructors are not knowledgeable enough in coaching or use of multimedia tools hence making learners bored during the lessons; they lack Tele-Coaching skill (Pal, 2006). It is again to these challenges that adaptive computing becomes a challenge in designing a tool that motivates learning process.
2.2 Perception on eLearning
To successfully create eLearning program, we need to ensure that value really is there and it is in concrete terms. That means we need to sell learners on the truthful proposition that participation will provide benefits worth the time and effort. The curriculum needs to be the point of reference for creating an effective e-Learning. Doing so will stimulate vital motivation and give the program a chance to succeed (Allen, 2003).
Bad eLearning perception may be due to lack of understanding, lack of communication, and lack of trust or conflicting agendas in appropriate use technology. Some goal coaching and awareness exercises are probably needed to strengthen people’s perception (Allen, 2003; Ajzen, 1988; Bebee, 2004). It is important to realize that learners are both emotional and intellectual; and emotions have much effect on people’s perception and what they do.
In some eLearning studies conducted in developing countries, it was found that lack of vision and framework in implementing eLearning lead to a failure of these eLearning projects (Kizito and Bijan, 2006; Pal, 2006). Lack of both technical and social skills required for implementation contributes to the failure of some projects. If learners cannot use adaptive tools they might feel ashamed and this affects perception. When learners feel ashamed and guilt it is because they are sent in environment in which they are not entirely pleased. The feeling will influence their study situation, as well as the whole learning process and this results in negative feedback, which may reduce concentration and motivation (Ostlund, 2005).
2.3 Contribution of eLearning in African Economy
Education is a root of development in a country. A number of studies have shown that primary
education and vocation training have a significant positive effect on economic growth, earning and productivity (LaRocque, 2003). Even though introducing eLearning in African education system may

International Journal of Computing and ICT Research, Vol. 2 No. 1, June 2008
49
present challenges including financial skills and capacity but it can help developing countries to meet development challenges. 3. METHODOLGY 3.1 Research instruments
Research instruments were designed and categorized into two parts. Part one was designed to measure people’s perception on a phenomenon and identify factors that challenge eLearning. This could be done into two major categories, namely direct assessment or indirect assessment (Likert, 1932). In this part, rating scale questionnaires were designed with five numerical values (1-5) corresponding to a scaling “Strongly Agree, Agree, Undecided, Disagree and Strongly Disagree”.
The scoring key for each item was taken from scale 1 to 5. Positive items were scored from 5-1 while negative items were scored from 1 to 5. Part two of the questionnaires was designed to examine factors affecting eLearning from the disabilities perspective.
3.2 Data analysis
In order to identify principal component factors, which challenge eLearning, new variables were computed by summing up all items in each group. For each group, data reduction by factor analysis was carried out in order to extract principal components. A rotated component matrix was identified using varimax with Kasiser Normalization. Some rotated convergences were found after 8 iterations and others after 5 iterations. In a component, percentage of variance ranged from 45% to 0.9%. In order to identify contribution of each item, correlation analysis was carried out. The correlation factors ranged from 0.87 to 0.45 and it was significant at 0.05. 4. RESULTS, ANALYSIS AND DISCUSSION
4.1.1 People’s Perception of eLearning
People’s perception of eLearning was analysed in different ways, including asking questions, whose answers revealed personal traits as well as a person’s perception of social pressure as to whether to engage in eLearning or not. The analysis focused on personal acceptance of eLearning, acceptance of the certificate obtained through an online program as well as acceptance of eLearning at various education levels. The results showed that the majority accept eLearning (Figure 1.1), 75% accept that eLearning is as good as traditional learning, 10% did not accept while 15% remained undecided.
10%
15%
75%
Not accept
Undecided
Accept
Figure 1.1: Personal perception of eLearning
Respondents were also asked to give their opinion on whether eLearning could be applied to the Tanzanian education system (Figure 1.2); 75% accepted that eLearning could be applied to Tanzanian education, 8% did not accept while 17% remained undecided.

International Journal of Computing and ICT Research, Vol. 2 No. 1, June 2008
50
8%
17%
75%
Not accept
Undecided
Accept
Figure 1.2: Acceptance of eLearning in Tanzania education
4.1.2 Trust, Quality and Certification of eLearning
The quality of eLearning courses builds trust in stakeholders. Quality and trust are crucial, not only for economic benefits, but also in restoring the confidence of learners and their sponsors in the education system as it addresses the issue of value for money. In this research the issue of quality and certification was examined. Respondents were asked to give their opinions on whether a certificate obtained from an eLearning program is as respected as the one obtained from traditional programmes. The results showed (Figure 1.3) that people still have doubts about the certificate of eLearning courses, as only 40% accepted that eLearning certification is valued the same as traditional programme certifications, 37% did not accept while 23 % remained undecided.
37%
23%
40%Not accept
Undecided
Accept
Figure 1.3: Recognition of eLearning certificates.
From the interview, the response showed that the trust, quality and value of the certificate for employment was not a question of how the students obtained the certificates but from which university or college they graduated. It is the responsibility of the institution to ensure the quality, and to build the trust and confidence of the public regarding their certifications.
The source of the problem of untrustworthy certificates from online programs is due to unregistered institutions, which market online degrees for business purposes. The public is worried about having many graduates from such unregistered institutions. In Tanzania there is some control, as the Tanzania Commission for Science (TCU) is always undertaking technical auditing of the universities to examine their staff and their qualifications. Others reasons for untrustworthy of online certificates includes security and quality assurance, dishonest and possibility of cheating on online examinations.
4.1.3 Acceptance of eLearning at Various Levels of Education
The research showed that eLearning is accepted in the Tanzanian education system. However, its acceptance varies widely from basic to tertiary education. Results showed (Figure 1.4) that 86 % recommend eLearning to be applied at degree level while only 9% accept it at nursery school. Results also showed that 20% accept eLearning at primary school, 31% accept it at secondary school and 50% accept it at advanced secondary.
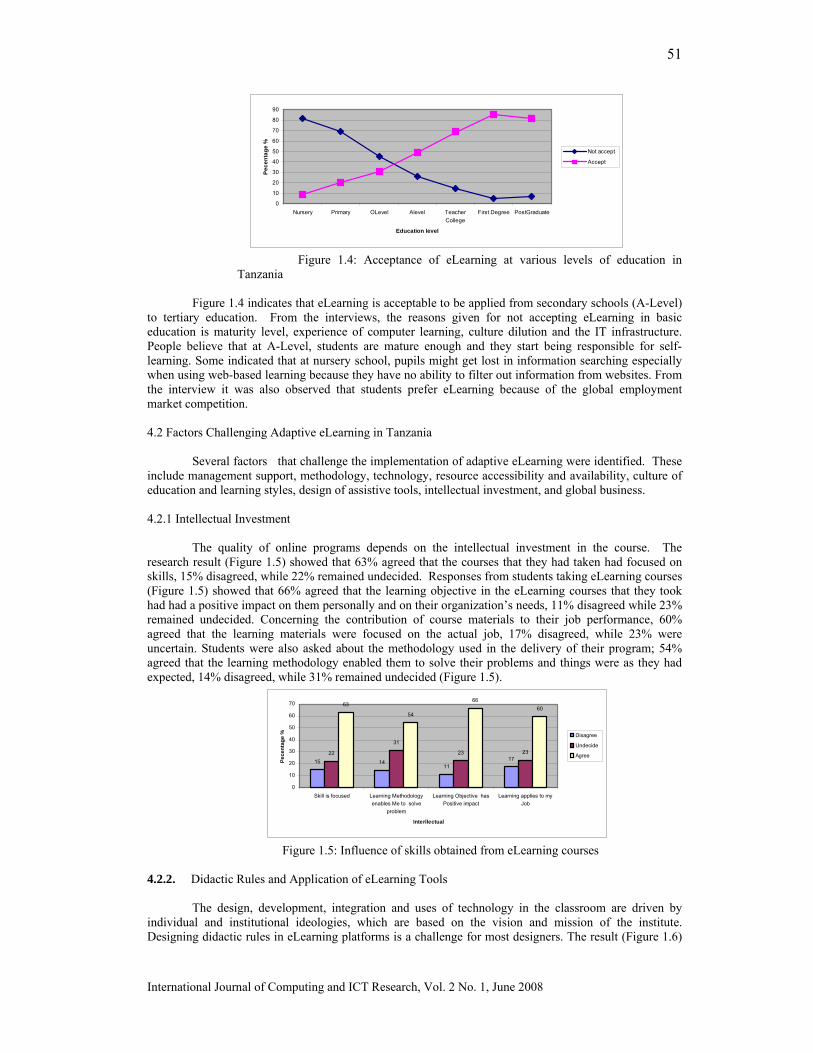
International Journal of Computing and ICT Research, Vol. 2 No. 1, June 2008
51
0
10
20
30
40
50
60
70
80
90
Nursery Primary OLevel Alevel TeacherCollege
First Degree PostGraduate
Education level
Pece
ntag
e %
Not accept
Accept
Figure 1.4: Acceptance of eLearning at various levels of education in
Tanzania Figure 1.4 indicates that eLearning is acceptable to be applied from secondary schools (A-Level)
to tertiary education. From the interviews, the reasons given for not accepting eLearning in basic education is maturity level, experience of computer learning, culture dilution and the IT infrastructure. People believe that at A-Level, students are mature enough and they start being responsible for self-learning. Some indicated that at nursery school, pupils might get lost in information searching especially when using web-based learning because they have no ability to filter out information from websites. From the interview it was also observed that students prefer eLearning because of the global employment market competition.
4.2 Factors Challenging Adaptive eLearning in Tanzania
Several factors that challenge the implementation of adaptive eLearning were identified. These include management support, methodology, technology, resource accessibility and availability, culture of education and learning styles, design of assistive tools, intellectual investment, and global business.
4.2.1 Intellectual Investment
The quality of online programs depends on the intellectual investment in the course. The research result (Figure 1.5) showed that 63% agreed that the courses that they had taken had focused on skills, 15% disagreed, while 22% remained undecided. Responses from students taking eLearning courses (Figure 1.5) showed that 66% agreed that the learning objective in the eLearning courses that they took had had a positive impact on them personally and on their organization’s needs, 11% disagreed while 23% remained undecided. Concerning the contribution of course materials to their job performance, 60% agreed that the learning materials were focused on the actual job, 17% disagreed, while 23% were uncertain. Students were also asked about the methodology used in the delivery of their program; 54% agreed that the learning methodology enabled them to solve their problems and things were as they had expected, 14% disagreed, while 31% remained undecided (Figure 1.5).
15 1411
1722
31
23 23
63
54
6660
0
10
20
30
40
50
60
70
Skill is focused Learning Methodologyenables Me to solve
problem
Learning Objective hasPositive impact
Learning applies to myJob
Interllectual
Pece
ntag
e %
Disagree
Undecide
Agree
Figure 1.5: Influence of skills obtained from eLearning courses
4.2.2. Didactic Rules and Application of eLearning Tools
The design, development, integration and uses of technology in the classroom are driven by individual and institutional ideologies, which are based on the vision and mission of the institute. Designing didactic rules in eLearning platforms is a challenge for most designers. The result (Figure 1.6)
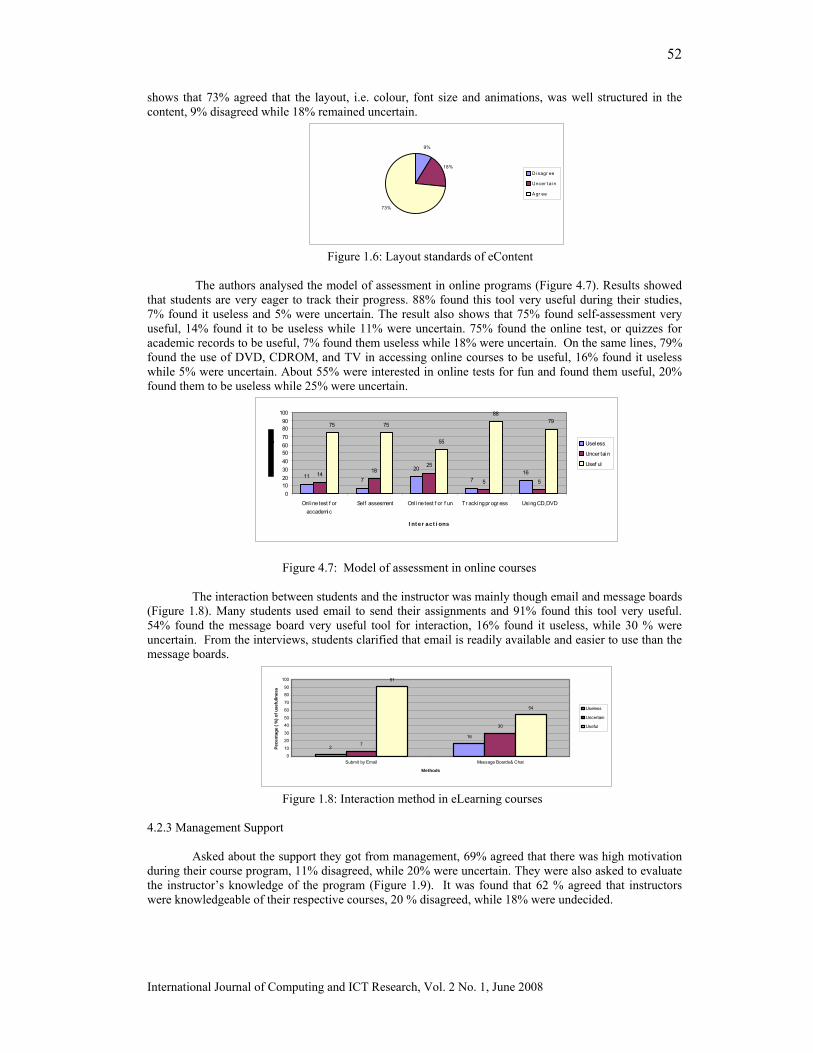
International Journal of Computing and ICT Research, Vol. 2 No. 1, June 2008
52
shows that 73% agreed that the layout, i.e. colour, font size and animations, was well structured in the content, 9% disagreed while 18% remained uncertain.
9%
18%
73%
Di sagr ee
Uncer tai n
Agr ee
Figure 1.6: Layout standards of eContent
The authors analysed the model of assessment in online programs (Figure 4.7). Results showed
that students are very eager to track their progress. 88% found this tool very useful during their studies, 7% found it useless and 5% were uncertain. The result also shows that 75% found self-assessment very useful, 14% found it to be useless while 11% were uncertain. 75% found the online test, or quizzes for academic records to be useful, 7% found them useless while 18% were uncertain. On the same lines, 79% found the use of DVD, CDROM, and TV in accessing online courses to be useful, 16% found it useless while 5% were uncertain. About 55% were interested in online tests for fun and found them useful, 20% found them to be useless while 25% were uncertain.
117
20
71614 18
25
5 5
75 75
55
8879
0102030405060708090
100
Onl ine test f oraccademic
Sel f assesment Onl ine test f or f un Tr acking pr ogr ess Using CD,DVD
I nt er act i ons
Useless
Uncer tain
Usef ul
Figure 4.7: Model of assessment in online courses The interaction between students and the instructor was mainly though email and message boards
(Figure 1.8). Many students used email to send their assignments and 91% found this tool very useful. 54% found the message board very useful tool for interaction, 16% found it useless, while 30 % were uncertain. From the interviews, students clarified that email is readily available and easier to use than the message boards.
2
16
7
30
91
54
0
10
20
30
4050
60
70
8090
100
Submit by Email Message Boards& Chat
Methods
Pece
ntag
e ( %
) of u
sefu
llnes
s
Useless
Uncertain
Useful
Figure 1.8: Interaction method in eLearning courses
4.2.3 Management Support
Asked about the support they got from management, 69% agreed that there was high motivation during their course program, 11% disagreed, while 20% were uncertain. They were also asked to evaluate the instructor’s knowledge of the program (Figure 1.9). It was found that 62 % agreed that instructors were knowledgeable of their respective courses, 20 % disagreed, while 18% were undecided.
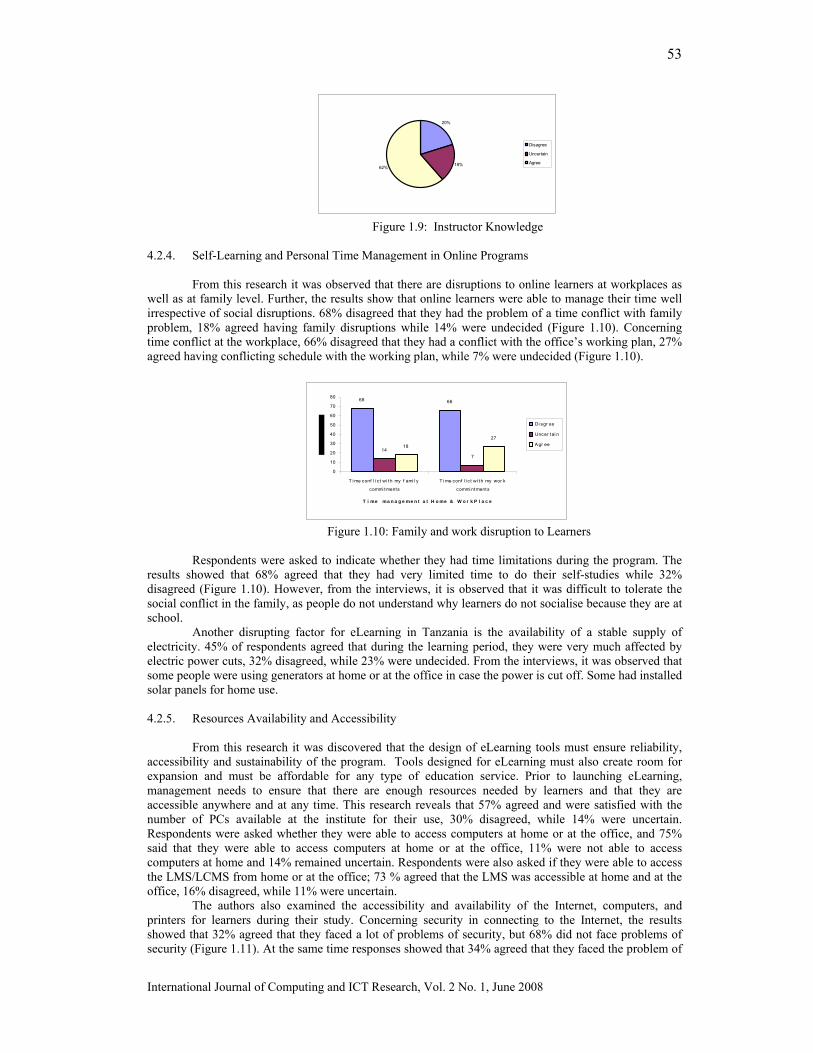
International Journal of Computing and ICT Research, Vol. 2 No. 1, June 2008
53
20%
18%62%
Disagree
Uncertain
Agree
Figure 1.9: Instructor Knowledge
4.2.4. Self-Learning and Personal Time Management in Online Programs
From this research it was observed that there are disruptions to online learners at workplaces as well as at family level. Further, the results show that online learners were able to manage their time well irrespective of social disruptions. 68% disagreed that they had the problem of a time conflict with family problem, 18% agreed having family disruptions while 14% were undecided (Figure 1.10). Concerning time conflict at the workplace, 66% disagreed that they had a conflict with the office’s working plan, 27% agreed having conflicting schedule with the working plan, while 7% were undecided (Figure 1.10).
68 66
147
18
27
0
10
20
30
40
50
60
70
80
T i me conf l i c t wi t h my f ami l y
commi tments
T i me conf l i c t wi t h my wor k
commi ntments
T i me ma n a g e me n t a t H o me & W o r k P l a c e
Di sgr ee
Uncer tai n
Agr ee
Figure 1.10: Family and work disruption to Learners
Respondents were asked to indicate whether they had time limitations during the program. The
results showed that 68% agreed that they had very limited time to do their self-studies while 32% disagreed (Figure 1.10). However, from the interviews, it is observed that it was difficult to tolerate the social conflict in the family, as people do not understand why learners do not socialise because they are at school.
Another disrupting factor for eLearning in Tanzania is the availability of a stable supply of electricity. 45% of respondents agreed that during the learning period, they were very much affected by electric power cuts, 32% disagreed, while 23% were undecided. From the interviews, it was observed that some people were using generators at home or at the office in case the power is cut off. Some had installed solar panels for home use.
4.2.5. Resources Availability and Accessibility
From this research it was discovered that the design of eLearning tools must ensure reliability, accessibility and sustainability of the program. Tools designed for eLearning must also create room for expansion and must be affordable for any type of education service. Prior to launching eLearning, management needs to ensure that there are enough resources needed by learners and that they are accessible anywhere and at any time. This research reveals that 57% agreed and were satisfied with the number of PCs available at the institute for their use, 30% disagreed, while 14% were uncertain. Respondents were asked whether they were able to access computers at home or at the office, and 75% said that they were able to access computers at home or at the office, 11% were not able to access computers at home and 14% remained uncertain. Respondents were also asked if they were able to access the LMS/LCMS from home or at the office; 73 % agreed that the LMS was accessible at home and at the office, 16% disagreed, while 11% were uncertain.
The authors also examined the accessibility and availability of the Internet, computers, and printers for learners during their study. Concerning security in connecting to the Internet, the results showed that 32% agreed that they faced a lot of problems of security, but 68% did not face problems of security (Figure 1.11). At the same time responses showed that 34% agreed that they faced the problem of
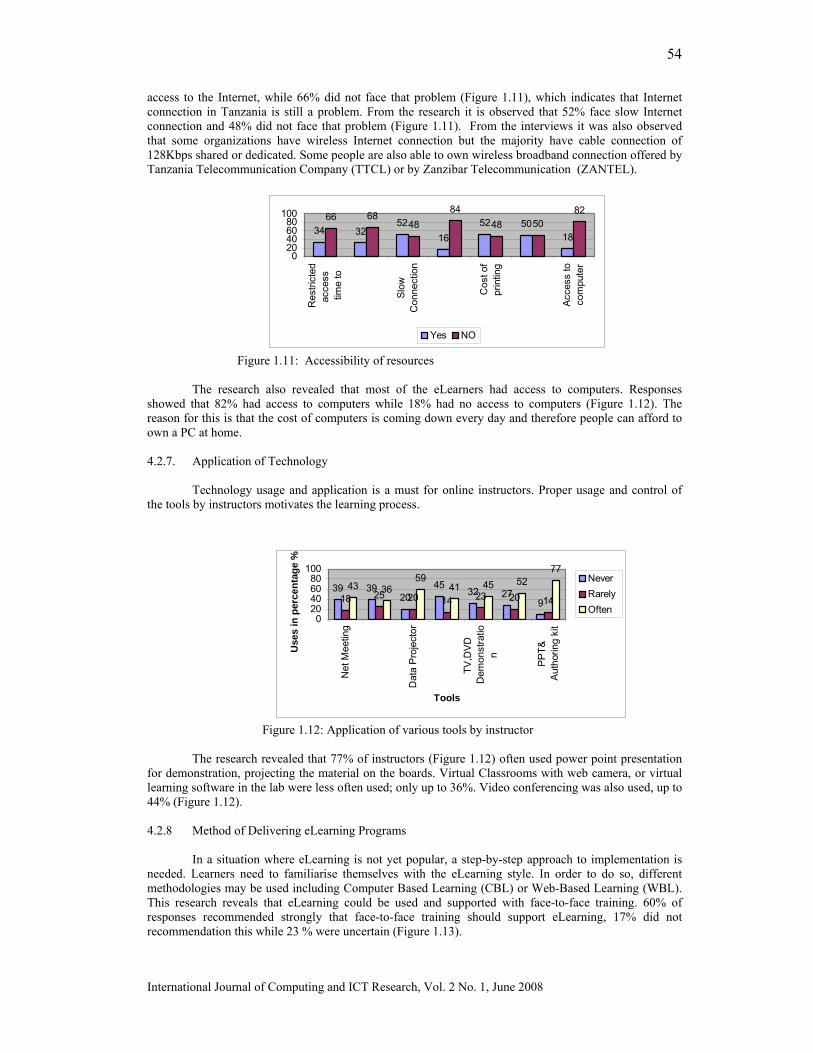
International Journal of Computing and ICT Research, Vol. 2 No. 1, June 2008
54
access to the Internet, while 66% did not face that problem (Figure 1.11), which indicates that Internet connection in Tanzania is still a problem. From the research it is observed that 52% face slow Internet connection and 48% did not face that problem (Figure 1.11). From the interviews it was also observed that some organizations have wireless Internet connection but the majority have cable connection of 128Kbps shared or dedicated. Some people are also able to own wireless broadband connection offered by Tanzania Telecommunication Company (TTCL) or by Zanzibar Telecommunication (ZANTEL).
34 3252
1652 50
18
66 6848
8448 50
82
020406080
100
Res
trict
edac
cess
tim
e to
Slow
Con
nect
ion
Cos
t of
prin
ting
Acc
ess
toco
mpu
ter
Yes NO
Figure 1.11: Accessibility of resources The research also revealed that most of the eLearners had access to computers. Responses
showed that 82% had access to computers while 18% had no access to computers (Figure 1.12). The reason for this is that the cost of computers is coming down every day and therefore people can afford to own a PC at home.
4.2.7. Application of Technology
Technology usage and application is a must for online instructors. Proper usage and control of
the tools by instructors motivates the learning process.
Figure 1.12: Application of various tools by instructor The research revealed that 77% of instructors (Figure 1.12) often used power point presentation
for demonstration, projecting the material on the boards. Virtual Classrooms with web camera, or virtual learning software in the lab were less often used; only up to 36%. Video conferencing was also used, up to 44% (Figure 1.12).
4.2.8 Method of Delivering eLearning Programs
In a situation where eLearning is not yet popular, a step-by-step approach to implementation is needed. Learners need to familiarise themselves with the eLearning style. In order to do so, different methodologies may be used including Computer Based Learning (CBL) or Web-Based Learning (WBL). This research reveals that eLearning could be used and supported with face-to-face training. 60% of responses recommended strongly that face-to-face training should support eLearning, 17% did not recommendation this while 23 % were uncertain (Figure 1.13).
39 3920
4532 27
918 25 20 14 23 20 1443 36
5941 45 52
77
020406080
100
Net
Mee
ting
Dat
a P
roje
ctor
TV,D
VD
Dem
onst
ratio
n
PPT&
Aut
horin
g ki
t
Tools
Use
s in
per
cent
age
%
Never Rarely Often
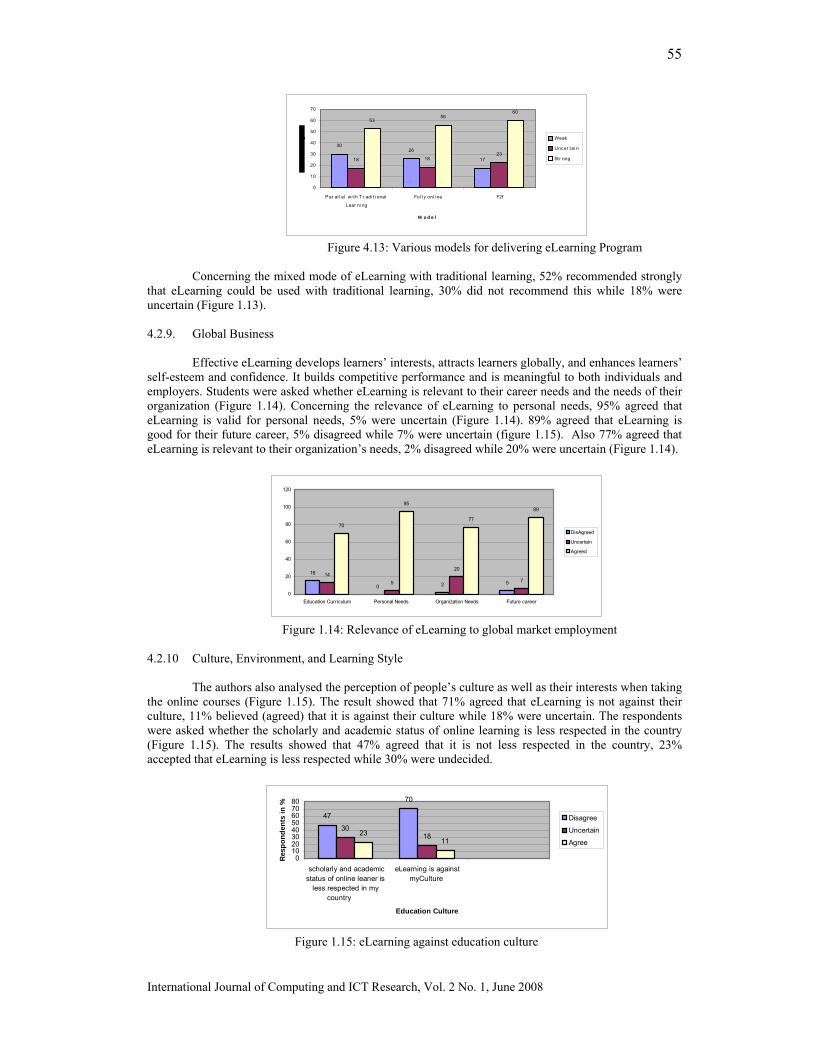
International Journal of Computing and ICT Research, Vol. 2 No. 1, June 2008
55
3026
1718 1823
5356
60
0
10
20
30
40
50
60
70
Par al l el wi t h T r adi t i onal
Lear ni ng
Ful l y onl i ne F2f
M o d e l
Weak
Uncer tai n
St r ong
Figure 4.13: Various models for delivering eLearning Program Concerning the mixed mode of eLearning with traditional learning, 52% recommended strongly
that eLearning could be used with traditional learning, 30% did not recommend this while 18% were uncertain (Figure 1.13).
4.2.9. Global Business
Effective eLearning develops learners’ interests, attracts learners globally, and enhances learners’ self-esteem and confidence. It builds competitive performance and is meaningful to both individuals and employers. Students were asked whether eLearning is relevant to their career needs and the needs of their organization (Figure 1.14). Concerning the relevance of eLearning to personal needs, 95% agreed that eLearning is valid for personal needs, 5% were uncertain (Figure 1.14). 89% agreed that eLearning is good for their future career, 5% disagreed while 7% were uncertain (figure 1.15). Also 77% agreed that eLearning is relevant to their organization’s needs, 2% disagreed while 20% were uncertain (Figure 1.14).
16
0 2 514
5
20
7
70
95
77
89
0
20
40
60
80
100
120
Education Curriculum Personal Needs Organization Needs Future career
DisAgreed
Uncertain
Agreed
Figure 1.14: Relevance of eLearning to global market employment
4.2.10 Culture, Environment, and Learning Style
The authors also analysed the perception of people’s culture as well as their interests when taking the online courses (Figure 1.15). The result showed that 71% agreed that eLearning is not against their culture, 11% believed (agreed) that it is against their culture while 18% were uncertain. The respondents were asked whether the scholarly and academic status of online learning is less respected in the country (Figure 1.15). The results showed that 47% agreed that it is not less respected in the country, 23% accepted that eLearning is less respected while 30% were undecided.
47
70
301823
11
01020304050607080
scholarly and academicstatus of online leaner is
less respected in mycountry
eLearning is againstmyCulture
Education Culture
Res
pond
ents
in %
Disagree
Uncertain
Agree
Figure 1.15: eLearning against education culture

International Journal of Computing and ICT Research, Vol. 2 No. 1, June 2008
56
5. DISCUSSION 5.1 Credibility of eLearning
From figure 4.5, it is observed that credibility of eLearning is greatly influenced by the learning objectives and learning outcomes, which resulted in skills being obtained by the learner. In order for an eLearning course to have “learning” in it, the value must be there and it must enhance the learning process. The value of an eLearning program can be measured by the expected skills that a learner gets from the program. In any training, the objective of a course and methodology should ensure that the quality and relevance of the required skills are there, and they must help learners to solve their problems.
Knowledge of the instructor is a catalyst in creating an intellectual eLearning program. Higher learning institutions planning to implement eLearning will not be able to escape from continued training of staff. In many higher learning institutions there are no up-to-date laboratories, teachers get comparatively low renumeration and even suffer from lack of status, and so it is little wonder that few practitioners are attracted to take up teaching as a career. Moreover, teachers and trainers today need a much wider range of skills and competencies than in previous years if they want to survive in the globalisation of the economy.
5.2. Adaptability of eLearning Tools
Developing eLearning platforms or eContent requires innovation and skill in the selection of LMS/LCMS, or authoring tools. The platforms need to be designed with accessibility and adaptability in mind. The features integrated in the platform must ensure that learners participate fully in learning. Instructors should be equipped with the necessary tools for content authoring and ensure that the administrator of the platform has a full set of administration tools.
In order for an eLearning course to be recognized worldwide, it must be accredited by value, which leads to recognition of the awards. Students taking eLearning courses need to be under the same rules of tests, quizzes, assignments and examinations as in traditional classroom learning. From the findings of this research all centres of eLearning were conducting offline examinations. There were online tests for self-test or for fun. Only assignments and examinations were awarded marks for academic purposes. In almost all centres assignments were submitted by email, and students were able to join in the class by means of a forum. At the Dar Es Salaam Institute of Technology (DIT) and at the University of Dar Es Salaam (UDSM) students were able to take part in video conferencing.
It is important for the designers of eLearning tools to also address the issues of equity in terms of gender, socio-economic status of the country, physical and mental disabilities, culture and geographical considerations. It is also important for designers to design efficient systems, which ensure suitability and relevance of the lessons needed by learners.
5.3. Security and Quality Assurance for Online Programs
For online programs there is a need to develop quality assurance to ensure that learners are effectively trained for today’s competitive job market. The university academic quality assessment and grading criteria must be used for the judgment of online programs as done in traditional classrooms. The learner’s use of self-test should not influence the assessment decision. There is a need for instructors to give out authentic assessments (real world tasks). However the integration of self-tests, and fun quizzes is still important to motivate learners.
If online assessment is to be done, then the institution should ensure that there is appropriate infrastructure to facilitate the process. Research into and study of the latest techniques and processes for online assessment must be carried out, evaluated and tested to ensure that no cheating can be done by learners. System security, registration of the learners with unique identification and the overall administration of the online assessment by system administrators are foremost means of online quality assurance.
Dishonesty and cheating are very challenging in online assessment. It is easier to prevent learners from cheating when assessment is done in the traditional classroom or in examination centres. However, in online assessment it is difficult to prevent cheating. It is advised to have virtual laboratories for online assessment; otherwise the use of examination centres becomes necessary in conducting online programs. Again, what to be assessed is the question; assessing knowledge through online assessment might be easier than assessing skills.

International Journal of Computing and ICT Research, Vol. 2 No. 1, June 2008
57
5.4. Management of eLearning
From figure 1.9, we can argue that in order to make eLearning successful, three areas of management need to be considered: access, motivation, and competence. It is the management which should create an environment for good access to resource, which should motivate students and ensure the quality of eLearning for students to gain competence from the course.
Experience has shown that introducing new technology needs new skills to operate and maintain that new technology. It also needs the development of organizational infrastructure in which the newly acquired skills become embedded. For that reason, capacity development of instructors, technicians and managers of eLearning centres becomes necessary in any institution, which wants to introduce eLearning.
5.5. Time and Personal Management During eLearning
Unlike traditional learning where students in universities have full accommodation and have full control of the time plan, online learners are with the family or with staff at the workplace. Therefore sometimes a learner’s schedule may conflict with social factors. From Figure 1.10 it is observed that it is not enough to have a well designed eLearning system, effective content or good technology for an online learner to learn. Learners need to organize their time, and control activities like responding to Email, chatting with friends, work pressure, and social issues in the family. The environment in which the learners’ work has to allow the concentration required for effective learning to take place. Management support and good relationships among learners are important for success in the course. Support for the course from within the employing organization, University Management, and even the family is critical for the success of eLearning in an organization.
In some cases staff enrol in an eLearning program without prior acknowledgement and authorization of his/her employer and, as a result, many learners experience difficulties with their bosses. They had no time set aside specifically for their eLearning course. They spend their working time on training, and sometimes this ends up with learners being pulled from their computers by their employers to deal with production-related activities. In order to address the issues of time conflicts, the organization’s training managers, work supervisors and the learner should play a coordinated role in the eLearning initiative, bringing together learners, superiors, technical support and financial matters that create the chance of success. It is recommended that these actors should jointly create a training plan that is transparent to all of them. Such a plan should clearly identify the needs of learning, the hardware support required for learning, and the time and financial support needed by learners. Lack of management has been blamed for many eLearning failures, and this research has found that some improvement and management support is still needed.
5.6 Technology Support for Learning Processes
Technology is one of eLearning’s enablers whose proper application and usage facilitate learning. In traditional learning, learners are equipped with books and pens to copy written notes from the traditional black board. In eLearning it is the reverse; learners are happy with summarised notes projected on the boards, simulation and animations, provoking video images and stimulating sounds. These techniques enable learners to have cognitive learning.
From Figure 1.11 it is observed that the growth of technology means that resources are more available to organizations, academic institutions and individual people. Today it is possible to see privately owned laptops, desktops, printers and wireless broadband connections at home. However, in Africa in general, the cost of Internet connection is still high. The range of payment varies from $ 4.5 per Kbps per month (Kbps) up to $ 36 per Kbps for bandwidth. The direct impact of the lack of affordable connectivity in the country has created a digital divide between rural and urban people within the country. From this research it is observed that students from Mufindi in Iringa region (registered for Postgraduate diploma at ESRF), Geita in Mwanza region (registered for a Masters degree at DIT) had experienced serious problems of Internet connectivity.
5.7 Cultural Influence on eLearning
People’s behaviour towards an object is a function of intention. According to the theory of reasoned action, intention is a function of personal nature and social influence (Ajzen, 1988). Generally, people intend to perform a certain function when they evaluate it positively and when they believe that others think that they should perform it. A single failure of performance may influence others too. It is important to evaluate people’s culture, identify their interests and also their needs prior to commencing

International Journal of Computing and ICT Research, Vol. 2 No. 1, June 2008
58
eLearning for them. A designer of an eLearning program needs to design online courses that reflect the learning culture of the students, and the cultural pedagogy of the nation, as well as having cultural flexibility and the inclusion of the online environment of the learners.
Results also reveal that, despite a general unfamiliarity with computer applications and, in particular, eLearning tools, students registered for online programs without prior knowledge can still cope easily with eLearning tools and search for information from the Internet. Online students can easily adapt to the online learning environment and prove to be very flexible in terms of learning methodology and pedagogy approaches. The constructivist activities, which emphasise authentic exercises (real world tasks), social negotiation of meaning, and knowledge presented and applied in context, are well suited to the learning style of many students who prefer practical knowledge acquisition that can readily be applied to their personal or professional lives. The close contact maintained between learner and instructor, and between course coordinator and learner through chat forums, proves to be important and reduces the dropout rate of students.
6. CONCLUSION AND RECOMMENDATIONS
From the results we make the following conclusions: People’s perception of relearning is greater at the tertiary level of education that at the basic education. However, there are still doubts about the certificate obtained from online programs.
Concerning factors challenging implementation of eLearning, several were identified and found to be interrelated in affecting eLearning. It is important to note that, before commencing an eLearning program, capacity analysis needs to be done first.
It was found that the learning culture is also one of the obstacles in adapting eLearning. Therefore, implementers must be careful and sensitive in how to promote eLearning as a phenomenon for development. However, it is not easy to please everybody’s feelings concerning eLearning, and so it is important for the government to take action to implement eLearning as long as the majority accept it.
The analysis of the technology, resource accessibility and availability revealed that there is an existing initiative by the government, private companies, and NGOs to improve IT infrastructure. Even though power interruption is a problem for implementing eLearning, people still can get other means of power sources such as using generators or solar energy. It was observed that the reduction of taxes on computer items has enabled some people to afford their own personal computers or laptops.
Regarding the global market and intellectual investment, it was found that in order for eLearning courses to produce an outcome that is competitive in the global employment market, universities need to invest carefully in online courses.
Based on the findings and conclusions the author makes the following recommendations for further research.
• There is a need for further comparative research to be carried out on people’s perception of eLearning in years to come.
• Additional research should be carried out to outline the significance of each factor in influencing the implementation of eLearning.
• There is a need for a market and regulatory survey of eLearning in to be carried out in order to guide the eLearning investment decisions of both private and government institutions.
• There is need to develop tools for information access and learning for people with disabilities.
7. REFERENCES AJZEN, I., (1988), Attitudes, Personality, and Behaviour, Open University Press, Milton Keynes, Inc,
ISBN 0-335-15342-9 Pbk. ALESSI, S., AND TROLLIP, S. (2001), Multimedia for Learning Methods and Development 3rd
Edition, Allyn & Bacon A Pearson Education Company, ISBN0-205-2769-1. ALLEN, M., (2003), Guide to eLearning: Building interactive, Fun, and effective learning programs
for Any Company, Wiley & Sons, ISBN 0-471-20302-5. BEST, (2006), “The United Republic of Tanzania, The Ministry of Education and Vocational
Training. Basic Education Statistics in Tanzania, 2002-2006 National data”, June 2006. BURGOS, D., (2006), “Adaptive eLearning Methods and IMS learning Design. An integrated
approach”. Conference paper TENCompetence, Sofia, Bulgaria, March 14, 2006, www.dspace.ou.nl/bitstream/1820/719/w5-5bur.pdf, retrieved on 17th March 2007

International Journal of Computing and ICT Research, Vol. 2 No. 1, June 2008
59
BURGOS, D., COLIN, T., ROB, K. (2006), “Representing Adaptive strategies in IMS learning Design”, Conference paper on TENCompetence, Sofia, Bulgaria 14th March 2006, www.dspacwe.ou.nl/bitstream/1820/718/1/ADELE_BurgosSpeacht_19May06 V2.pdf
,`retrieved on 17th March 2007 BRUSILOVSKY, P. (2004), “Knowledge Tree: A distributed Architecture for adaptive E-Learning”.
Conference paper at WWW Conference, MAY 17-22, 2004, New York USA, www.ask4reseach.info/Uploads/Files/citations/1086193811.pdf retrieved on 7th March 2007
HENZE. N., AND NEJDL. W., (2004), “A logical Characterizing of Adaptive Education Hypermedia” Journal of New Review in Hypermedia and multimedia,Vol.10, No.1, 77, 2004.
HOSSEIN, A.,(2007), “Estimating the Proportion with Acceptable Absolute Precision”, internet information http://home.ubalt.edu/ntsbarsh/Business- stat/otherapplets/SampleSize.htm, retrieved
on 11November 2006 KIZITO, J.B., AND BIJAN. K., (2005), “An Empirical study on Education strategy to E-leaning in
Developing country”. 4th International workshop on Technology for education in developing countries,10-12 July 2006.
LAROCQUE, N., (2003), “The promises of eLearning in Africa. The potential for Public -Private partnerships” E-Government series, January 2003, www.businessofgovernmet.org/Pdfs/LaRocqueReport.pdf retrieved on 10 March 2007
OSTLUND, B., (2005), “Stress, disruption and Community adult learners’ experience of obstacles and opportunities in distance education”. European Journal of open distance and eLeaning (EURODL), 2005, ISSN 1027-5207, Available at www.eurodl.org/materials/brief/2005/Ostlund_GBA.html
PAL, J.,(2006), “Early-stage practical of Implementing Computer-Aided Education Experience from India”. Preceding of 4th IEEE International Workshop. Technology For education in Developing,Countries,TumainiUniversity,Iringa, Tanzania, IEE Computer Society, Los Alamitos, TEDC-July10-12, 2006
PEKKA, K., (2005), “Quality System For European Universities eLearning”, 4th International Conference on Emerging e-Learning Technology and Applications, September 2005. ISBN 80-8086-016-6.
SEMP, (2005), “The United Republic of Tanzania”, Ministry of Education and Vocation Training, Secondary Master Plan, 2001-2205 Internet resource available at www.moe.go.tz retrieved on May 15 2007.
International Journal of Computing and ICT Research, Vol. 2 No. 1, June 2008
60
NETWORK INTRUSION DETECTION BASED ON ROUGH SET AND K-NEAREST NEIGHBOUR
Adebayo O. Adetunmbi*, Samuel O. Falaki, Olumide S. Adewale and Boniface K. Alese Department of Computer Science, Federal University of Technology ___________________________________________________________________ Increasing numbers of interconnected networks to the internet have led to an increase in cyber attacks which necessitates the need for an effective intrusion detection system. In this paper, two machine learning techniques: Rough Set (LEM2 Algorithm) and k-Nearest Neighbour (kNN) are used for intrusion detection. Rough set is a classic mathematical tool for feature extraction in a dataset which also generates explainable rules for intrusion detection. The experimental study is done on the international Knowledge Discovery and Data mining tools competition (KDD) dataset for benchmarking intrusion detection systems. In the entire experimentations, we compare the performance of Rough Set with k-Nearest Neighbour. The results generated from the experiment reveal that k-nearest neighbour has a better performance in terms of accuracy but consumes more memory and computational time. Rough Sets classifies at relative short time and employs simple explainable rules. Keywords: Rough set, intrusion detection, nearest neighbour IJCIR Reference Format: Adebayo O. Adetunmbi†, Samuel O. Falaki, Olumide S. Adewale and Boniface K. Alese Network Intrusion Detection based on Rough Set and k-Nearest Neighbour. International Journal of Computing and ICT Research, Vol. 2, No. 1, pp. 60 - 66. http:www.ijcir.org/volume2-number1/article7.pdf. 1. INTRODUCTION Accompany the benefits of Internet are various techniques to compromise the integrity and availability of the system connected to it due to flaws in its protocols and software widely entrenched. An Intrusion detection system (IDS) is required in addition to the preventive defense mechanisms such as firewall for another layer of protection. Intrusion detection is a process of detecting security breaches by examining events occurring in a computer system.
Intrusion is defined as any set of action that attempt to compromise the integrity, confidentiality or availability of system resources (Adetunmbi et al, 2006). Basically, there are two approaches to intrusion detection model as described in (Biswanath et al, 1994): Misuse detection model refers to detection of intrusions that follow well-defined intrusion patterns. It is very useful in detecting known attack patterns. Anomaly detection model refers to detection performed by detecting changes in the patterns of utilization or behavior of the system. It can be used to detect known and unknown attack.
IDSs are also classified as network-based or host-based in terms of source of data. The former collect raw network packets as the data source from the network and analyze for signs of intrusions Host-based IDS operates on information collected from within an individual computer system such as operating system audit trails, C2 audit logs, and System logs (Sundaram, 1996; Byunghae et al, 2005).
Majority of the IDS entrenched today are either rule-based or expert-system based. Their strengths depend largely on the ability of the security personnel that develops them. The former can only
* Author’s Address: Adebayo O. Adetunmbi*, Samuel O. Falaki, Olumide S. Adewale and Boniface K. Alese. Department of Computer Science, Federal University of Technology "Permission to make digital or hard copies of part or all of this work for personal or classroom use is granted without fee provided that copies are not made or distributed for profit or commercial advantage and that copies bear this notice and the full citation on the first page. Copyrights for components of this work owned by others than IJCIR must be honored. Abstracting with credit is permitted. To copy otherwise, to republish, to post on servers or to redistribute to lists, requires prior specific permission and/or a fee." @International Journal of Computing and ICT Research 2008. International Journal of Computing and ICT Research, ISSN 1818-1139 (Print), ISSN 1996-1065 (Online), Vol.2, No.1, pp. 60 - 66, June 2008.

International Journal of Computing and ICT Research, Vol. 2 No. 1, June 2008
61
detect known attack types and the latter is prone to generation of false positive alarms. Hence, the need for intelligence techniques known as machine learning techniques which automatically learn from data or extract useful pattern from data as a reference for normal/attack traffic behaviour profile from existing data for subsequent classification of network traffic. Promising researches in this area include among others the work of Lee et al (1999), Alan, et al (2002); Byunghae, et al (2005); Sanjay, et al (2005).
Enormous amounts of data are collected from the network for network based intrusion detection. This poses a great challenge. Raw network traffic needs to be summarized into higher-level events, described by some features, such as connection records before feeding the data to a machine learning algorithm. Selecting relevant features is a crucial activity and requires extensive domain knowledge.
Various machine learning techniques have been applied to the design of IDS. Among these are neural networks, linear genetic programming, Support vector machines, Bayesian Networks, Multivariate adaptive regression splines, and Fuzzy inference systems (Peddabachigari, et al; 2005). Also, many data mining approaches, including discovering association rules, have been applied to intrusion detection (Lee et al, 1999). Wang and He (2006) used the hybrid approach of Rough Set theory and Association Rule Mining to improve the accuracy of the intrusion detection. Recently, Andrew and Mukkamala (2003) have used support vector machine and neural network to identify important features for intrusion detection.
In this paper, Rough Set is used in building an intrusion detection model subsequently used for classifying unseen network traffic. Relevance features extracted by Rough Set are then used for classifying Network traffic either as normal or attack. Also, the entire features are used by the k-Nearest neighbour and the results obtained reported.
The rest of the paper is organized as follows. Section 2 provides a brief introduction to the dataset used. In section 3, Basic concepts of rough set theory and Nearest Neighbour are described. The experimental results are reported in Section 4 followed by conclusion in Section 5.
2. INTRUSION DATA SET The KDD Cup 1999 dataset used for benchmarking intrusion detection problems is used in our experiment. The dataset was a collection of simulated raw TCP dump data over a period of nine weeks on a local area Network. The training data was processed to about five million connection records from seven weeks of network traffic and two weeks of testing data yielded around two million connection records. The training data is made up of 22 different attacks out of the 39 present in the test data. Table 1 shows the different attack types for both training (known) and the additional attack types included for testing (novel) for the four categories. The known attack types are those present in the training dataset while the novel attacks are the additional attacks in the test datasets not available in the training data sets. The attacks types are grouped into four categories:
(1). DOS: Denial of service – e.g. syn flooding (2). Probing: Surveillance and other probing, e.g. port scanning (3). U2R: unauthorized access to local super user (root) privileges, e.g. buffer overflow
attacks. (4). R2L: unauthorized access from a remote machine, e.g. password guessing
The training dataset consisted of 494,021 records among which 97,277 (19.69%) were normal, 391,458 (79.24%) DOS, 4,107 (0.83%) Probe, 1,126 (0.23%) R2L and 52 (0.01%) U2R connections. The testing dataset is made up of 311,029 records out of which there were 60,593 (19.48%) normal, 229,853 (73.90%) DOS, 4,166 (1.34%) Probe, 16,189 (5.21%) R2L and 228 (0.07%) U2R. The test and training data are not from the same probability distribution. In each connection are 41 attributes describing different features of the connection (excluding the class attribute), and a label assigned to each either as an attack type or as normal.
DOS Probe R2L U2R Known

International Journal of Computing and ICT Research, Vol. 2 No. 1, June 2008
62
Back, land, Neptune, Pod, smurf, teardrop
ipsweep, satan, nmap, portsweep
ftp_write, guess_passwd, warezmaster, warezclient, imap, phf, spy, multihop
rootkit, loadmodule, buffer_overflow, perl
Novel apache2, udpstorm, processtable, mailbomb
Saint, mscan named, xlock, sendmail, xsnoop, worm, snmpgetattack, snmpguess
xterm, p.s., sqlattack, httptunnel
Table 1: Known and novel attack types
3. BASIC CONCEPTS OF ROUGH SETS AND K-NEAREST NEIGHBOUR 3.1 Basic Concepts of Rough Set Rough set theory (RST) is a useful mathematical tool to deal with imprecise and insufficient knowledge, find hidden patterns in data, and reduce dataset size (Pawlak, 1982; Komorowski, et al, 1998). Also, it is used for evaluation of significance of data and easy interpretation of results. RST contributes immensely to the concept of reducts. Reducts is the minimal subsets of attributes with the most predictive outcome. Rough Set is a machine learning method which generates rules based on examples contained within an information table. Rough set theory has become well established as a mechanism for solving the problem of how to understand and manipulate imprecise and insufficient knowledge in a wide variety of applications related to artificial intelligence. Let K = (U,C) be an approximation space, where U is a non-empty, finite set called the universe; A subset of attributes R C⊆ defines an equivalent on U. Let [x]R (x ∈ U) denote the equivalence class containing x. Given R C and X U⊆ ⊆ . X can be approximated using only the information contained within R by constructing the R-lower and R-upper approximations of set X defined as:
{ | [ ] }RRX x X x X= ∈ ⊆
{ | [ ] 0}RRX x X x X= ∈ ∩ ≠ where
RX is the set of objects that belong to X with certainty, and RX is the set of objects that possibly belong
to X. The R-positive region of X is POSR(X) = RX , the R-negative region of X is NEGR(X) = U - RX ,
and the boundary or R-borderline region of X is ( )RBN X RX RX= − . X is called R-definable if and
only if RX RX= . Otherwise RX RX≠ and X is rough with respect to R iff RX RX≠ . The approximation measure ( )R Xα is defined as
| |( )| |RRXXRX
α =
where X ≠ φ, and |X| denotes the cardinality of set X. Algorithm LEM2 below developed by Grzymala-Busse (1997) is used in building an intrusion detection model. LEM2 Algorithm Input: K set of objects Output: R set of rules begin
G = K; R = φ;

International Journal of Computing and ICT Research, Vol. 2 No. 1, June 2008
63
While G ≠φ do begin C ≠φ C(G) = {c: [c]∩G≠φ}; While(C ≠φ) or (!([C] ⊆ K)) do begin select a pair c ∈C(G) such that |[c] ∩ G| is maximum; if ties, select a pair c ∈C(G) with the smallest cardinality |[c]|; if further ties occur, select the first pair from the list; { }; [ ] ;C C c G c G= ∪ = ∩ C(G) = {c:[c]∩G≠φ};
C(G) = C(G) – C; end;
for each elementary condition c ∈ C do if |C – c| ⊆ K then C = C – {c}; create rule r basing the conjuction C and add it to R; | |
r R
G K R∈
= −U
end; for each r ∈ R do
if | |s R r
S K∈ −
=U then R = R –r
end
Figure 1: LEM2 Algorithm 3.2 Nearest Neighbour Nearest Neighbour (NN) is an easy classification technique, classifies new observations into their appropriate categories by simply searching for similar or closest instances in the well known classified observations (training data set). Closeness is defined in terms of a distance metric, such as Euclidean distance. The Euclidean distance between two points or tuples, say X1= (x11, x12,…, x1n) and X2= (x21, x22,…, x2n), is
21 2 1 2
1( , ) ( )
n
i ii
dist X X x x=
= −∑
NN consists of training and testing phases like other supervised learning technique. In the training phase, data points are given in an n-dimensional space with associated labels designating their class. In the testing phase, unlabeled data are given and the algorithm classifies new objects (network traffic) by choosing the class of the nearest neighbour or the most common class in the nearest neighbour (kNN) in the training set as measured by distance metric. Since the introduction of NN by Fix and Hodges (1951), it has been used and improved upon (Bay, 1998), and employed in many domains, such as UCI datasets repository (Hettich and Bay, 1999). We are interested in using the NN classifier to compute all possible distance pairs between all the training data set and the test data set records. Min-max normalization is used for data transformation of continuous attribute values in the range [0, 1] by computing.
min'max min
A
A A
vv −=
−
where minA and maxA are the minimum and maximum values of attribute A. For categorized attributes; a simple method adopted is to compare the corresponding value of the attribute in tuple X1 with that in tuple X2. If identical, the difference between the two is taken as zero else as 1.
3.3 Preprocessing

International Journal of Computing and ICT Research, Vol. 2 No. 1, June 2008
64
Since Rough set only works on discrete features just like other machine learning techniques like nearest neighbour and decision trees among others; continuous features in the dataset are discretized based on Entropy, a supervised splitting technique (Shannon, 1948; Jiawei and Micheline, 2006). Entropy is used to determine how informative a particular input attribute is about the output attribute for a subset. It is computed as follows:
i. Let D be a set of training data set defined by a set of attributes with their corresponding class labels.
ii. A split-point for an attribute A within the set can partition the tuples in D into two subsets satisfying the conditions A ≤ split_point and A > split_point respectively.
iii. 1 21 2( ) ( ) ( )A
D DInfo D Entropy D Entropy D
D D= + where D1 and D2 correspond to the tuples in D
satisfying the conditions A ≤ split_point and A > split_point respectively.
iv. 1 21
( ) log ( )m
i ii
Entropy D P P=
= −∑ , where Pi is the probability of Ci in D1, determined by dividing
the number of tuples of Ci in D1 by |D1|, the total number of tuples in D1.
In selecting a spilt-point for attribute A, pick an attribute value that gives the minimum information required. This process is performed recursively on an attribute until the information requirement is less than a small threshold.
4. EXPERIMENTAL RESULTS 4.1 Experiments using Rough Set Theory This section presents experimental results obtained when directly applying the two methods discussed in section 3 on the testing dataset, made up of 311,029 records. Here, we are only interested in knowing to which category (normal, DOS, R2L, U2R, Probing) a given connection belongs. The accuracy of each experiment is based on percentage of successful classification (PSC) on the test dataset, where
tan
tan s innumber of correctly classified ins cesPSC
numberof ins ce thetestset=
Table 2 presents the confusion matrix of the first experiment performed when rules induced by LEM2 algorithm (Rough Set) are used on the test dataset. The information system is first discretized by the Entropy described in Section 3.3 followed by building a classification model for all the attack types and normal (rule induction) LEM2 Algorithm. The performance of the classifier is then measured using the test data set. Predicted as Actual
Normal Probing DOS U2R R2L
Normal(60593) 99.24% 0.75% 0.00% 0.005% 0.005% Probing(4166) 42.68% 55.83% 1.25% 0.24% 0.00% DOS(229853) 6.32% 0.06% 93.61% 0.00% 0.01% U2R(228) 90.35% 1.32% 0.00% 8.33% 0.00%

International Journal of Computing and ICT Research, Vol. 2 No. 1, June 2008
65
R2L(16189) 99.88% 0.00% 0.00% 0.04% 0.08% PSC = 89.34% Table 2 Confusion Matrix Table 2: Confusion matrix obtained with Rough Set classification model From Table 2, we can see that the last two classes R2L and U2R are not well detected. The low presence of these two classes of attacks in the training dataset accounts for the poor detection. The percentage of R2L and U2R in the dataset are 0.23% (1,126 records) and 0.01 (52 records) respectively. 4.2 Experiments using k-Nearest Neighbour Predicted as Actual
Normal Probing DOS U2R R2L
Normal(60593) 99.47% 0.24% 0.29% 0.00% 0.00% Probing(4166) 13.12% 74.10% 12.28% 0.00% 0.50% DOS(229853) 2.81% 0.15% 97.04% 0.00% 0.00% U2R(228) 39.96% 18.80 32.01 6.60 2.63 R2L(16189) 95.55% 2.76% 0.20% 0.24% 1.25% PSC = 92.63% Table 3 Confusion Matrix With k-nearest Neighbours Table 3 shows the confusion matrix obtained with k-nearest neighbour using the whole 41attributes and the value of k equals 3. kNN also records poor detection in the last two classes. In the two experiments, kNN outperform Rough set algorithm in the detection of all attack types except U2R. kNN algorithm has overall accuracy of 92.63% against 89.34% using Rough set. 5. CONCLUSION In this paper, we presented the performance of rough set and k-nearest neighbour algorithms on intrusion detection for comparisons. The two algorithms performed poorly on U2R and R2L due to their few representations in the training dataset. However, the attribute values in a training data set completely differ from the attribute values from the test dataset mostly for these two attack types. This leads to wrong classification because these instances are not learned in the training phase. Also pertinent is that rough set is three times faster during classification than k-nearest neighbour. As our future work, we intend to explore other machine learning techniques, supervised or unsupervised, to improve the detection accuracy; most especially for the last two classes (R2L and U2R). 6. REFERENCES ADETUNMBI A..O., ZHIWEI S., ZHONGZHI S., AND ADEWALE O.S. 2006. Network Anomalous
Intrusion Detection using Fuzzy-Bayes, in IFIP International Federation for Information Processing, Volume 228, Intelligent Information Processing III, Eds. SHI Z., SHIMOHARA K., FENG, D., (Boston: Springer) pp. 525 – 530.
ANDREW H. S. AND MUKKAMALA, S. 2003. Identifying important features for intrusion detection using support vector machines and neural networks”. IEEE Proceedings of the Symposium on Application and the Internet (SAINT ‘ 03).
BISWANATH, M., TODD L.H., AND KARL, N.L. 1994. Network Intrusion Detection. IEEE Network, 8(3): 26-41.
BYUNGHAE-CHA, K.P. AND JAITTYUN, S. 2005. Neural Networks Techniques for Host anomaly Intrusion Detection using Fixed Pattern Transformation. ICCSA 2005, LNCS 3481 pp. 254-263.
ESKIN, E., ARNOLD, A., PRERAU, M., PORTNOY, L AND STOLFO, S. 2003. A Geometric framework for unsupervised anomaly detection: Detecting intrusions in unlabeled data.

International Journal of Computing and ICT Research, Vol. 2 No. 1, June 2008
66
Applications of Data Mining in Computer security. FIX E. AND HODGES J.L. 1951. Discrimination analysis: Non parametric discrimination:
Consistency properties. Technical report 21-49-004, USAF School of Aviation Medecine, Randoff Field, Texas.
GRZYMALA-BUSSE J.W. 1997. A New Version of the Rule Induction System LERS. Fundamenta Informaticae, 31(1) pp. 27-39.
HETTICH, S. AND BAY, S.D. 1999. The UCI KDD Archive. Available at http://kdd.ics.uci.edu. JIAWEI, H. AND MICHELINE, K. 2006. Data Mining Concepts and techniques, second edition,
China Machine Press, pp. 296 -303. KDD CUP 1999 DATASET: http://kdd.ics.uci.edu/databases/kddcup99/ KOMOROWSKI, J., POKOWSKI, L. AND SKOWRON, A. 1998. Rough Sets: A Tutorial
citeseer.ist.psu.edu/komorowski98rough.html LEE, W., STOLFO, S.J. AND MOK, K. 1999. Data Mining in work flow environments: Experiments
in intrusion detection. In Proceedings of the 1999 Conference on Knowledge Discovery and Data Mining.
PAWLAK, Z. 1991 Rough Sets: Theoretical Aspects of Reasoning About Data. Kluwer Academic Publishing, Dordreiht.
PEDDABACHIGARI, S., ABRAHAM, A., GROSAN, C., AND THOMAS, J. 2005. Modelling Intrusion detection using hybrid Intelligent systems, Journal of Network and Computer Applications, Elsevier science.
SANJAY, R., GULATI, V.P. AND ARUN, K.P. 2005. A Fast Host-Based Intrusion Detection System Using Rough Set Theory in Transactions on Rough Sets IV, LNCS 3700, 2005, pp. 144 – 161.
SHANNON, C.E. (1948). A mathematical theory of communication, bell System technical Journal 27: 379-423 and 623 – 656.. http://cm.bell-labs.com/cm/ms/what/shannonday/paper.html SUNDARAM, A. 1996. An Introduction to Intrusion detection
ftp.cerias.purdue.edu/pub/doc/intrusion_detection/Intrusion-Detection-Intro.ps.Z. WANG, X. AND HE, F. 2006. Improving Intrusion Detection Performance Using Rough Set Theory and
Association Rule Mining, IEEE International Conference on Hybrid Information Technology.