Embed Size (px)
Citation preview

INTERNATIONAL JOURNAL OF CIVIL AND STRUCTURAL ENGINEERING Volume 1, No 3, 2010
© Copyright 2010 All rights reserved Integrated Publishing services Research article ISSN 0976 – 4399
667
Effect of Pylon Shape on seismic response of Cable stayed bridge with soil structure interaction
Siddharth G. Shah 1 , Desai.J.A 2 , Solanki.C.H 3 1 Assistant Professor, CGPIT, Bardoli Gujarat India
2 Director & Professor, C G Patel Institute of Technology, Bardoli Gujarat India 3 Associate Professor, Department. of Applied Mechanics, S.V.NIT –Surat, Gujarat
ABSTRACT
Cable stayed bridge are the most flexible bridge and getting popularity because of its economy for longer spans and aesthetics. Here focus is given on the effect of shape of pylon on the seismic response of cable stayed bridge, for this, the bridge span dimension and other parameters are kept constant, and only the pylon shape is varied viz. A type, H type, portal frame, spread pylon and pyramid shapes. The height of the pylon is kept constant for all the shapes for comparison purpose. Here soil structure interaction effects are considered through the soilspring at the base. The 3D bridge model is prepared on SAP 2000 software and bridge is analyzed seismically by Bhuj 2001, Earthquake India. The bridge response in terms of pylon displacement, acceleration and base moment is obtained. The study reveals that the shape of the pylon has great influence in the seismic response of cable stayed bridge. spread pylon shape are better for resisting earthquake in longitudinal direction but weak in lateral direction, but pyramid shape pylon is better because of its geometry in resisting earthquake force from any direction and also SSI effects are minimum in this case. SSI effects are predominant for soft soil conditions for all pylon shapes.
Keywords: Pylon Shape, Time History Analysis, Soil Structure Interaction, Seismic Response, Soil Stiffness
1. Introduction
Bridges are critical lifeline facilities which should remain functional without damage after an earthquake to facilitate the rescue and relief operations. In recent years, several cablestayed bridges have been constructed on relatively soft ground , Betti (1993), which results in a great demand to evaluate the effects of soil–structure interaction (SSI) on the seismic behavior of the bridges, and properly reflect it in their seismic design. Soil Structure Interaction is complicated phenomena involving three effects as stated by, Gazets (2006) are as following
1. Wave Amplification: seismic waves alters due to flexibility of soils
2. Kinematic Response: soil displacement is causing structure to displace
3. Inertial Reactions: structural movement continues and adds in to the displacement of soils.
This interaction effects were neglected previously but due to failure of so many massive structure during earthquake event realized the significance of SSI. Thus SSI is given importance and lots of research work is going on to study the effects of SSI on various structures.

INTERNATIONAL JOURNAL OF CIVIL AND STRUCTURAL ENGINEERING Volume 1, No 3, 2010
© Copyright 2010 All rights reserved Integrated Publishing services Research article ISSN 0976 – 4399
668
Soilstructure interaction (SSI) is a complex phenomenon for which research suggests solution by using two different methods, Wolf (1985)
1. Direct method (scope of direct method is with time domain)
2. Substructure method (Substructure method operates in frequency domain)
The purpose of the towers is to support the cable system and transfer forces to the foundations. They are loaded with high compressions and bending moments that depend on the stay cable layout and the decktower support conditions. Towers can be made of steel or concrete, being the latter generally more economic considering similar stiffness conditions. However, their selfweight is generally higher than that of steel, which implies keeping in mind local soil conditions and construction speed when using concrete. Thus, the seismic response of the towers will be conditioned by several aspects, and in addition to the previous idea, the geometric shape of the towers, which depends on the applied loads, cablestay system and aesthetic conditions, is a very important aspect. It is necessary to emphasize in the fact that concrete design is undoubtedly heavier, inducing higher seismic forces. The effects of SSI were studied by the software SAP 2000. SAP is finite element based program and is recognized by international community for the research purpose. The modeling of any problem in SAP is prepared as per following procedure
2. Modeling Procedure on SAP
1. Draw the geometry of the frame either by inserting coordinates or by linking the
nodes through member length.
2. Draw the required fixed support (NoSSI) or spring (SSI) according to the case.
3. Select the stiffness of the spring for SSI as the Winkler approach. Which is taken as
200kN/m
4. Define the sections and materials for the members.
5. Define the loading values and load combinations to be applied on the structures.
6. Define the time history to be used for the dynamic analysis and include it in the
analysis case
7. Now assign the defined section to the members
8. Assign the loads to the joints or members as per the case
9. After assigning everything, set the analysis to be carried out and press run analysis
SAP program will generate the various results like joint displacements, joint forces, joint reactions, mode shapes etc.

INTERNATIONAL JOURNAL OF CIVIL AND STRUCTURAL ENGINEERING Volume 1, No 3, 2010
© Copyright 2010 All rights reserved Integrated Publishing services Research article ISSN 0976 – 4399
669
Figure 1: Different tower /Pylons available for cable stayed bridge
2.1 Modeling of Bridge
In the analysis of the bridge the most important part is modeling. For accurate results modeling of the different components must reflect the actual forces and geometrical properties. Different components of bridges like deck, pylon, cables foundation etc must be modeled as per the actual forces they are subjected. For e.g. cable members shall be modeled as truss member because they are going to subjected axial forces in majority. The bridge considered here is situated at river missisippi, the details are given in Table1.
Table1: Details of Quincy bay view Cable stayed bridge material and sections – After Wilson et al. (1985)
Sr. No. Component Dimension Material Shape
1. Cable 0.80 m Steel Circular
2.a Deck Depth =0.2m
Width = 16m length=10m
RCC Rectangular
2.b End Beams
1m x 0.4m tw = 0.15m tf = 0.15m
Steel I –section
2.c Intermediate Beams
0.7m x 0.25m tw = 0.10m tf = 0.10m
Steel I section
3. Pylon Bottom 1.2 m RCC solid wall ,connecting two legs
4. Pylon Intermediate at deck level
(2.2 m x 4.5m) (0.3m diameter hole) RCC Hollow Rectangular
Box
5. Pylon Top (4.5m x3.3m) (0.9mx 1.8m) RCC Hollow Rectangular
Box

INTERNATIONAL JOURNAL OF CIVIL AND STRUCTURAL ENGINEERING Volume 1, No 3, 2010
© Copyright 2010 All rights reserved Integrated Publishing services Research article ISSN 0976 – 4399
670
Table 2: Details of dimensions and other parameters for different shape of Pylons
Sr. No
Pylon/ Tower shape level Material shape & Dimensions
1.a ‘H’ Shape bottom RCC Hollow Rectangular (24 x10m )–(8 x3.5)
1.b ‘H’ Shape Deck RCC Hollow Rectangular, (2.2 m x 4.5m) (0.3m diameter hole)
1.c ‘H’ Shape Top RCC Hollow Rectangular (15m x6m) (4.8mx 1.8m)
2 ‘A’ Shape same at all RCC hollow rectangular (6mx4m) thickness=2.5m
3.a Spread Pylon ‘Y’ shape bottom RCC Hollow Rectangular Box (24.21x10.5m)
(8.07 x 3.5m)
3.b Spread Pylon ‘Y’ shape deck RCC Hollow Rectangular Box (18.72 x 5.48) –
(6.24x1.82m)
3.c Spread Pylon ‘Y’ shape Top RCC Hollow Rectangular Box (15.24x5.48m) –
(5.08x1.82m)
4 Diamond/ Pyramid shape
same at all RCC hollow rectangular (6mx4m) thickness=2.5m
Table 3: Different Properties including lateral and rocking stiffness coefficients for three types of soil considered in this study.
Sr. No Soil Properties
SoilI Hard Clayey soil
SoilII Soft Silty soil
SoilIII medium Sandy soil
1 Unit weight of soilγ (kN/m 3 ) 20 18 19 2 Shear Strengthτs (kN/ m 2 ) 200 75 150 3 Poisson’s Ratioν 0.3 0.4 0.35 4 Damping of soilξ 0.02 0.06 0.04 5 Shear wave velocity –Vs (m/ sec) 1050 83 309 6 Shear ModulusGs (kN/m 2 ) 269 x 10 4 12500 192 310
7 Young’s modulus of ElasticityE (kN/m 2 ) 700 x 10 4 35000 500 x 10 3
8.a Soil stiffness Kx (kN/ m) 252 x 10 4 4.60 x 10 4 8.62 x 10 6
8.b Soil stiffness Ky(kN/ m) 1050 x 10 4 5.52 x 10 4 10.3 x 10 4
8.c Soil stiffness Kz (kN/ m) 1028 x 10 4 5.36 x 10 4 10.0 x 10 4
8.d Soil stiffness Kθx (kN m/rad) 8094 x 10 4 156 x 10 4 292 x 10 4
8.e Soil stiffness Kθy(kN m/rad) 309 x 10 4 21.6 x 10 4 40.4 x 10 4
8.f Soil stiffness Kθz (kN m/rad) 9808 x 10 4 532 x 10 6 729 x 10 6
The four different shape of pylons considered in this study are ‘H’ shape, ‘A’ Shape, ‘Spread PylonY’ Shape, and ‘Diamond’ shape, the details are given in Table2. There are many approaches to calculate stiffness coefficient for soil in translational and rotational directions.

INTERNATIONAL JOURNAL OF CIVIL AND STRUCTURAL ENGINEERING Volume 1, No 3, 2010
© Copyright 2010 All rights reserved Integrated Publishing services Research article ISSN 0976 – 4399
671
In the first approach, vertical, lateral and rotational directions were calculated by theory of the circular plate resting on the elastic half space as used by Luco(1990)
……(1)
……(2) Where,
kh and kr are the horizontal and rotational stiffness respectively Ch and Cr are Damping coefficient long horizontal and rotational directions respectively , is the unit weight of soil,
α is the average dimension of circular plate
is Poisson’s Ratio and G is shear modulus of the soil.
The soil beneath the foundation has been assumed of three different types as per the table3
3. Dynamic Analysis Methods for Seismic analysis of Bridge [Time history method.]
Different methods are available to analyze the bridge seismically. Different methods uses different concept the brief out line of each method is given below ,Clough & Penzin (1975)
3.1 The singlemode method (singlemode spectral and uniform load analysis)
In this method seismic load can be considered as an equivalent static horizontal force applied to an individual frame in either the longitudinal or transverse direction. The equivalent static force is based on the natural period of a single degree of freedom (SDOF) and codespecified response spectra. Engineers should recognize that the singlemode method (sometimes referred to as equivalent static analysis) is best suited for structures with wellbalanced spans with equally distributed stiffness.
3.2 Multimode spectral analysis
Here member forces, moments, and displacements due to seismic load can be estimated by combining the responses of individual modes using the methods such as complete quadratic combination (CQC) method and the square root of the sum of the squares (SRSS) method. The CQC method is adequate for most bridge systems, and the SRSS method is best suited for combining responses of wellseparated modes.
3.3The multiple support response spectrums (MSRS) method
This provides response spectra and the peak displacements at individual support degrees of freedom by accurately accounting for the spatial variability of ground motions including the effects of incoherence, wave passage, and spatially varying site response. This method can be used for multiply supported long structures.

INTERNATIONAL JOURNAL OF CIVIL AND STRUCTURAL ENGINEERING Volume 1, No 3, 2010
© Copyright 2010 All rights reserved Integrated Publishing services Research article ISSN 0976 – 4399
672
3.4 The time history method
This is a numerical stepbystep integration of equations of motion. It is usually required for critical/important or geometrically complex bridges. Inelastic analysis provides a more realistic measure of structural behavior when compared with an elastic analysis.
When the structure enters the nonlinear range, or has non classical damping properties, modal analysis cannot be used. A numerical integration method, sometimes referred to as time history analysis, is required to get more accurate responses of the structure. The time history analysis includes following steps.
The equation of motion of a multi support excitation would be excited by the displacement array. And, the equation of motion for the multi support system becomes
..(3) By using the uncoupling procedure, the modal equation of the n th mode can be written as
..(4) In a time history analysis, the timescale is divided into a series of smaller steps, dτ. Let us say the response at i th time interval has already determined and is denoted by ui, úi, üi, Then, the response of the system at i th time interval will satisfy the equation of motion.
…(5) The timestepping method enables us to step ahead and determine the responses at the i + 1 th time interval by satisfying above equation, Thus, the equation of motion at i + 1 th time interval will be
..(6) needs to be solved prior to proceeding to the next time step. By stepping through all the time steps, the actual response of the structure can be determined at all time instants.
Figure 2: Bhuj earthquake time history

INTERNATIONAL JOURNAL OF CIVIL AND STRUCTURAL ENGINEERING Volume 1, No 3, 2010
© Copyright 2010 All rights reserved Integrated Publishing services Research article ISSN 0976 – 4399
673
Table 4: Details of three earthquakes considered in this study
longitudinal direction Total time Earthquake Recording station Component PGA (g) (Sec) Bhuj,2001 Ahmedabad N12W 0.080 120
4. Result & Analysis
Figure 3: Response of Max Acc (m/s 2 ) for H shape pylon in longitudinal & lateral directions for different foundation soils.
Figure 4: Response of Max Acc (m/s 2 ) for A shape pylon in longitudinal & lateral directions for different foundation soils.

INTERNATIONAL JOURNAL OF CIVIL AND STRUCTURAL ENGINEERING Volume 1, No 3, 2010
© Copyright 2010 All rights reserved Integrated Publishing services Research article ISSN 0976 – 4399
674
In this study the Bridge of Quincy bay view is modeled on SAP 2000 with different pylons viz; H Shape, A shape, y/spread pylon, and Diamond /Pyramid shape pylon. For comparison and study of the effect of shape of pylon the parameters like pylon height, span of bridge, cable arrangement, deck width etc are kept constant for all the analysis, as done by Tangaonkar & Jangid (2003)
Figure 5: Response of Max Acc (m/s2) for Y shape pylon in longitudinal & lateral directions for different foundation soils.
Figure 6: Response of Max Acc (m/s2) for Diamond/Pyramid shape pylon in longitudinal & lateral directions for different foundation soils
The soil structure interaction effect is considered by three different soil conditions at the base of pylon by assigning springs in vertical horizontal and rocking directions. The seismic response in pylon is obtained by applying Bhuj earthquake time history in longitudinal &

INTERNATIONAL JOURNAL OF CIVIL AND STRUCTURAL ENGINEERING Volume 1, No 3, 2010
© Copyright 2010 All rights reserved Integrated Publishing services Research article ISSN 0976 – 4399
675
lateral directions of bridge. The maximum acceleration produced in the pylon along the height is plotted in the Figure (36).
Figure 7: Response of Max Displacement (m) for H shape pylon in longitudinal & lateral directions for different foundation soils.
Figure 8: Response of Max Displacement (m) for A shape pylon in longitudinal & lateral directions for different foundation soils.
Figure 3 indicates the maximum acceleration distributions along the H shape tower/pier for the cases Hard, Soft & Medium soil respectively. As the soil stiffness decreases, the maximum acceleration above the bottom of pier decreases, and that at the top increases. This trend is the same regardless of the direction of the earthquake.
INTERNATIONAL JOURNAL OF CIVIL AND STRUCTURAL ENGINEERING Volume 1, No 3, 2010
© Copyright 2010 All rights reserved Integrated Publishing services Research article ISSN 0976 – 4399
676
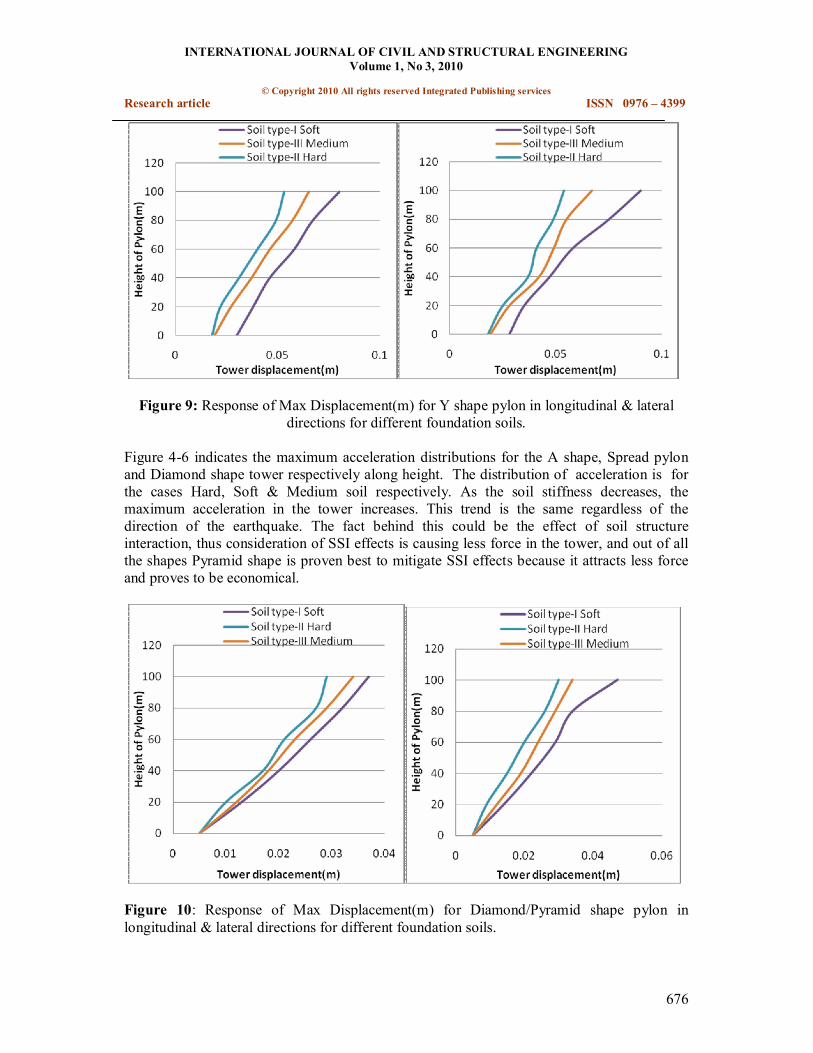
Figure 9: Response of Max Displacement(m) for Y shape pylon in longitudinal & lateral directions for different foundation soils.
Figure 46 indicates the maximum acceleration distributions for the A shape, Spread pylon and Diamond shape tower respectively along height. The distribution of acceleration is for the cases Hard, Soft & Medium soil respectively. As the soil stiffness decreases, the maximum acceleration in the tower increases. This trend is the same regardless of the direction of the earthquake. The fact behind this could be the effect of soil structure interaction, thus consideration of SSI effects is causing less force in the tower, and out of all the shapes Pyramid shape is proven best to mitigate SSI effects because it attracts less force and proves to be economical.
Figure 10: Response of Max Displacement(m) for Diamond/Pyramid shape pylon in longitudinal & lateral directions for different foundation soils.

INTERNATIONAL JOURNAL OF CIVIL AND STRUCTURAL ENGINEERING Volume 1, No 3, 2010
© Copyright 2010 All rights reserved Integrated Publishing services Research article ISSN 0976 – 4399
677
The distributions of maximum displacement (hereafter means the relative displacement referring to pier base) along tower/pier for the cases Hard, Soft & Medium soil respectively are shown in Fig. 710.
It can be seen that decreasing stiffness of soil leads to large displacement. this is observed for almost all shapes of pylons but, The displacement is more pronounced in the case of A shape pylon when earthquake is induced from transverse direction. This effect is minimum in the case of pyramid shape pylon.
Figure 11: Response of Max. Moment (MNm) for H shape pylon in longitudinal & lateral directions for different foundation soils
Figure 12: Response of Max. Moment (MNm) for A shape pylon in longitudinal & lateral directions for different foundation soils

INTERNATIONAL JOURNAL OF CIVIL AND STRUCTURAL ENGINEERING Volume 1, No 3, 2010
© Copyright 2010 All rights reserved Integrated Publishing services Research article ISSN 0976 – 4399
678
The distributions of maximum displacement (hereafter means the relative displacement referring to pier base) along tower/pier for the cases Hard, Soft & Medium soil respectively are shown in Fig. 710.
Figure 13: Response of Max. Moment (MNm) for Y shape pylon in longitudinal & lateral directions for different foundation soils.
Figure 14: Response of Max. Moment (MNm) for Diamond/Pyramid shape pylon in longitudinal & lateral directions for different foundation soils.
It can be seen that decreasing stiffness of soil leads to large displacement. this is observed for almost all shapes of pylons but, The displacement is more pronounced in the case of A shape

INTERNATIONAL JOURNAL OF CIVIL AND STRUCTURAL ENGINEERING Volume 1, No 3, 2010
© Copyright 2010 All rights reserved Integrated Publishing services Research article ISSN 0976 – 4399
679
pylon when earthquake is induced from transverse direction. This effect is minimum in the case of pyramid shape pylon.
Figure 15: Comparison of peak response of Max Acc (m/s 2 ) for different shapes of pylon in longitudinal & lateral directions for different foundation soils.
The Bending moment (hereafter moment) generated in structure members of bridges during earthquakes is of crucial importance in aseismic design. Figure 1114 shows the distributions of maximum moment along tower/pier for the cases Hard, soft and medium soil respectively.
Figure 16: Comparison of peak response of Max. Displacement (m) for different shape pylon in longitudinal & lateral directions for different foundation soils
.

INTERNATIONAL JOURNAL OF CIVIL AND STRUCTURAL ENGINEERING Volume 1, No 3, 2010
© Copyright 2010 All rights reserved Integrated Publishing services Research article ISSN 0976 – 4399
680
Figure 17: Comparison of peak response of Max. Moment (MNm) for different shape pylon in longitudinal & lateral directions for different foundation soils.
Decreasing the stiffness of soil reduces the moment in pier. this trend is amazingly same for all the shapes of pylons and for both directions of earthquake. here also the effect of SSI is predominant for the case of soft soil. from these figures it also clear that effect of pylon shape is also governing the a seismic design of bridge because the pyramid shape pylon gives lowest values of moment whereas the H shape of pylon give it a maximum. The peak values of all the response are plotted in the fig (1517) for the different pylon shapes in one figure only. the figure 15 indicates that acceleration value is highest in the spread pylon shape for longitudinal direction, where as the minimum values are observed for pyramid shape of pylon. but when earthquake direction is changed trend is little different the peak value is observed for the A shape pylon and minimum values is for pyramid shape. Figure 16 indicates the plot of maximum displacement for different pylons. here it is clear that as earthquake direction is changing from longitudinal to transverse the maximum displacement is changing from y shape to A shape, thus displacement and acceleration is inversely proportion is proved here. Figure 17 is the plot of Bending moment along the tower pier, the comparison shows that the moment values are highest for H shape and Spread pylon shape when earthquake is in the longitudinal direction, where as its more in H shape when it’s in lateral direction., the reason behind this could be the geometrical shape inducing higher moment of inertia resisting earthquake forces. But pyramid shape is having less moment in both cases
5. Conclusion
In this study, the cable stayed bridge Quincy bay view bridge, is analyzed for four different shapes of pylons on SAP 2000 software by time history method. The analysis was carried out for three different soil conditions namely, soft, medium and hard soil to study the Soil structure interaction effects and against the fixed base of structurei.e. without SSI case. The response in terms of displacement, ,max acceleration, and moment was plotted. The results showed that,

INTERNATIONAL JOURNAL OF CIVIL AND STRUCTURAL ENGINEERING Volume 1, No 3, 2010
© Copyright 2010 All rights reserved Integrated Publishing services Research article ISSN 0976 – 4399
681
1. There is a great influence of SSI effects in seismic response of bridge and it increases fundamental time period of bridge for all pylons shapes.
2. The displacement and Moment response in the tower is minimized because of soil structure interaction effects.
3. The pylon shape has great influence in mitigation of the SSI effects the result showed that in comparison to rational A or H shape of pylon diamond shape of pylon is giving less response. Hence if it is used practically will be proved economical
These conclusions are based on the analytical study on SAP software thus, experimental verification is required before implementing in practice.
6. References
1. Betti R., AbdelGhaffar M., Niazy A. S., 1993, Kinematic soilstructure interaction for longspan Cablesupported bridges, Earthquake engineering and structural dynamics, Volume 22, Issue 5, pp 415430.
2. Chaudhary A. T. M, 2004 , Influence of pier stiffness degradation on soilstructure Interaction in baseisolated bridges, Journal of bridge engineering, Volume 9, Issue 3, pp 287–296.
3. Clough, R. W. and Penzien J. (1975), Dynamics of structures, McGraw Hill Inc. 56 114.
4. De Barros, F. C. P. and Luco, J. E. ,1990, Discrete models for vertical vibrations of surface and embedded foundations, Earthquake Engineering and Structural Dynamics ,Volume 19, Issue 2, pp 289–303.
5. Desai A. K. & Desai J. A.(2009), “Effects of pylon shapes on dynamic behaviour of cablestayed bridges subjected to seismic loading” , Ph D Thesis, Dept of Applied Mechanics SVNITSurat ,78103.
6. Dicleli M. and Mansour M.Y. , 2003, Seismic Retrofitting Of Highway Bridges In Illinois Using Friction Pendulum Seismic Isolation Bearings And Modeling Procedures, Engineering Structures, Volume 25, Issue 9, pp 1139–1156.
7. Dobry R. and Gazetas G. , 1988, Simple method for dynamic stiffness and damping of floating pile groups, Geotechnique, Volume 38, Issue 24, pp 557–574.
8. Fleming J. F. and Egeseli E. A., 1982, Dynamic behaviour of a cablestayed bridge, Earthquake engineering and structural dynamics, Volume 8, Issue 1 , pp 116.
9. Gazetas G.(2006) “Seismic design of foundations and Soil–structure interaction” 13th wcee keynote address k7, Geneva, Switzerland, 38 September, pp 3657.
10.Gazetas, G. and Dobry R., 1984, Horizontal response of piles in layered soil, Journal of Geotechnical engineering , Volume 110, Issue 1 ,pp 20–40
11.IS 1893(Part1) 2002 “Criteria for Earthquake Resistant Design of Structures” Bureau of Indian Standards 2007.
12.Mylonakis G. and Nikolaou A. 1997, Soil pile bridge seismic interaction: kinematic and Inertial effects. Part I: soft soil, Earthquake engineering and structural dynamics, Volume 26 Issue 1, pp 337359.
INTERNATIONAL JOURNAL OF CIVIL AND STRUCTURAL ENGINEERING Volume 1, No 3, 2010
© Copyright 2010 All rights reserved Integrated Publishing services Research article ISSN 0976 – 4399
682
13.N. M. Newmark, and E Rosenblueth , (1971) Fundamentals of earthquake engineering , PrenticeHall, Newjersy. pp 10321059.
14.Nazmy A. S. and AbdelGhaffar A. M., 1990, nonlinear earthquake response analysis of longspan cablestayed bridges: Applications, Earthquake engineering & structural dynamics, Volume 19 Issue 1, pp 6376.
15.NEHRP2003 “Nehrp Recommended Provisions: For Seismic Regulations, for New Buildings and other Structures” National Institute of Building Sciences.
16.S. R. Kaniraj (1988) ,Design aids in soil mechanics and foundation engineering, Tata McGrawHill : pp 345402.
17.SAP2000. “Structural Analysis Programe” Integrated finite element analysis and design of structures. Computers and Structures Inc. Berkeley, California, 1998.
18.Soneji B.B. and Jangid R.S., 2008, Influence of soil–structure interaction on the response of seismically isolated cablestayed bridge, Soil Dynamics and Earthquake Engineering, Volume 28 Issue 4, pp 245–257.
19.SP Guidelines (1990), “Specification for highway bridges”, Japan Road Association, pp 4752
20.Spyrakos C. C. (1992) “Seismic behavior of bridge piers including Soilstructure interaction” Computers & structures, Volume 43, Issue 2, pp 373384.
21.Tongaonkar N.P., Jangid R.S. (2003) “Seismic response of isolated bridges with soil– structure interaction” Soil dynamics and earthquake engineering, Volume 23, Issue 1, pp 287–302.
22.Ucak A. and Tsopelas P. (2008) “Effect of Soil–Structure Interaction on Seismic Isolated Bridges” Journal of Structural Engineering, Vol. 134(7), pp 1154–1164.
23.Vlassis A.G. and Spyrakos. C.C.,2001, Seismically isolated bridge piers on shallow soil stratum with soil structure interaction, Computers and structures, Volume 79, Issue 1, pp 28472861.
24.Wilson J. C. and Gravelle W. (1991) “Modelling Of A CableStayed Bridge For Dynamic Analysis” Earthquake Engineering And Structural Dynamics, Volume 20, Issue 1, pp 70772.