Embed Size (px)
Citation preview

Page 79
RESEARCH ARTICLE Vol.5.Issue.1.2018 Jan-Mar
INTERNATIONAL JOURNAL OF BUSINESS, MANAGEMENT
AND ALLIED SCIENCES (IJBMAS)
A Peer Reviewed International Research Journal
CHANGING PARADIGMS OF SERVICE SECTOR EMPLOYMENT IN INDIA
Dr.N.R MOHAN PRAKASH1, M.KETHAN2 1Associate Professor & Research Coordinator, GIM, GITAM University, Vishakhapatnam
2Assistant Professor , Sir Vishveshwaraiah Institute of Science & Technology (SVTM), Madanapalli
ABSTRACT
‘Services’ represent a heterogeneous group of activities and has now become a
prominent sector in the economies of most developed and developing countries,
in terms of its contribution to national income, trade flows and foreign direct
investment. The case of India is also not very different, although the recent
euphoria is created by increasing tradability caused by the changing nature of
services, invention of technology, and opportunities opened by General
Agreement on Trade in Services. The service sector in India is characterized by
the asymmetrical relationship between income and employment generation. The
increasing share of services in GDP (54.1%) and stagnant employment generated
(24%) from the sector can have grave implications for the country where
unemployment continues to be a major problem. The reasons for the
asymmetrical relationship in income and employment generation, is embedded
in the pattern of service sector growth experienced in the country.
Objective, Methodology and Data sources
The present study is an attempt to understand the changing structure of service sector
employment in India over the years, at disaggregated level. For the purpose changes in the nature,
pattern and trends in service sector employment will be examined. The industrial classification of
work force will be analysed at single, two and three-digit level, capturing differences in male and
female employment in rural and urban areas. The time frame for the study has been chosen, from
2011-16, taking into account the period, which witnessed service sector growth in India, apart from
the consideration of comparable data sources which includes quinquennial rounds on employment
and unemployment
Section I
Introduction
Service sector once considered to be unproductive in conventional economic theory has now
become a prominent sector in the economies of most developed and developing countries, in terms of
its contribution to national income, trade flows and foreign direct investment. Invention of
technologies and changing nature of services are some factors responsible for this phenomenon. The
case of India is not different from the global picture. The service sector is now considered to be
‘engine of growth’ in the country, with 54.1% contribution to GDP and significant share in other

Dr.N.R MOHAN PRAKASH, M.KETHAN ISSN:2349-4638 Vol.5. Issue.1.2018 (Jan-Mar)
Int.J.Buss.Mang.& Allied.Sci. (ISSN:2349-4638) 80
macro economic variables.1 However, despite the structural change2 experienced in the generation of
income, the employment generated in service sector continues to be low, around 24% In this context
we intend to undertake a detailed study on the structure of service sector employment in India, to
capture changes taking place at the sub sectoral level and to identify possible explanation for such
phenomenon.
The rest of the paper is organised as follows. Section II deal with the conceptualisation of
‘services’ and situates the service sector in economic theory. Section III presents a brief review of the
nature of service sector growth in Indian economy, followed by section IV, which provides an
analysis of trends and patterns of service sector employment. And section V concludes.
Section II
(a) Conceptualisation of ‘Services’
The service sector often used synonymous with tertiary or residual sector, conventionally
represented a heterogeneous group of economic activities that are non storable, non-transferable and
intangible. Though the division of the economy into primary and secondary sectors dates back to the
physiocrats, the tertiary sector did not receive much attention, due to their small share compared to
other sectors and the implied notion that tertiary activities are ‘luxurious’. For the same reason it
received mere passing reference in classical and Marxist writings, where it was considered as
unproductive.
‘Services’ as category, gained significance during the first quarter of the 20th century and their
role in the process of economic development were largely captured by the ‘stage theories of
development’. For the first time in 1939, Fisher classified the economy into primary, secondary and
tertiary sector. Later Kuznets introduced a more neutral term ‘services’ instead of tertiary, there by
bringing the sector into economic discussion (Kuznets, 1972). However there was no consensus, on
what constitutes the service sector not only in the work of different authors3 but also in the work of
the same author.4 Although a service was generally understood as an economic activity other than
which produced goods, there existed non-agreement on the dividing line between goods and services
or what lies in the boundaries of the service sector (Fuchs, 1968; Stigler, 1956). The nature of output,
simultaneity of production and consumption, organization of production and the level of capital
intensity were used to define ‘service’. To Hill, ‘a service may be defined as a change in the condition
of a person, or of a good belonging to some economic unit, which is brought as the result of the
activity of some other economic unit, with the prior agreement of the former person or economic unit’
(Hill 1977: 318). With the increasing role of services, there emerged a series of studies that classified
services according to their nature, stage of consumption, thereby providing a framework to define
what falls in the category of ‘services’.5
For the purpose of the present study, we have included agriculture, livestock, fisheries,
forestry mining and quarrying under primary; manufacturing, construction, electricity, gas and water
supply under secondary and all other economic activities like trade and hotels, transport and
1 Services contribute 30% of the total FDI flow in 2003 and growth of service trade was around 6.5% and share
in total trade 24%. India expanded its market share in world service export from 0.6% to 1.3 percent and
became the 18th
largest service exporter. 2 In the discipline of economics, the term structural change is used to represent variations in the relative size of
primary, secondary and tertiary sectors in terms of its share in output, employment and productivity or in other macro economic variables. In the present study the term denotes changes occurring between or within
sectors. 3 The sub sectors transport, communication and public utilities, has received differential treatment from
scholars, on whether they fall in services or in manufacturing. See Maurice Lengell`e 1966; George J. Stigler
1956; Victor R. Fuchs 1968; B.M Deakin and K.D. George, 1965; J.A Dowie 1966 and Gur Ofer, 1967 for details. 4 For instance, initially Simon Kuznets has included transport, communication and public utilities in ‘service
sector’ but in his later works it was classified under ‘industry’ (Simon Kuznets, 1955, 1972). 5 For instance see Bhagwati (1984), Katouzian (1970), Elfring (1989) and WTO classification.

Dr.N.R MOHAN PRAKASH, M.KETHAN ISSN:2349-4638 Vol.5. Issue.1.2018 (Jan-Mar)
Int.J.Buss.Mang.& Allied.Sci. (ISSN:2349-4638) 81
communications, financial and business services, and community and personal services in service
sector activities.
(b) Situating Services in Economic Theories
Theories dealing with the dynamics of the service sector in the process of economic growth
can be broadly grouped under two heads: that dealing with the growth of service sector in the
developed countries and that explaining service sector growth in the less developed countries. While
‘stage theories of development’ capture the former, an explanation of the experience of service sector
growth in the less developed countries is found in the surplus labour hypothesis and in arguments
put forward by the dependency school.
The stage theories suggest that countries pass through a sequence of phases in the course of
development and an advanced economy is characterized by a larger contribution of services in its
national income and employment. Though ‘stages’ in the growth processes did receive attention by
earlier theorists6, it was Fisher’s study that brought the service sector to central stage (Fisher 1935). It
was pointed out that higher average level of real income per head is always associated with a high
proportion of the working population engaged in tertiary industries and vice versa (Cark, 1940). A
relatively high-income elasticity of demand for services compared to goods and low productivity per
worker in services compared with other sectors, were the reasons identified to explain this
phenomenon. However both the arguments were met with wide criticism. As pointed out by many,
services consist of activities with varying income elasticity of demand (Summers, 1985) and there is
no strong evidence to show that growth in service sector in the advanced countries has been the result
of higher income elasticity of demand for services compared to goods (Stigler, 1956; Fuchs, 1968;
Worton, 1969; Gershuni and Miles, 1983). Studies also point out the variation of the relative
importance of different sub-sectors during different stages of development (Bauer and Yamey, 1951;
Katouzian, 1970; Bhalla, 1971). However the analytical argument of Fisher and Clark was given an
empirical grounding by Kuznets, in a cross-sectional analysis covering 25 countries for more than a
century (Kuznets, 1972). His argument was later strengthened by the findings of Yves Sabolo (1975),
Lyn Squire (1981) and Paul Bariroch (1975). While the study by Fuchs (1968) explained the service
sector growth as due to low productivity, questions were also raised on the underestimation of
services output (Griliches, 1992). The decline in manufacturing and the corresponding shift to services
were widely held to be unsupportable in the long run, since services depend critically on
manufacturing for their existence. However the increasing similarity of services with commodities
and the changing trade regime making services tradable across borders has enabled the service sector
to emerge as the major driving force in economic growth.
In less developed countries, income elasticity of demand for services sector cannot explain
high service growth (Bauer and Yamey, 1951 and Bhalla, 1970). ‘Excess labour supply’, is explanation
provided in the context of less developed countries, where the sub sectors that experience growth are
petty services that require little capital and skill and to which entry is relatively easy (Kuznets, 1959),
limiting the size of employment only to the supply of labour offered at that wage (Udall, 1976).
Another explanation for the service sector growth in less developed countries is the one
provided by the ‘dependency’ school. According to Andre Gunder Frank (1978) and Samir Amin
(1974, 1976), the ‘hypertrophy’ of the service sector in the less developed countries is deeply
embedded in the historical development process of these countries. Distortion towards the service
sector according to Amin, ‘in the conditions governing the integration of pre-capitalist societies into
international capitalist market’ and he notes that the larger is the degree of integration, larger is the
size of the tertiary sector (Amin, 1974, p: 194 and 1976, p: 245-239). According to Amin, Clark’s theory
fails to explain service sector growth in the periphery, where the reasons for the growth lies in
6 Stage theorization can be traced to the writings of Aristotle, William Petty and Adman Smith, which were
later continued by Frederich Lit of German Historical School. For a detailed discussion see Hoselitz 1960; Brenner, 1965; Datta, 1973.
Dr.N.R MOHAN PRAKASH, M.KETHAN ISSN:2349-4638 Vol.5. Issue.1.2018 (Jan-Mar)
Int.J.Buss.Mang.& Allied.Sci. (ISSN:2349-4638) 82
diverting local capital from industry to commerce, which helps export and creates large scale
unemployment.
To arrive at a meaningful explanation for service sector growth there is a need to undertake
an enquiry that is economy specific, as each individual economy has a specific trajectory of
development, which also reflects on sectoral growth pattern. It is in the above theoretical background
we intend to understand the nature and pattern of service sector employment in India.
Section III
Service Sector in Indian Economy
The ‘disproportionality’ of service sector growth in the Indian economy was noted during the
seventies, when its contribution to national income was close to 40%, and employment stagnated
around 20% (Mitra, 1988; Mazumdar, 1995). The services growth in India was attained before the full
development of industry, with the net result that per capita income from this sector exceeded per
capita income of primary and secondary sectors by more than fifty percent, distinct from other
country experiences (Mitra, 1988). Such predominance of services was attributed to the de-
industrialisation process pursued in British India (Bagchi, 1982) and can have serious implications for
inflation, income distribution and balance of payments (Bhattacharya and Mitra, 1990).
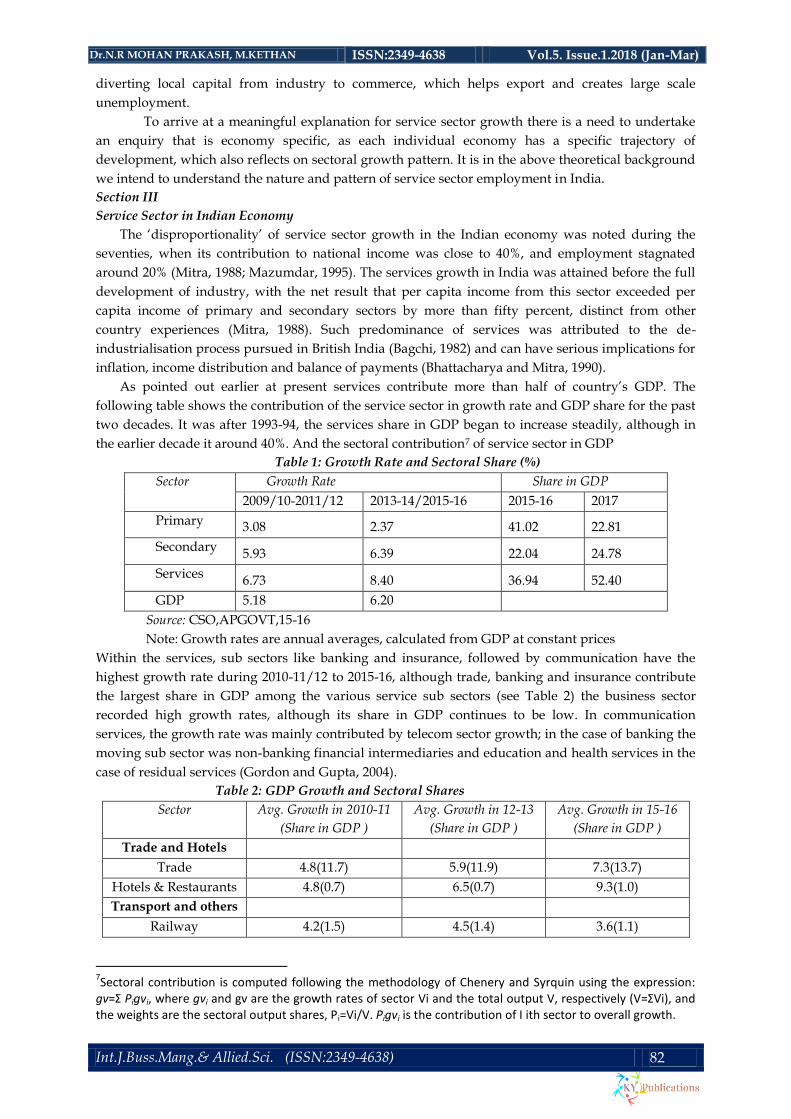
As pointed out earlier at present services contribute more than half of country’s GDP. The
following table shows the contribution of the service sector in growth rate and GDP share for the past
two decades. It was after 1993-94, the services share in GDP began to increase steadily, although in
the earlier decade it around 40%. And the sectoral contribution7 of service sector in GDP
Table 1: Growth Rate and Sectoral Share (%)
Sector Growth Rate Share in GDP
2009/10-2011/12 2013-14/2015-16 2015-16 2017
Primary 3.08 2.37 41.02 22.81
Secondary 5.93 6.39 22.04 24.78
Services 6.73 8.40 36.94 52.40
GDP 5.18 6.20
Source: CSO,APGOVT,15-16
Note: Growth rates are annual averages, calculated from GDP at constant prices
Within the services, sub sectors like banking and insurance, followed by communication have the
highest growth rate during 2010-11/12 to 2015-16, although trade, banking and insurance contribute
the largest share in GDP among the various service sub sectors (see Table 2) the business sector
recorded high growth rates, although its share in GDP continues to be low. In communication
services, the growth rate was mainly contributed by telecom sector growth; in the case of banking the
moving sub sector was non-banking financial intermediaries and education and health services in the
case of residual services (Gordon and Gupta, 2004).
Table 2: GDP Growth and Sectoral Shares
Sector Avg. Growth in 2010-11
(Share in GDP )
Avg. Growth in 12-13
(Share in GDP )
Avg. Growth in 15-16
(Share in GDP )
Trade and Hotels
Trade 4.8(11.7) 5.9(11.9) 7.3(13.7)
Hotels & Restaurants 4.8(0.7) 6.5(0.7) 9.3(1.0)
Transport and others
Railway 4.2(1.5) 4.5(1.4) 3.6(1.1)
7Sectoral contribution is computed following the methodology of Chenery and Syrquin using the expression: gv=Σ Pigvi, where gvi and gv are the growth rates of sector Vi and the total output V, respectively (V=ΣVi), and the weights are the sectoral output shares, Pi=Vi/V. Pigvi is the contribution of I ith sector to overall growth.

Dr.N.R MOHAN PRAKASH, M.KETHAN ISSN:2349-4638 Vol.5. Issue.1.2018 (Jan-Mar)
Int.J.Buss.Mang.& Allied.Sci. (ISSN:2349-4638) 83
Transport by other
means
6.3(3.6) 6.3(3.8) 6.9(4.3)
Storage 5.5(0.1) 2.7(0.1) 2(0.1)
Communication 6.7(1.0) 6.1(1.0) 13.6(2.0)
Finance
Banking 7.2(1.9) 11.9(3.4) 12.7(6.3)
Insurance 7.1(0.5) 10.9(0.8) 6.7(0.7)
Real Estate 2.6(4.0) 7.7(4.8) 5.0(4.5)
Business Services 4.2(0.2) 13.5(0.3) 19.8(1.1)
Legal Services 2.6(0.0) 8.6(0.0) 5.8(0.0)
Residual services
Public
Administration
6.1(5.3) 7.0(6.0) 6.0(6.1)
Personal Service 1.7(1.6) 2.4(1.1) 5.0(1.1)
Community Services 4.8(4.0) 6.5(4.3) 8.4(5.5)
Other Services 3.4(1.1) 5.3(1.0) 7.1(0.7)
Source: computed from National Accounts Statistics
As pointed out earlier, the Indian service sector employs a lower proportion of labour force,
compared with its contribution to national income, and the growth process of service sector is termed
as ‘jobless’, which is reflected in the declining employment elasticity8, which is less than unity in all
cases. The decline in employment elasticity was sharper after the 1990s. Apart from the general fall in
employment elasticity, in activities like banking, where income growth is high, displays declining
employment growth. In banking and finance there has been a fall in the employment elasticity,
probably due to computerization of jobs, despite a tremendous increase in banking activities during
last few years. Often the boom in information technology (IT) is pointed as a visible outcome of
service sector growth. But the truth is that the contribution of IT to the country’s GDP is only around
4.1% and employs less than one million people in the total labour force of 450 million (Dasgupta and
Singh, 2005). Further taking into consideration the level of education accessible to majority of
workforce in India, IT is not a prescription for the unemployment problem in India at least in the near
future. As evident from the below table, employment elasticity turned to be negative in the case of
public administration and other residual services, in the last ten year. Generally we can say that the
disproportional relationship in income and employment in the services have increased during the
post liberalization period.
Table 3: Employment Elasticity to GDP
2010-11 2011-12 2013-14 2015-16 2016-17
Trade 0.71 0.85 1.08 0.97 0.58
Hotels & Restaurants 0.69 0.91 0.49 0.63 0.35
Transport 1.00 0.55 1.08 0.79 0.49
Banking & Finance 1.21 0.55 0.87 0.70 0.45
Public Administration 0.87 0.60 0.95 0.71 -0.08
Residual Services 0.62 0.17 1.86 0.92 -0.26
Source: GDP figures and estimated growth of usual status workers
8Calculated as, the percentage changes in employment divided by the percentage changes in GDP in each
period. Increase in elasticity can occur due acceleration in the growth of productivity per person employed, which is a desirable outcome, especially if it is taking place in sectors where productivity per person employed is very low. Employment elasticity’s may be very low in sectors where there is a great deal of under-employment, which means there is considerable room for output to expand without an expansion in measured employment.
Dr.N.R MOHAN PRAKASH, M.KETHAN ISSN:2349-4638 Vol.5. Issue.1.2018 (Jan-Mar)
Int.J.Buss.Mang.& Allied.Sci. (ISSN:2349-4638) 84
from different NSS rounds
A reason often pointed out for the slow employment growth in Indian service sector is the
high labour productivity and the income growth happening in certain sub sectors that uses skilled
labour (Gordon and Gupta, 2004). This is in sharp contrast with other country experiences, where
high growth rate of employment in services is explained with low productivity in services. However
demand push factors only partly explain the service sector growth in India (Handsa, 2002). Factors
like unprecedented increase in government activities9, demonstration effect creating demand pattern
similar to those of high income countries (Panchamukhi et al., 1986), outsourcing of certain
manufacturing activities to service sector (Bhattacharya and Mitra, 1989), urbanization and trade
facilitated by new technology (Mitra, 1992; Gordon and Gupta, 2004) act as pull factors for the growth
of service sector.
The extent of disproportionality between output and employment in service sector also
differs between organised and unorganised activities. While in the organised service sector, income
grew more than employment; the relationship is reverse in the unorganised sector (Bhattacharya and
Mitra, 1989). This happens in less developed countries where service sector grow not because of high-
income demand, but due to unemployment (Ghosh, 1991). As every supply of labour creates its own
employment in services, by sharing out a given amount of work (Bhalla, 1970) and such a process
cannot be considered as a sign of economic development (Rao, 1954). The little increase in service
sector employment is often as a result of the proliferation of low paid jobs, especially in the large
private unorganised sector within services (Chandrasekhar and Ghosh, 1999; Joshi, 2004). Even in the
case of organised services employment opportunities is decreasing in those sectors where income
growth is high, as in the case of finance, which is a matter of concern (see Table 4).
Table 4: Share of Services in Organized Employment (%)
Sectors 2014-15 2016-17
Wholesale & Retail Trade 1.62 1.31
Transport, Storage Communications 30.11 21.44
Financial Services 43.36 32.67
Community, Personal & Social
Services
34.02 34.61
Source: Planning Commission, 2001
The nature of employment10 in services varies from high percentage of self-employed in trade
and hotels to large share of casual workers in residual category. Also public administration within the
residual services provides significant amount of regular employment (see Table 5). Our preliminary
enquiry with respect to age composition shows that, in trade and hotels and residual services, there is
a large percentage of child labour, and persons above 60+ years indicating the informal nature as well
as the low quality of service sector jobs (see Table 6).
Table 5: Nature of Employment in Services, (%) CHANGE
Self Regular Casual
Rural
Trade & Hotels 68.0 9.0 20.0
Transport 12.8 13.6 27.2
Finance 2.2 4.3 2.1
9 However Dutta’s (1989) work on the tertiary sector over the period 1950-51 to 1983-84 shows that there is
no significant difference between the rate of growth of net material product and net domestic product. While R. Nagaraj (2000) has argued that growth of service sector is not statistically significant for the 1990s. 10
The nature of employment can be self-employed, regular or causal. Self-employed worker are those who work on their own farm or non-farm based enterprise or those how are engaged independently in a profession or trade on own account with one or more partners. It can be either as own account worker, employers or helpers. Regular workers are paid regular wages or salaries, while in the case of causal worker employment and payment are not regular.

Dr.N.R MOHAN PRAKASH, M.KETHAN ISSN:2349-4638 Vol.5. Issue.1.2018 (Jan-Mar)
Int.J.Buss.Mang.& Allied.Sci. (ISSN:2349-4638) 85
Residual Services 17.0 73.0 50.6
Urban
Trade & Hotels 73.6 20.8 42.7
Transport 10.6 13.5 23.6
Finance 5.3 8.2 2.2
Residual Services 10.5 57.5 31.4
Source: NSS 55th round, calculated from unit level data
Table 6: Age wise Distribution of Service Workers, (Main, %)
Industrial category Age group
5-14 y 15-59 y 60+y
Trade & Hotels P 14 19.9 24.6
M 19.3 22.4 26.7
F 3.7 8.1 14.5
Transport P 2.3 8.9 4.6
M 3.2 10.4 5.3
F 0.5 1.5 0.9
Finance P 1.4 4.3 3.7
M 1.5 4.5 3.9
F 1.2 3.1 2.3
Other Services
P 11.2 21.7 18.3
M 9.1 19.6 17.1
F 15.3 31.9 24.5
Source: Census, 2001
From the discussion above we come to the conclusion that India’s service sector displays dualism in
income and employment generation. However to locate the reasons for the lack of employment
generation in service sector it is essential to understand the trends and pattern of service sector
employment and changes over the years at the disaggregate level
Conclusion
In the present paper we have attempted to capture changing structure of the service sector
employment in India, over the past three decades. Though at the macro level not much change has
occurred there are many changes concealed at the employment at sub sector level. At the one digit
level within the service sector a structural change occurred especially with respect to male
employment-a shift from residual services to trade and hotels. Within trade and hotels there is a slow
shift of trade from food articles to non-food articles. Finance and transport are the other two sectors
that improved their position. Though the sectoral share of finance and transport sector is
comparatively less, employment opportunities for skilled labour are increasing in sub sectors like,
communication and software consultancy. In the finance sector there is a decrease in the aggregate
employment opportunities, due to computerisation and increased role of private banks in financial
transactions. In the case of females, though no such changes are evident, share of sectors other than
‘residual services’ have been improving its position. From a growth process initiated from excess
labour supply and increased government intervention, the services in India are slowly undergoing a
structural change. Not only is the employment generation in the service sector remain low; the new
opportunities are created for labour with certain ‘skills’. This will have serious implication on income
inequality. Further, with the increasing role played by the private sector, nature of employment will
also change.
References
[1]. Amin, Samir (1974) Accumulation on World Scale, A Critique of the Theory of Underdevelopment,
Vol. 1 Monthly Review Press, New York and London.
[2]. Amin, Samir (1976) Unequal Development, An Essay on the Social Formations of Peripheral
Capitalism (Translated by Brian Pearce), The Harvester Press Sussex.

Dr.N.R MOHAN PRAKASH, M.KETHAN ISSN:2349-4638 Vol.5. Issue.1.2018 (Jan-Mar)
Int.J.Buss.Mang.& Allied.Sci. (ISSN:2349-4638) 86
[3]. Bagchi, A. K. (1982) The Political Economy of Underdevelopment, Cambridge.
[4]. Bairoch, Paul (1975) The Economic Development of the Third World Since 1900, translated by
Cynthia Postan, Metheum & Co. London.
[5]. Bauer, P.T and B.S. Yamey (1951) ‘Economic Progress and Occupational Distribution’, The
Economic Journal, Vol. LXI, December, pp: 741-55.
[6]. Bhagwati, Jagdish, N (1984) ‘Splintering and Disembodiment of Services and Developing
Nations’, World Economy, 7(2), June, pp: 133-43.
[7]. Bhalla A.S. (1970) ‘The Role of services in Employment Expansion’, International Labour
Review, Vol.101, pp: 519-40.
[8]. Bhattacharya, B. B. and Arup Mitra (1989) ‘Industry-Agriculture Growth Rates: Widening
Disparity: An Explanation’, Economic and Political Weekly, Vol.XXIV (34), Aug 26pp: 1963-89.
[9]. Bhattacharya, B. B. and Arup Mitra (1990) ‘Excess Growth of Tertiary Sector in Indian
Economy: Issues and Implications’, Economic and Political Weekly, November 3, pp: 2445-50.
[10]. Brenner, Y.S (1965) Theories of Economic Development and Growth, George Allen and Unwin
Ltd, London.
[11]. Central Statistical Organisation (2005) National Accounts Statistics 2005, Government of India.


![[XLS] · Web view79 0 79 79000 79 79332 79 79085 79 79005 79 10051 79 79328 79 79148 79 10061 79 79476 79 79971 79 79045 79 79772 79 79301 79 79333 79 79154 79 10018 79 79101 79 79335](https://img.dokumen.tips/doc/110x75/5adf13517f8b9a6e5c8bad58/xls-view79-0-79-79000-79-79332-79-79085-79-79005-79-10051-79-79328-79-79148-79.jpg)
![Title 79 RCW - Washingtonleg.wa.gov/CodeReviser/RCWArchive/Documents/2016... · (2016 Ed.) [Title 79 RCW—page 1] Title 79 Title 79 79 PUBLIC LANDS ... Ejectment, quiet title: Chapter](https://img.dokumen.tips/doc/110x75/5b5a3e6e7f8b9aa30c8bb351/title-79-rcw-2016-ed-title-79-rcwpage-1-title-79-title-79-79-public.jpg)


