Embed Size (px)
Citation preview

Simulation of a PVC window frame production line: The case of Synco S.A
Author: Gorgoris Stylianos
Supervisor: Prof. Papadopoulos Chrysoleon
MSc in Management Intake October 2011 School of Economics and Business Administration International Hellenic University
Thessaloniki, 2012

Page | 2
ABSTRACT
Industries related to sustainability and energy efficiency remain largely unaffected by
the economic recession. As such, the PVC window frame industry is a growing sector in
Greece. As in most production lines, these too can be scientifically analyzed in order to
identify weak spots and test alternative scenarios. One of the most advanced research
method to that end is computer based simulation. The present study developed a
simulation model of the main production line of the industry’s leader – Synco S.A,
which was chosen as the most representative example of a PVC window frame
production line in Greece. The main contribution of this thesis was threefold: the
accurate representation and investigation of the production line’s current situation, the
provision of answer to questions imposed by management regarding “what if”
scenarios and the proposition of an alternative production line arrangement in order to
increase production efficiency and reduce operating costs. As the main conclusion of
this study, all managerial scenarios were rejected and a rearrangement of the
workforce that would result in a 43,65% increase of the production capacity was
proposed. It is thereby evident that computer simulation can significantly benefit a
production line’s operations and the present model can be applied on production lines
across the PVC window frame and related industries.
ACKNOWLEDGMENTS
I would like to thank Prof. Papadopoulos Chrysoleon for introducing me to this new
scientific field and for the excellent collaboration that we had throughout the
conduction of this thesis. His guidance and support was invaluable and vital for the
completion of this research. Furthermore, I would like to thank both the management
team and the owners of Synco S.A for giving me the opportunity to carry out this thesis
on their premises. Their constant availability and willingness to provide important
inside data greatly assisted the accuracy and timely completion of this work. Finally, I
would like to thank my fiancée Emma for her assistance in the editing process, as well
as my parents and Denise for their full and unconditional support.

Page | 3
Table of Contents
Abstract………………………………………………………………………………………………………………………...2
Acknowledgments………………………………………………………………………………………………….........2
Chapter 1: INTRODUCTION
1.1 Motivation………………………………………………………………………..…………………………….10
1.2 Aims and objectives of the study …………………………………………………………………….14
1.3 Structure of the project………………………………………….……………………………………….15
Chapter 2: LITERATURE REVIEW
2.1 Definition of computer based simulation……………………………………………………..….17
2.2 Purposes of simulation…………………………………………………………………………..……..…17
2.3 Advantages and disadvantages of computer simulation……………………………….…18
2.4 Considerations……………………………………………………………………………………….………..19
2.5 Applications of computer based simulation……………………………………………………..19
Chapter 3: OVERVIEW OF SYNCO S.A
3.1 The company’s history……………………………………………………………………………………...21
3.2 Synco’s products…………………………………………………………………………………………….…22
3.3 Points of sale and operating procedure……………………………………………………….…….23
3.4 The impact of the economic crisis………………………………………………………………………24
Chapter 4: METHODOLOGY
4.1 Criteria of choice for computer simulation…………………………………………………………26
4.2 Simul8 software package………………………………………………………………………………….30
Chapter 5: THE SIMULATION MODEL
5.1 Introduction………………………………………………………………………………………………………36
5.2 Model development………………………………………………………………………………………….41
5.3 Model verification……………………………………………………………………………………….……58
5.4 Results of the baseline model……………………………………………………………………………58

Page | 4
Chapter 6: ALTERNATIVE SCENARIOS ANALYSIS AND RESULTS
6.1 “What if” scenarios…………………………………………………………………………………………..66
6.2 Solution for maximum utilization of the production line………………………………….76
Chapter 7: DISCUSSION
7.1 Summary and conclusions……………………………………………………………………………….94
7.2 Limitations of the study……………………………………………………………………………………95
7.3 Future work………………………………………………………………………………………………………95
BIBLIOGRAPHY…………………………………………………………………………………………………………………..97
APPENDIX: RAW DATA RECORDS……………………………………………………………………………………..99
Page | 5
LIST OF FIGURES
Chapter 1
Figure 1.0: Schematic representation of the content of Chapter 1……………………………………..10
Figure 1.1: Heat transferring mediums……………………………………………………………………………….11
Figure 1.2: Thermal picture of a house ……………………………………………………………………………….12
Figure 1.3: Benefits from the replacement of wooden frames……………………………………………13
Figure 1.4: Benefits from the replacement of aluminum frames………………………………….......13
Chapter 2
Figure 2.0: Schematic representation of the content of Chapter 2……………………………..........16
Chapter 3
Figure 3.0: Schematic representation of the content of Chapter 3……………………………..........21
Figure 3.1: Synco’s production plant…………………………………………………………………………………..22
Figure 3.2: Synco’s network of dealers……………………………………………………………………………….24
Chapter 4
Figure 4.0: Schematic representation of the content of Chapter 4…………………………………….25
Chapter 5
Figure 5.0: Schematic representation of the content of Chapter 5…………………………………….35
Figure 5.1: Section view of a window frame……………………………………………………………………….37
Figure 5.2: Trolley cart for the transportation of frames prior to gluing…………………..…………39
Figure 5.3: Trolley cart for the transportation of glued frames………………………..…………………40
Figure 5.4: Storage room for PVC rods……………………………………………………………….……………….42
Figure 5.5: Simulation model of the system’s entry…………………………………………..……..………42
Figure 5.6: The production line’s first work position……………………………………………………..…….44
Figure 5.7: Simulation model of the first work position……………………………………………….………45
Figure 5.8: Simulation of the trolley cart function………………………………………………………………45
Figure 5.9: The production line’s second work position (Part A)………………………….……………..46
Figure 5.10: The production line’s second work position (Part B)……………………………………….47

Page | 6
Figure 5.11: Simulation model of the second work position……………………………………………….48
Figure 5.12: The production line’s third position (Part A)……………………………………………………49
Figure 5.13: The Production line’s third position (Part B)……………………………………………………49
Figure 5.14: Simulation model of the third work position……………………………………………………51
Figure 5.15: The production line’s forth working position……………………………………………………52
Figure 5.16: Simulation model of the forth work position……………………………………………………53
Figure 5.17: The production line’s fifth working position…………………………………………………….54
Figure 5.18: Simulation model of the fifth work position……………………………………………………..56
Figure 5.19: The production line’s sixth working position…………………………………………………….57
Figure 5.20: Simulation model of the sixth work position…………………………………………………….58
Figure 5.21 The entire simulation of the baseline model……………………………………………………..65
Chapter 6
Figure 6.0: Schematic representation of the content of Chapter 6………………………………………66
Figure 6.1 The entire simulation model of the proposed production line arrangement……...92
Chapter 7
Figure 7.0: Schematic representation of the content of Chapter 7………………………………………93

Page | 7
LIST OF TABLES
Chapter 1
Table 1.1: Attributes of different window frame types……………………………………………………….12
Table 1.2: Table of PVC window frames production lines……………………………………………………14
Chapter 3
Table 3.1: Synco’s product offerings…………………………………………………………………………………….23
Chapter 4
Table 4.1: Discrete event simulation software packages……………………………………………………..27
Table 4.2: Continuous simulation software packages………………………………………………………….28
Chapter 5
Table 5.1: Dimension limits for size characterization……………………………………………………………37
Table 5.2: Number of experiments and probabilities for the labels: size, doors and color……43
Table 5.3: Characteristics of “Iron width” and “Iron height” distributions…………………………..48
Table 5.4: The main characteristics of size dependent “Rubber frame” distributions…………52
Table 5.5: The main characteristics of size dependent “Rubber door” distributions……………53
Table 5.6: The main characteristics of size dependent “Mechanism” distributions…………….55
Table 5.7: The main characteristics of distributions comprising work position 6…………………58
Table 5.8: Work centers and queues used for the extraction of results………………………………60
Table 5.9: Results table of the baseline model…………………………………………………………………….60
Table 5.10: Average queue sizes………………………………………………………………………………………….63
Table 5.11: Utilization rate of the selected queues and work centers…………………………………53
Chapter 6
Table 6.1: Comparison between the baseline model and scenarios A.1 and A.2………………….67
Table 6.2: Comparison between the baseline model and scenario B……………………………………70
Table 6.3: Comparison between the baseline model and scenario C……………………………………73
Table 6.4: Results of the baseline model compared to scenario D…..………………………………..…77
Table 6.5: Results of the baseline model compared to Scenario E……….………………………………80

Page | 8
Table 6.6: Results of the baseline model compared to Scenario F………………………………………..82
Table 6.7: Results of the baseline model compared to Scenario G..….………………………………….85
Table 6.8: Results of the baseline model compared to Scenario H….……………………………………88
Appendix
Table A.1: The last 1000 orders used for statistical analysis…………………..…………………………..99
Table A.2: Time measurements for loading profile………………………………….………………………..109
Table A.3: Time measurements for cutting machine……………………………………...…………………109
Table A.4: Time measurements drilling…………………………………………………………..…………………109
Table A.5 Time measurements for pneumatic screwing machine width (small)..……………..110
Table A.6 Time measurements for pneumatic screwing machine width (medium)…………..110
Table A.7 Time measurements for pneumatic screwing machine width (large)………………..110
Table A.8 Time measurements for pneumatic screwing machine height (small)……….……...110
Table A.9 Time measurements for pneumatic screwing machine height (medium)……..…..110
Table A.10 Time measurements for pneumatic screwing machine height (large)……………..111
Table A.11 Time measurements for loading after glue………………………………………………........111
Table A.12 Time measurements for trimming machine……………………………………………………..111
Table A.13 Time measurements for heating gun trimming………………………………………………111
Table A.14 Time measurements for rubber placement on frames (small)…………………………111
Table A.15 Time measurements for rubber placement on frames (medium)…..................112
Table A.16 Time measurements for rubber placement on frames (large)…........................112
Table A.17 Time measurements for rubber placement on doors (small)…..........................112
Table A.18 Time measurements for rubber placement on doors (medium)…......................112
Table A.19 Time measurements for rubber placement on doors (large)……........................112
Table A.20 Time measurements for mechanism placement (small)……..............................113
Table A.21 Time measurements for mechanism placement (medium)…............................113
Table A.22 Time measurements for mechanism placement (large)……..............................113
Table A.23 Time measurements for the placement of Kenfer ….........................................113

Page | 9
Table A.24 Time measurements for loading and cleaning (small)…...................................113
Table A.25 Time measurements for loading and cleaning (medium)…...............................114
Table A.26 Time measurements for loading and cleaning (large)…....................................114
Table A.27 Time measurements for spacer placement (small)…........................................114
Table A.28 Time measurements for spacer placement (medium)…....................................114
Table A.29 Time measurements for spacer placement (large)….........................................114
Table A.30 Time measurements for glass placement (small)…............................................115
Table A.31 Time measurements for glass placement (medium)……...................................115
Table A.32 Time measurements for glass placement (large)…...........................................115
Table A.33 Time measurements for tiles and silicone placement (small)…........................115
Table A.34 Time measurements for tiles and silicone placement (medium)….....................115
Table A.35 Time measurements for tiles and silicone placement (large)……........................116
Table A.36 Time measurements for battens placement (small)…….....................................116
Table A.37 Time measurements for battens placement (medium)……................................116
Table A.38 Time measurements for battens placement (large)…..........................................116
Table A.39 Time measurements for transportation (small)…….............................................116
Table A.40 Time measurements for transportation (medium)…….........................................117
Table A.41 Time measurements for transportation (large)……..............................................117
Page | 10
Chapter 1
INTRODUCTION
This chapter aims to provide the reasoning behind the conduction of this study, while
also explaining the desired outcomes. It then proceeds to a brief description of the
dissertation’s structure.
More particularly, Subchapter 1.1 (Motivation) explains the importance of heat
insulation as regards a building’s energy efficiency and the contribution of PVC window
frames in this field. It then proceeds to description of this industry in Greece. The next
Subchapter (Aims and objectives) presents the various uses of a simulation model and
points out the usefulness of such an instrument in the PVC window frame industry.
Finally, Subchapter 1.3 (Structure of the project) provides an overview of the Chapters
to follow. The following figure (Figure 1.0) provides an overview of this Chapter’s
contents.
Figure 1.0 Schematic representation of the content of Chapter 1.
1.1 Motivation
Sustainability has become a matter of major importance, as the planet’s energy sources
are rapidly diminishing. During the last decade, the need for energy efficient products

Page | 11
has become imperative. Furthermore the energy efficient movement has deeply
impacted the modern lifestyle, reforming consumer behavior patterns.
A major component of a household’s energy consumption is heating and cooling
activities. Regardless of the energy source, dozens of CO2 kgs are emitted annually
during this process, while the cost of those activities constitutes a significant part of
any household’s budget. In an effort to minimize energy demands, construction and
renovation companies focus on house insulation by using energy efficient materials.
The main purpose of the insulation is to avert the heat from entering the house during
the summer period, while at the same time not allowing it to escape from the building
in the winter. The following graph (Figure 1.1) depicts the main mediums that facilitate
heat transfer inside a house.
Figure 1.1 Heat transferring mediums
As demonstrated above, windows are the main source of heat transfer. Although
window frames technology has evolved to a great extend during the last decades,
windows still remain the weak link in the house’s heat insulation. This can easily be
established through a thermal image of a house, where the two upper left windows
have been replaced by PVC frames, while the rest remain with traditional older
technology (Figure 1.2).

Page | 12
Figure 1.2 Thermal picture of a house
Window frames are constructed using three different raw materials: wood, aluminum
and PVC (synthetic). Despite the fact that each one has different attributes, all frame
types utilize double glazed glass. This feature consists of two panels of glass with an air
filled space between them aimed to reduce heat transfer. The effectiveness of heat
insulation is measured using the thermal conductance measure (W/m2k), with higher
values indicating lower insulation capabilities. The following table lists the basic
attributes and thermal conductance of each window type (Table 1.1).
Table 1.1 Attributes of different window frame types
Window frame material Attributes Thermal conduct
(W/m2k)
Wood - Requires frequent maintenance - Thicker, thus reducing natural light - Poor insulation
5
Aluminum - Strong, light, maintenance free - Conducts heat rapidly - Need for further insulation
3,5
PVC - Versatile - High insulating value - Do not need painting
1,2
The superiority of PVC window frames is also depicted by consumers’ preference,
especially in northern areas both globally and nationally, where they dominate the

Page | 13
market due to the cold climate. The following two figures (Figures 1.2 and 1.3)
demonstrate the benefits, both in terms of money and CO2 emissions, gained from the
replacement of wood and aluminum frames with PVC frames. All measures are based
on a typical Greek household, which has 15m2 of total window surface and is heated by
heating oil.
Figure 1.3 Benefits from the replacement of wooden frames (Source:
www.koemmerling.de)
Figure 1.4 Benefits from the replacement of aluminum frames (Source:
www.koemmerling.de)

Page | 14
Due to the increased national demand, six production lines were constructed with four
of them located in Northern Greece. In a largely service based country, PVC window
frames is one of the leading industries nationally. The following table (Table 1.2) briefly
presents the remaining five PVC window frame production lines, besides SYNCO S.A
which will be analyzed in Chapter 3.
Table 1.2 Table of PVC window frames production lines
Company name Company logo Site Location Kaptain
www.kaptain.gr Chalkida
DESYN
www.desyn.gr Athens
Thermoplastiki
www.thermoplasitki.gr Kavala
ALMA
www.almadoors.gr Thessaloniki
TEDESCO
www.tedesco.gr Veroia
1.2 Aims and objectives of the study
The aim of this study was to accurately model the main production line of Synco S.A.
The modeling process was conducted through interviews, extensive observation and
statistical analysis, in an effort to evaluate the current situation. With the help of a
software package several performance measures were analyzed, such as efficiency,
utilization rates, queuing times and queue sizes. By utilizing the constructed model
some “what if” scenarios imposed by management were answered. Finally,
experimentation on the basis of the company’s current status led to an optimal
solution, which was sought on a minimum cost basis in order to make full use of the
production lines capabilities and increase production efficiency.
As all PVC window frame production lines run under the same operating principles, the
impact of the present study could be considered as significant. The development of a
Page | 15
generic simulation model could benefit all production lines operating in the same or
even similar (such as aluminum window frames) market, making the contribution of
this thesis – summarized in Chapters 5 and 6 – even greater. The choice of the industry
leader as the study’s research setting magnifies the impact of the study, as the model’s
suggested improvements are on the basis of an already efficient and profitable
production line. Due to the high customization of the product, PVC window frame
constructing companies do not have the advantage of pre-producing at any stage. It is
therefore of great importance that their production line is efficient and agile, in order
to have the desired delivering times and profits. This study aims to provide a versatile
tool that could be used for the efficient rearrangement of the production line, the
response to demand fluctuations, the daily planning activities or even for managerial
and investment decisions.
1.3 Structure of the project
This study will be divided into seven Chapters. The following Chapter reviews the
literature of studies regarding possible uses of simulation techniques in various fields of
the manufacturing industry. Chapter 3 briefly describes the history and operations of
Synco S.A, while Chapter 4 introduces the simulation software methodology and
reviews a series of software packages, which are evaluated using the most important
criteria. Chapter 5 presents the system to be analyzed and the model developed for
each particular process, followed by an analysis of the results. Chapter 6 answers a
series of “what – if” scenarios imposed by the company’s management, while at the
same time seeking an optimal solution for the production line arrangement. Finally,
Chapter 7 concludes the study by reporting the limitations faced and presenting
possible future work.

Page | 16
Chapter 2
LITERATURE REVIEW
This Chapter aims to review the concept of simulation, presenting definitions deriving
from a wide spectrum of scientific background, while at the same time examining the
various settings of its implementation. The method’s advantages and disadvantages
will also be discussed, in order to point out several issues to be considered upon
selecting such an approach.
More specifically, Subchapter 2.1 (Definition of computer based simulation) provides
the various definitions of computer based simulation as they evolved through the
years, whereas Subchapter 2.2 (Purposes of simulation) presents the various factors
that might necessitate the use of this method. Subchapter 2.3 (Advantages and
disadvantages of computer simulation) provides a brief description of the benefits and
drawbacks deriving from the use of this instrument, while at the same time in
Subchapter 2.4 (Considerations) emphasizing certain aspects that should be taken into
consideration when implementing this method. At the end of this Chapter (Subchapter
2.5: Applications of computer based simulation) a few representative examples of
computer simulation applications are presented. The following figure (Figure 2.0)
provides an overview of this Chapter’s contents.
Figure 2.0 Schematic representation of the content of Chapter 2

Page | 17
2.1 Definition of computer based simulation
The term “simulation” has been widely studied across the academic community. There
have been various attempts to provide a definition that best describes this technique.
One of the earliest attempts to describe simulation was made by Harling (1958), who
reported that it is the technique of setting up a stochastic model of a real situation and
then performing experiments upon the model. Centeno (1996) describes computer
simulation as an experimental technique developed to study the behavior of a system,
in order to produce hypotheses or theories that aid its description. These are later on
used to forecast future actions or measure the impact of changes imposed to the
system’s operational inputs. Robinson (2003) reported that a definition of simulation
necessitates the inclusion of four basic elements: operations systems, purpose,
simplification and experimentation. Therefore, according to him simulation should be
defined as “Experimentation with a simplified imitation (on a computer) of an
operations system as it progresses through time, for the purpose of better
understanding and/or improving that system” (p. 4). A more simplified definition is
provided by Chung (2004) where simulation is described as “the process of creating
and experimenting with a computerized mathematical model of a physical system” (p.
16).
2.2 Purposes of simulation
A variety of reasons can necessitate the use of simulation. These can fall into four main
categories (Pedgen et al., 1995). First of all, the complexity of a system might not allow
the comprehension of its operation, thus the use of simulation can provide useful
insight and valuable information. This has also been confirmed by Benedettini &
Tjahjono (2009), who demonstrated the usefulness of computer simulation in complex
manufacturing systems. It has also been reported that the process of building a model
can by itself offer valuable information about the system’s operation (Shannon, 1975).
Even when the operation of a system is fully comprehended, a simulation model is vital
for the system’s improvement as it helps shape operating and resource policies. One of
the basic examples that require the use of simulation is the testing of new concepts,
allowing for trials without the cost of implementation. Finally, simulation is the only

Page | 18
available tool to experiment with systems that cannot be disturbed, either because
they are too sensitive or because their settings are too critical to tamper with.
2.3 Advantages and disadvantages of computer simulation
Computer simulation modeling is considered a highly flexible technique that is
extensively used in a variety of settings (Jeffrey and Seaton, 1995; Fildes and Ranyard,
1997; Clark, 1999). The main source of its popularity derives from the method’s
multiple advantages. Time manipulation is one of the main advantages that users
enjoy. As the simulated model is run on a computer, the experimentation period can be
compressed to the match the requirements of the user (Maria, 1997). Computer
simulation has also reduced analytic requirements to a minimum, enabling users with
limited or no knowledge on analytically demanding tools to simulate complex systems
(Chung, 2004). Computer simulation is also superior to other modeling approaches as
regards modeling variability (Robinson and Higton, 1995), often being the only method
that can accurately model a system. Simulation also offers transparency and improved
visualization of a model. It has been documented that managers are more likely to
understand and believe the results produced by a simulation model, rather than those
deriving from mathematical equations (Robinson, 2003). Due to this fact simulation
software packages nowadays offer advanced animation capabilities as a visual aid
towards the comprehension of the model. Another managerial benefit deriving from
the use of computer simulation is that it can provide a way of achieving consensus of
opinion between opposing parties that have divergent points of view.
However, there are some disadvantages related to this method. First of all it is highly
dependent on input data, the quality of which highly influences the quality of the
produced model (Robinson, 2003). The amount of data needed in order to build a
model through computer simulation can also present a problem, as their gathering can
be particularly time consuming (Chung, 2004). The cost associated with this method
can also be significant, not only due to expensive simulation software but also because
of the expertise required for their handling (Chung, 2004). As some simulation
packages may require specially trained personnel, the hiring of consultants might
impose a significant increase in the implementation cost.

Page | 19
2.4 Considerations
A number of issues must be taken into consideration when deciding to implement a
computer simulation model. Despite the user friendly environments of various
software packages, the modeling and analysis process can be extremely complex in
some cases, requiring increased level of skills and knowledge. Cost should also be
considered, as it can reach considerable amounts at specific occasions. The magnitude
of the investment should not exceed the profit to be gained by the implementation of
this method. Another fairly common pitfall is the assumption that a computer
simulation is always the correct representation of the model, which can adversely
impact the validity of the conclusions drawn from the model. As the construction of a
model frequently requires simplifications and assumptions, the evaluation of the
provided results should be made with great caution (Chung, 2004). Lastly, despite the
advanced result presentation capabilities of the software packages, simulation results
essentially remain a form of summary statistics. As such, a degree of knowledge on
statistics is considered a prerequisite for the correct interpretation and utilization of
the presented results.
2.5 Applications of computer based simulation
As literature on the applications of computer simulation is vast, a few sample
applications are provided.
Mazziotti and Horne (1997) indicated the usefulness of simulation in the development
of a simulation based scheduling tool used in the textile and apparel industry.
Melton et al. (2001) utilized the Arena simulation software in an effort to simulate
capacity planning in a furniture plant.
A simulation model was also used to examine the bottleneck effect in a semiconductor
fabrication facility (Rose, 1998).
The usefulness of discrete event simulation in the analysis and improvement of an
electronics assembly operation was proven through the study of Springfield at al.
(1999).

Page | 20
Estramadoyro et al. (1997) also utilized computer simulation in an effort to study the
memory chip line in an electronics manufacturing facility.
Discrete event simulation was also used in the analysis of the production system at an
automotive supply company, aiming to address issues related to pallet optimization
and throughput estimation (Williams and Gevaert, 1997).
Computer based simulation can also aid managerial decisions, as demonstrated by the
work of Harmonosky et al. (1999).
Finally, Law and McComas (1998) extensively discuss the use of simulation in designing
and improving manufacturing systems, thus justifying the choice of this method for the
analysis of a PVC production line. The reader may find more applications on computer
based simulation on international literature.

Page | 21
Chapter 3
OVERVIEW OF SYNCO S.A
This Chapter aims to provide a brief description of the research setting chosen for this
study, Synco S.A.
More particularly, Subchapter 3.1 (The company’s history) aims to outline the historic
background of the company, while Subchapter 3.2 (Synco’s products) provides a short
description of all the products that the firm produces. Subchapter 3.3 (Points of sale
and operating procedure) aims to inform the reader about the procedures involved in
ordering and installing of the items, while the last Subchapter 3.4 (The impact of the
economic crisis) attempts to provide an insight to the company’s current situation as
regards the current economic recession. The following figure (Figure 3.0) provides an
overview of this Chapter’s contents.
Figure 3.0 Schematic representation of the content of Chapter 3
3.1 The company’s history
Synco S.A (Figure 3.1) was founded in 1984 by George Halkidis, an active and visionary
immigrant from Germany. George passed most of his adult life working in various
German production plants – mostly in the automotive field, where he gained the

Page | 22
necessary experience to create his own production line. As PVC window frames were
not available in Greece at the time, George’s entrepreneurial skills assisted him in
spotting the gap in the market and ceasing the opportunity to become a national
pioneer in the field. After raising the necessary capital, Thessaloniki’s 7.000 m2 plant
was constructed, starting its operations in May 1984. The company is currently run by
George’s son, Charalampos Halkidis, and a partner owning 30% of the company,
Grigoris Tekos.
Figure 3.1 Synco’s production plant
The firm currently has a workforce of 54 employees, 31 of them dedicated to the main
production line, while the remaining personnel is assigned to various administrative
positions. Synco also has a fleet of 8 trucks dedicated to the transportation of finished
products throughout Greece. The factory operates 2 days weekly during the winter,
while operating hours from May to September – when demand levels usually increase
– are doubled reaching a total of 16 days per month (3 days/week). The production
line runs on a typical eight-hour shift, starting from 7 a.m. until 3 p.m., with occasional
overtime when needed.
3.2 Synco’s products
Synco mainly produced synthetic (PVC) window frames, which make up for 90% of the
firm’s revenue. Through the 28 years of operation, Synco’s activities have expanded in

Page | 23
the construction and renovation market offering a wide range of products presented in
the following table (Table 3.1).
Table 3.1 Synco’s product offerings
Window frames Interior doors Parallel window frames Armed doors Circular window frames Kitchen furniture Rotating window frames Industrial floor - laminate Main entrances Cabinets and general use furniture
This thesis, as stated above, focuses on the company’s main product, which is
considered to be of exceptional quality compared to its competitors. One of the
founder’s main principles was to maintain high levels of quality, thus collaborating with
the leading suppliers around Europe. Mechanisms are supplied by GU (www2.g-u.com),
while Kömmerling (www.koemmerling.de) is the supplier of PVC profiles.
3.3 Points of sales and operating procedure
The company owns two retail stores, which are located in western and southern
Thessaloniki respectively. The stores serve as product exhibitions, while at the same
time offering a direct point for order placing by the customers. Highly trained sales
people undertake the task of selecting the best solution for each client, after measuring
and reviewing the place of installment. Delivering time does not exceed two weeks,
while their installation lasts less than a day. Apart from the company’s stores, Synco’s
products are sold by an extended national network of dealers, depicted in the following
picture (Figure 3.2).

Page | 24
Figure 3.2 Synco’s network of dealers
3.4 The impact of the economic crisis
Due to the economic recession Synco’s clientele has shifted from the construction to
the renovation sector. Although construction in Greece reached through peak levels
the 90’s and mid 00’s, the current economic situation almost brought this sector to a
halt. Synco nowadays mainly deals with renovation projects, as customers try to lower
their property’s energy demands. This need has become even more imperative, due to
the rising prices of crude oil and the national equation of heating and transportation
oil’s taxes. To this direction, the Greek state in cooperation with the EU, have created
the program “Eksikonomisi kat’oikon” which subsidizes the replacement of old window
frames with energy efficient ones, creating a favorable environment for the industry.
Based on the above, the future of the PVC window frame industry – although not
guaranteed – is considered quite secure. Such an environment allows major
companies, like Synco with an annual revenue of 9 million Euros, to survive through the
crisis without any major consequences.

Page | 25
Chapter 4
METHODOLOGY
This Chapter aims to provide justification for the choice of the simulation software
package utilized in this study (Simul8), followed by a brief description of its main
features.
More specifically, Subchapter 4.1 (Criteria of choice for computer simulation software
packages) compares several simulation software packages on the basis of the four most
important criteria that are considered vital for the successful implementation of this
technique. Subsequently, Subchapter 4.2 (Simul8 software package) provides a brief
description of Simlu8’s main concepts and control features, in an effort to familiarize
the reader with the techniques utilized in the following Chapters. The following figure
(Figure 4.0) provides an overview of this Chapter’s contents.
Figure 4.0 Schematic representation of the content of Chapter 4

Page | 26
4.1 Criteria of choice for computer simulation software packages
Computer simulation software evolved in the past decades following the development
of computer hardware capabilities. The first attempt of computer simulation software
was a simple Monte Carlo algorithm application for modeling the process of nuclear
detonation during the Manhattan Project in World War II. During the 60’s and 70’s the
development of computer programming languages, such as Fortran, resulted in the
first commercial computer simulation software such as GPSS and SIMULA. In the 90’s
the addition of features like Visual Interactive Simulation alongside the growing
popularity of personal computers, equipped with the advanced microprocessor and
windows operating system, made computer simulation software available to the
masses. Nowadays, there is a wide variety of software packages available to users
according to their specific requirements.
There is a series of criteria that should be considered when choosing an appropriate
simulation software package. These criteria span from user requirements to the
vendor’s reliability. A detailed analysis of the most important criteria is provided below,
in order to justify the choice of Simul8.
The first and most important criterion is users’ requirements regarding the actual
nature of the system to be simulated. There are three main simulation methodologies,
each one applied in different occasions.
Ø Discrete events simulation
At Discrete Events Simulation (DES) the system is represented by a series of events. The
term “event” refers to any change in the system, whether this is an item proceeding to
the next workstation or even an employee taking a break. The simulation time jumps
from one event to the next, without taking into consideration intermediary periods as
the system is thought to be in idle mode. Those time intervals are highly differ amongst
them, as they can last from fractions of a second (e.g. the movement of a robotic arm)
to hours in case of a slow chemical production line, where chemical processes can last
up to several hours at a time.

Page | 27
DES is used by a variety of systems like a typical production line of discrete
manufacturing. The main characteristic of discrete manufacturing is that the products
are both measurable (in units) and identifiable (e.g. cars, clothes or computer
hardware). On the contrary, process manufacturing deals with products - such as
petrol, water and natural gas - that are characterized as “undifferentiated”, in a sense
that the finished product cannot be distilled back to its core components. These items
are best simulated using the continuous simulation process, described below. DES
simulation technique can also be applied to business settings such as supermarkets and
malls and service settings like hospitals and call centers. It is even suitable for the
simulation of investment decisions and medical lab tests. A window frame production
line is most accurately simulated using this method. The following table (Table 4.1)
presents a list of the most popular DES software packages used, accompanied by the
primary markets on which the software is applied.
Table 4.1 Discrete event simulation software packages
Software Primary markets on which the software is applied Anylogic Logistics, supply chains, healthcare, military, project management Arena Airports, healthcare, call centers, ports, manufacturing, packaging lines ExtendSim Industries that operate in high speed or high volume areas FlexSim Manufacturing, healthcare, distribution, food processing Simul8 Business processes, call centers, manufacturing, financial, education SimCad Material handling, warehousing, job shops, document flow
Ø Continuous simulation
In continuous simulation, events are occurring constantly making the analysis of the
system continuous with no idle states. Usually such systems involve some sort of fluid
or fluid like substance. These substances, which flow continuously through the system,
are not measured in units but in volume or weight. Examples of these systems are oil
refineries, chemical plants or even an electric circuit. This simulation technique can also
be used for systems involving high volume of fast moving items, as the speed of their
movement might be better represented by a flow.
The development of a continuous simulation model requires complex mathematical
models and is therefore considered of advanced difficulty compared to DES models.

Page | 28
Additionally, as digital computers do not have the capability to model continuous
changes, some vendors are forced to develop software that simulate continuous
systems using DES with very small, yet still discrete time steps. These software
packages should be avoided, due to their results’ inaccuracy. Continuous systems are
best simulated using software that utilizes differential equations, with the help of
Runge – Kutta method for finding the initial values. The following table (Table 4.2)
presents a list of the most popular continuous simulation software packages used,
accompanied by the primary markets on which the software is applied.
Table 4.2 Continuous simulation software packages
Software Primary markets on which the software is applied GoldSim Mining water, resources, waste management FlexSim Manufacturing, healthcare, distribution, food processing SimCad Material handling, warehousing, job shops, document flow
Ø Hybrid Simulation
Hybrid simulation, also known as discrete rate or combined event simulation, results
from the combination of the two above mentioned techniques. Systems demanding
such an approach are usually those that include entities which transform throughout
the system from individual countable form to fluid like substances and backwards.
Typical examples of such systems are canning or packing plants. Furthermore, hybrid
simulation is also applied when entities flow through the system at different rates and
values based on events. Due to the interface between continuous and discrete portions
of the model, hybrid simulation is much more perplexed compared to the previously
mentioned methods. The most popular software package offering hybrid simulation
capabilities is ExtendSim.
The second criterion to be considered upon choosing the appropriate simulation
software concerns technical characteristics. Given the fact that Synco’s production line
would be analyzed best through discrete event simulation, only DES software will be
assessed from now on. This assessment will be made through a comparison of the six
most popular DES software packages on the five aspects of technical characteristics.

Page | 29
1. Model Input
Model input incorporates the functions of model building and input features. Model
building can be evaluated through the program’s user friendliness, incorporating
features like work centers, interactive data input, databases and spreadsheets. The
main purpose of input features is to increase the ease of use by dialogue boxes and a
wide selection of built – in functions. Simul8 is considered the most user friendly
program, as it is preferred extensively both in the academic community and in the
business world. Despite its user friendly interface, Simul8 offers a variety of advanced
technical characteristics, such as spreadsheets, automatic data collection, multiple
objects and statistical distributions. On the contrary, Arena is considered one of the
most difficult programs to familiarize with, offering features similar to Simul8. While
the remaining programs also offer advanced model building, it is in a more complex
and less efficient way compared to Simul8. It should be noted that FlexSim has the
strongest commercial presence, serving customers like Coca-Cola, VW, Boeing,
Michelin, FedEx and DHL.
2. Simulation Techniques
These techniques refer to model coding and generators. As it will become evident later
on, despite the high degree of automated production a significant proportion of a
window frame production line depends on hand craftsmanship and customization.
Therefore, the choice of a program that allows access to source code is vital. Simul8
fulfills this requirement via Visual Logic, a programming language based on Visual Basic,
as well as the provided access to global variables and limitless attributes to entities. On
the contrary, SimCad and Arena do not offer access to source code claiming that all
user requirements are satisfied by the large number of options offered. Another vital
feature offered by Simul8 is the presence of a random number generator, as this is
mandatory for obtaining the multiple run results due to the fact that the system is
characterized mainly by statistical distributions. Finally, it should be noted that
alternative simulation techniques, such as agent based modeling, are provided by
AnyLogic but are not applicable to this study’s system.

Page | 30
3. Presentation features
This term incorporates all features related to animation, display and virtual reality
presentation. All six of the DES packages offer display of paths, state, icons, zoom and
speed control and 3D visuals to an extent. FlexSim currently has the best capabilities in
virtual reality presentation.
4. Model execution
This subcategory refers to the control of speed, the warm up period and system clock
manipulations, features that all programs incorporate.
5. Model output
Model output refers to the various display methods of results offered by each program.
These range from reports and mathematical graphs to statistical analysis, again
features that all programs incorporate. ExtendSim and SimCad Pro offer additional
optimization advices based on the initial results.
The third criterion that one should consider when deciding upon simulation software is
the vendor. A simulation software package can play a crucial role in the success and
profitability of the company, due to the company’s daily reliance on the program’s
functions. Therefore, the choice of an experienced, reliable and support providing
vendor is vital. All six developer companies have an established presence in the
simulation community, with more than 20 years experience and multinational clientele,
making them a safe choice.
Based on the three criteria discussed above, the choice of Simul8 was justified through
the nature of the system (DES), the advanced technical characteristics, the user friendly
environment, the validated developer and, lastly, the strong Simul8 community.
4.2 Simul8 software package
This section is dedicated on the analysis of the basic characteristics and features of
Simul8 software package.

Page | 31
Simul8’s main concepts
1. Work items
The entities on Simul8 are named work items. Work items differ according to the
research setting: in a production line they are the products, in a store they are the
customers, in a hospital they are the patients, etc. Simul8 enable the formation of as
many work item types as a user may need. For example at a car production line with
three car models, three separate types of work items are needed, as each model has
different characteristics and different processing times.
2. Work centers
The places where work items are processed are called work centers. Each work center
has a distribution attached on it, based on the work completion time. The discipline of
a work center is the following: in case of an unoccupied work center, a work item
waiting to utilize the work center takes its turn to occupy it and start being processed.
When needed, transformation of an item takes place by changing its attributes. During
the processing time, no additional work item can occupy the work center. On
completion of the process, the work item is either sent to a queue or straight to next
work center. In an effort to increase simulation accuracy, a user can attach an
efficiency factor to each work center simulating machine breakdowns or employees
not working at their full capabilities. Additionally, the routing process of work items can
be accurately specified, both from a priority and discipline perspective.
3. Storage bins
Storage bins represent areas of the system where work items are gathered while
waiting for a work center to become available. Such areas could be warehouses,
shelves or even trolley carts. Transforming work items while they are in storage bins is
not allowed, as it would contradict the logical sequence of events. Storage bins can
have a series of differentiating properties. Maximum capacity is used in order to block
further items from entering the bin, whenever a certain number is exceeded. Shelve
life is utilized in order to indicate an expired product that should be discarded. Finally,

Page | 32
the option of minimum waiting time before a processed item can leave the bin is very
useful in situations when for example a cooling time is required after the welding of
metal components before an item can proceed further along the production line. FIFO
(First in – Fist out) and LIFO (Last in – First out) principles could be applied, while
prioritization can also be based on particular work item attributes.
4. Work entry points
A work entry point indicates the place where a work item enters a system. Each work
item type can originate from a different point, resulting in multiple points of entry in
one system. Work items can arrive either unitarily or in batches, with inter arrival times
that are defined based on distributions. Finally, at work entry point attributes deriving
either from distributions or from spreadsheets can be mounted on work items,
resulting in their differentiation.
5. Work exit points
A work item that reaches a work exit point leaves the system and is considered from
that point onwards as work complete.
6. Resources
Resources are essential for a work center in order to process an item. They could be
shared among work centers that compete for them, thus defining the processing ability
of a work center by their availability. Examples of such cases can be employees that
operate multiple machines, limited specialized tools or even beds and operating rooms
in a hospital ward. The allocation of resources can be defined using several special
arrangements, like shifts or patterns.
Control features
1. Simulation time
Simul8 features a clock that represents the simulated time. It can be accelerated,
decelerated or manipulated in order to move forwards or backwards to a specific point

Page | 33
in time. Additionally, before any simulation procedure, the user is required to define a
data collection period. This feature enables an accurate simulation of systems that do
not follow a typical eight – hour shift pattern, such as hospitals or major production
lines. It also allows for the discard of several events like employee breaks that are
considered data alteration by the user. To this direction, a warm up period is also
offered as an option to ensure maximum accuracy. During this time, results are not
taken into consideration until the system reaches normal operating conditions. This is a
very useful option, especially when simulating production lines, where every shift
begins from where the previous left off, rather than starting from an empty system.
2. Travelling times
Travelling time represents the period that elapses between a work item’s departure
from one point (work center, queue or entry point) to another (work center, queue or
exit point). These time periods can be zero, fixed or variable, based on an attribute or a
variable. For example an attribute that represents weight can negatively impact
travelling times, as heavier items need extra time for their transportation compared to
lighter objects.
3. Labels
Simul8 denotes attributes as labels. Their attachment to a work item results in its
differentiation, providing each item with the necessary characteristics that enable an
accurate simulation. Labels should not be confused with the work item types, which
represent totally different products. In the previously mentioned example of the car
manufacturing plant, various car models represent the different work item types, with
the different color options represented by a label. The label “paint” can for instance
take the values black and white, with black needing double processing time due to the
two coats of paint needed for the final result. The label values could be assigned
manually from the user, from distributions or even from an external source, like a
spreadsheet. Finally, labels also could be used for routing to different workstations or
queues.

Page | 34
4. Results
Simul8 presents the results in the Results Summary Window at the end of each
simulation. By default the only result presented is the average time of work items in
the system, namely the average time lapse from a work entry point to a work exit
point. Additional results can be added from any work center or queue, regarding total
work items passed from a point, as well as percentages of time working, stopped,
waiting, queuing times, etc. Furthermore pie charts and histograms for every work
center and queue are also available as a graphic aid. Alongside the option to export
results in the form of a txt or spreadsheet file, Simul8 internally stores results from
each simulation for comparative reasons, in case of any changes imposed to any
component of the model. The program’s random number generator can provide
multiple results for the same day, week, shift, etc based on different set of random
numbers used in statistical distributions. Through multiple trials, the accuracy of the
provided results is also increased providing results with 95% or 99% confidence
intervals.
5. Visual Logic
Visual Logic (VL) is a programming language providing access to the Simul8 source
code. VL is a simplified version of Visual Basic and basically disengages the model of
any constrains imposed by the predefined work centers. VL can be used for changing
values of variables, labels, regulating efficiency rates, the behavior of resources, the
routing procedure, the discipline of the work items, the distributions, connecting
Simul8 with external sources and controlling the simulation clock. VL can be executed
before a work item enters a work center, after loading the work, on work complete,
before exit and on exit.

Page | 35
Chapter 5
THE SIMULATION MODEL
This Chapter is dedicated to the analytic description of the production line and the
simulation model developed to accurately represent its activities. Along with the next
Chapter, this section of the dissertation constitutes the core of the study as they
present the thesis’ contribution to the industry, as the developed model can be used by
all production lines operating in the same market.
More specifically, Subchapter 5.1 (Introduction) presents some characteristics of the
production line along with some settings of the simulation program that contribute to
the accuracy of the model. In the following Subchapter 5.2 (Model development) all six
work positions of the main production line are analytically described, followed by a
detailed projection of the model. Subchapter 5.3 (Model verification) provides details
on the verification method of the model, whereas Subchapter 5.4 (Results of the
baseline model) presents and discusses the most important performance measures.
The following figure (Figure 5.0) provides an overview of this Chapter’s contents.
Figure 5.0 Schematic representation of the content of Chapter 5
Page | 36
5.1 Introduction
Before proceeding with the presentation of the simulation model, a number of
characteristics regarding both the production line and the formulated model should be
clarified.
• The product
This thesis is focused upon the main product of SYNCO S.A: synthetic (PVC) door and
window frames (Figure 5.1). Since the two types of frames differ only in terms of their
dimensions, from now on they will be collectively referred to as window frames, as it
happens in the industry. Window frames are used in a variety of settings ranging from
houses to cafeterias, as well as other industrial sites. They could have none, one or two
doors, while the number of doors is independent from the frame’s size. The frame’s
use is the defining factor of its size, which falls in three basic categories: smaller frames
are used for secondary openings (e.g. WC window), medium frames are usually
common windows and larger ones are used as secondary entrances, different from the
main entrance only due to their lack of a key lock. Window frames are 100%
customized products as it is very rare that one product is identical to another. Even
frames that belong to the same apartment building are differentiated by their
dimensions that require millimeter precision.

Page | 37
Figure 5.1 Section view of a window frame
• Labels
In order to accurately model the real product, the following eight labels were used.
1. Size
As mentioned above window frames are divided into 3 categories: small, medium and
large, which are also the actual values denoted to the label “Size”. This categorization
was selected based on the fact that there were no findings indicating that the input of
the exact frame dimensions (height * width) would have a statistically significant
impact on the results. Additionally, the input of exact dimensions would have an
adverse impact on the model’s flexibility and speed, without improving its accuracy.
The following table (Table 5.1) depicts the dimension limits for size characterization.
Table 5.1 Dimension limits for size characterization
Height (cm) Size > 200 Large From 60 to 200 Medium ≤ 60 Small
Page | 38
2. Doors
This label can take the values zero, one and two, representing the number of the doors.
3. Color
The color of the window frames can either be white or brown (wood imitation). This
variable is examined due to the fact that a brown coloring imposes an extra work load
for the construction of the frame, as it will be described later on. Although frames are
available in a variety of colors, 99 % of the total orders refer to white and brown colors.
Based on this fact, the remaining color choices were excluded from the model.
4. Counter
This label records the unique serial number of the window frame, aimed to offer a
better supervision of the simulation model.
5. Time
Time label receives the value of the time elapsed between the window frame entering
the first work station and exiting the system, thus depicting the total processing time.
6. Route
This label is utilized in the routing process, due to the fact that the production line is
more accurately simulated when routing is based on product characteristics rather
than statistical distributions.
7. Help1 and Help2
The purpose of those labels is auxiliary, in order to solve various problems during the
simulation process ranging from counting iterations to blocking and selecting routes.
• Trolley carts
The transportation of window frames through the production line is done with the use
of trolley carts that have a capacity of 20 window frames. There are two types of trolley
carts, the first one facilitating the window frames prior to gluing (Figure 5.2) and the
second aimed for the transportation of frames after this procedure (Figure 5.3).

Page | 39
Figure 5.2 Trolley cart for the transportation of frames prior to gluing

Page | 40
Figure 5.3 Trolley cart for the transportation of glued frames
• Resources
Synco’s production line is arranged in a way that every employee is dedicated to his
work position. Although employees may change work stations during their shifts, these
changes would have the form of a shift proportion instead of constant changes among
the two stations. For example, an employee might spent half of his shift at workstation
A and then move to workstation B, instead of jumping from A to B constantly. Taking
this into consideration, a solution of manipulating routes was deemed as more
appropriate.

Page | 41
• Dummy work centers
An extent number of dummy work centers were used in the simulation model for a
number of reasons. Dummy work centers do not represent any actual activity therefore
a work item passes through them instantly without any delay. In most cases dummy
work centers were used before a junction in order to help in the routing process,
before work stations aimed for loading values, for counting reasons and also in order to
better understand and visualize the simulation model.
• Warm up time and results collection period
Second was used as the time unit of measurement, as the work duration on window
frames in most work centers is less than one minute. Despite the fact that the daily
shift’s duration is around eight hours, from 7:00 AM to 15:00 PM (28800 sec), the
results’ collection period was set from 7:00 AM to 14:45 PM (27900 sec), taking into
account the daily 15 minute brake. After extensive trials and consultation with the
production manager, the warm up period was set to two days. As the system was able
to reach its normal state only after the first two days, those results were excluded and
the collection period was set to begin from the 3rd day at 7:00.
• Data collection
Data were personally collected through close observation by daily visits to the
production line from July 2nd to July 27th 2012 (four weeks of production) with the help
of a stopwatch and hand notes. A number of 50 observations were collected from
every work position for each possible occasion, thus ensuring the validity of the model.
All observations were inserted in the statistical program stat::fit (www.germs.com) in
order to extract the exact statistical distribution that best represented the actual
activities.
5.2 Model Development
The main production line consists of six work positions, which are going to be described
below, followed by the implementation of the simulation model.

Page | 42
Ø System entry
Actual production line
The production of window frames starts from the point where the basic raw material is
stored. This raw material is the synthetic profile made from PVC, which is supplied by
Kömmerling (www.koemmerling.de ) in the form of six meter rods. There are two types
of profiles, one type for the frames and another for the doors, which both come in two
colors, white and brown. The six meter rods are stored in shelves right before the first
work station (Figure 5.4).
Figure 5.4 Storage room for PVC rods
Simulation Model
The system entry is modeled using a work entry point and a queue (Figure 5.5). At the
work entry point (start) the labels that specify the individual attributes of the work
item (size, doors and color) are loaded.
Figure 5.5 Simulation model of the system’s entry
The values are based on a statistical analysis conducted on the last 1000 orders
(Appendix, Table A.1) with the help of stat::fit (www.germs.com). The results of this

Page | 43
analysis indicated that all three attributes follow binominal distributions with the n
(number of experiments) and p (probability) stated on the following table (Table 5. 2),
with no correlation amongst them.
Table 5.2 Number of experiments and probabilities for the labels: size, doors and color
Labels Values N p
Size 0 = Small 2 0,167 1 = Medium
2 = Large Doors 0
2 0.67 1 2
Color 0 = white 1 0,26
1 = brown
The inter arrival time of the work items entering the system and loaded at the queue
(Queue Saw) was set to one second. Despite the fact that this setting clearly exceeds
the systems capabilities, it was selected both for flexibility in case of future expansions
as well as for visualization purposes.
Ø Work position 1
Actual production line
The first work position (Figure 5.6) is occupied by one employee assigned with the task
of cutting the profile rod in the right dimensions. The cutting procedure takes place in a
cutting machine with the help of the two automated electric saws that cut both profile
ends. Due to the economic recession, in combination with the drop in sales, only one
cutting machine is utilized, as the operation of the second machine would require the
presence of a second employee. In general the company tends to avoid utilizing its full
production line capabilities, as its maximum production capacity was designed meet
the demand during the construction burst in Greece. At the beginning of each day, all
attributes (dimensions, number of doors, etc) of the window frames scheduled to enter
production are imported in the cutting machine and, with the help of an optimization
algorithm, six meter rods are cut in an order that ensures minimum waste and the
fulfillment of the 20 places in the trolley cart.

Page | 44
Figure 5.6 The production line’s first work position
Simulation Model
The entrance of a work item into the “Before Saw” work center blocks “Queue Saw”,
which is only freed when the processed work item enters “Queue Dummy Saw 1”. This
loop represents one cutting machine operated by the only employee assigned to this
position. In every cut two profile rods enter the cutting machine in parallel, producing
two profiles pieces as every window frame or door is rectangle with two equal width
and two equal heights. A set of two rods can last for four cuts and every four cuts two
new rods should be loaded at the same machine. In addition to its blocking function,
“Before Saw” also defines both the time label, as this is the actual moment that work
items enter the system and the counter (serial number). The repetition rate of the
cutting process is also set by “Before Saw”, according to the number of doors: two cuts
are required for frames with no doors, four cuts for frames with one door and seven
for those with two doors. Frames and doors require six cuts and an additional cut is
intended for the Kenfer, a special profile placed between the two doors for closing in
on each other. After a work item’s entry into the loop, the “select” center sends after
every four cuts an item to loading profile, which is a log normal distribution with

Page | 45
average 48,8 sec and standard deviation 13,1 sec (Appendix, Table A.2). Either way the
item reaches the “Saw” center where the cutting takes place which is a log normal
distribution (Average: 32 sec, Standard deviation: 9,6 sec, Table A.3). If the process
needs to be repeated, the item is sent back to “Queue for Select”, if not it exits the
loop to “Queue Dummy Saw 1”. This section of the simulation model is presented in
the following figure (Figure 5.7).
Figure 5.7 Simulation model of the first work position
At this point a clarification should be made, regarding the arrangement of the two
Dummy queues and the two Dummy work centers, which can be found at the end of
every work position (Figure 5.8). Their main function is to block the route until all
positions in a trolley cart are filled (20 work items). Only when this condition is met can
the work items travel as one group to the next work position, with a traveling time of
20 to 40 seconds depending on the specific arrival destination.
Figure 5.8 Simulation of the trolley cart function
Ø Work position 2
Actual production line
The first part of the second work position is dedicated to the creation of the frame’s
drains. Drains are holes that are created using a drilling machine and have a dual

Page | 46
purpose. They aim to drain the water that has been inserted inside the profile, while at
the same time releasing the air pressure inside the profile, created by heat induced air
expansion threatening to bend the frame’s structure. One drain is drilled at the frame’s
bottom width and an additional two, located at the upper and bottom width of each
door (Figure 5.9). At the second part of this work position, iron bars are fitted inside
the widths and heights of every frame and door, in order to reinforce the structure and
increase its rigidity (Figure 5.10). The bars delivered on time with no delay readily cut at
the right dimensions from a work position that is external to the main production line.
The bars are fitted by hand and stabilized with screws by a pneumatic screwing
machine. This work position is occupied by one employee, who has the responsibilities
of drilling the drains and then fitting the iron bars, utilizing only one of the two
available sets of drilling and screwing machines at a time.
Figure 5.9 The production line’s second work position (Part A)

Page | 47
Figure 5.10 The production line’s second work position (Part B)
Simulation Model
The entrance of a work item into the “Before Drain” results in the blocking of the
center, which is freed again only when the work item enters the “Queue Dummy Iron
1”, after being fully processed. This arrangement aims to represent the only employee
that is available for the utilization of both machines. Additionally, “Before Drain” is also
utilized in order to load the number of times that the drilling procedure must be
repeated: one time for zero doors, three for one door and five for two doors.
Furthermore the times of the iteration of the iron work center is loaded, which is one
for zero doors, two for one door and three for two doors. The iron center was modeled
utilizing two separate centers “Iron width” and “Iron Height”. This modification was
made because a frame’s height is usually the bigger than its width, thus requiring more
processing time. As processing times at both work centers depend on dimensions,
three different log normal distributions were used for each work center (Appendix,
Tables A.5 – A.10). The values characterizing each distribution are depicted in the
following table (Table 5.3).
Page | 48
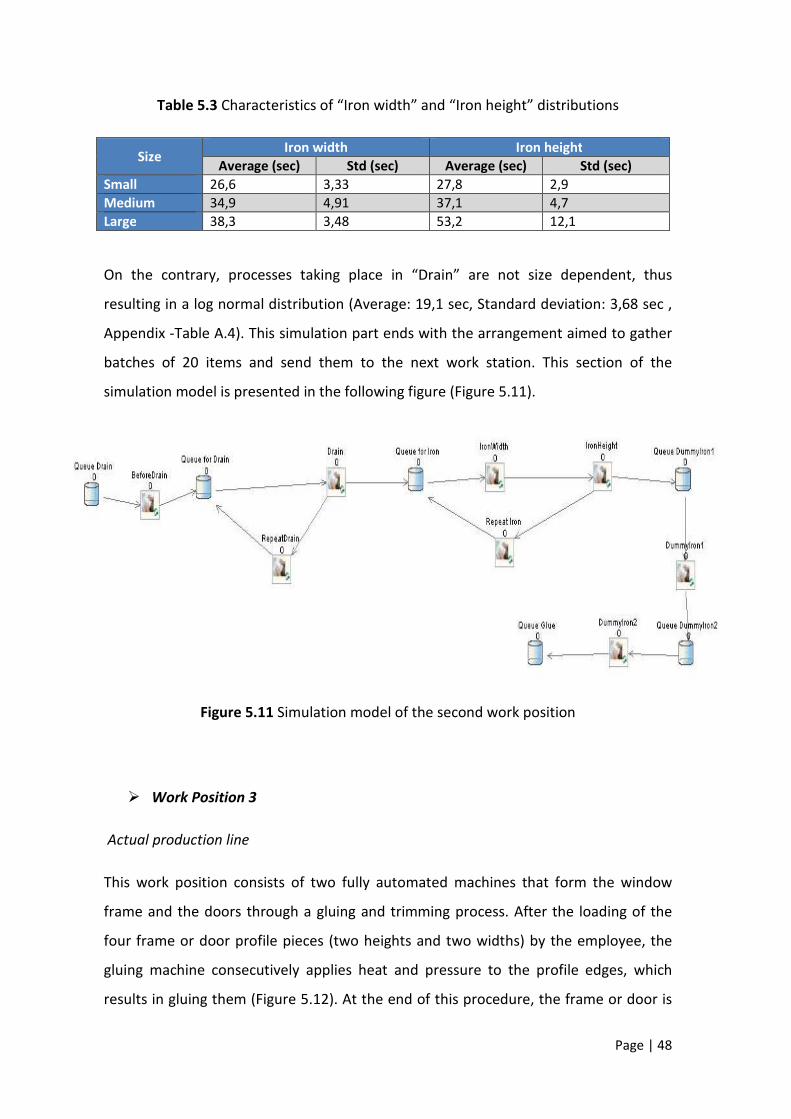
Table 5.3 Characteristics of “Iron width” and “Iron height” distributions
Size Iron width Iron height
Average (sec) Std (sec) Average (sec) Std (sec) Small 26,6 3,33 27,8 2,9 Medium 34,9 4,91 37,1 4,7 Large 38,3 3,48 53,2 12,1
On the contrary, processes taking place in “Drain” are not size dependent, thus
resulting in a log normal distribution (Average: 19,1 sec, Standard deviation: 3,68 sec ,
Appendix -Table A.4). This simulation part ends with the arrangement aimed to gather
batches of 20 items and send them to the next work station. This section of the
simulation model is presented in the following figure (Figure 5.11).
Figure 5.11 Simulation model of the second work position
Ø Work Position 3
Actual production line
This work position consists of two fully automated machines that form the window
frame and the doors through a gluing and trimming process. After the loading of the
four frame or door profile pieces (two heights and two widths) by the employee, the
gluing machine consecutively applies heat and pressure to the profile edges, which
results in gluing them (Figure 5.12). At the end of this procedure, the frame or door is

Page | 49
left to cool off at an intermediary position, until it is sent with pulleys to the trimming
machine which trims the four glued corners (Figure 5.13).
Figure 5.12 The production line’s third position (Part A)
Figure 5.13 The Production line’s third position (Part B)
Page | 50
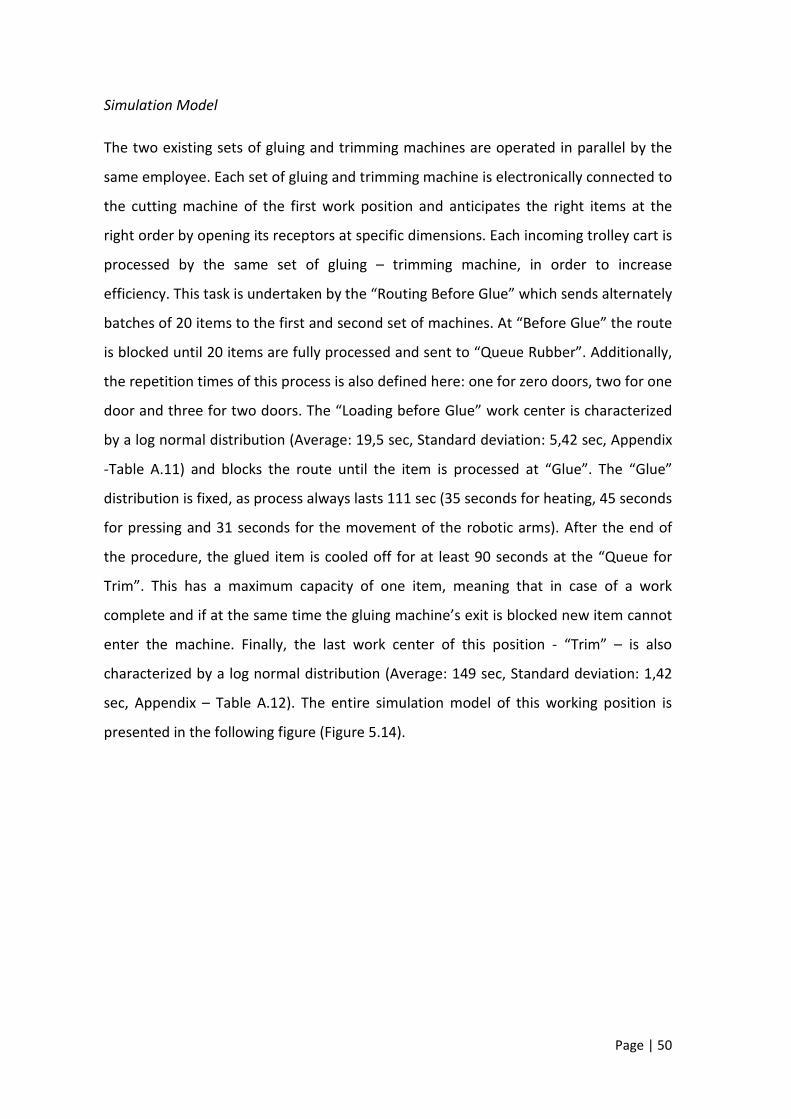
Simulation Model
The two existing sets of gluing and trimming machines are operated in parallel by the
same employee. Each set of gluing and trimming machine is electronically connected to
the cutting machine of the first work position and anticipates the right items at the
right order by opening its receptors at specific dimensions. Each incoming trolley cart is
processed by the same set of gluing – trimming machine, in order to increase
efficiency. This task is undertaken by the “Routing Before Glue” which sends alternately
batches of 20 items to the first and second set of machines. At “Before Glue” the route
is blocked until 20 items are fully processed and sent to “Queue Rubber”. Additionally,
the repetition times of this process is also defined here: one for zero doors, two for one
door and three for two doors. The “Loading before Glue” work center is characterized
by a log normal distribution (Average: 19,5 sec, Standard deviation: 5,42 sec, Appendix
-Table A.11) and blocks the route until the item is processed at “Glue”. The “Glue”
distribution is fixed, as process always lasts 111 sec (35 seconds for heating, 45 seconds
for pressing and 31 seconds for the movement of the robotic arms). After the end of
the procedure, the glued item is cooled off for at least 90 seconds at the “Queue for
Trim”. This has a maximum capacity of one item, meaning that in case of a work
complete and if at the same time the gluing machine’s exit is blocked new item cannot
enter the machine. Finally, the last work center of this position - “Trim” – is also
characterized by a log normal distribution (Average: 149 sec, Standard deviation: 1,42
sec, Appendix – Table A.12). The entire simulation model of this working position is
presented in the following figure (Figure 5.14).

Page | 51
Figure 5.14 Simulation model of the third work position
Ø Work Position 4
Actual production line
In the fourth work position strips of rubber are placed on the window frames and doors
(Figure 5.15). On the frame a strip of rubber is placed on the internal perimeter where
the doors will make contact with the frame or in case of no doors where the glass will
make contact with the frame. Two strips of rubber are placed on each door, one in the
external perimeter for contact with the frame and one on the inside for contact with
the glass. The placement of the rubber strips is a handcrafted procedure performed by
two employees at specially arranged benches. There are three benches, where one
employee spends the entire shift while the other one only stays for the half (7:00 –
11:00 AM). For the second half of his shift, the employee is placed on a secondary
position apart from the main production line. Finally, in case of a brown window frame,
an extra step prior to the placement of the rubber is required. During this step all of the
four corners of the frame are heated with a heat gun for homogenizing the color.

Page | 52
Figure 5.15 The production line’s forth working position
Simulation Model
The “Before Rubber” work center blocks the route when an item enters the loop until it
reaches the “Queue Mechanism”. Additionally, it loads the number of repetitions
needed for each work center. For the “Heating” workstation these are one for zero
doors, two for one door and three for two doors, while for “Rubber door” only one
repetition is needed for each door. Finally in case of a brown item “Before Rubber”
sends an item to “Queue for Heating”, where heating takes place with a log normal
distribution (Average: 107 sec, Standard deviation: 64,1 sec, Appendix - Table A.13). In
either case the items reaches the “Rubber frame” center, where strips of rubber are
placed with a log normal distribution according to the frame’s size (Appendix, Tables
A.14 – A.16). The main characteristics of the distributions are presented in the
following table (Table 5.4)
Table 5.4 The main characteristics of size dependent “Rubber frame” distributions
Size Average (sec) Standard Deviation (sec) Small 63,5 9,8 Medium 74,4 12,7 Large 86,2 6,1

Page | 53
If the item has doors, it also passes from the “Rubber door” center which is
characterized by a log normal distribution according to the door size (Appendix, Tables
A.17 – A.19). The main characteristics of the distributions are presented in the
following table (Table 5.5).
Table 5.5 The main characteristics of size dependent “Rubber door” distributions
Size Average (sec) Standard Deviation (sec) Small 126 15,5 Medium 131 16,1 Large 141 11,1
Finally, each day after 11:00 AM the route “Before Rubber2” is blocked because the
employee is relocated to another position. The entire simulation model of this position
is depicted in the following figure (Figure 5.16).
Figure 5.16 Simulation model of the forth work position

Page | 54
Ø Work position 5
Actual production line
A window frame is processed on the fifth work position only if it has doors, as this
position is dedicated to the fitting of door mechanisms that allow them to lock, open
and tilt (Figure 5.17). As this is the most technical position of the production line, highly
skilled employees are needed due to the increased complexity of the procedure.
Mechanisms are fitted on the doors by screws using pneumatic pistols on tilting
benches. There are three available benches with the respective pneumatic machines.
One employee is dedicated in this position for the entire shift and another stays for the
75% of the shift, with the rest spent on a position at the secondary production line.
Figure 5.17 The production line’s fifth working position
Simulation Model
In case of an item with no doors, the frame is sent to the “Queue Dummy Mechanism
1” surpassing the “Mechanism” work position. If the item has doors it enters the
“Queue for Mechanism” awaiting to get into the loop. The “Before Mechanism” work

Page | 55
centers reassure that the only one work item is in the loop at each point in time by
blocking the entrance. In addition it defines the number of repetitions that the process
should go through: one for one door and two for two doors. The “Mechanism” work
center is characterizes by a log normal distribution according to the door’s size
(Appendix, Tables A.20 – A.22). The main characteristics of the distributions are
presented in the following table (Table 5.6).
Table 5.6 The main characteristics of size dependent “Mechanism” distributions
Size Average (sec) Standard Deviation (sec) Small 325 27,5 Medium 339 26,2 Large 413 64,1
In case of a two door frame, an additional procedure is required. The item passes
through the “Repeat Mechanism” which models the placement of the Kenfer
mechanism at the door that opens second in turn, so as to reinsure that the window
frame can close tightly. This is again a log normal distribution process (Average: 83,1
sec, Standard deviation: 6,57, Appendix - Table A.23). The entire simulation model of
this position is depicted in the following figure (Figure 5.18).

Page | 56
Figure 5.18 Simulation model of the fifth work position
Ø Work position 6
Actual production line
At the final work position the glass is placed on the frames and doors (Figure 5.19). One
piece of glass is placed directly on the frame if it has no doors or on each of the frame’s
doors. The glasses are supplied at the right dimensions ready to be fitted every
morning before the shift starts by an external supplier. Both frames and doors to be
processed at this work position are placed at a conveyor that has a capacity of 20
items. Afterwards a series of procedures take place on each item. The employee is only
allowed to continue with the next procedure when all 20 items are processed. The
order of events is the following: at first the items are cleaned from dust and residues
with a pneumatic blower, then spacers are placed at the upper left and lower right
corner where the glass will be fitted. After the placement of the glass, little plastic tiles
are placed at the left and right space between the frame or door and the glass to
ensure that the glass’s stability, followed by a silicone gluing procedure. Finally battens

Page | 57
are placed to close all gaps and the finished product is transported to a warehouse,
where trucks load and deliver them to the customers.
Figure 5.19 The production line’s sixth working position
Simulation model
The “Before Glass” work center blocks the entrance to the loop, allowing the
processing of only one item at a time. Additionally, it defines the number of times that
the item has to repeat the loop (one time for items that have none or one door and
two times for those with two doors). Each step is done individually which is against the
real case but considering the final step of the model that holds the items until they are
a complete batch of 20, the total time for the process of a trolley cart is ultimately the
same. Because each process is performed on each of the 20 work items before moving
to the next, a total time for each work item could not be calculated and each process
should be individually modeled. Each process is depicted by a log normal distribution
which is size dependent (Appendix, Tables A.24 – A.41) and the characteristics of each
distribution are summarized in the following table (Table 5.7)

Page | 58
Table 5.7 The main characteristics of distributions comprising work position 6
Size
Clean and load
Spacers Glass Silicone and tiles
Battens Transport
Av (sec)
Std (sec)
Av (sec)
Std (sec)
Av (sec)
Std (sec)
Av (sec)
Std (sec)
Av (sec)
Std (sec)
Av (sec)
Std (sec)
Small 16 5,6 31 8,34 11,1 2,96 35 6,86 28,1 12,3 21,6 3,67 Medium 25 8,8 36,3 7,22 12,3 3,15 39 7,73 50,3 19,28 32,7 4,34 Large 40 10,6 53,6 6,47 15,5 3,21 54,5 9,93 84,5 33,4 54,3 6,52
The entire simulation model of this position is depicted in the following figure (Figure
5.20).
Figure 5.20 Simulation model of the sixth work position
5.3 Model verification
The model was verified both by the two owners of the company and the production
manager after a detailed analysis step by step. The final verification came from the
exported results, analyzed in the next part, which represent the actual outputs of the
real system.
5.4 Results of the baseline model
The default setting of Simul8 only provides the average time of a work item in the
system. Additional results that meet users’ requirements must be added manually. The
present study chose to utilize the following performance measures for each queue
analysis:

Page | 59
1. Current contents
2. Minimum queue size
3. Average queue size
4. Maximum queue size
5. Items entered
6. Minimum queuing time
7. Average queuing time
8. Maximum queuing time
9. Standard deviation of queuing time
10. Number of non zero queuing times
The selection of the above mentioned measures aims to capture every possible aspects
of the queue behavior. The most important performance measures that characterize a
work center are the percentage of time that the position is active during a shift, along
with the number of complete jobs. One peculiarity of the simulation model is that most
work positions are constituted using multiple work centers due to the fact that the
work applied consists of many steps. In order to accurately interpret the model’s
results, work centers belonging to the same work position should be considered as one,
taking the cumulative percentage of working time into consideration.
Queues and work centers that are auxiliary, dummy or have visual and routing role
were excluded from the results, maintaining only those that have a physical substance.
The following table (Table 5.8) presents the queues and work centers included in the
results, indicating which of them should be considered as a unity.
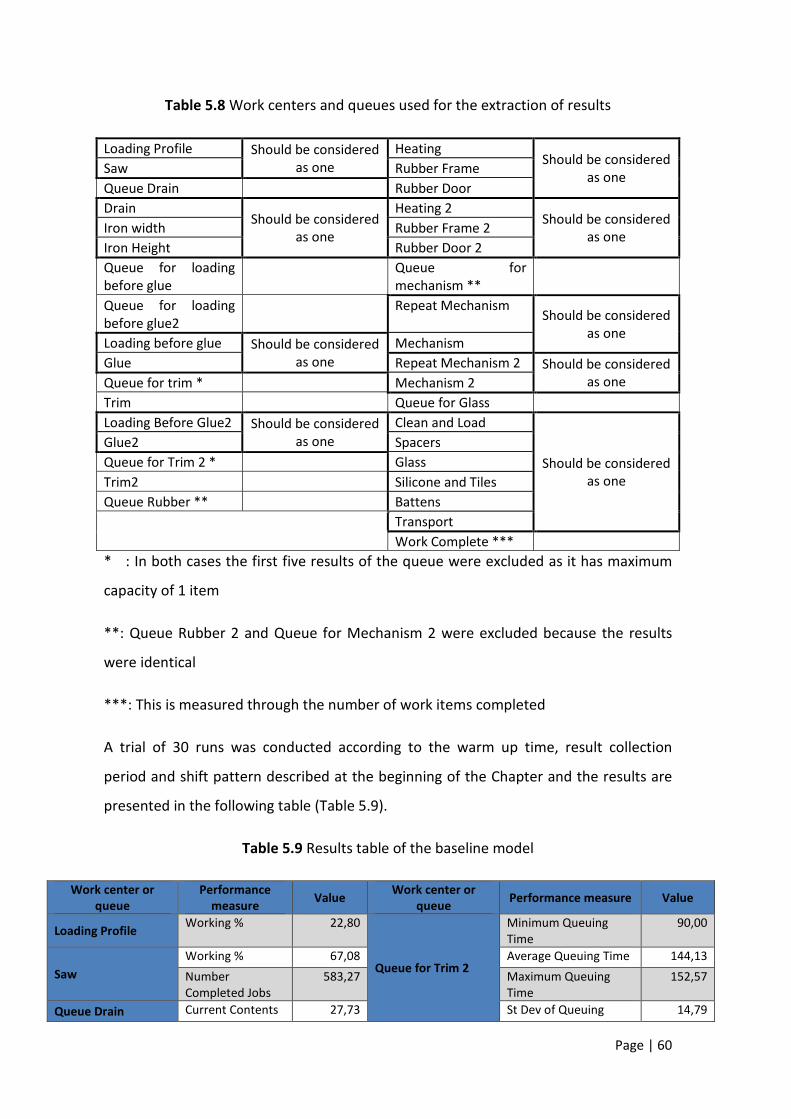
Page | 60
Table 5.8 Work centers and queues used for the extraction of results
Loading Profile Should be considered as one
Heating Should be considered
as one Saw Rubber Frame Queue Drain Rubber Door Drain
Should be considered as one
Heating 2 Should be considered
as one Iron width Rubber Frame 2 Iron Height Rubber Door 2 Queue for loading before glue
Queue for mechanism **
Queue for loading before glue2
Repeat Mechanism Should be considered
as one Loading before glue Should be considered
as one Mechanism
Glue Repeat Mechanism 2 Should be considered as one Queue for trim * Mechanism 2
Trim Queue for Glass Loading Before Glue2 Should be considered
as one Clean and Load
Should be considered as one
Glue2 Spacers Queue for Trim 2 * Glass Trim2 Silicone and Tiles Queue Rubber ** Battens Transport
Work Complete *** * : In both cases the first five results of the queue were excluded as it has maximum
capacity of 1 item
**: Queue Rubber 2 and Queue for Mechanism 2 were excluded because the results
were identical
***: This is measured through the number of work items completed
A trial of 30 runs was conducted according to the warm up time, result collection
period and shift pattern described at the beginning of the Chapter and the results are
presented in the following table (Table 5.9).
Table 5.9 Results table of the baseline model
Work center or queue
Performance measure
Value Work center or
queue Performance measure Value
Loading Profile Working % 22,80
Queue for Trim 2
Minimum Queuing Time
90,00
Saw Working % 67,08 Average Queuing Time 144,13
Number Completed Jobs
583,27 Maximum Queuing Time
152,57
Queue Drain Current Contents 27,73 St Dev of Queuing 14,79

Page | 61
Time
Minimum queue size
9,60 Number of non zero queuing times
117,47
Average queue size
22,39
Queue Rubber
Current Contents 11,33
Maximum queue size
35,27 Minimum queue size 0,00
Items Entered 110,67 Average queue size 3,96
Minimum Queuing Time
2.794,12 Maximum queue size 13,67
Average Queuing Time
5.957,38 Items Entered 101,13
Maximum Queuing Time
9.112,12 Minimum Queuing Time
0,00
St Dev of Queuing Time
1.606,20 Average Queuing Time 1.098,47
Number of non zero queuing times
99,87 Maximum Queuing Time
3.620,05
Drain Working % 27,34 St Dev of Queuing
Time 1.078,57
IronWidth Working % 32,30 Number of non zero
queuing times 77,67
IronHeight Working % 40,35 Heating Working % 17,22
Number Completed Jobs
249,53 RubberFrame
Working % 19,07
Queue for LoadingBeforeGlue
Current Contents 2,13 RubberDoor
Working % 50,36
Minimum queue size
0,00 Number Completed Jobs
102,87
Average queue size
6,20 Heating 2
Working % 7,90
Maximum queue size
19,00 RubberFrame 2
Working % 9,05
Items Entered 122,13 RubberDoor 2 Working % 22,95
Minimum Queuing Time
0,00
Queue for Mechanism
Current Contents 46,67
Average Queuing Time
1.360,03 Minimum queue size 26,13
Maximum Queuing Time
6.904,86 Average queue size 40,15
St Dev of Queuing Time
1.982,10 Maximum queue size 48,27
Number of non zero queuing times
124,93 Items Entered 94,33
Queue for LoadingBeforeGlue 2
Current Contents 11,13 Minimum Queuing Time
8.727,74
Minimum queue size
0,00 Average Queuing Time 11.289,97
Average queue size
5,64 Maximum Queuing Time
16.595,99
Maximum queue size
19,00 St Dev of Queuing Time
2.066,22
Items Entered 126,07 Number of non zero 74,20

Page | 62
queuing times
Minimum Queuing Time
0,00 RepeatMechanism
Working % 7,49
Average Queuing Time
1.283,83
Mechanism
Working % 92,51
Maximum Queuing Time
6.978,29 Number Completed Jobs
67,87
St Dev of Queuing Time
1.992,58 RepeatMechanism 2
Working % 6,00
Number of non zero queuing times
107,47
Mechanism 2
Working % 72,45
LoadingBeforeGlue Working % 9,37 Number Completed
Jobs 52,73
Glue
Waiting % 39,03
Queue for Glass
Current Contents 27,07
Working % 53,01 Minimum queue size 9,40
Blocked % 7,96 Average queue size 26,74
Trim
Waiting % 28,79 Maximum queue size 41,60
Working % 71,21 Items Entered 84,00
Number Completed Jobs
133,20 Minimum Queuing Time
3.205,53
LoadingBeforeGlue 2 Working % 8,17 Average Queuing Time 9.044,02
Glue 2
Waiting % 46,41 Maximum Queuing Time
13.897,06
Working % 46,80 St Dev of Queuing Time
2.568,85
Blocked % 6,80 Number of non zero queuing times
72,40
Trim 2
Waiting % 37,23 CleanAndLoad Working % 12,98
Working % 62,77 Spacers Working % 18,19
Number Completed Jobs
117,47 Glass
Working % 5,58
Queue for Trim
Minimum Queuing Time
90,00 SiliconeAndTiles
Working % 18,89
Average Queuing Time
145,80 Battens
Working % 26,89
Maximum Queuing Time
152,75
Transport
Working % 17,47
St Dev of Queuing Time
12,20 Number Completed Jobs
112,13
Number of non zero queuing times
133,13 Work Complete 1
Number Completed 73,33
The results indicate a steady flow of items throughout the production line. The absence
of bottleneck can be verified by the average queue size for every queue extracted from
the model’s results (Table 5.10).

Page | 63
Table 5.10 Average queue sizes
Queue Average queue size (items) Queue Drain 22,39 Queue for loading before glue 6,2 Queue for loading before glue2 5,64 Queue Rubber 3,96 Queue Mechanism 40,15 Queue for Glass 26,74
Most queues host on average only few items waiting to be processed. At work
positions two and six only one trolley cart is on a waiting line, while a larger queue of
two trolleys can be observed only at work position five.
Focusing on work centers, the results indicate a high utilization rate of the production
line. The following table (Table 5.11) summarizes and presents these results.
Table 5.11 Utilization rate of the selected queues and work centers
Work station % working % working of a work position Loading Profile 67,08
89,88% Saw 22,8 Drain 27,34
99,99% Iron width 32,30 Iron height 40,35 Loading before glue 9,37
62,38% Glue 53,01 Loading before Glue 2 8,17
54,97% Glue 2 46,80 Trim 71,21 Trim2 62,77 Heating 17,22
86,65% Rubber frame 19,07 Rubber door 50,36 Heating 2 7,9
39,85% Rubber frame 2 9,05 Rubber Door 2 22,95 Repeat Mechanism 7,49
100% Mechanism 92,51 Repeat Mechanism2 6
78,45% Mechanism 2 72,45 Clean and Load 12,98
100% Spacers 18,19

Page | 64
Glass 5,58 Silicon and Tiles 18,89 Battens 26,89 Transport 17,47
In the first work position the efficiency is valued at 90%, because of the time
consuming data input. This is considered as the maximum % working time that can be
achieved. Furthermore, the second employee assigned to the fourth position only
spends half of his shift at this work place, while the second employee of the fifth
position spends only 75% of his shift there. The 78,45% working of the second
employee at the fifth work station is interpreted by the fact that at the end of the shift,
instead of leaving immediately the employee stays at the work position until the work
item is fully processed.
Finally, the daily production was calculated at 73,33 work items and the average time
in system was estimated at 11,68 hours. This was achieved by marking the items upon
their entrance in the system in the third day and tracking them again when upon their
exit. The item’s exit usually occurred one to two days after its entrance, thus a longer
simulation run was required.
The following figure (Figure 5.21) collectively presents the entire baseline model.

Page | 65
Figure 5.21 The entire simulation of the baseline model

Page | 66
Chapter 6
ALTERNATIVE SCENARIOS ANALYSIS AND RESULTS
This Chapter constitutes the core of the present dissertation, as it clearly demonstrates
the contribution made on a managerial and business level.
Subchapter 6.1 (“What if” scenarios) will present several modifications made on the
model’s parameters, aimed to answer a series of series of “what if” scenarios imposed
by the company’s management, while Subchapter 6.2 (Solution for maximum
utilization of the production line) aims to make a realistic suggestion on improving
efficiency and reduce cost. The following figure (Figure 6.0) provides an overview of
this Chapter’s contents.
Figure 6.0 Schematic representation of the content of Chapter 6
6.1 “What if” scenarios
First scenario
Trolley carts with a 20 window frame carrying capacity were introduced during the first
years of the plant’s operation, based on empirical data along with some

Page | 67
experimentation. Since then, most of the working positions were technologically
upgraded, although the basic principles remained the same. One of the questions
imposed by the firm’s management was whether an increase in the capacity of the
trolley would reduce travelling times (Scenario A.1) or, similarly whether a decreased
capacity would positively impact the production line’s agility (Scenario A.2). Two trials
of 30 runs were conducted with trolley cart capacity set at 15 and 25 window frames
respectively. The results are presented in the following table (Table 6.1).
Table 6.1 Comparison between the baseline model and scenarios A.1 and A.2
Work center or queue
Performance Measures
Baseline model
Scenario A.1
Scenario A.2
Work center or queue
Performance Measures
Baseline model
Scenario A.1
Scenario A.2
Loading Profile Working % 22,80 22,80 22,80
Queue for Trim 2
Minimum Queuing Time 90,00 90,00 90,00
Saw
Working % 67,08 67,08 67,08 Average Queuing Time 144,13 145,91 143,52
Number Completed Jobs
583,27 583,27 583,27 Maximum Queuing Time 152,57 152,61 152,64
Queue Drain
Current Contents
27,73 20,27 22,73 St Dev of Queuing Time 14,79 12,05 15,68
Minimum queue size
9,60 9,67 9,67 Number of non zero queuing times 117,47 127,20 126,13
Average queue size
22,39 24,35 19,89
Queue Rubber
Current Contents 11,33 11,27 12,73
Maximum queue size
35,27 39,33 30,33 Minimum queue size 0,00 0,00 0,00
Items Entered
110,67 101,67 104,00 Average queue size 3,96 4,49 4,38
Minimum Queuing Time
2.794,12 2.787,70 2.765,51 Maximum queue size 13,67 14,87 14,67
Average Queuing Time
5.957,38 6.529,12 5.305,17 Items Entered 101,13 100,93 100,87
Maximum Queuing Time
9.112,12 10.341,36 7.799,63 Minimum Queuing Time 0,00 0,00 0,00
St Dev of Queuing Time
1.606,20 1.973,22 1.247,76 Average Queuing Time 1.098,47 1.258,73 1.187,43
Number of non zero queuing times
99,87 100,07 99,73 Maximum Queuing Time 3.620,05 4.165,29 3.720,85
Drain Working % 27,34 27,35 27,31 St Dev of
Queuing 1.078,57 1.193,45 1.129,05

Page | 68
Time
IronWidth
Working % 32,30 32,34 32,36 Number of non zero queuing times 77,67 80,20 78,53
IronHeight
Working % 40,35 40,31 40,33 Heating Working % 17,22 16,19 17,24 Number Completed Jobs
249,53 249,93 249,60 RubberFrame
Working % 19,07 19,66 19,43
Queue for LoadingBeforeGlue
Current Contents
2,13 17,07 8,47
RubberDoor Working % 50,36 51,04 50,56
Minimum queue size
0,00 0,00 0,00 Number Completed Jobs 102,87 104,20 103,33
Average queue size
6,20 7,60 4,41 Heating 2
Working % 7,90 7,94 7,65 Maximum queue size
19,00 24,00 14,00 RubberFrame 2
Working % 9,05 9,02 8,87 Items Entered
122,13 124,93 131,73 RubberDoor 2
Working % 22,95 23,25 23,25 Minimum Queuing Time
0,00 0,00 0,00
Queue for Mechanism
Current Contents 46,67 43,60 46,93
Average Queuing Time
1.360,03 1.664,30 921,82 Minimum queue size 26,13 22,47 27,47
Maximum Queuing Time
6.904,86 8.677,45 5.157,85 Average queue size 40,15 36,91 41,25
St Dev of Queuing Time
1.982,10 2.518,43 1.416,61 Maximum queue size 48,27 45,07 48,53
Number of non zero queuing times
124,93 118,33 112,87
Items Entered 94,33 95,40 94,47
Queue for LoadingBeforeGlue
2
Current Contents
11,13 2,27 1,07 Minimum Queuing Time 8.727,74 7.463,94 9.110,04
Minimum queue size
0,00 0,00 0,00 Average Queuing Time 11.289,97 10.356,55 11.604,31
Average queue size
5,64 7,54 4,08 Maximum Queuing Time 16.595,99 15.742,16 17.111,70
Maximum queue size
19,00 24,00 14,00 St Dev of Queuing Time 2.066,22 2.229,69 2.137,91
Items Entered
126,07 126,27 119,73 Number of non zero queuing times 74,20 74,47 75,20
Minimum Queuing Time
0,00 0,00 0,00 RepeatMechanism
Working % 7,49 7,62 7,42 Average Queuing Time
1.283,83 1.688,64 993,27
Mechanism Working % 92,51 92,38 92,58
Maximum Queuing Time
6.978,29 8.876,22 4.969,31 Number Completed Jobs 67,87 68,00 67,93

Page | 69
St Dev of Queuing Time
1.992,58 2.562,21 1.446,15 RepeatMechanism
2 Working % 6,00 5,97 5,86
Number of non zero queuing times
107,47 119,07 111,93
Mechanism 2 Working % 72,45 72,94 72,64
LoadingBeforeGlue Working % 9,37 8,77 8,82 Number
Completed Jobs 52,73 53,13 52,93
Glue
Waiting % 39,03 42,68 43,30
Queue for Glass
Current Contents 27,07 26,40 29,07
Working % 53,01 49,78 49,75 Minimum queue size 9,40 10,87 9,87
Blocked % 7,96 7,54 6,95 Average queue size 26,74 28,68 24,65
Trim
Waiting % 28,79 33,21 33,84 Maximum queue size 41,60 45,40 37,67
Working % 71,21 66,79 66,16 Items Entered 84,00 76,67 85,00
Number Completed Jobs
133,20 124,80 123,60 Minimum Queuing Time 3.205,53 4.132,53 3.820,13
LoadingBeforeGlue 2
Working % 8,17 8,83 8,71 Average Queuing Time 9.044,02 9.973,95 8.361,94
Glue 2
Waiting % 46,41 41,77 42,97 Maximum Queuing Time 13.897,06 15.135,11 12.413,27
Working % 46,80 50,49 49,84 St Dev of Queuing Time 2.568,85 2.841,43 2.019,07
Blocked % 6,80 7,74 7,19 Number of non zero queuing times 72,40 71,27 72,13
Trim 2
Waiting % 37,23 32,03 32,46 CleanAndLoad Working % 12,98 13,00 12,97 Working % 62,77 67,97 67,54 Spacers Working % 18,19 18,18 18,22 Number Completed Jobs
117,47 127,33 126,73 Glass
Working % 5,58 5,57 5,58
Queue for Trim
Minimum Queuing Time
90,00 90,00 90,00 SiliconeAndTiles
Working % 18,89 18,87 18,91 Average Queuing Time
145,80 145,86 143,29 Battens
Working % 26,89 26,85 26,82 Maximum Queuing Time
152,75 152,69 152,50
Transport Working % 17,47 17,52 17,50
St Dev of Queuing Time
12,20 11,93 15,76 Number Completed Jobs 112,13 111,07 112,13
Number of non zero queuing times 133,13 124,80 124,20
Work Complete 1 Number Completed 73,33 63,33 72,00

Page | 70
In case of the 25 trolley cart, almost all results were marginally worsened and the
cumulative production capacity decreased by 10 items, leading to the quick rejection of
this scenario. On the other hand, if the trolley’s capacity is reduced to 15 items no
significant change can be observed with some of the results marginally improved and
others marginally worsened. Conclusively, this scenario is also rejected.
Second scenario
Between the gluing and trimming machine there is an area where items cool with
maximum capacity of one frame or door. As mentioned above, the occupancy of this
area results in the blocking of the gluing machine’s entrance in case of work completed
inside the gluing machine. This arrangement is suspected to influence the gluing
machine’s utilization rate, which was observed to be at medium levels (62,38% for the
first and 54,97% for the second). The increase of the middle area’s capacity to two
items would require a considerable investment due to the position’s automation. New
micro switches, pulleys, controllers and conveyors would be needed, bringing the total
amount of the investment for the two sets of gluing and trimming machines to 5.000
Euros. A trial of 30 runs was conducted in order to investigate whether such an
investment (Scenario B) would have a sufficient return. The results are presented in the
following table (Table 6.2).
Table 6.2 Comparison between the baseline model and scenario B
Work center or queue
Performance Measure
Baseline model
Scenario B Work center or
queue Performance
Measure Baseline model
Scenario B
Loading Profile Working %
22,80 22,80
Queue for Trim 2
Minimum Queuing Time 90,00 90,00
Saw
Working % 67,08 67,080
Average Queuing Time 144,13 261,39
Number Completed Jobs 583,27 583,27
Maximum Queuing Time 152,57 302,83
Queue Drain
Current Contents 27,73 27,73
St Dev of Queuing Time 14,79 65,58
Minimum queue size
9,60 9,60
Number of non zero queuing times 117,47 117,47
Average queue size 22,39 22,39 Queue Rubber
Current Contents 11,33 11,47
Maximum queue size 35,27 35,27
Minimum queue size 0,00 0,00
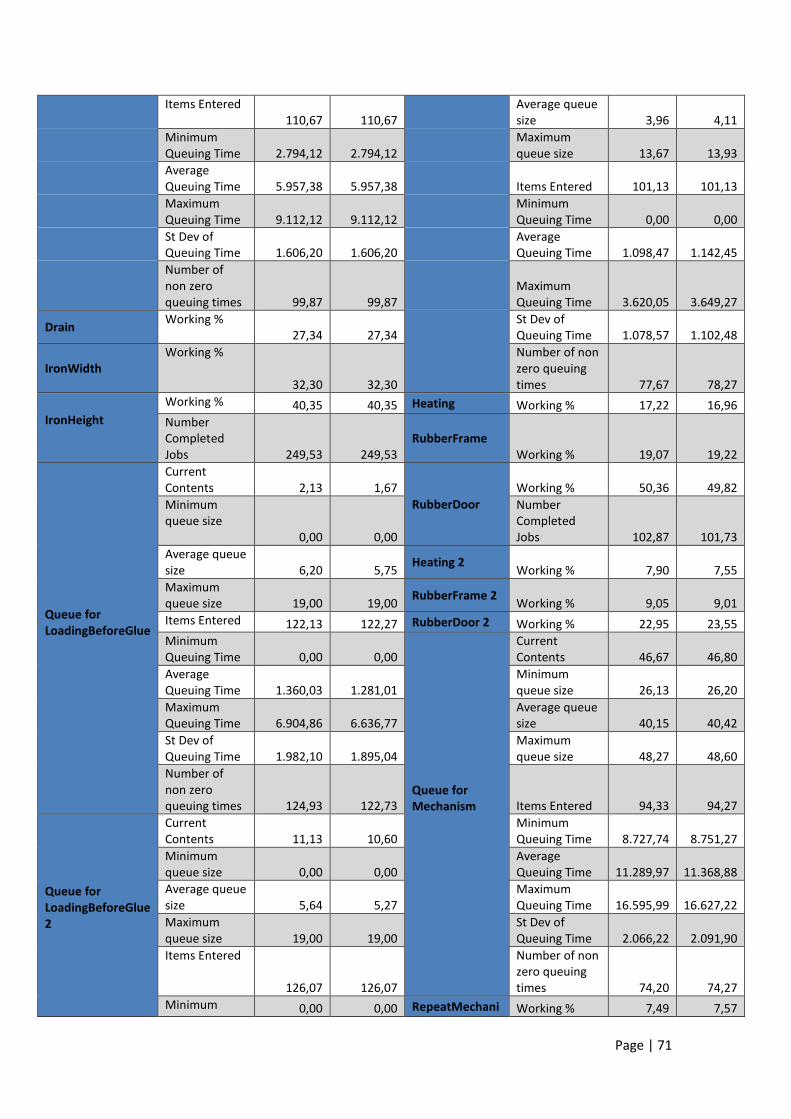
Page | 71
Items Entered 110,67 110,67
Average queue size 3,96 4,11
Minimum Queuing Time 2.794,12 2.794,12
Maximum queue size 13,67 13,93
Average Queuing Time 5.957,38 5.957,38 Items Entered 101,13 101,13 Maximum Queuing Time 9.112,12 9.112,12
Minimum Queuing Time 0,00 0,00
St Dev of Queuing Time 1.606,20 1.606,20
Average Queuing Time 1.098,47 1.142,45
Number of non zero queuing times 99,87 99,87
Maximum Queuing Time 3.620,05 3.649,27
Drain Working %
27,34 27,34 St Dev of Queuing Time 1.078,57 1.102,48
IronWidth Working %
32,30 32,30
Number of non zero queuing times 77,67 78,27
IronHeight
Working % 40,35 40,35 Heating Working % 17,22 16,96 Number Completed Jobs 249,53 249,53
RubberFrame Working % 19,07 19,22
Queue for LoadingBeforeGlue
Current Contents 2,13 1,67
RubberDoor Working % 50,36 49,82
Minimum queue size
0,00 0,00
Number Completed Jobs 102,87 101,73
Average queue size 6,20 5,75
Heating 2 Working % 7,90 7,55
Maximum queue size 19,00 19,00
RubberFrame 2 Working % 9,05 9,01
Items Entered 122,13 122,27 RubberDoor 2 Working % 22,95 23,55 Minimum Queuing Time 0,00 0,00
Queue for Mechanism
Current Contents 46,67 46,80
Average Queuing Time 1.360,03 1.281,01
Minimum queue size 26,13 26,20
Maximum Queuing Time 6.904,86 6.636,77
Average queue size 40,15 40,42
St Dev of Queuing Time 1.982,10 1.895,04
Maximum queue size 48,27 48,60
Number of non zero queuing times 124,93 122,73 Items Entered 94,33 94,27
Queue for LoadingBeforeGlue 2
Current Contents 11,13 10,60
Minimum Queuing Time 8.727,74 8.751,27
Minimum queue size 0,00 0,00
Average Queuing Time 11.289,97 11.368,88
Average queue size 5,64 5,27
Maximum Queuing Time 16.595,99 16.627,22
Maximum queue size 19,00 19,00
St Dev of Queuing Time 2.066,22 2.091,90
Items Entered
126,07 126,07
Number of non zero queuing times 74,20 74,27
Minimum 0,00 0,00 RepeatMechani Working % 7,49 7,57

Page | 72
Queuing Time sm
Average Queuing Time 1.283,83 1.180,09
Mechanism Working % 92,51 92,43
Maximum Queuing Time
6.978,29 6.728,89
Number Completed Jobs 67,87 67,53
St Dev of Queuing Time 1.992,58 1.858,98
RepeatMechanism 2 Working % 6,00 5,92
Number of non zero queuing times 107,47 106,20
Mechanism 2 Working % 72,45 72,79
LoadingBeforeGlue Working %
9,37 9,37
Number Completed Jobs 52,73 53,00
Glue
Waiting % 39,03 40,45
Queue for Glass
Current Contents 27,07 26,00
Working % 53,01 53,06
Minimum queue size 9,40 8,67
Blocked % 7,96 6,49
Average queue size 26,74 26,15
Trim
Waiting % 28,79 28,75
Maximum queue size 41,60 40,80
Working % 71,21 71,25 Items Entered 84,00 86,67 Number Completed Jobs 133,20 133,27
Minimum Queuing Time 3.205,53 3.157,66
LoadingBeforeGlue 2
Working % 8,17 8,16
Average Queuing Time 9.044,02 8.879,04
Glue 2
Waiting % 46,41 47,92
Maximum Queuing Time 13.897,06 13.772,11
Working % 46,80 46,74
St Dev of Queuing Time 2.568,85 2.546,03
Blocked %
6,80 5,33
Number of non zero queuing times 72,40 72,07
Trim 2
Waiting % 37,23 37,22 CleanAndLoad Working % 12,98 12,99 Working % 62,77 62,78 Spacers Working % 18,19 18,18 Number Completed Jobs 117,47 117,53
Glass Working % 5,58 5,59
Queue for Trim
Minimum Queuing Time 90,00 90,00
SiliconeAndTiles Working % 18,89 18,91
Average Queuing Time 145,80 269,21
Battens Working % 26,89 26,84
Maximum Queuing Time 152,75 302,78
Transport Working % 17,47 17,49
St Dev of Queuing Time
12,20 58,33
Number Completed Jobs 112,13 111,80
Number of non zero queuing times 133,13 133,27
Work Complete 1
Number Completed 73,33 73,33

Page | 73
The results remain unchanged until the end of the second work position, as expected.
The average size of the “Queue for Loading before Glue” was slightly decreased by half
an item in both sets. The working percentage of the first gluing machine increased by
0,05% (62,43% as opposed to 62,38%), while the same measure decreased by 0,06% for
the second gluing machine (54,9% as opposed to 54,96%). The following results
remained practically unchanged. Based on the above, it is evident that such an
investment would not make a significant contribution to the system’s efficiency, as the
difference in the results was almost undetectable and should therefore be rejected
without further consideration.
Third scenario
The final question imposed by the management team derived once again from the low
utilization of the gluing and trimming machine. Due to the machines’ high electricity
and maintenance costs, the management would consider ceasing the operation of one
gluing and trimming if the production efficiency remained unaffected. A trial of 30 runs
was conducted to investigate this scenario (Scenario C) and the results are presented in
the following table (Table 6.3).
Table 6.3 Comparison between the baseline model and scenario C
Work center or queue
Performance Measure
Baseline model
Scenario C
Work center or queue
Performance Measure
Baseline model
Scenario C
Loading Profile Working % 22,80 22,80
Queue for Trim 2
Minimum Queuing Time 90,00 0,00
Saw
Working % 67,08 67,08 Average Queuing Time 144,13 0,00
Number Completed Jobs
583,27 583,27 Maximum Queuing Time 152,57 0,00
Queue Drain
Current Contents
27,73 27,73
St Dev of Queuing Time 14,79 0,00
Minimum queue size
9,60 9,60
Number of non zero queuing times 117,47 0,00
Average queue size 22,39 22,39
Queue Rubber
Current Contents 11,33 1,07
Maximum queue size 35,27 35,27
Minimum queue size 0,00 0,00
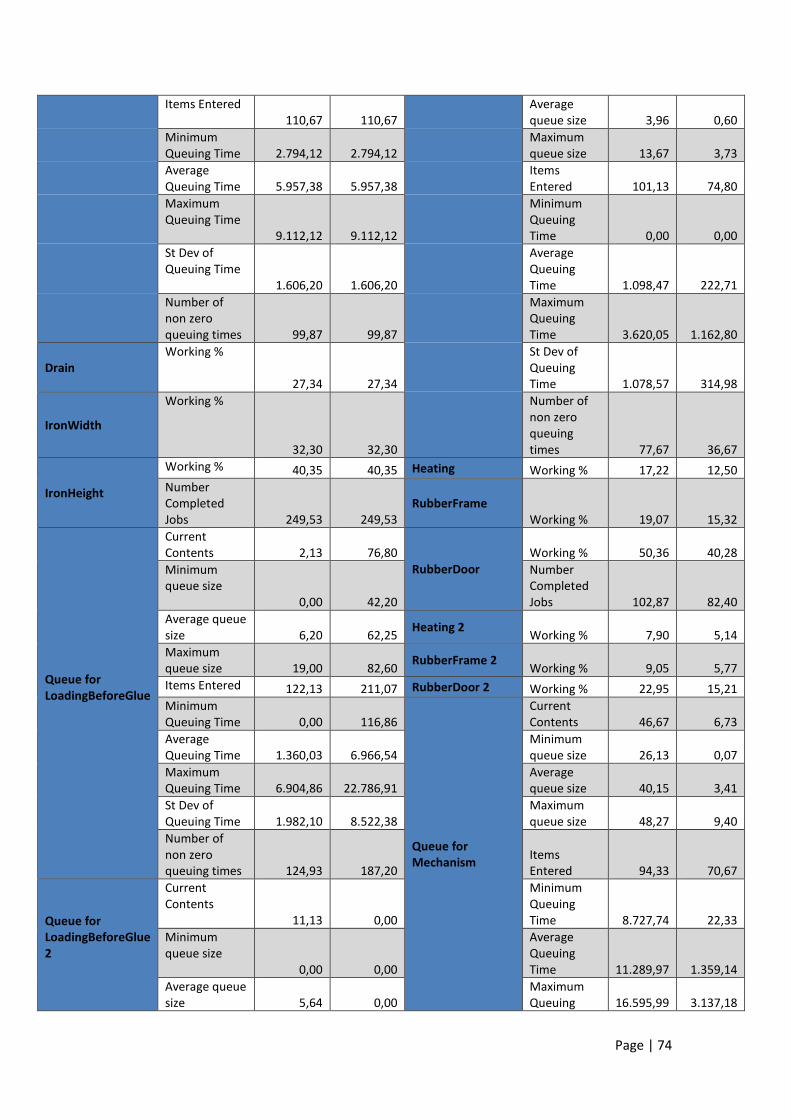
Page | 74
Items Entered 110,67 110,67
Average queue size 3,96 0,60
Minimum Queuing Time 2.794,12 2.794,12
Maximum queue size 13,67 3,73
Average Queuing Time 5.957,38 5.957,38
Items Entered 101,13 74,80
Maximum Queuing Time
9.112,12 9.112,12
Minimum Queuing Time 0,00 0,00
St Dev of Queuing Time
1.606,20 1.606,20
Average Queuing Time 1.098,47 222,71
Number of non zero queuing times 99,87 99,87
Maximum Queuing Time 3.620,05 1.162,80
Drain Working %
27,34 27,34
St Dev of Queuing Time 1.078,57 314,98
IronWidth
Working %
32,30 32,30
Number of non zero queuing times 77,67 36,67
IronHeight
Working % 40,35 40,35 Heating Working % 17,22 12,50 Number Completed Jobs 249,53 249,53
RubberFrame Working % 19,07 15,32
Queue for LoadingBeforeGlue
Current Contents 2,13 76,80
RubberDoor Working % 50,36 40,28
Minimum queue size
0,00 42,20
Number Completed Jobs 102,87 82,40
Average queue size 6,20 62,25
Heating 2 Working % 7,90 5,14
Maximum queue size 19,00 82,60
RubberFrame 2 Working % 9,05 5,77
Items Entered 122,13 211,07 RubberDoor 2 Working % 22,95 15,21 Minimum Queuing Time 0,00 116,86
Queue for Mechanism
Current Contents 46,67 6,73
Average Queuing Time 1.360,03 6.966,54
Minimum queue size 26,13 0,07
Maximum Queuing Time 6.904,86 22.786,91
Average queue size 40,15 3,41
St Dev of Queuing Time 1.982,10 8.522,38
Maximum queue size 48,27 9,40
Number of non zero queuing times 124,93 187,20
Items Entered 94,33 70,67
Queue for LoadingBeforeGlue 2
Current Contents
11,13 0,00
Minimum Queuing Time 8.727,74 22,33
Minimum queue size
0,00 0,00
Average Queuing Time 11.289,97 1.359,14
Average queue size 5,64 0,00
Maximum Queuing 16.595,99 3.137,18

Page | 75
Time
Maximum queue size
19,00 0,00
St Dev of Queuing Time 2.066,22 938,73
Items Entered
126,07 0,00
Number of non zero queuing times 74,20 62,73
Minimum Queuing Time 0,00 0,00
RepeatMechanism Working % 7,49 7,08
Average Queuing Time 1.283,83 0,00
Mechanism Working % 92,51 88,24
Maximum Queuing Time
6.978,29 0,00 Mechanism
Number Completed Jobs 67,87 65,13
St Dev of Queuing Time 1.992,58 0,00
RepeatMechanism 2 Working % 6,00 5,81
Number of non zero queuing times 107,47 0,00
Mechanism 2 Working % 72,45 68,50
LoadingBeforeGlue Working %
9,37 12,97
Number Completed Jobs 52,73 49,67
Glue
Waiting % 39,03 12,97
Queue for Glass
Current Contents 27,07 20,33
Working % 53,01 74,52
Minimum queue size 9,40 4,20
Blocked % 7,96 12,51
Average queue size 26,74 19,79
Trim
Waiting % 28,79 0,00
Maximum queue size 41,60 33,67
Working % 71,21 100,00
Items Entered 84,00 80,00
Number Completed Jobs 133,20 187,20
Minimum Queuing Time 3.205,53 1.792,57
LoadingBeforeGlue 2
Working %
8,17 0,00
Average Queuing Time 9.044,02 7.359,02
Glue 2
Waiting %
46,41 100,00
Maximum Queuing Time 13.897,06 12.191,47
Working %
46,80 0,00
St Dev of Queuing Time 2.568,85 2.573,63
Blocked %
6,80 0,00
Number of non zero queuing times 72,40 70,53
Trim 2
Waiting % 37,23 100,00 CleanAndLoad Working % 12,98 12,96 Working % 62,77 0,00 Spacers Working % 18,19 18,12 Number Completed Jobs 117,47 0,00
Glass Working % 5,58 5,55
Queue for Trim Minimum 90,00 143,45 SiliconeAndTiles Working % 18,89 18,86

Page | 76
Queuing Time
Average Queuing Time 145,80 148,98
Battens Working % 26,89 269,56
Maximum Queuing Time 152,75 152,90
Transport Working % 17,47 17,47
St Dev of Queuing Time
12,20 1,48
Number Completed Jobs 112,13 110,67
Number of non zero queuing times 133,13 187,20
Work Complete 1 Number Completed 73,33 66,67
Until the end of the second work position the results remained intact, as it would be
expected. The average queue size and queuing time before the one remaining gluing
machine was dramatically increased by 60 items and 1,55 hours respectively. The
utilization rate of the gluing machine was increased by 37,6% (87,48% as opposed to
62,38%), while at the same time the utilization of the trimming machine was
maximized to 100%. This modification negatively impacted on the process rate of the
third work position (187,2 as opposed to 250,66 items). Additionally, it also decreased
the utilization rate of all work positions following the modification and also decreased
the cumulative production line’s capacity by 6,7 items. After presenting the results, the
management decided that the negative impact of this modification exceeded the cost
saving resulting from discontinuing the gluing – trimming machine’s operation, thus
rejecting the scenario.
6.2 Solution for maximum utilization of the production line
After providing answers to the company’s management, regarding their suggested
modifications in the production line, this study aims to propose a solution that would
maximize the production lines’ utilization rate, while at the same time maintaining
queuing times at the same levels. This solution will be sought on a minimum cost basis,
meaning that modification of working position shifts would be preferred against
investments on new machinery.
The first objective was the full utilization of the two gluing and trimming machines,
which can be achieved through the provision of more work items by the previous work
position. To this direction a second employee was added on the second work position
(“Drain”), in order to feed the machine with more work items. This modification

Page | 77
decreased the utilization rate of the second work position by almost 50%, due to the
inadequate supply rate of work items. The results concerning the remaining work
positions remained largely unchanged. A trial of 30 runs was conducted to investigate
this scenario (Scenario D) and the results are presented in the following table (Table
6.4).
Table 6.4 Results of the baseline model compared to scenario D
Work position or queue
Performance Measures
Baseline model
Scenario D
Work position or queue
Performance Measures
Baseline model
Scenario D
Loading Profile
Working % 22,80 22,80
Queue for Trim 2
Minimum Queuing Time 90,00 90,00
Saw
Working % 67,08 67,08
Average Queuing Time 144,13 145,69
Number Completed Jobs 583,27 583,27
Maximum Queuing Time 152,57 152,66
Queue Drain
Current Contents 27,73 9,20
St Dev of Queuing Time 14,79 12,45
Minimum queue size
9,60 0,00
Number of non zero queuing times 117,47 137,33
Average queue size 22,39 4,70
Queue Rubber
Current Contents 11,33 14,53
Maximum queue size 35,27 18,00
Minimum queue size 0,00 0,00
Items Entered 110,67 110,67
Average queue size 3,96 5,59
Minimum Queuing Time 2.794,12 0,00
Maximum queue size 13,67 17,07
Average Queuing Time 5.957,38 1.217,51 Items Entered 101,13 105,33 Maximum Queuing Time 9.112,12 2.854,71
Minimum Queuing Time 0,00 0,00
St Dev of Queuing Time 1.606,20 82.469.031
Average Queuing Time 1.098,47 1.449,83
Number of non zero queuing times 99,87 93,13
Maximum Queuing Time 3.620,05 4.379,97
Drain Working %
27,34 14,22 St Dev of Queuing Time 1.078,57 1.293,96
IronWidth Working %
32,30 16,76
Number of non zero queuing times 77,67 87,80
IronHeight
Working % 40,35 20,81 Heating Working % 17,22 18,93 Number Completed Jobs 249,53 129,00
RubberFrame Working % 19,07 19,73
Queue for LoadingBefore Glue
Current Contents 2,13 9,67
RubberDoor Working % 50,36 51,57
Minimum 0,00 0,00 Number 102,87 105,27

Page | 78
queue size Completed Jobs
Average queue size 6,20 6,07
Heating 2 Working % 7,90 8,03
Maximum queue size 19,00 19,00
RubberFrame 2 Working % 9,05 9,64
Items Entered 122,13 132,33 RubberDoor 2 Working % 22,95 24,90 Minimum Queuing Time 0,00 0,00
Queue for Mechanism
Current Contents 46,67 57,20
Average Queuing Time 1.360,03 1.245,30
Minimum queue size 26,13 33,60
Maximum Queuing Time 6.904,86 6.925,57
Average queue size 40,15 50,47
St Dev of Queuing Time 1.982,10 1.937,79
Maximum queue size 48,27 58,73
Number of non zero queuing times 124,93 114,67 Items Entered 94,33 98,27
Queue for LoadingBefore Glue 2
Current Contents 11,13 1,53
Minimum Queuing Time 8.727,74 11.173,97
Minimum queue size 0,00 0,00
Average Queuing Time 11.289,97 13.506,26
Average queue size 5,64 6,23
Maximum Queuing Time 16.595,99 19.341,52
Maximum queue size 19,00 19,00
St Dev of Queuing Time 2.066,22 2.023,74
Items Entered
126,07 126,00
Number of non zero queuing times 74,20 75,13
Minimum Queuing Time 0,00 0,00
Repeat Mechanism Working % 7,49 7,25
Average Queuing Time 1.283,83 1.360,59
Mechanism Working % 92,51 92,75
Maximum Queuing Time
6.978,29 6.874,98
Number Completed Jobs 67,87 68,27
St Dev of Queuing Time 1.992,58 1.988,86
Repeat Mechanism 2 Working % 6,00 6,13
Number of non zero queuing times 107,47 126,80
Mechanism 2 Working % 72,45 72,89
LoadingBefore Glue
Working %
9,37 8,82
Number Completed Jobs 52,73 52,80
Glue
Waiting % 39,03 43,04
Repeat Mechanism 3 Working %
--- 0,00
Working % 53,01 49,76
Mechanism 3
Working % --- 0,00 Blocked %
7,96 7,20
Number Completed Jobs
---
0,00
Trim
Waiting % 28,79 33,39
Queue for Glass
Current Contents 27,07 28,40
Working % 71,21 66,61
Minimum queue size 9,40 10,67
Number 133,20 124,60 Average 26,74 27,24

Page | 79
Completed Jobs
queue size
LoadingBefore Glue 2
Working % 8,17 9,52
Maximum queue size 41,60 43,13
Glue 2
Working % 46,41 54,34 Items Entered 84,00 80,00 Waiting %
46,80 37,39 Minimum Queuing Time 3.205,53 3.947,78
Blocked % 6,80 8,27
Average Queuing Time 9.044,02 9.068,17
Trim 2
Waiting % 37,23 26,59
Maximum Queuing Time 13.897,06 13.607,56
Working % 62,77 73,41
St Dev of Queuing Time 2.568,85 2.411,47
Number Completed Jobs 117,47 137,73
Number of non zero queuing times 72,40 72,27
Queue for Trim
Minimum Queuing Time 90,00 90,00
CleanAndLoad Working % 12,98 13,01
Average Queuing Time 145,80 144,52
Spacers Working % 18,19 18,21
Maximum Queuing Time 152,75 152,84
Glass Working % 5,58 5,59
St Dev of Queuing Time 12,20 14,30
SiliconeAnd Tiles Working % 18,89 18,89
Number of non zero queuing times 133,13 124,80
Battens Working % 26,89 26,81
Transport
Working % 17,47 17,48 Number Completed Jobs 112,13 111,93
Work Complete 1
Number Completed 73,33 73,33
In an effort to resolve the inadequate supply of work items in the second work
position, a second employee was added to the first work position. Although this
modification led to the maximization of the first three work positions’ utilization rates,
the results concerning the remaining positions were negatively impacted. As these
positions were overfed, a number of bottlenecks were created, with the most
problematic one occurring before the gluing and trimming machines. While all other
bottlenecks can be addressed later on, this one is particularly troubling as both gluing
and trimming machines are utilized at the maximum of their capacity. A trial of 30 runs
was conducted to investigate this scenario (Scenario E) and the results are presented in
the following table (Table 6.5).

Page | 80
Table 6.5 Results of the baseline model compared to Scenario E
Work position or queue
Performance Measures
Baseline model
Scenario E
Work position or queue
Performance Measures
Baseline model
Scenario E
Loading Profile
Working % 22,80 66,98
Queue for Trim 2
Minimum Queuing Time 90,00 144,10
Saw
Working % 67,08 22,85
Average Queuing Time 144,13 148,96
Number Completed Jobs 583,27 582,47
Maximum Queuing Time 152,57 152,82
Queue Drain
Current Contents 27,73 37,33
St Dev of Queuing Time 14,79 1,47
Minimum queue size
9,60 16,93
Number of non zero queuing times 117,47 187,33
Average queue size 22,39 31,41
Queue Rubber
Current Contents 11,33 99,73
Maximum queue size 35,27 46,80
Minimum queue size 0,00 61,00
Items Entered 110,67 202,67
Average queue size 3,96 73,98
Minimum Queuing Time 2.794,12 2.354,35
Maximum queue size 13,67 100,13
Average Queuing Time 5.957,38 4.255,63 Items Entered 101,13 148,47 Maximum Queuing Time 9.112,12 6.170,93
Minimum Queuing Time 0,00 11.737,88
St Dev of Queuing Time 1.606,20 888,75
Average Queuing Time 1.098,47 13.428,60
Number of non zero queuing times 99,87 191,40
Maximum Queuing Time 3.620,05 18.447,43
Drain Working %
27,34 26,51 St Dev of Queuing Time 1.078,57 1.713,19
IronWidth Working %
32,30 31,32
Number of non zero queuing times 77,67 118,33
IronHeight
Working % 40,35 39,04 Heating Working % 17,22 19,89 Number Completed Jobs 249,53 241,67
RubberFrame Working % 19,07 21,77
Queue for LoadingBefore Glue
Current Contents 2,13 76,27
RubberDoor
Working % 50,36 58,33 Minimum queue size
0,00 45,33
Number Completed Jobs 102,87 118,87
Average queue size 6,20 65,43
Heating 2 Working % 7,90 10,50
Maximum queue size 19,00 84,80
RubberFrame 2 Working % 9,05 11,79
Items Entered 122,13 206,60 RubberDoor 2 Working % 22,95 30,09 Minimum Queuing Time 0,00 145,06
Queue for Mechanism
Current Contents 46,67 90,80

Page | 81
Average Queuing Time 1.360,03 7.438,57
Minimum queue size 26,13 52,67
Maximum Queuing Time 6.904,86 23.847,73
Average queue size 40,15 77,98
St Dev of Queuing Time 1.982,10 9.170,97
Maximum queue size 48,27 91,27
Number of non zero queuing times 124,93 187,33 Items Entered 94,33 112,67
Queue for LoadingBefore Glue 2
Current Contents 11,13 73,20
Minimum Queuing Time 8.727,74 16.779,01
Minimum queue size 0,00 41,60
Average Queuing Time 11.289,97 18.861,45
Average queue size 5,64 62,90
Maximum Queuing Time 16.595,99 23.394,02
Maximum queue size 19,00 81,87
St Dev of Queuing Time 2.066,22 1.361,36
Items Entered
126,07 211,60
Number of non zero queuing times 74,20 74,87
Minimum Queuing Time 0,00 126,46
Repeat Mechanism Working % 7,49 7,46
Average Queuing Time 1.283,83 7.187,35
Mechanism Working % 92,51 92,54
Maximum Queuing Time
6.978,29 23.144,96
Number Completed Jobs 67,87 68,13
St Dev of Queuing Time 1.992,58 8.834,82
Repeat Mechanism 2 Working % 6,00 5,89
Number of non zero queuing times 107,47 187,33
Mechanism 2 Working % 72,45 72,83
LoadingBefore Glue
Working %
9,37 12,94
Number Completed Jobs 52,73 52,67
Glue
Waiting % 39,03 12,94
Repeat Mechanism 3 Working %
--- 0,00
Working % 53,01 74,50
Mechanism 3
Working % --- 0,00 Blocked %
7,96 12,56
Number Completed Jobs
---
0,00
Trim
Waiting % 28,79 0,00
Queue for Glass
Current Contents 27,07 31,67
Working % 71,21 100,00
Minimum queue size 9,40 11,47
Number Completed Jobs 133,20 187,33
Average queue size 26,74 28,76
LoadingBefore Glue 2
Working % 8,17 13,16
Maximum queue size 41,60 45,20
Glue 2
Working % 46,41 74,51 Items Entered 84,00 82,67 Waiting %
46,80 13,16 Minimum Queuing Time 3.205,53 4.192,31
Blocked % 6,80 12,33
Average Queuing Time 9.044,02 9.618,90

Page | 82
Trim 2
Waiting % 37,23 0,00
Maximum Queuing Time 13.897,06 14.281,52
Working % 62,77 100,00
St Dev of Queuing Time 2.568,85 2.496,19
Number Completed Jobs 117,47 187,33
Number of non zero queuing times 72,40 72,07
Queue for Trim
Minimum Queuing Time 90,00 144,03
CleanAndLoad Working % 12,98 13,00
Average Queuing Time 145,80 148,98
Spacers Working % 18,19 18,25
Maximum Queuing Time 152,75 152,88
Glass Working % 5,58 5,60
St Dev of Queuing Time 12,20 1,48
SiliconeAnd Tiles Working % 18,89 18,96
Number of non zero queuing times 133,13 187,33
Battens Working % 26,89 26,75
Transport
Working % 17,47 17,45 Number Completed Jobs 112,13 111,73
Work Complete 1
Number Completed 73,33 76,00
In a quest for an optimal arrangement, a middle way solution was tested, where one
extra employee was scheduled to work the first half of his shift on the first work
position and at the remaining time in the second position. This solution proved to be
both cost efficient and optimal, due to the fact that it kept the maximum utilization
rate of the first three work positions, while at the same time eliminating the bottle
neck before the 3rd work position. The results of the 30 trial runs regarding this
scenario (Scenario F) are presented in the following table (Table 6.6).
Table 6.6 Results of the baseline model compared to Scenario F
Work position or queue
Performance Measures
Baseline model
Scenario F
Work position or queue
Performance Measures
Baseline model
Scenario F
Loading Profile
Working % 22,80 66,97
Queue for Trim 2
Minimum Queuing Time 90,00 125,98
Saw
Working % 67,08 22,94
Average Queuing Time 144,13 148,72
Number Completed Jobs 583,27 582,60
Maximum Queuing Time 152,57 152,80
Queue Drain
Current Contents 27,73 26,07
St Dev of Queuing Time 14,79 3,13
Minimum queue size 9,60 10,07
Number of non zero 117,47 186,13

Page | 83
queuing times
Average queue size 22,39 45,16
Queue Rubber
Current Contents 11,33 89,53
Maximum queue size 35,27 77,67
Minimum queue size 0,00 53,80
Items Entered 110,67 157,33
Average queue size 3,96 65,73
Minimum Queuing Time 2.794,12 1.934,97
Maximum queue size 13,67 90,13
Average Queuing Time 5.957,38 8.149,43 Items Entered 101,13 147,20 Maximum Queuing Time 9.112,12 11.150,38
Minimum Queuing Time 0,00 10.267,01
St Dev of Queuing Time 1.606,20 2.232,21
Average Queuing Time 1.098,47 12.006,29
Number of non zero queuing times 99,87 147,67
Maximum Queuing Time 3.620,05 17.089,68
Drain Working %
27,34 27,37 St Dev of Queuing Time 1.078,57 1.743,44
IronWidth Working %
32,30 32,26
Number of non zero queuing times 77,67 119,27
IronHeight
Working % 40,35 40,36 Heating Working % 17,22 19,89 Number Completed Jobs 249,53 249,13
RubberFrame Working % 19,07 22,25
Queue for LoadingBefore Glue
Current Contents 2,13 18,93
RubberDoor
Working % 50,36 57,87 Minimum queue size
0,00 0,67
Number Completed Jobs 102,87 118,07
Average queue size 6,20 14,88
Heating 2 Working % 7,90 10,59
Maximum queue size 19,00 29,60
RubberFrame 2 Working % 9,05 11,52
Items Entered 122,13 184,27 RubberDoor 2 Working % 22,95 30,21 Minimum Queuing Time 0,00 52,33
Queue for Mechanism
Current Contents 46,67 84,87
Average Queuing Time 1.360,03 2.210,60
Minimum queue size 26,13 46,40
Maximum Queuing Time 6.904,86 10.687,98
Average queue size 40,15 71,61
St Dev of Queuing Time 1.982,10 3.040,96
Maximum queue size 48,27 85,53
Number of non zero queuing times 124,93 183,27 Items Entered 94,33 113,00
Queue for LoadingBefore Glue 2
Current Contents 11,13 21,20
Minimum Queuing Time 8.727,74 15.117,84
Minimum queue size 0,00 0,93
Average Queuing Time 11.289,97 17.014,65
Average queue size 5,64 14,96
Maximum Queuing Time 16.595,99 22.286,30
Maximum 19,00 29,47 St Dev of 2.066,22 1.476,08

Page | 84
queue size Queuing Time
Items Entered
126,07 183,53
Number of non zero queuing times 74,20 75,13
Minimum Queuing Time 0,00 69,66
Repeat Mechanism Working % 7,49 7,40
Average Queuing Time 1.283,83 2.251,54
Mechanism Working % 92,51 92,60
Maximum Queuing Time
6.978,29 1.060,78
Number Completed Jobs 67,87 67,73
St Dev of Queuing Time 1.992,58 3.043,48
Repeat Mechanism 2 Working % 6,00 5,90
Number of non zero queuing times 107,47 185,27
Mechanism 2 Working % 72,45 72,98
LoadingBefore Glue
Working %
9,37 12,78
Number Completed Jobs 52,73 53,13
Glue
Waiting % 39,03 14,29
Repeat Mechanism 3 Working %
--- 0,00
Working % 53,01 73,51
Mechanism 3
Working % --- 0,00 Blocked %
7,96 12,20
Number Completed Jobs
---
0,00
Trim
Waiting % 28,79 1,33
Queue for Glass
Current Contents 27,07 27,27
Working % 71,21 98,67
Minimum queue size 9,40 10,07
Number Completed Jobs 133,20 184,87
Average queue size 26,74 27,20
LoadingBefore Glue 2
Working % 8,17 13,10
Maximum queue size 41,60 43,53
Glue 2
Working % 46,41 74,06 Items Entered 84,00 81,33 Waiting %
46,80 13,77 Minimum Queuing Time 3.205,53 3.931,16
Blocked % 6,80 12,16
Average Queuing Time 9.044,02 9.146,43
Trim 2
Waiting % 37,23 0,57
Maximum Queuing Time 13.897,06 13.589,36
Working % 62,77 99,43
St Dev of Queuing Time 2.568,85 2.353,31
Number Completed Jobs 117,47 186,13
Number of non zero queuing times 72,40 72,60
Queue for Trim
Minimum Queuing Time 90,00 115,95
CleanAndLoad Working % 12,98 12,95
Average Queuing Time 145,80 148,44
Spacers Working % 18,19 18,22
Maximum Queuing Time 152,75 152,90
Glass Working % 5,58 5,60
St Dev of Queuing Time 12,20 4,39
SiliconeAnd Tiles Working % 18,89 18,89
Number of 133,13 184,87 Battens Working % 26,89 26,91

Page | 85
non zero queuing times
Transport
Working % 17,47 17,44 Number Completed Jobs 112,13 112,20
Work Complete 1
Number Completed 73,33 70,67
To face the bottleneck created from forth work position to the end of the model, the
second employee assigned to the fourth position was arranged to remain there for the
entire shift instead of only the half. Although this arrangement resulted in the
elimination of the bottleneck, the position’s utilization rate decreased by 5,8% (94,2%
as opposed to 100% prior to the change). An additional modification concerning the
second employee assigned to the fifth work position was made. Although the
employee was also instructed to remain at this position for the entire shift, this
modification did not manage to counter balance the increased supply of the items from
the fourth work position. The results of the 30 trial runs regarding this scenario
(Scenario G) are presented in the following table (Table 6.7).
Table 6.7 Results of the baseline model compared to Scenario G
Work position or queue
Performance Measures
Baseline model
Scenario G
Work position or queue
Performance Measures
Baseline model
Scenario G
Loading Profile
Working % 22,80 66,97
Queue for Trim 2
Minimum Queuing Time 90,00 125,98
Saw
Working % 67,08 22,94
Average Queuing Time 144,13 148,72
Number Completed Jobs 583,27 582,60
Maximum Queuing Time 152,57 152,80
Queue Drain
Current Contents 27,73 26,07
St Dev of Queuing Time 14,79 3,13
Minimum queue size
9,60 10,07
Number of non zero queuing times 117,47 186,13
Average queue size 22,39 45,16
Queue Rubber
Current Contents 11,33 1,87
Maximum queue size 35,27 77,67
Minimum queue size 0,00 0,07
Items Entered 110,67 157,33
Average queue size 3,96 1,86
Minimum Queuing Time 2.794,12 1.934,97
Maximum queue size 13,67 6,13
Average Queuing Time 5.957,38 8.149,43 Items Entered 101,13 147,20

Page | 86
Maximum Queuing Time 9.112,12 11.150,38
Minimum Queuing Time 0,00 11,47
St Dev of Queuing Time 1.606,20 2.232,21
Average Queuing Time 1.098,47 354,37
Number of non zero queuing times 99,87 147,67
Maximum Queuing Time 3.620,05 1.080,21
Drain Working %
27,34 27,37 St Dev of Queuing Time 1.078,57 255,16
IronWidth Working %
32,30 32,26
Number of non zero queuing times 77,67 125,00
IronHeight
Working % 40,35 40,36 Heating Working % 17,22 18,81 Number Completed Jobs 249,53 249,13
RubberFrame Working % 19,07 20,76
Queue for LoadingBefore Glue
Current Contents 2,13 18,93
RubberDoor
Working % 50,36 54,71 Minimum queue size
0,00 0,67
Number Completed Jobs 102,87 111,73
Average queue size 6,20 14,88
Heating 2 Working % 7,90 19,46
Maximum queue size 19,00 29,60
RubberFrame 2 Working % 9,05 20,49
Items Entered 122,13 184,27 RubberDoor 2 Working % 22,95 542,53 Minimum Queuing Time 0,00 52,33
Queue for Mechanism
Current Contents 46,67 132,73
Average Queuing Time 1.360,03 2.210,60
Minimum queue size 26,13 79,73
Maximum Queuing Time 6.904,86 10.687,98
Average queue size 40,15 106,80
St Dev of Queuing Time 1.982,10 3.040,96
Maximum queue size 48,27 133,20
Number of non zero queuing times 124,93 183,27 Items Entered 94,33 137,27
Queue for LoadingBefore Glue 2
Current Contents 11,13 21,20
Minimum Queuing Time 8.727,74 16.198,72
Minimum queue size 0,00 0,93
Average Queuing Time 11.289,97 21.518,85
Average queue size 5,64 14,96
Maximum Queuing Time 16.595,99 26.865,08
Maximum queue size 19,00 29,47
St Dev of Queuing Time 2.066,22 3.065,37
Items Entered
126,07 183,53
Number of non zero queuing times 74,20 84,80
Minimum Queuing Time 0,00 69,66
Repeat Mechanism Working % 7,49 7,34
Average Queuing Time 1.283,83 2.251,54
Mechanism Working % 92,51 92,66
Maximum Queuing Time
6.978,29 1.060,78
Number Completed Jobs 67,87 68,27

Page | 87
St Dev of Queuing Time 1.992,58 3.043,48
Repeat Mechanism 2 Working % 6,00 7,66
Number of non zero queuing times 107,47 185,27
Mechanism 2 Working % 72,45 92,34
LoadingBefore Glue
Working %
9,37 12,78
Number Completed Jobs 52,73 67,13
Glue
Waiting % 39,03 14,29
Repeat Mechanism 3 Working %
--- 0,00
Working % 53,01 73,51
Mechanism 3
Working % --- 0,00 Blocked %
7,96 12,20
Number Completed Jobs
---
0,00
Trim
Waiting % 28,79 1,33
Queue for Glass
Current Contents 27,07 60,20
Working % 71,21 98,67
Minimum queue size 9,40 29,60
Number Completed Jobs 133,20 184,87
Average queue size 26,74 49,07
LoadingBefore Glue 2
Working % 8,17 13,10
Maximum queue size 41,60 67,93
Glue 2
Working % 46,41 74,06 Items Entered 84,00 96,00 Waiting %
46,80 13,77 Minimum Queuing Time 3.205,53 9.553,38
Blocked % 6,80 12,16
Average Queuing Time 9.044,02 14.640,56
Trim 2
Waiting % 37,23 0,57
Maximum Queuing Time 13.897,06 19.779,01
Working % 62,77 99,43
St Dev of Queuing Time 2.568,85 2.511,29
Number Completed Jobs 117,47 186,13
Number of non zero queuing times 72,40 71,93
Queue for Trim
Minimum Queuing Time 90,00 115,95
CleanAndLoad Working % 12,98 12,97
Average Queuing Time 145,80 148,44
Spacers Working % 18,19 18,21
Maximum Queuing Time 152,75 152,90
Glass Working % 5,58 5,59
St Dev of Queuing Time 12,20 4,39
SiliconeAnd Tiles Working % 18,89 18,95
Number of non zero queuing times 133,13 184,87
Battens Working % 26,89 26,77
Transport
Working % 17,47 17,50 Number Completed Jobs 112,13 111,93
Work Complete 1
Number Completed 73,33 65,33

Page | 88
In an effort to increase the utilization rate of the fourth work position, an alternative
arrangement was tested. The second employee working at the fourth position was
instructed to stay 75% of the shift instead of the initial arrangement of 50%, while the
second employee of the fifth work position was instructed to remain at his position for
the entire shift. Furthermore, an additional employee was added to the workforce,
instructed spent the first half of the shift in work position 5 and the remaining time at
the final position. This modification had an impressive impact on the system’s results.
The utilization rate of all work positions reached almost 100%, the queue times and
sizes remained at the levels recorded prior to any change and the production capacity
rose by 32 items or 43,65 %. The results of the 30 trial runs regarding this scenario
(Scenario H) are presented in the following table (Table 6.8).
Table 6.8 Results of the baseline model compared to Scenario H
Work position or queue
Performance Measures
Baseline model
Scenario H
Work position or queue
Performance Measures
Baseline model
Scenario H
Loading Profile
Working % 22,80 66,97
Queue for Trim 2
Minimum Queuing Time 90,00 125,98
Saw
Working % 67,08 22,94
Average Queuing Time 144,13 148,72
Number Completed Jobs 583,27 582,60
Maximum Queuing Time 152,57 152,80
Queue Drain
Current Contents 27,73 26,07
St Dev of Queuing Time 14,79 3,13
Minimum queue size
9,60 10,07
Number of non zero queuing times 117,47 186,13
Average queue size 22,39 45,16
Queue Rubber
Current Contents 11,33 37,67
Maximum queue size 35,27 77,67
Minimum queue size 0,00 18,00
Items Entered 110,67 157,33
Average queue size 3,96 26,02
Minimum Queuing Time 2.794,12 1.934,97
Maximum queue size 13,67 38,07
Average Queuing Time 5.957,38 8.149,43 Items Entered 101,13 147,20 Maximum Queuing Time 9.112,12 11.150,38
Minimum Queuing Time 0,00 3.528,00
St Dev of Queuing Time 1.606,20 2.232,21
Average Queuing Time 1.098,47 4.850,37
Number of non zero queuing times 99,87 147,67
Maximum Queuing Time 3.620,05 7.066,22
Drain Working %
27,34 27,37 St Dev of Queuing Time 1.078,57 699,86
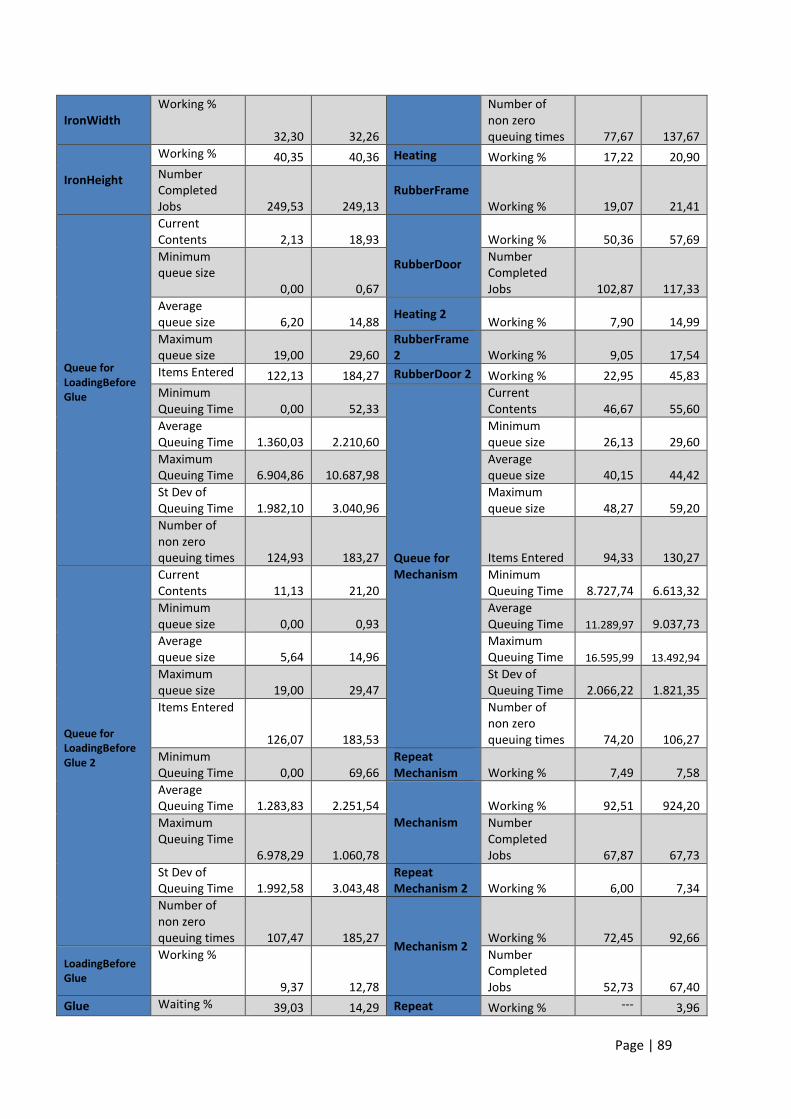
Page | 89
IronWidth Working %
32,30 32,26
Number of non zero queuing times 77,67 137,67
IronHeight
Working % 40,35 40,36 Heating Working % 17,22 20,90 Number Completed Jobs 249,53 249,13
RubberFrame Working % 19,07 21,41
Queue for LoadingBefore Glue
Current Contents 2,13 18,93
RubberDoor
Working % 50,36 57,69 Minimum queue size
0,00 0,67
Number Completed Jobs 102,87 117,33
Average queue size 6,20 14,88
Heating 2 Working % 7,90 14,99
Maximum queue size 19,00 29,60
RubberFrame 2 Working % 9,05 17,54
Items Entered 122,13 184,27 RubberDoor 2 Working % 22,95 45,83 Minimum Queuing Time 0,00 52,33
Queue for Mechanism
Current Contents 46,67 55,60
Average Queuing Time 1.360,03 2.210,60
Minimum queue size 26,13 29,60
Maximum Queuing Time 6.904,86 10.687,98
Average queue size 40,15 44,42
St Dev of Queuing Time 1.982,10 3.040,96
Maximum queue size 48,27 59,20
Number of non zero queuing times 124,93 183,27 Items Entered 94,33 130,27
Queue for LoadingBefore Glue 2
Current Contents 11,13 21,20
Minimum Queuing Time 8.727,74 6.613,32
Minimum queue size 0,00 0,93
Average Queuing Time 11.289,97 9.037,73
Average queue size 5,64 14,96
Maximum Queuing Time 16.595,99 13.492,94
Maximum queue size 19,00 29,47
St Dev of Queuing Time 2.066,22 1.821,35
Items Entered
126,07 183,53
Number of non zero queuing times 74,20 106,27
Minimum Queuing Time 0,00 69,66
Repeat Mechanism Working % 7,49 7,58
Average Queuing Time 1.283,83 2.251,54
Mechanism Working % 92,51 924,20
Maximum Queuing Time
6.978,29 1.060,78
Number Completed Jobs 67,87 67,73
St Dev of Queuing Time 1.992,58 3.043,48
Repeat Mechanism 2 Working % 6,00 7,34
Number of non zero queuing times 107,47 185,27
Mechanism 2 Working % 72,45 92,66
LoadingBefore Glue
Working %
9,37 12,78
Number Completed Jobs 52,73 67,40
Glue Waiting % 39,03 14,29 Repeat Working % --- 3,96

Page | 90
Mechanism 3
Working % 53,01 73,51
Mechanism 3
Working % --- 49,13 Blocked %
7,96 12,20
Number Completed Jobs
---
35,80
Trim
Waiting % 28,79 1,33
Queue for Glass
Current Contents 27,07 24,27
Working % 71,21 98,67
Minimum queue size 9,40 8,87
Number Completed Jobs 133,20 184,87
Average queue size 26,74 34,08
LoadingBefore Glue 2
Working % 8,17 13,10
Maximum queue size 41,60 56,87
Glue 2
Working % 46,41 74,06 Items Entered 84,00 117,33 Waiting %
46,80 13,77 Minimum Queuing Time 3.205,53 2.712,08
Blocked % 6,80 12,16
Average Queuing Time 9.044,02 8.433,98
Trim 2
Waiting % 37,23 0,57
Maximum Queuing Time 13.897,06 11.759,56
Working % 62,77 99,43
St Dev of Queuing Time 2.568,85 2.056,97
Number Completed Jobs 117,47 186,13
Number of non zero queuing times 72,40 106,27
Queue for Trim
Minimum Queuing Time 90,00 115,95
CleanAndLoad Working % 12,98 12,97
Average Queuing Time 145,80 148,44
Spacers Working % 18,19 18,14
Maximum Queuing Time 152,75 152,90
Glass Working % 5,58 5,57
St Dev of Queuing Time 12,20 4,39
SiliconeAnd Tiles Working % 18,89 18,87
Number of non zero queuing times 133,13 184,87
Battens Working % 26,89 26,98
Transport
Working % 17,47 17,47 Number Completed Jobs 112,13 112,07
Work Complete 1
Number Completed 73,33 105,33
The results presented above lead to the conclusion that this arrangement is optimal for
the production line in question. The additional workforce needed is two employees as
the two additional hours required from the second employees at work positions four
and five can be covered by the employees of the secondary production line. It should
be noted that the production line currently operates 12 days monthly. The suggested

Page | 91
arrangement increases the production capacity by 43,65%, meaning that it can deliver
an amount of items equivalent to that produced in 17,24 days of operation using the
current production line arrangement. In other words, if the company’s management
decides to maintain the same number of products that are produced monthly, the
proposed arrangement could allow the production line to operate five days less, while
still delivering the same amount of products, saving significant variable costs.
The entire simulation of the proposed production line arrangement is presented in the
following picture (Figure 6.1).

Page | 92
Figure 6.1 The entire simulation model of the proposed production line arrangement

Page | 93
Chapter 7
DISCUSSION
This Chapter provides a summary of the previous Chapters, while at the same time
discussing any limitations that might apply to this thesis. Finally, it concludes with
suggestions for possible further research that would contribute to the expansion of this
thesis’ applications.
More particularly, Subchapter 7.1 (Summary and conclusions) provides a brief
recapitulation of the thesis, with an emphasis on the contribution of the suggested
alterations on the production efficiency. The following Subchapter 7.2 (Limitations of
the study) discusses issues that might have a negative effect on the accuracy of the
simulation model, while finally Subchapter 7.3 (Future work) suggests future research
directions.
Figure 7.0: Schematic representation of the content of Chapter 7

Page | 94
7.1 Summary and conclusions
This study aimed to analyze the synthetic window frame main production line of Synco
S.A., in order to evaluate the current situation and seek alternative production line
arrangements that would improve the system’s efficiency. The methodology chosen for
this study was computer software simulation, due to the stochasticity of the individual
processes taking place as well as the systems’ complexity. The discrete event
simulation package Simul8 was chosen, after an extended analysis of the user
requirements, technical characteristics and vendor’s reliability. The package’s
characteristics, which include user friendly environment, access to source code,
advanced result gathering system and a vendor with strong academic and business
presence, make it an ideal candidate for the purposes of this study.
Extended interviews with the shareholders, production manager and employees were
conducted, combined with an entire month of data gathering through observation, in
an effort to accurately model the system. The exact statistical distributions for the
process taking place at each position were calculated with the help of stat::fit
(www.germs.com), also used as the main inputs of the system. After extensive trials,
results regarding the main work centers and queues were collected. The analysis of the
results indicated low queuing times and sizes, a good utilization rate and - most
importantly - a steady flow of work items. However, there was significant room for
improvement, which was the basis for the quest of an optimal arrangement of the
production line. Prior to this investigation, the study provided answers to the
management team’s “what – if” scenarios regarding some changes in the production
line that were too costly or too risky to implement. Conclusively, results were provided
rejecting the scenarios before implemented them with negative consequences. The
quest of the optimal arrangement of the production line was conducted in two axes,
the full utilization of the system’s capabilities and the minimization of cost. Following a
series of experiments conducted based each time on the results of the prior
experiment, a conclusion was drawn that an addition of two employees with an
advanced shift pattern would result in a 43,65% increase of production capacity. This
arrangement could save a significant amount of production’s variable cost, leading to
bigger profits and a smoother passage though the current Greek economic recession.

Page | 95
As demonstrated above, the managerial implications deriving from this study can have
a significant impact on the plant’s production efficiency. Both the answers to questions
imposed by management and the quest for the maximization of the production line’s
efficiency aspire to make a significant contribution to the optimization processes
regarding the window frame industry in general.
7.2 Limitations of the study
There are three main limitations regarding this study.
1. The frequent change of prioritization
Throughout the shift the prioritization of items is frequently changed from the classic
FIFO approach to a custom based one. This mainly happens in an effort to catch up
with the arrival dates of demanding customers, a possible new tight scheduled order or
an unexpected event that disrupted the order of the work items.
2. Secondary products in the main production line
Most of the secondary products like main entrances or parallel window frames pass
through at least one work position of the main production line, which disrupts the flow
of main products through the main product line.
3. Window frames needing further process
After passing through the final work position some items may need further process in
the secondary production line, depending on several additional options available to the
customers, such as the addition of an electric shutter.
7.3 Future work
This study can be significantly improved by the addition of the secondary production
line. The limited time available for the completion of the present study, did not allow
the inclusion of the secondary production line. The secondary production line is
characterized by less automation and increased levels of hand craftsmanship, due to
the process of highly customized items. These features increase the levels of
complexity and stochasticity, making their simulation attempt very time consuming.

Page | 96
Apart from the inclusion of the secondary production line, the ability to change work
items’ prioritization would result in the simulation of the company’s production line to
its full extent.
In conclusion, to our knowledge this study is the first attempt – at least on a national
level - to investigate the optimization of the synthetic window frame production and
could provide a baseline upon which future studies can rely on for further
investigation.

Page | 97
Bibliography
Benedettini, O., Tjahjono, B. (2008) Towards an improved tool to facilitate simulation
modeling of complex manufacturing systems. International Journal of Advanced
Manufacturing Technology 43 (1/2), pp. 191–199.
Centeno, M. A. (1996) An Introduction to Simulation Modeling. Proceedings of the 1996
Winter Simulation Conference, pp. 15-21.
Chung, C. (2004) Simulation Modeling Handbook a practical approach, Florida: CRC
Press.
Clark, D.N. (1999) Strategic level MS/OR tool usage in the United Kingdom and New
Zealand: a comparative survey. Asia-Pacific Journal of Operational Research 16(1), pp.
35–51.
Estremadoyro, D.N., Farrington, P.A., Schroer, B.J., Swain, J.J. (1997) Simulation of
memory chip line using an electronics manufacturing simulator. Proceedings of the
1997 Winter Simulation Conference, pp. 1330-1337.
Fildes, R., Ranyard, J.C (1997) Success and survival of operational research groups – a
review. Journal of the Operational Research Society 48(4), pp. 336–360.
Harling, J. (1958) Simulation techniques in operations research – A review. Operations
Research 6, pp. 309-317.
Harmonosky, C.M., Miller, J.L., Rosen, S.L., Traband, M.T., Tillotson, R., Robbie, D.
(1999) Interfacing simulation with costing software to drive the transformation from
prototype manufacturing to high volume manufacturing. Proceedings of the 1999
Winter Simulation Conference, pp. 1359-1364.
Jeffrey, P., Seaton, R. (1995) The use of operational research tools: a survey of
operational research practitioners in the UK. Journal of the Operational Research
Society 46(7), pp. 797–808.
Page | 98
Law, A.M., McComas, M.G. (1998) Simulation of manufacturing systems. Proceedings of
the 1998 Winter Simulation Conference, pp. 49-52.
Maria, A. (1997) Introduction to Modeling and Simulation. Proceedings of the 1997
Mazziotti, B., Horne, R. (1997) Creating a flexible, simulation-based finite scheduling
tool. Proceedings of the 1997 Winter Simulation Conference, pp. 853-860.
Melton, R. ,Culbreth, C.T., Roberts, S.D., Joine, J.A. (2001) Using automation for
finishing room capacity planning. Proceedings of the 2001 Winter Simulation
Conference, pp. 959-967.
Robinson, S. (2003) Simulation the practice of model development and use, London:
John Wiley & Sons.
Robinson, S., Higton, N. (1995) Computer simulation for quality and reliability
engineering. Quality and Reliability Engineering International 11, pp. 371–377.
Rose, O. (1998) WIP evolution of a semiconductor factory after a bottleneck
workcenter breakdown. Proceedings of the 1998 Winter Simulation Conference, pp.
997-1003.
Shannon, R.E. (1975) Systems Simulation: The Art and Science, NJ: Prentice-Hall.
Springfield, K., Hall, J. D., Bell, G. W. (1999) Analysis of electronics assembly operations:
longbow hellfire missile power supply. Proceedings of the 1999 Winter Simulation
Conference, pp. 689-693.
Williams, E.J., Gevaert, A. (1997) Pallet optimization and throughput estimation via
simulation. Proceedings of the 1997 Winter Simulation Conference, pp. 744 -749.
Winter Simulation Conference, pp. 7-14.

Page | 99
Appendix
RAW DATA RECORDS
Table A.1 The last 1000 orders used for statistical analysis
Τύπος κουφώµατος Πλάτος Ύψος Χρώµα
Τύπος κουφώµατος Πλάτος Ύψος Χρώµα
∆ΙΦΥΛΛΑ 1546 2060 ΛΕΥΚΟ ∆ΙΦΥΛΛΑ 1490 2117 016 ΜΕΣΑ ΕΞΩ
ΜΟΝΟΦΥΛΛΑ 1034 2089 ΛΕΥΚΟ ∆ΙΦΥΛΛΑ 1550 2117 016 ΜΕΣΑ ΕΞΩ
ΜΟΝΟΦΥΛΛΑ 1224 1168 ΛΕΥΚΟ ∆ΙΦΥΛΛΑ 1543 2127 016 ΜΕΣΑ ΕΞΩ
∆ΙΦΥΛΛΑ 1502 2067 028 ΜΕΣΑ ΕΞΩ ∆ΙΦΥΛΛΑ 1715 1094 016 ΜΕΣΑ ΕΞΩ
∆ΙΦΥΛΛΑ 1250 1031 028 ΜΕΣΑ ΕΞΩ ∆ΙΦΥΛΛΑ 1348 2092 016 ΜΕΣΑ ΕΞΩ
∆ΙΦΥΛΛΑ 1575 1365 ΛΕΥΚΟ ∆ΙΦΥΛΛΑ 1350 2110 016 ΜΕΣΑ ΕΞΩ
∆ΙΦΥΛΛΑ 1375 2215 ΛΕΥΚΟ ∆ΙΦΥΛΛΑ 1350 2112 016 ΜΕΣΑ ΕΞΩ
∆ΙΦΥΛΛΑ 1380 2215 ΛΕΥΚΟ ∆ΙΦΥΛΛΑ 1064 2074 028 ΜΕΣΑ ΕΞΩ
∆ΙΦΥΛΛΑ 1374 1280 ΛΕΥΚΟ ∆ΙΦΥΛΛΑ 1164 1273 028 ΜΕΣΑ ΕΞΩ
∆ΙΦΥΛΛΑ 1384 1290 ΛΕΥΚΟ ∆ΙΦΥΛΛΑ 1152 1304 028 ΜΕΣΑ ΕΞΩ
∆ΙΦΥΛΛΑ 1558 1280 ΛΕΥΚΟ ∆ΙΦΥΛΛΑ 1064 2087 028 ΜΕΣΑ ΕΞΩ
∆ΙΦΥΛΛΑ 1285 1210 ΛΕΥΚΟ ∆ΙΦΥΛΛΑ 1168 1175 028 ΜΕΣΑ ΕΞΩ
∆ΙΦΥΛΛΑ 1600 2090 ΛΕΥΚΟ ∆ΙΦΥΛΛΑ 1238 1195 028 ΜΕΣΑ ΕΞΩ
∆ΙΦΥΛΛΑ 1190 2150 ΛΕΥΚΟ ∆ΙΦΥΛΛΑ 1254 1217 028 ΜΕΣΑ ΕΞΩ
∆ΙΦΥΛΛΑ 1235 2080 ΛΕΥΚΟ ∆ΙΦΥΛΛΑ 980 1305 032 ΜΕΣΑ ΕΞΩ
∆ΙΦΥΛΛΑ 1250 2080 ΛΕΥΚΟ ∆ΙΦΥΛΛΑ 1264 1265 032 ΜΕΣΑ ΕΞΩ
∆ΙΦΥΛΛΑ 1855 2001 ΛΕΥΚΟ ∆ΙΦΥΛΛΑ 1250 1260 032 ΜΕΣΑ ΕΞΩ
∆ΙΦΥΛΛΑ 1852 2003 ΛΕΥΚΟ ∆ΙΦΥΛΛΑ 1250 2128 032 ΜΕΣΑ ΕΞΩ
∆ΙΦΥΛΛΑ 1851 2005 ΛΕΥΚΟ ∆ΙΦΥΛΛΑ 1240 2150 032 ΜΕΣΑ ΕΞΩ
∆ΙΦΥΛΛΑ 1280 2090 ΛΕΥΚΟ ∆ΙΦΥΛΛΑ 1250 2145 032 ΜΕΣΑ ΕΞΩ
ΜΟΝΟΦΥΛΛΑ 954 530 028 ΜΕΣΑ ΕΞΩ ∆ΙΦΥΛΛΑ 1380 1050 ΛΕΥΚΟ ΜΟΝΟΦΥΛΛΑ 905 989 028 ΜΕΣΑ ΕΞΩ ∆ΙΦΥΛΛΑ 1180 1330 ΛΕΥΚΟ ΜΟΝΟΦΥΛΛΑ 549 815 028 ΜΕΣΑ ΕΞΩ ∆ΙΦΥΛΛΑ 1100 998 ΛΕΥΚΟ ΜΟΝΟΦΥΛΛΑ 714 497 028 ΜΕΣΑ ΕΞΩ ∆ΙΦΥΛΛΑ 1154 2090 ΛΕΥΚΟ ΜΟΝΟΦΥΛΛΑ 770 2080 ΛΕΥΚΟ ∆ΙΦΥΛΛΑ 1154 2125 ΛΕΥΚΟ ΜΟΝΟΦΥΛΛΑ 795 620 ΛΕΥΚΟ ∆ΙΦΥΛΛΑ 1250 2110 ΛΕΥΚΟ ΜΟΝΟΦΥΛΛΑ 803 545 ΛΕΥΚΟ ∆ΙΦΥΛΛΑ 1220 2090 ΛΕΥΚΟ ΜΟΝΟΦΥΛΛΑ 800 995 ΛΕΥΚΟ ∆ΙΦΥΛΛΑ 1640 1995 ΛΕΥΚΟ ΜΟΝΟΦΥΛΛΑ 880 2150 ΛΕΥΚΟ ∆ΙΦΥΛΛΑ 1580 1195 ΛΕΥΚΟ ΜΟΝΟΦΥΛΛΑ 500 590 ΛΕΥΚΟ ∆ΙΦΥΛΛΑ 1170 1155 ΛΕΥΚΟ ΜΟΝΟΦΥΛΛΑ 350 560 ΛΕΥΚΟ ∆ΙΦΥΛΛΑ 1245 2105 ΛΕΥΚΟ
∆ΙΦΥΛΛΑ 1602 2092 ΛΕΥΚΟ ΜΟΝΟΦΥΛΛΑ 1870 1210 016 ΜΕΣΑ ΕΞΩ
∆ΙΦΥΛΛΑ 1565 1166 ΛΕΥΚΟ ΜΟΝΟΦΥΛΛΑ 468 548 028 ΜΕΣΑ ΕΞΩ
∆ΙΦΥΛΛΑ 1555 2083 ΛΕΥΚΟ ΜΟΝΟΦΥΛΛΑ 563 593 028 ΜΕΣΑ ΕΞΩ
∆ΙΦΥΛΛΑ 1558 2093 ΛΕΥΚΟ ΜΟΝΟΦΥΛΛΑ 830 2135 032 ΜΕΣΑ

Page | 100
ΕΞΩ
∆ΙΦΥΛΛΑ 1580 2091 ΛΕΥΚΟ ΜΟΝΟΦΥΛΛΑ 685 435 032 ΜΕΣΑ ΕΞΩ
∆ΙΦΥΛΛΑ 1575 2078 ΛΕΥΚΟ ΜΟΝΟΦΥΛΛΑ 910 827 ΛΕΥΚΟ ΜΟΝΟΦΥΛΛΑ 522 605 ΛΕΥΚΟ ΜΟΝΟΦΥΛΛΑ 580 780 ΛΕΥΚΟ ΜΟΝΟΦΥΛΛΑ 901 1017 ΛΕΥΚΟ ΜΟΝΟΦΥΛΛΑ 479 962 ΛΕΥΚΟ ∆ΙΦΥΛΛΑ 1182 1360 ΛΕΥΚΟ ΜΟΝΟΦΥΛΛΑ 435 530 ΛΕΥΚΟ ∆ΙΦΥΛΛΑ 1385 2318 ΛΕΥΚΟ ΜΟΝΟΦΥΛΛΑ 870 2105 ΛΕΥΚΟ ∆ΙΦΥΛΛΑ 1392 2315 ΛΕΥΚΟ ΜΟΝΟΦΥΛΛΑ 835 2023 ΛΕΥΚΟ ∆ΙΦΥΛΛΑ 1485 2318 ΛΕΥΚΟ ΜΟΝΟΦΥΛΛΑ 717 813 ΛΕΥΚΟ ΜΟΝΟΦΥΛΛΑ 660 660 ΛΕΥΚΟ ΜΟΝΟΦΥΛΛΑ 305 650 ΛΕΥΚΟ
ΜΟΝΟΦΥΛΛΑ 660 650 ΛΕΥΚΟ ΣΤΑΘΕΡΑ 500 2155 016 ΜΕΣΑ ΕΞΩ
ΜΟΝΟΦΥΛΛΑ 660 655 ΛΕΥΚΟ ΣΤΑΘΕΡΑ 500 2155 016 ΜΕΣΑ ΕΞΩ
ΜΟΝΟΦΥΛΛΑ 970 1157 ΛΕΥΚΟ ΣΤΑΘΕΡΑ 449 1418 ΛΕΥΚΟ ΜΟΝΟΦΥΛΛΑ 970 2315 ΛΕΥΚΟ ΣΤΑΘΕΡΑ 450 1418 ΛΕΥΚΟ ΜΟΝΟΦΥΛΛΑ 770 1155 ΛΕΥΚΟ ΣΤΑΘΕΡΑ 197 402 ΛΕΥΚΟ
ΣΤΑΘΕΡΑ 850 2249 ΛΕΥΚΟ ∆ΙΦΥΛΛΑ 1235 1215 028 ΜΕΣΑ ΕΞΩ
ΣΤΑΘΕΡΑ 410 1012 ΛΕΥΚΟ ∆ΙΦΥΛΛΑ 1099 2123 ΛΕΥΚΟ ΣΤΑΘΕΡΑ 400 1003 ΛΕΥΚΟ ∆ΙΦΥΛΛΑ 1020 1080 ΛΕΥΚΟ ∆ΙΦΥΛΛΑ 1484 2118 ΛΕΥΚΟ ∆ΙΦΥΛΛΑ 1267 2133 ΛΕΥΚΟ ΜΟΝΟΦΥΛΛΑ 754 2073 ΛΕΥΚΟ ∆ΙΦΥΛΛΑ 1280 2143 ΛΕΥΚΟ ∆ΙΦΥΛΛΑ 1044 1290 ΛΕΥΚΟ ∆ΙΦΥΛΛΑ 1267 2118 ΛΕΥΚΟ ∆ΙΦΥΛΛΑ 1279 2115 ΛΕΥΚΟ ∆ΙΦΥΛΛΑ 1235 1437 ΛΕΥΚΟ ∆ΙΦΥΛΛΑ 1014 1297 ΛΕΥΚΟ ∆ΙΦΥΛΛΑ 1340 1410 ΛΕΥΚΟ ∆ΙΦΥΛΛΑ 884 1145 ΛΕΥΚΟ ∆ΙΦΥΛΛΑ 825 1010 ΛΕΥΚΟ ΜΟΝΟΦΥΛΛΑ 480 451 ΛΕΥΚΟ ∆ΙΦΥΛΛΑ 1114 2132 ΛΕΥΚΟ ∆ΙΦΥΛΛΑ 1166 2177 ΛΕΥΚΟ ΜΟΝΟΦΥΛΛΑ 580 620 ΛΕΥΚΟ ∆ΙΦΥΛΛΑ 1174 2177 ΛΕΥΚΟ ΜΟΝΟΦΥΛΛΑ 770 912 ΛΕΥΚΟ ∆ΙΦΥΛΛΑ 1581 2174 ΛΕΥΚΟ ΜΟΝΟΦΥΛΛΑ 595 875 ΛΕΥΚΟ
∆ΙΦΥΛΛΑ 1393 1962 ΛΕΥΚΟ ∆ΙΦΥΛΛΑ 1030 858 032 ΜΕΣΑ ΕΞΩ
∆ΙΦΥΛΛΑ 1417 1973 ΛΕΥΚΟ ∆ΙΦΥΛΛΑ 1103 1178 032 ΜΕΣΑ ΕΞΩ
∆ΙΦΥΛΛΑ 1918 1955 ΛΕΥΚΟ ∆ΙΦΥΛΛΑ 1371 1780 032 ΜΕΣΑ ΕΞΩ
∆ΙΦΥΛΛΑ 1312 996 ΛΕΥΚΟ ∆ΙΦΥΛΛΑ 1378 1143 032 ΜΕΣΑ ΕΞΩ
∆ΙΦΥΛΛΑ 1350 2375 ΛΕΥΚΟ ∆ΙΦΥΛΛΑ 1397 1109 032 ΜΕΣΑ ΕΞΩ
∆ΙΦΥΛΛΑ 1365 1475 ΛΕΥΚΟ ∆ΙΦΥΛΛΑ 1351 2100 ΛΕΥΚΟ ∆ΙΦΥΛΛΑ 1370 1478 ΛΕΥΚΟ ∆ΙΦΥΛΛΑ 1369 2072 ΛΕΥΚΟ ∆ΙΦΥΛΛΑ 1372 2374 ΛΕΥΚΟ ∆ΙΦΥΛΛΑ 1363 2095 ΛΕΥΚΟ
∆ΙΦΥΛΛΑ 1370 1478 ΛΕΥΚΟ ΜΟΝΟΦΥΛΛΑ 991 1762 032 ΜΕΣΑ ΕΞΩ
∆ΙΦΥΛΛΑ 1150 1350 ΛΕΥΚΟ ΜΟΝΟΦΥΛΛΑ 942 1772 032 ΜΕΣΑ ΕΞΩ
∆ΙΦΥΛΛΑ 1180 1195 ΛΕΥΚΟ ΜΟΝΟΦΥΛΛΑ 414 405 032 ΜΕΣΑ ΕΞΩ
∆ΙΦΥΛΛΑ 800 1440 ΛΕΥΚΟ ΜΟΝΟΦΥΛΛΑ 314 574 ΛΕΥΚΟ ∆ΙΦΥΛΛΑ 1100 1350 ΛΕΥΚΟ ΜΟΝΟΦΥΛΛΑ 869 2080 ΛΕΥΚΟ
∆ΙΦΥΛΛΑ 1155 2177 ΛΕΥΚΟ ΣΤΑΘΕΡΑ 1004 1178 032 ΜΕΣΑ ΕΞΩ
∆ΙΦΥΛΛΑ 1090 1160 ΛΕΥΚΟ ∆ΙΦΥΛΛΑ 1534 1294 028 ΜΕΣΑ ΕΞΩ
∆ΙΦΥΛΛΑ 1290 2127 ΛΕΥΚΟ ∆ΙΦΥΛΛΑ 1385 1102 032 ΜΕΣΑ ΕΞΩ
∆ΙΦΥΛΛΑ 1742 1297 ΛΕΥΚΟ ∆ΙΦΥΛΛΑ 1385 1102 032 ΜΕΣΑ ΕΞΩ
∆ΙΦΥΛΛΑ 1290 2107 ΛΕΥΚΟ ∆ΙΦΥΛΛΑ 1290 1882 032 ΜΕΣΑ ΕΞΩ
∆ΙΦΥΛΛΑ 1272 1037 ΛΕΥΚΟ ∆ΙΦΥΛΛΑ 1385 1102 032 ΜΕΣΑ ΕΞΩ

Page | 101
∆ΙΦΥΛΛΑ 1287 2077 ΛΕΥΚΟ ∆ΙΦΥΛΛΑ 1290 1892 032 ΜΕΣΑ ΕΞΩ
∆ΙΦΥΛΛΑ 1278 2087 ΛΕΥΚΟ ∆ΙΦΥΛΛΑ 1464 2025 ΛΕΥΚΟ ∆ΙΦΥΛΛΑ 1275 2255 ΛΕΥΚΟ ∆ΙΦΥΛΛΑ 1462 1110 ΛΕΥΚΟ ∆ΙΦΥΛΛΑ 1275 2265 ΛΕΥΚΟ ∆ΙΦΥΛΛΑ 1465 1102 ΛΕΥΚΟ ∆ΙΦΥΛΛΑ 1275 2210 ΛΕΥΚΟ ∆ΙΦΥΛΛΑ 1166 2042 ΛΕΥΚΟ ∆ΙΦΥΛΛΑ 1280 2215 ΛΕΥΚΟ ∆ΙΦΥΛΛΑ 1458 1112 ΛΕΥΚΟ ΜΟΝΟΦΥΛΛΑ 1034 2072 016 ΜΕΣΑ ΕΞΩ ∆ΙΦΥΛΛΑ 1343 1240 ΛΕΥΚΟ ΜΟΝΟΦΥΛΛΑ 1500 1130 028 ΜΕΣΑ ΕΞΩ ∆ΙΦΥΛΛΑ 1345 1235 ΛΕΥΚΟ ΜΟΝΟΦΥΛΛΑ 666 836 ΛΕΥΚΟ ∆ΙΦΥΛΛΑ 1423 2140 ΛΕΥΚΟ ΜΟΝΟΦΥΛΛΑ 605 613 ΛΕΥΚΟ ∆ΙΦΥΛΛΑ 1305 1050 ΛΕΥΚΟ ΜΟΝΟΦΥΛΛΑ 615 470 ΛΕΥΚΟ ∆ΙΦΥΛΛΑ 1145 2052 ΛΕΥΚΟ ΜΟΝΟΦΥΛΛΑ 470 470 ΛΕΥΚΟ ∆ΙΦΥΛΛΑ 1480 1233 ΛΕΥΚΟ ΜΟΝΟΦΥΛΛΑ 600 825 ΛΕΥΚΟ ∆ΙΦΥΛΛΑ 1619 2083 ΛΕΥΚΟ ΜΟΝΟΦΥΛΛΑ 553 825 ΛΕΥΚΟ ∆ΙΦΥΛΛΑ 1356 2095 ΛΕΥΚΟ ΜΟΝΟΦΥΛΛΑ 1170 750 ΛΕΥΚΟ ∆ΙΦΥΛΛΑ 1340 1230 ΛΕΥΚΟ ΜΟΝΟΦΥΛΛΑ 720 885 ΛΕΥΚΟ ∆ΙΦΥΛΛΑ 1040 1339 ΛΕΥΚΟ ΜΟΝΟΦΥΛΛΑ 692 664 ΛΕΥΚΟ ∆ΙΦΥΛΛΑ 1040 1339 ΛΕΥΚΟ
ΜΟΝΟΦΥΛΛΑ 580 1195 ΛΕΥΚΟ ΜΟΝΟΦΥΛΛΑ 1003 1292 028 ΜΕΣΑ ΕΞΩ
∆ΙΦΥΛΛΑ 1239 2100 ΛΕΥΚΟ ΜΟΝΟΦΥΛΛΑ 640 390 028 ΜΕΣΑ ΕΞΩ
∆ΙΦΥΛΛΑ 1247 2071 ΛΕΥΚΟ ΜΟΝΟΦΥΛΛΑ 760 2027 ΛΕΥΚΟ ∆ΙΦΥΛΛΑ 1143 1288 ΛΕΥΚΟ ΜΟΝΟΦΥΛΛΑ 755 783 ΛΕΥΚΟ ∆ΙΦΥΛΛΑ 1238 2090 ΛΕΥΚΟ ΜΟΝΟΦΥΛΛΑ 572 830 ΛΕΥΚΟ ∆ΙΦΥΛΛΑ 1255 2110 ΛΕΥΚΟ ΜΟΝΟΦΥΛΛΑ 572 830 ΛΕΥΚΟ ΜΟΝΟΦΥΛΛΑ 937 1223 032 ΜΕΣΑ ΕΞΩ ΜΟΝΟΦΥΛΛΑ 964 2355 ΛΕΥΚΟ ΜΟΝΟΦΥΛΛΑ 505 1233 032 ΜΕΣΑ ΕΞΩ ΜΟΝΟΦΥΛΛΑ 870 977 ΛΕΥΚΟ ΜΟΝΟΦΥΛΛΑ 839 2108 ΛΕΥΚΟ ΜΟΝΟΦΥΛΛΑ 615 900 ΛΕΥΚΟ
∆ΙΦΥΛΛΑ 1625 1132 032 ΜΕΣΑ ΕΞΩ ∆ΙΦΥΛΛΑ 958 911 032 ΜΕΣΑ ΕΞΩ
∆ΙΦΥΛΛΑ 1620 2082 032 ΜΕΣΑ ΕΞΩ ∆ΙΦΥΛΛΑ 1662 1260 ΛΕΥΚΟ ∆ΙΦΥΛΛΑ 1625 2077 032 ΜΕΣΑ ΕΞΩ ∆ΙΦΥΛΛΑ 1612 1260 ΛΕΥΚΟ ∆ΙΦΥΛΛΑ 1083 887 032 ΜΕΣΑ ΕΞΩ ∆ΙΦΥΛΛΑ 1659 1260 ΛΕΥΚΟ ∆ΙΦΥΛΛΑ 1620 2062 032 ΜΕΣΑ ΕΞΩ ∆ΙΦΥΛΛΑ 1674 1260 ΛΕΥΚΟ ∆ΙΦΥΛΛΑ 963 1140 032 ΜΕΣΑ ΕΞΩ ΜΟΝΟΦΥΛΛΑ 839 2080 ΛΕΥΚΟ ∆ΙΦΥΛΛΑ 1170 1132 ΛΕΥΚΟ ΜΟΝΟΦΥΛΛΑ 814 2078 ΛΕΥΚΟ ∆ΙΦΥΛΛΑ 1175 1122 ΛΕΥΚΟ ΜΟΝΟΦΥΛΛΑ 1036 2066 ΛΕΥΚΟ ∆ΙΦΥΛΛΑ 925 1112 ΛΕΥΚΟ ΜΟΝΟΦΥΛΛΑ 983 882 ΛΕΥΚΟ ∆ΙΦΥΛΛΑ 900 1187 ΛΕΥΚΟ ΜΟΝΟΦΥΛΛΑ 987 883 ΛΕΥΚΟ ∆ΙΦΥΛΛΑ 920 1157 ΛΕΥΚΟ ΜΟΝΟΦΥΛΛΑ 1029 860 ΛΕΥΚΟ ∆ΙΦΥΛΛΑ 1035 1200 ΛΕΥΚΟ ∆ΙΦΥΛΛΑ 1480 1200 ΛΕΥΚΟ ∆ΙΦΥΛΛΑ 1025 1037 ΛΕΥΚΟ ΜΟΝΟΦΥΛΛΑ 420 480 ΛΕΥΚΟ
∆ΙΦΥΛΛΑ 1362 993 ΛΕΥΚΟ ∆ΙΦΥΛΛΑ 1202 1444 016 ΜΕΣΑ ΕΞΩ
∆ΙΦΥΛΛΑ 1704 1983 ΛΕΥΚΟ ∆ΙΦΥΛΛΑ 1207 1444 016 ΜΕΣΑ ΕΞΩ
∆ΙΦΥΛΛΑ 1325 2004 ΛΕΥΚΟ ∆ΙΦΥΛΛΑ 1402 1441 016 ΜΕΣΑ ΕΞΩ
∆ΙΦΥΛΛΑ 1334 2005 ΛΕΥΚΟ ∆ΙΦΥΛΛΑ 1402 1434 016 ΜΕΣΑ ΕΞΩ
∆ΙΦΥΛΛΑ 1010 1023 ΛΕΥΚΟ ∆ΙΦΥΛΛΑ 1422 2220 016 ΜΕΣΑ ΕΞΩ
∆ΙΦΥΛΛΑ 1469 1950 ΛΕΥΚΟ ∆ΙΦΥΛΛΑ 1288 460 016 ΜΕΣΑ ΕΞΩ
∆ΙΦΥΛΛΑ 1431 1972 ΛΕΥΚΟ ∆ΙΦΥΛΛΑ 1282 460 016 ΜΕΣΑ ΕΞΩ
∆ΙΦΥΛΛΑ 1420 987 ΛΕΥΚΟ ∆ΙΦΥΛΛΑ 1128 492 016 ΜΕΣΑ ΕΞΩ
∆ΙΦΥΛΛΑ 1580 972 ΛΕΥΚΟ ∆ΙΦΥΛΛΑ 1126 495 016 ΜΕΣΑ ΕΞΩ
ΜΟΝΟΦΥΛΛΑ 580 695 032 ΜΕΣΑ ΕΞΩ ∆ΙΦΥΛΛΑ 1302 1164 016 ΜΕΣΑ ΕΞΩ
ΜΟΝΟΦΥΛΛΑ 1030 877 032 ΜΕΣΑ ΕΞΩ ∆ΙΦΥΛΛΑ 1330 2107 028 ΜΕΣΑ
Page | 102
ΕΞΩ
ΜΟΝΟΦΥΛΛΑ 580 645 032 ΜΕΣΑ ΕΞΩ ∆ΙΦΥΛΛΑ 1625 1277 028 ΜΕΣΑ ΕΞΩ
ΜΟΝΟΦΥΛΛΑ 800 1187 032 ΜΕΣΑ ΕΞΩ ∆ΙΦΥΛΛΑ 1200 1185 028 ΜΕΣΑ ΕΞΩ
ΜΟΝΟΦΥΛΛΑ 895 2180 032 ΜΕΣΑ ΕΞΩ ∆ΙΦΥΛΛΑ 1360 1320 028 ΜΕΣΑ ΕΞΩ
ΜΟΝΟΦΥΛΛΑ 960 862 032 ΜΕΣΑ ΕΞΩ ∆ΙΦΥΛΛΑ 1225 1483 032 ΜΕΣΑ ΕΞΩ
ΜΟΝΟΦΥΛΛΑ 580 872 ΛΕΥΚΟ ∆ΙΦΥΛΛΑ 1225 1085 032 ΜΕΣΑ ΕΞΩ
ΜΟΝΟΦΥΛΛΑ 550 505 ΛΕΥΚΟ ∆ΙΦΥΛΛΑ 1234 1475 032 ΜΕΣΑ ΕΞΩ
ΜΟΝΟΦΥΛΛΑ 970 2210 ΛΕΥΚΟ ∆ΙΦΥΛΛΑ 1225 1480 032 ΜΕΣΑ ΕΞΩ
ΜΟΝΟΦΥΛΛΑ 535 525 ΛΕΥΚΟ ∆ΙΦΥΛΛΑ 1375 2284 032 ΜΕΣΑ ΕΞΩ
ΜΟΝΟΦΥΛΛΑ 715 690 ΛΕΥΚΟ ∆ΙΦΥΛΛΑ 1225 1485 032 ΜΕΣΑ ΕΞΩ
ΜΟΝΟΦΥΛΛΑ 360 1010 ΛΕΥΚΟ ∆ΙΦΥΛΛΑ 1500 2260 ΛΕΥΚΟ ΜΟΝΟΦΥΛΛΑ 360 1017 ΛΕΥΚΟ ∆ΙΦΥΛΛΑ 1855 1165 ΛΕΥΚΟ ΜΟΝΟΦΥΛΛΑ 360 1013 ΛΕΥΚΟ ∆ΙΦΥΛΛΑ 1264 2193 ΛΕΥΚΟ ΣΤΑΘΕΡΑ 1555 1792 032 ΜΕΣΑ ΕΞΩ ∆ΙΦΥΛΛΑ 1256 2183 ΛΕΥΚΟ ΣΤΑΘΕΡΑ 1990 1730 032 ΜΕΣΑ ΕΞΩ ∆ΙΦΥΛΛΑ 1264 2203 ΛΕΥΚΟ ΣΤΑΘΕΡΑ 360 1010 ΛΕΥΚΟ ∆ΙΦΥΛΛΑ 1344 1173 ΛΕΥΚΟ ΣΤΑΘΕΡΑ 360 1010 ΛΕΥΚΟ ∆ΙΦΥΛΛΑ 1256 1199 ΛΕΥΚΟ ΣΤΑΘΕΡΑ 360 1017 ΛΕΥΚΟ ∆ΙΦΥΛΛΑ 1415 1877 ΛΕΥΚΟ ΣΤΑΘΕΡΑ 360 1017 ΛΕΥΚΟ ∆ΙΦΥΛΛΑ 1144 2084 ΛΕΥΚΟ ΣΤΑΘΕΡΑ 360 1013 ΛΕΥΚΟ ∆ΙΦΥΛΛΑ 1144 2084 ΛΕΥΚΟ ΣΤΑΘΕΡΑ 360 1013 ΛΕΥΚΟ ∆ΙΦΥΛΛΑ 939 1245 ΛΕΥΚΟ ∆ΙΦΥΛΛΑ 1298 2044 ΛΕΥΚΟ ∆ΙΦΥΛΛΑ 1144 1240 ΛΕΥΚΟ ∆ΙΦΥΛΛΑ 1685 2213 ΛΕΥΚΟ ∆ΙΦΥΛΛΑ 1172 2090 ΛΕΥΚΟ ∆ΙΦΥΛΛΑ 1460 2170 ΛΕΥΚΟ ∆ΙΦΥΛΛΑ 1165 2091 ΛΕΥΚΟ ∆ΙΦΥΛΛΑ 1470 2180 ΛΕΥΚΟ ∆ΙΦΥΛΛΑ 1220 1237 ΛΕΥΚΟ ∆ΙΦΥΛΛΑ 1470 2200 ΛΕΥΚΟ ∆ΙΦΥΛΛΑ 920 1080 ΛΕΥΚΟ ∆ΙΦΥΛΛΑ 1290 2223 ΛΕΥΚΟ ∆ΙΦΥΛΛΑ 1390 1110 ΛΕΥΚΟ ∆ΙΦΥΛΛΑ 1185 2205 ΛΕΥΚΟ ∆ΙΦΥΛΛΑ 1310 2012 ΛΕΥΚΟ ∆ΙΦΥΛΛΑ 1360 2220 ΛΕΥΚΟ ∆ΙΦΥΛΛΑ 1340 2017 ΛΕΥΚΟ ∆ΙΦΥΛΛΑ 1400 2225 ΛΕΥΚΟ ∆ΙΦΥΛΛΑ 1305 2007 ΛΕΥΚΟ ΜΟΝΟΦΥΛΛΑ 465 685 ΛΕΥΚΟ ∆ΙΦΥΛΛΑ 1315 2007 ΛΕΥΚΟ ΜΟΝΟΦΥΛΛΑ 1385 2053 ΛΕΥΚΟ ∆ΙΦΥΛΛΑ 905 1055 ΛΕΥΚΟ ΜΟΝΟΦΥΛΛΑ 870 955 ΛΕΥΚΟ ∆ΙΦΥΛΛΑ 1365 2092 ΛΕΥΚΟ ΣΤΑΘΕΡΑ 1385 2053 ΛΕΥΚΟ ∆ΙΦΥΛΛΑ 1365 2067 ΛΕΥΚΟ ∆ΙΦΥΛΛΑ 1602 2283 016 ΜΕΣΑ ΕΞΩ ∆ΙΦΥΛΛΑ 1365 2092 ΛΕΥΚΟ ∆ΙΦΥΛΛΑ 1080 1242 028 ΜΕΣΑ ΕΞΩ ∆ΙΦΥΛΛΑ 1465 1159 ΛΕΥΚΟ ∆ΙΦΥΛΛΑ 1350 1087 032 ΜΕΣΑ ΕΞΩ ∆ΙΦΥΛΛΑ 1465 1159 ΛΕΥΚΟ ∆ΙΦΥΛΛΑ 1342 1085 032 ΜΕΣΑ ΕΞΩ ∆ΙΦΥΛΛΑ 1180 800 ΛΕΥΚΟ ∆ΙΦΥΛΛΑ 1235 1437 032 ΜΕΣΑ ΕΞΩ ∆ΙΦΥΛΛΑ 850 906 ΛΕΥΚΟ ∆ΙΦΥΛΛΑ 1340 1410 032 ΜΕΣΑ ΕΞΩ ∆ΙΦΥΛΛΑ 1070 2134 ΛΕΥΚΟ ∆ΙΦΥΛΛΑ 1185 1037 032 ΜΕΣΑ ΕΞΩ ∆ΙΦΥΛΛΑ 1070 2134 ΛΕΥΚΟ ∆ΙΦΥΛΛΑ 1190 1047 032 ΜΕΣΑ ΕΞΩ ∆ΙΦΥΛΛΑ 1070 2134 ΛΕΥΚΟ ∆ΙΦΥΛΛΑ 1280 1992 032 ΜΕΣΑ ΕΞΩ ∆ΙΦΥΛΛΑ 1070 2134 ΛΕΥΚΟ ∆ΙΦΥΛΛΑ 1290 1177 032 ΜΕΣΑ ΕΞΩ ∆ΙΦΥΛΛΑ 1070 2134 ΛΕΥΚΟ ∆ΙΦΥΛΛΑ 1290 1177 032 ΜΕΣΑ ΕΞΩ ∆ΙΦΥΛΛΑ 1062 1372 ΛΕΥΚΟ ∆ΙΦΥΛΛΑ 1352 1015 032 ΜΕΣΑ ΕΞΩ ∆ΙΦΥΛΛΑ 1070 950 ΛΕΥΚΟ ∆ΙΦΥΛΛΑ 1120 1047 032 ΜΕΣΑ ΕΞΩ ∆ΙΦΥΛΛΑ 1812 2395 ΛΕΥΚΟ ∆ΙΦΥΛΛΑ 1090 887 032 ΜΕΣΑ ΕΞΩ ∆ΙΦΥΛΛΑ 1250 1010 ΛΕΥΚΟ
∆ΙΦΥΛΛΑ 1390 1537 067/267 ΦΟΛΙ ΜΕΣΑ ΕΞΩ ∆ΙΦΥΛΛΑ 1539 2060 ΛΕΥΚΟ
∆ΙΦΥΛΛΑ 1200 1000 067/267 ΦΟΛΙ ΜΕΣΑ ΕΞΩ ∆ΙΦΥΛΛΑ 1539 2060 ΛΕΥΚΟ
∆ΙΦΥΛΛΑ 1396 2212 ΛΕΥΚΟ ∆ΙΦΥΛΛΑ 1538 2075 ΛΕΥΚΟ

Page | 103
∆ΙΦΥΛΛΑ 1410 2227 ΛΕΥΚΟ ∆ΙΦΥΛΛΑ 1305 2075 ΛΕΥΚΟ ∆ΙΦΥΛΛΑ 1052 2264 ΛΕΥΚΟ ∆ΙΦΥΛΛΑ 1300 2070 ΛΕΥΚΟ
∆ΙΦΥΛΛΑ 1052 2250 ΛΕΥΚΟ ΜΟΝΟΦΥΛΛΑ 1007 2222 016 ΜΕΣΑ ΕΞΩ
∆ΙΦΥΛΛΑ 1008 2222 ΛΕΥΚΟ ΜΟΝΟΦΥΛΛΑ 904 2204 016 ΜΕΣΑ ΕΞΩ
∆ΙΦΥΛΛΑ 1040 2236 ΛΕΥΚΟ ΜΟΝΟΦΥΛΛΑ 770 2235 016 ΜΕΣΑ ΕΞΩ
∆ΙΦΥΛΛΑ 1040 2236 ΛΕΥΚΟ ΜΟΝΟΦΥΛΛΑ 1007 500 016 ΜΕΣΑ ΕΞΩ
∆ΙΦΥΛΛΑ 960 1280 ΛΕΥΚΟ ΜΟΝΟΦΥΛΛΑ 404 1206 016 ΜΕΣΑ ΕΞΩ
∆ΙΦΥΛΛΑ 1369 1226 ΛΕΥΚΟ ΜΟΝΟΦΥΛΛΑ 980 2045 016 ΜΕΣΑ ΕΞΩ
∆ΙΦΥΛΛΑ 1161 2085 ΛΕΥΚΟ ΜΟΝΟΦΥΛΛΑ 785 737 032 ΜΕΣΑ ΕΞΩ
∆ΙΦΥΛΛΑ 1414 1001 ΛΕΥΚΟ ΜΟΝΟΦΥΛΛΑ 766 2113 ΛΕΥΚΟ ∆ΙΦΥΛΛΑ 1164 2135 ΛΕΥΚΟ ΜΟΝΟΦΥΛΛΑ 795 1192 ΛΕΥΚΟ ∆ΙΦΥΛΛΑ 1144 2098 ΛΕΥΚΟ ΜΟΝΟΦΥΛΛΑ 644 1330 ΛΕΥΚΟ ∆ΙΦΥΛΛΑ 1157 2096 ΛΕΥΚΟ ΜΟΝΟΦΥΛΛΑ 960 2060 ΛΕΥΚΟ ∆ΙΦΥΛΛΑ 1354 2088 ΛΕΥΚΟ ΜΟΝΟΦΥΛΛΑ 735 1117 ΛΕΥΚΟ ∆ΙΦΥΛΛΑ 1200 1100 ΛΕΥΚΟ ΜΟΝΟΦΥΛΛΑ 1480 855 ΛΕΥΚΟ ∆ΙΦΥΛΛΑ 1170 2100 ΛΕΥΚΟ ΜΟΝΟΦΥΛΛΑ 942 2150 ΛΕΥΚΟ ∆ΙΦΥΛΛΑ 1175 2100 ΛΕΥΚΟ ΜΟΝΟΦΥΛΛΑ 560 832 ΛΕΥΚΟ ∆ΙΦΥΛΛΑ 1045 2188 ΛΕΥΚΟ ΜΟΝΟΦΥΛΛΑ 673 1485 ΛΕΥΚΟ ∆ΙΦΥΛΛΑ 1040 1205 ΛΕΥΚΟ ΜΟΝΟΦΥΛΛΑ 664 1187 ΛΕΥΚΟ ∆ΙΦΥΛΛΑ 1084 2070 ΛΕΥΚΟ ΜΟΝΟΦΥΛΛΑ 690 847 ΛΕΥΚΟ ∆ΙΦΥΛΛΑ 1157 2085 ΛΕΥΚΟ ΜΟΝΟΦΥΛΛΑ 370 390 ΛΕΥΚΟ
∆ΙΦΥΛΛΑ 1398 2277 ΛΕΥΚΟ ΣΤΑΘΕΡΑ 1406 1397 016 ΜΕΣΑ ΕΞΩ
∆ΙΦΥΛΛΑ 1245 2143 ΛΕΥΚΟ ΣΤΑΘΕΡΑ 902 2208 016 ΜΕΣΑ ΕΞΩ
∆ΙΦΥΛΛΑ 1240 2180 ΛΕΥΚΟ ΣΤΑΘΕΡΑ 699 698 028 ΜΕΣΑ ΕΞΩ
∆ΙΦΥΛΛΑ 1238 2184 ΛΕΥΚΟ ΣΤΑΘΕΡΑ 699 2150 028 ΜΕΣΑ ΕΞΩ
∆ΙΦΥΛΛΑ 1367 922 ΛΕΥΚΟ ΣΤΑΘΕΡΑ 1098 698 028 ΜΕΣΑ ΕΞΩ
∆ΙΦΥΛΛΑ 1146 2164 ΛΕΥΚΟ ΣΤΑΘΕΡΑ 913 698 028 ΜΕΣΑ ΕΞΩ
∆ΙΦΥΛΛΑ 1178 852 ΛΕΥΚΟ ΣΤΑΘΕΡΑ 913 2150 028 ΜΕΣΑ ΕΞΩ
∆ΙΦΥΛΛΑ 948 1050 ΛΕΥΚΟ ΣΤΑΘΕΡΑ 914 698 028 ΜΕΣΑ ΕΞΩ
∆ΙΦΥΛΛΑ 1178 1386 ΛΕΥΚΟ ΣΤΑΘΕΡΑ 914 2150 028 ΜΕΣΑ ΕΞΩ
∆ΙΦΥΛΛΑ 1046 1344 ΛΕΥΚΟ ΣΤΑΘΕΡΑ 1630 705 032 ΜΕΣΑ ΕΞΩ
∆ΙΦΥΛΛΑ 948 1372 ΛΕΥΚΟ ΣΤΑΘΕΡΑ 416 2396 ΛΕΥΚΟ ∆ΙΦΥΛΛΑ 948 1360 ΛΕΥΚΟ ΣΤΑΘΕΡΑ 416 2396 ΛΕΥΚΟ ∆ΙΦΥΛΛΑ 1160 1030 ΛΕΥΚΟ ∆ΙΦΥΛΛΑ 1269 2040 ΛΕΥΚΟ ∆ΙΦΥΛΛΑ 1370 2172 ΛΕΥΚΟ ∆ΙΦΥΛΛΑ 1258 2065 ΛΕΥΚΟ ∆ΙΦΥΛΛΑ 1345 2152 ΛΕΥΚΟ ∆ΙΦΥΛΛΑ 1274 2105 ΛΕΥΚΟ ∆ΙΦΥΛΛΑ 1360 2162 ΛΕΥΚΟ ∆ΙΦΥΛΛΑ 1275 2083 ΛΕΥΚΟ ∆ΙΦΥΛΛΑ 1340 1150 ΛΕΥΚΟ ΜΟΝΟΦΥΛΛΑ 514 1927 ΛΕΥΚΟ
ΜΟΝΟΦΥΛΛΑ 770 802 028 ΜΕΣΑ ΕΞΩ ∆ΙΦΥΛΛΑ 1300 1330 028 ΜΕΣΑ ΕΞΩ
ΜΟΝΟΦΥΛΛΑ 800 882 028 ΜΕΣΑ ΕΞΩ ∆ΙΦΥΛΛΑ 1020 1364 028 ΜΕΣΑ ΕΞΩ
ΜΟΝΟΦΥΛΛΑ 760 872 032 ΜΕΣΑ ΕΞΩ ∆ΙΦΥΛΛΑ 1095 2140 028 ΜΕΣΑ ΕΞΩ
ΜΟΝΟΦΥΛΛΑ 790 1992 032 ΜΕΣΑ ΕΞΩ ∆ΙΦΥΛΛΑ 980 1380 028 ΜΕΣΑ ΕΞΩ
ΜΟΝΟΦΥΛΛΑ 764 2087 ΛΕΥΚΟ ∆ΙΦΥΛΛΑ 860 1380 028 ΜΕΣΑ ΕΞΩ
ΜΟΝΟΦΥΛΛΑ 756 2063 ΛΕΥΚΟ ∆ΙΦΥΛΛΑ 1300 1345 028 ΜΕΣΑ ΕΞΩ

Page | 104
ΜΟΝΟΦΥΛΛΑ 685 680 ΛΕΥΚΟ ∆ΙΦΥΛΛΑ 1433 2051 032 ΜΕΣΑ ΕΞΩ
ΜΟΝΟΦΥΛΛΑ 525 375 ΛΕΥΚΟ ∆ΙΦΥΛΛΑ 1344 2047 032 ΜΕΣΑ ΕΞΩ
ΜΟΝΟΦΥΛΛΑ 685 887 ΛΕΥΚΟ ∆ΙΦΥΛΛΑ 1343 2029 032 ΜΕΣΑ ΕΞΩ
ΜΟΝΟΦΥΛΛΑ 645 1095 ΛΕΥΚΟ ∆ΙΦΥΛΛΑ 1524 2036 032 ΜΕΣΑ ΕΞΩ
ΜΟΝΟΦΥΛΛΑ 690 685 ΛΕΥΚΟ ∆ΙΦΥΛΛΑ 1534 2063 032 ΜΕΣΑ ΕΞΩ
ΜΟΝΟΦΥΛΛΑ 570 902 ΛΕΥΚΟ ∆ΙΦΥΛΛΑ 1260 1960 ΛΕΥΚΟ ΜΟΝΟΦΥΛΛΑ 560 902 ΛΕΥΚΟ ∆ΙΦΥΛΛΑ 1367 2040 ΛΕΥΚΟ ΜΟΝΟΦΥΛΛΑ 550 902 ΛΕΥΚΟ ∆ΙΦΥΛΛΑ 1365 2065 ΛΕΥΚΟ ΜΟΝΟΦΥΛΛΑ 550 902 ΛΕΥΚΟ ∆ΙΦΥΛΛΑ 1355 2065 ΛΕΥΚΟ ΜΟΝΟΦΥΛΛΑ 550 902 ΛΕΥΚΟ ∆ΙΦΥΛΛΑ 1360 1150 ΛΕΥΚΟ ΜΟΝΟΦΥΛΛΑ 558 733 ΛΕΥΚΟ ∆ΙΦΥΛΛΑ 935 2085 ΛΕΥΚΟ ΜΟΝΟΦΥΛΛΑ 774 1436 ΛΕΥΚΟ ∆ΙΦΥΛΛΑ 1290 1025 ΛΕΥΚΟ ΜΟΝΟΦΥΛΛΑ 590 1162 ΛΕΥΚΟ ∆ΙΦΥΛΛΑ 1310 975 ΛΕΥΚΟ ΜΟΝΟΦΥΛΛΑ 859 2065 ΛΕΥΚΟ ∆ΙΦΥΛΛΑ 1400 925 ΛΕΥΚΟ ΜΟΝΟΦΥΛΛΑ 750 838 ΛΕΥΚΟ ∆ΙΦΥΛΛΑ 1435 1998 ΛΕΥΚΟ ΜΟΝΟΦΥΛΛΑ 750 1030 ΛΕΥΚΟ ∆ΙΦΥΛΛΑ 1422 1989 ΛΕΥΚΟ ΣΤΑΘΕΡΑ 801 2283 016 ΜΕΣΑ ΕΞΩ ∆ΙΦΥΛΛΑ 1415 1977 ΛΕΥΚΟ ΣΤΑΘΕΡΑ 801 2283 016 ΜΕΣΑ ΕΞΩ ∆ΙΦΥΛΛΑ 1190 1200 ΛΕΥΚΟ
ΣΤΑΘΕΡΑ 2470 1543 067/267 ΦΟΛΙ ΜΕΣΑ ΕΞΩ ∆ΙΦΥΛΛΑ 1005 1960 ΛΕΥΚΟ
ΣΤΑΘΕΡΑ 1750 1548 067/267 ΦΟΛΙ ΜΕΣΑ ΕΞΩ ∆ΙΦΥΛΛΑ 1265 1950 ΛΕΥΚΟ
ΣΤΑΘΕΡΑ 695 580 ΛΕΥΚΟ ∆ΙΦΥΛΛΑ 1272 2115 ΛΕΥΚΟ ∆ΙΦΥΛΛΑ 1267 2065 ΛΕΥΚΟ ∆ΙΦΥΛΛΑ 1280 2105 ΛΕΥΚΟ ∆ΙΦΥΛΛΑ 1270 2050 ΛΕΥΚΟ ∆ΙΦΥΛΛΑ 1400 2000 ΛΕΥΚΟ ∆ΙΦΥΛΛΑ 1171 2065 ΛΕΥΚΟ ∆ΙΦΥΛΛΑ 1395 2000 ΛΕΥΚΟ ∆ΙΦΥΛΛΑ 1265 2085 ΛΕΥΚΟ ∆ΙΦΥΛΛΑ 1330 1090 ΛΕΥΚΟ ΜΟΝΟΦΥΛΛΑ 520 1055 032 ΜΕΣΑ ΕΞΩ ∆ΙΦΥΛΛΑ 1575 1965 ΛΕΥΚΟ
ΜΟΝΟΦΥΛΛΑ 480 1080 032 ΜΕΣΑ ΕΞΩ ΜΟΝΟΦΥΛΛΑ 477 600 028 ΜΕΣΑ ΕΞΩ
ΣΤΑΘΕΡΑ 1133 693 ΛΕΥΚΟ ΜΟΝΟΦΥΛΛΑ 870 1142 ΛΕΥΚΟ ∆ΙΦΥΛΛΑ 1296 2088 028 ΜΕΣΑ ΕΞΩ ΜΟΝΟΦΥΛΛΑ 960 1985 ΛΕΥΚΟ ∆ΙΦΥΛΛΑ 1506 2057 028 ΜΕΣΑ ΕΞΩ ΜΟΝΟΦΥΛΛΑ 850 2156 ΛΕΥΚΟ ∆ΙΦΥΛΛΑ 1311 2091 028 ΜΕΣΑ ΕΞΩ ΜΟΝΟΦΥΛΛΑ 635 1307 ΛΕΥΚΟ ∆ΙΦΥΛΛΑ 1272 1230 ΛΕΥΚΟ ΜΟΝΟΦΥΛΛΑ 535 730 ΛΕΥΚΟ ∆ΙΦΥΛΛΑ 1268 1233 ΛΕΥΚΟ ΜΟΝΟΦΥΛΛΑ 680 2065 ΛΕΥΚΟ ∆ΙΦΥΛΛΑ 1270 950 ΛΕΥΚΟ ΜΟΝΟΦΥΛΛΑ 400 732 ΛΕΥΚΟ ∆ΙΦΥΛΛΑ 1355 1290 ΛΕΥΚΟ ΣΤΑΘΕΡΑ 1102 782 ΛΕΥΚΟ ΜΟΝΟΦΥΛΛΑ 890 2091 028 ΜΕΣΑ ΕΞΩ ΣΤΑΘΕΡΑ 2530 600 ΛΕΥΚΟ ΜΟΝΟΦΥΛΛΑ 1018 580 032 ΜΕΣΑ ΕΞΩ ∆ΙΦΥΛΛΑ 1194 2120 ΛΕΥΚΟ ΜΟΝΟΦΥΛΛΑ 750 2258 032 ΜΕΣΑ ΕΞΩ ∆ΙΦΥΛΛΑ 1462 2099 ΛΕΥΚΟ ΜΟΝΟΦΥΛΛΑ 1000 535 032 ΜΕΣΑ ΕΞΩ ∆ΙΦΥΛΛΑ 1454 2097 ΛΕΥΚΟ ΜΟΝΟΦΥΛΛΑ 950 1315 ΛΕΥΚΟ ∆ΙΦΥΛΛΑ 1365 529 ΛΕΥΚΟ ΜΟΝΟΦΥΛΛΑ 492 586 ΛΕΥΚΟ ∆ΙΦΥΛΛΑ 1485 2120 ΛΕΥΚΟ ΜΟΝΟΦΥΛΛΑ 950 1320 ΛΕΥΚΟ ∆ΙΦΥΛΛΑ 1161 1963 ΛΕΥΚΟ ΜΟΝΟΦΥΛΛΑ 1015 615 ΛΕΥΚΟ ∆ΙΦΥΛΛΑ 1355 1997 ΛΕΥΚΟ ΜΟΝΟΦΥΛΛΑ 715 990 ΛΕΥΚΟ ∆ΙΦΥΛΛΑ 1119 2052 ΛΕΥΚΟ ΜΟΝΟΦΥΛΛΑ 610 1060 ΛΕΥΚΟ ∆ΙΦΥΛΛΑ 1104 1220 ΛΕΥΚΟ ΜΟΝΟΦΥΛΛΑ 630 1020 ΛΕΥΚΟ ∆ΙΦΥΛΛΑ 1104 1220 ΛΕΥΚΟ ΜΟΝΟΦΥΛΛΑ 630 1070 ΛΕΥΚΟ ∆ΙΦΥΛΛΑ 1340 2132 ΛΕΥΚΟ ΣΤΑΘΕΡΑ 650 2010 ΛΕΥΚΟ ∆ΙΦΥΛΛΑ 1344 2120 ΛΕΥΚΟ ∆ΙΦΥΛΛΑ 1184 2133 028 ΜΕΣΑ ΕΞΩ ∆ΙΦΥΛΛΑ 1341 2134 ΛΕΥΚΟ ∆ΙΦΥΛΛΑ 1178 2139 028 ΜΕΣΑ ΕΞΩ ∆ΙΦΥΛΛΑ 1414 937 ΛΕΥΚΟ ∆ΙΦΥΛΛΑ 1187 2139 028 ΜΕΣΑ ΕΞΩ ∆ΙΦΥΛΛΑ 1234 2104 ΛΕΥΚΟ ∆ΙΦΥΛΛΑ 1278 1315 ΛΕΥΚΟ ∆ΙΦΥΛΛΑ 1256 2099 ΛΕΥΚΟ ∆ΙΦΥΛΛΑ 1240 1290 ΛΕΥΚΟ ∆ΙΦΥΛΛΑ 1365 589 ΛΕΥΚΟ

Page | 105
∆ΙΦΥΛΛΑ 1242 1290 ΛΕΥΚΟ ∆ΙΦΥΛΛΑ 1370 545 ΛΕΥΚΟ ∆ΙΦΥΛΛΑ 1274 1290 ΛΕΥΚΟ ∆ΙΦΥΛΛΑ 1152 2053 ΛΕΥΚΟ ∆ΙΦΥΛΛΑ 992 1042 ΛΕΥΚΟ ∆ΙΦΥΛΛΑ 1144 2063 ΛΕΥΚΟ ΜΟΝΟΦΥΛΛΑ 640 575 ΛΕΥΚΟ ∆ΙΦΥΛΛΑ 1229 1293 ΛΕΥΚΟ ∆ΙΦΥΛΛΑ 1710 2062 ΛΕΥΚΟ ∆ΙΦΥΛΛΑ 1480 1932 ΛΕΥΚΟ ∆ΙΦΥΛΛΑ 1097 2069 ΛΕΥΚΟ ∆ΙΦΥΛΛΑ 1450 1922 ΛΕΥΚΟ ∆ΙΦΥΛΛΑ 1434 1340 ΛΕΥΚΟ ∆ΙΦΥΛΛΑ 1230 917 ΛΕΥΚΟ ∆ΙΦΥΛΛΑ 1114 2071 ΛΕΥΚΟ ∆ΙΦΥΛΛΑ 1250 1977 ΛΕΥΚΟ ΜΟΝΟΦΥΛΛΑ 1014 2067 ΛΕΥΚΟ ∆ΙΦΥΛΛΑ 1250 1967 ΛΕΥΚΟ ΜΟΝΟΦΥΛΛΑ 903 1555 ΛΕΥΚΟ ∆ΙΦΥΛΛΑ 1322 1206 ΛΕΥΚΟ ΜΟΝΟΦΥΛΛΑ 843 2130 ΛΕΥΚΟ ∆ΙΦΥΛΛΑ 1322 2200 ΛΕΥΚΟ ΜΟΝΟΦΥΛΛΑ 845 2125 ΛΕΥΚΟ ∆ΙΦΥΛΛΑ 1319 2193 ΛΕΥΚΟ ΜΟΝΟΦΥΛΛΑ 2139 1560 ΛΕΥΚΟ ∆ΙΦΥΛΛΑ 1324 2202 ΛΕΥΚΟ ΜΟΝΟΦΥΛΛΑ 400 650 ΛΕΥΚΟ ΜΟΝΟΦΥΛΛΑ 751 1164 ΛΕΥΚΟ ΜΟΝΟΦΥΛΛΑ 400 650 ΛΕΥΚΟ ΜΟΝΟΦΥΛΛΑ 749 1139 ΛΕΥΚΟ ΜΟΝΟΦΥΛΛΑ 838 2110 ΛΕΥΚΟ ΜΟΝΟΦΥΛΛΑ 750 767 ΛΕΥΚΟ ΣΤΑΘΕΡΑ 900 1545 ΛΕΥΚΟ ΜΟΝΟΦΥΛΛΑ 534 534 ΛΕΥΚΟ ΣΤΑΘΕΡΑ 1295 1560 ΛΕΥΚΟ ΜΟΝΟΦΥΛΛΑ 968 1170 ΛΕΥΚΟ ∆ΙΦΥΛΛΑ 860 1060 028 ΜΕΣΑ ΕΞΩ ΜΟΝΟΦΥΛΛΑ 730 600 ΛΕΥΚΟ ∆ΙΦΥΛΛΑ 1300 1997 032 ΜΕΣΑ ΕΞΩ ΜΟΝΟΦΥΛΛΑ 702 768 ΛΕΥΚΟ ∆ΙΦΥΛΛΑ 1222 2094 ΛΕΥΚΟ ΜΟΝΟΦΥΛΛΑ 879 2083 ΛΕΥΚΟ ∆ΙΦΥΛΛΑ 1241 2094 ΛΕΥΚΟ ΜΟΝΟΦΥΛΛΑ 590 425 ΛΕΥΚΟ ∆ΙΦΥΛΛΑ 1415 2095 ΛΕΥΚΟ ΜΟΝΟΦΥΛΛΑ 541 765 ΛΕΥΚΟ ∆ΙΦΥΛΛΑ 1417 2096 ΛΕΥΚΟ ΜΟΝΟΦΥΛΛΑ 751 1164 ΛΕΥΚΟ ∆ΙΦΥΛΛΑ 1252 2094 ΛΕΥΚΟ ΜΟΝΟΦΥΛΛΑ 749 1139 ΛΕΥΚΟ ∆ΙΦΥΛΛΑ 1271 2140 ΛΕΥΚΟ ΜΟΝΟΦΥΛΛΑ 760 767 ΛΕΥΚΟ ∆ΙΦΥΛΛΑ 1220 2142 ΛΕΥΚΟ ΜΟΝΟΦΥΛΛΑ 540 2105 ΛΕΥΚΟ ∆ΙΦΥΛΛΑ 1157 1277 ΛΕΥΚΟ ΜΟΝΟΦΥΛΛΑ 394 494 ΛΕΥΚΟ ΜΟΝΟΦΥΛΛΑ 450 1290 ΛΕΥΚΟ ΜΟΝΟΦΥΛΛΑ 748 2136 ΛΕΥΚΟ ΜΟΝΟΦΥΛΛΑ 1135 1245 ΛΕΥΚΟ ΜΟΝΟΦΥΛΛΑ 1157 1156 ΛΕΥΚΟ ΜΟΝΟΦΥΛΛΑ 1012 2094 ΛΕΥΚΟ ΜΟΝΟΦΥΛΛΑ 654 1953 ΛΕΥΚΟ ΜΟΝΟΦΥΛΛΑ 845 435 ΛΕΥΚΟ ΜΟΝΟΦΥΛΛΑ 930 724 ΛΕΥΚΟ ΜΟΝΟΦΥΛΛΑ 1134 1313 ΛΕΥΚΟ ΜΟΝΟΦΥΛΛΑ 605 838 ΛΕΥΚΟ ∆ΙΦΥΛΛΑ 1297 2143 ΛΕΥΚΟ ΜΟΝΟΦΥΛΛΑ 778 777 ΛΕΥΚΟ ∆ΙΦΥΛΛΑ 1444 1438 ΛΕΥΚΟ ΜΟΝΟΦΥΛΛΑ 750 1987 ΛΕΥΚΟ
∆ΙΦΥΛΛΑ 1156 1401 ΛΕΥΚΟ ∆ΙΦΥΛΛΑ 1386 2154 028 ΜΕΣΑ ΕΞΩ
∆ΙΦΥΛΛΑ 1434 1463 ΛΕΥΚΟ ∆ΙΦΥΛΛΑ 2121 2147 028 ΜΕΣΑ ΕΞΩ
ΜΟΝΟΦΥΛΛΑ 784 574 ΛΕΥΚΟ ∆ΙΦΥΛΛΑ 1389 2132 028 ΜΕΣΑ ΕΞΩ
ΜΟΝΟΦΥΛΛΑ 914 1308 ΛΕΥΚΟ ∆ΙΦΥΛΛΑ 1145 1037 028 ΜΕΣΑ ΕΞΩ
∆ΙΦΥΛΛΑ 1740 1295 028 ΜΕΣΑ ΕΞΩ ∆ΙΦΥΛΛΑ 1355 2177 028 ΜΕΣΑ ΕΞΩ
∆ΙΦΥΛΛΑ 1184 1188 ΛΕΥΚΟ ∆ΙΦΥΛΛΑ 1390 1177 ΛΕΥΚΟ ∆ΙΦΥΛΛΑ 1274 1180 ΛΕΥΚΟ ∆ΙΦΥΛΛΑ 1170 2007 ΛΕΥΚΟ ∆ΙΦΥΛΛΑ 1350 2109 ΛΕΥΚΟ ∆ΙΦΥΛΛΑ 1490 1167 ΛΕΥΚΟ ∆ΙΦΥΛΛΑ 1060 1080 ΛΕΥΚΟ ∆ΙΦΥΛΛΑ 1490 1197 ΛΕΥΚΟ
∆ΙΦΥΛΛΑ 1185 2150 ΛΕΥΚΟ ΜΟΝΟΦΥΛΛΑ 1048 998 028 ΜΕΣΑ ΕΞΩ
∆ΙΦΥΛΛΑ 2198 2445 ΛΕΥΚΟ ΜΟΝΟΦΥΛΛΑ 524 394 028 ΜΕΣΑ ΕΞΩ
ΜΟΝΟΦΥΛΛΑ 875 2180 028 ΜΕΣΑ ΕΞΩ ΜΟΝΟΦΥΛΛΑ 540 1347 ΛΕΥΚΟ ΜΟΝΟΦΥΛΛΑ 690 730 ΛΕΥΚΟ ΜΟΝΟΦΥΛΛΑ 540 1347 ΛΕΥΚΟ ΜΟΝΟΦΥΛΛΑ 714 1015 ΛΕΥΚΟ ΜΟΝΟΦΥΛΛΑ 540 1347 ΛΕΥΚΟ ΜΟΝΟΦΥΛΛΑ 870 2235 ΛΕΥΚΟ ∆ΙΦΥΛΛΑ 1380 1094 ΛΕΥΚΟ ΜΟΝΟΦΥΛΛΑ 780 780 ΛΕΥΚΟ ∆ΙΦΥΛΛΑ 1227 1326 ΛΕΥΚΟ ΣΤΑΘΕΡΑ 899 2445 ΛΕΥΚΟ ∆ΙΦΥΛΛΑ 1072 1327 ΛΕΥΚΟ ΣΤΑΘΕΡΑ 899 2445 ΛΕΥΚΟ ∆ΙΦΥΛΛΑ 1075 2251 ΛΕΥΚΟ ΣΤΑΘΕΡΑ 890 785 ΛΕΥΚΟ ∆ΙΦΥΛΛΑ 1076 2240 ΛΕΥΚΟ

Page | 106
ΣΤΑΘΕΡΑ 890 785 ΛΕΥΚΟ ∆ΙΦΥΛΛΑ 876 829 ΛΕΥΚΟ ΣΤΑΘΕΡΑ 1622 955 ΛΕΥΚΟ ∆ΙΦΥΛΛΑ 1075 1326 ΛΕΥΚΟ ΣΤΑΘΕΡΑ 1612 955 ΛΕΥΚΟ ∆ΙΦΥΛΛΑ 1099 2271 ΛΕΥΚΟ ∆ΙΦΥΛΛΑ 1672 1993 ΛΕΥΚΟ ∆ΙΦΥΛΛΑ 1362 1315 ΛΕΥΚΟ ∆ΙΦΥΛΛΑ 1088 2147 ΛΕΥΚΟ ΜΟΝΟΦΥΛΛΑ 625 927 ΛΕΥΚΟ ∆ΙΦΥΛΛΑ 1207 2118 ΛΕΥΚΟ ΜΟΝΟΦΥΛΛΑ 728 1070 ΛΕΥΚΟ ∆ΙΦΥΛΛΑ 1227 2209 ΛΕΥΚΟ ΜΟΝΟΦΥΛΛΑ 766 1085 ΛΕΥΚΟ ∆ΙΦΥΛΛΑ 1556 2187 ΛΕΥΚΟ ∆ΙΦΥΛΛΑ 1317 866 ΛΕΥΚΟ ∆ΙΦΥΛΛΑ 1212 2168 ΛΕΥΚΟ ∆ΙΦΥΛΛΑ 1290 2115 ΛΕΥΚΟ ∆ΙΦΥΛΛΑ 1212 2208 ΛΕΥΚΟ ∆ΙΦΥΛΛΑ 1451 2208 ΛΕΥΚΟ ∆ΙΦΥΛΛΑ 1571 2147 ΛΕΥΚΟ ∆ΙΦΥΛΛΑ 1700 2130 ΛΕΥΚΟ ∆ΙΦΥΛΛΑ 912 1047 ΛΕΥΚΟ ∆ΙΦΥΛΛΑ 1225 2130 ΛΕΥΚΟ ∆ΙΦΥΛΛΑ 1202 2149 ΛΕΥΚΟ ∆ΙΦΥΛΛΑ 1310 2120 ΛΕΥΚΟ ∆ΙΦΥΛΛΑ 1579 2087 ΛΕΥΚΟ ∆ΙΦΥΛΛΑ 1310 2130 ΛΕΥΚΟ ∆ΙΦΥΛΛΑ 918 1012 ΛΕΥΚΟ ∆ΙΦΥΛΛΑ 1699 1214 ΛΕΥΚΟ ∆ΙΦΥΛΛΑ 1219 934 ΛΕΥΚΟ ∆ΙΦΥΛΛΑ 1119 1246 ΛΕΥΚΟ ∆ΙΦΥΛΛΑ 1363 2165 ΛΕΥΚΟ ∆ΙΦΥΛΛΑ 1240 1279 ΛΕΥΚΟ ∆ΙΦΥΛΛΑ 1362 2192 ΛΕΥΚΟ ∆ΙΦΥΛΛΑ 968 1211 ΛΕΥΚΟ ∆ΙΦΥΛΛΑ 1376 2188 ΛΕΥΚΟ ∆ΙΦΥΛΛΑ 936 1109 ΛΕΥΚΟ ∆ΙΦΥΛΛΑ 1376 2170 ΛΕΥΚΟ ∆ΙΦΥΛΛΑ 921 1055 ΛΕΥΚΟ ∆ΙΦΥΛΛΑ 1376 2170 ΛΕΥΚΟ ∆ΙΦΥΛΛΑ 1441 755 ΛΕΥΚΟ ∆ΙΦΥΛΛΑ 1456 1170 ΛΕΥΚΟ ∆ΙΦΥΛΛΑ 1734 746 ΛΕΥΚΟ ∆ΙΦΥΛΛΑ 1374 2188 ΛΕΥΚΟ ∆ΙΦΥΛΛΑ 1729 745 ΛΕΥΚΟ ΜΟΝΟΦΥΛΛΑ 578 933 ΛΕΥΚΟ ΜΟΝΟΦΥΛΛΑ 1485 514 ΛΕΥΚΟ ΜΟΝΟΦΥΛΛΑ 467 505 ΛΕΥΚΟ ΜΟΝΟΦΥΛΛΑ 1050 309 ΛΕΥΚΟ ΜΟΝΟΦΥΛΛΑ 467 510 ΛΕΥΚΟ ΜΟΝΟΦΥΛΛΑ 549 540 ΛΕΥΚΟ
ΜΟΝΟΦΥΛΛΑ 557 670 ΛΕΥΚΟ ∆ΙΦΥΛΛΑ 1210 2060 028 ΜΕΣΑ ΕΞΩ
ΜΟΝΟΦΥΛΛΑ 562 679 ΛΕΥΚΟ ∆ΙΦΥΛΛΑ 1218 2060 028 ΜΕΣΑ ΕΞΩ
ΜΟΝΟΦΥΛΛΑ 987 2102 ΛΕΥΚΟ ∆ΙΦΥΛΛΑ 1700 1420 028 ΜΕΣΑ ΕΞΩ
ΜΟΝΟΦΥΛΛΑ 801 1079 ΛΕΥΚΟ ∆ΙΦΥΛΛΑ 1220 2060 028 ΜΕΣΑ ΕΞΩ
ΜΟΝΟΦΥΛΛΑ 1037 2207 ΛΕΥΚΟ ∆ΙΦΥΛΛΑ 1492 1223 032 ΜΕΣΑ ΕΞΩ
ΜΟΝΟΦΥΛΛΑ 982 2202 ΛΕΥΚΟ ∆ΙΦΥΛΛΑ 1448 2219 032 ΜΕΣΑ ΕΞΩ
ΜΟΝΟΦΥΛΛΑ 824 1012 ΛΕΥΚΟ ∆ΙΦΥΛΛΑ 1452 1279 032 ΜΕΣΑ ΕΞΩ
ΜΟΝΟΦΥΛΛΑ 1025 2140 ΛΕΥΚΟ ∆ΙΦΥΛΛΑ 1493 1283 032 ΜΕΣΑ ΕΞΩ
ΜΟΝΟΦΥΛΛΑ 984 2172 ΛΕΥΚΟ ∆ΙΦΥΛΛΑ 1492 1393 032 ΜΕΣΑ ΕΞΩ
ΜΟΝΟΦΥΛΛΑ 804 1109 ΛΕΥΚΟ ΜΟΝΟΦΥΛΛΑ 1043 1081 032 ΜΕΣΑ ΕΞΩ
ΜΟΝΟΦΥΛΛΑ 1052 2194 ΛΕΥΚΟ ΜΟΝΟΦΥΛΛΑ 813 934 032 ΜΕΣΑ ΕΞΩ
ΜΟΝΟΦΥΛΛΑ 783 1967 ΛΕΥΚΟ ΜΟΝΟΦΥΛΛΑ 853 893 032 ΜΕΣΑ ΕΞΩ
ΜΟΝΟΦΥΛΛΑ 882 1950 ΛΕΥΚΟ ΜΟΝΟΦΥΛΛΑ 812 2085 032 ΜΕΣΑ ΕΞΩ
ΜΟΝΟΦΥΛΛΑ 872 1191 ΛΕΥΚΟ ΜΟΝΟΦΥΛΛΑ 1042 2053 032 ΜΕΣΑ ΕΞΩ
ΜΟΝΟΦΥΛΛΑ 872 1191 ΛΕΥΚΟ ΜΟΝΟΦΥΛΛΑ 1818 2169 032 ΜΕΣΑ ΕΞΩ
ΜΟΝΟΦΥΛΛΑ 872 1191 ΛΕΥΚΟ ΜΟΝΟΦΥΛΛΑ 837 1224 032 ΜΕΣΑ ΕΞΩ
ΜΟΝΟΦΥΛΛΑ 650 780 ΛΕΥΚΟ ΣΤΑΘΕΡΑ 1817 2169 032 ΜΕΣΑ ΕΞΩ
∆ΙΦΥΛΛΑ 1562 2098 032 ΜΕΣΑ ΕΞΩ ∆ΙΦΥΛΛΑ 1276 1994 016 ΜΕΣΑ ΕΞΩ
∆ΙΦΥΛΛΑ 1359 2071 032 ΜΕΣΑ ΕΞΩ ∆ΙΦΥΛΛΑ 1312 1089 016 ΜΕΣΑ ΕΞΩ
∆ΙΦΥΛΛΑ 1359 2099 032 ΜΕΣΑ ΕΞΩ ∆ΙΦΥΛΛΑ 1312 2044 016 ΜΕΣΑ ΕΞΩ

Page | 107
∆ΙΦΥΛΛΑ 1366 2125 032 ΜΕΣΑ ΕΞΩ ∆ΙΦΥΛΛΑ 1302 2024 016 ΜΕΣΑ ΕΞΩ
∆ΙΦΥΛΛΑ 1348 1291 032 ΜΕΣΑ ΕΞΩ ∆ΙΦΥΛΛΑ 1398 1989 016 ΜΕΣΑ ΕΞΩ
∆ΙΦΥΛΛΑ 1529 2088 032 ΜΕΣΑ ΕΞΩ ∆ΙΦΥΛΛΑ 1145 800 032 ΜΕΣΑ ΕΞΩ
ΜΟΝΟΦΥΛΛΑ 647 1888 032 ΜΕΣΑ ΕΞΩ ∆ΙΦΥΛΛΑ 1207 710 032 ΜΕΣΑ ΕΞΩ
ΜΟΝΟΦΥΛΛΑ 679 629 032 ΜΕΣΑ ΕΞΩ ∆ΙΦΥΛΛΑ 1519 1070 ΛΕΥΚΟ ΜΟΝΟΦΥΛΛΑ 669 619 032 ΜΕΣΑ ΕΞΩ ∆ΙΦΥΛΛΑ 1039 2100 ΛΕΥΚΟ ΜΟΝΟΦΥΛΛΑ 887 1579 032 ΜΕΣΑ ΕΞΩ ∆ΙΦΥΛΛΑ 1254 1212 ΛΕΥΚΟ ΣΤΑΘΕΡΑ 657 1888 032 ΜΕΣΑ ΕΞΩ ∆ΙΦΥΛΛΑ 1254 2083 ΛΕΥΚΟ ΣΤΑΘΕΡΑ 827 1579 032 ΜΕΣΑ ΕΞΩ ∆ΙΦΥΛΛΑ 1259 2092 ΛΕΥΚΟ ∆ΙΦΥΛΛΑ 1150 644 028 ΜΕΣΑ ΕΞΩ ∆ΙΦΥΛΛΑ 1260 2081 ΛΕΥΚΟ ∆ΙΦΥΛΛΑ 1170 1197 028 ΜΕΣΑ ΕΞΩ ∆ΙΦΥΛΛΑ 1247 2075 ΛΕΥΚΟ ∆ΙΦΥΛΛΑ 870 1097 028 ΜΕΣΑ ΕΞΩ ∆ΙΦΥΛΛΑ 1184 2056 ΛΕΥΚΟ
∆ΙΦΥΛΛΑ 970 1097 028 ΜΕΣΑ ΕΞΩ ΜΟΝΟΦΥΛΛΑ 588 683 016 ΜΕΣΑ ΕΞΩ
∆ΙΦΥΛΛΑ 1409 2105 ΛΕΥΚΟ ΜΟΝΟΦΥΛΛΑ 947 1996 016 ΜΕΣΑ ΕΞΩ
∆ΙΦΥΛΛΑ 1413 2110 ΛΕΥΚΟ ΜΟΝΟΦΥΛΛΑ 1437 902 016 ΜΕΣΑ ΕΞΩ
∆ΙΦΥΛΛΑ 1405 2095 ΛΕΥΚΟ ΜΟΝΟΦΥΛΛΑ 558 663 016 ΜΕΣΑ ΕΞΩ
∆ΙΦΥΛΛΑ 1302 2204 ΛΕΥΚΟ ΜΟΝΟΦΥΛΛΑ 892 918 016 ΜΕΣΑ ΕΞΩ
∆ΙΦΥΛΛΑ 1318 2194 ΛΕΥΚΟ ΜΟΝΟΦΥΛΛΑ 892 2074 016 ΜΕΣΑ ΕΞΩ
∆ΙΦΥΛΛΑ 1327 2189 ΛΕΥΚΟ ΜΟΝΟΦΥΛΛΑ 960 2050 ΛΕΥΚΟ ∆ΙΦΥΛΛΑ 1063 2184 ΛΕΥΚΟ ΜΟΝΟΦΥΛΛΑ 708 2097 ΛΕΥΚΟ ∆ΙΦΥΛΛΑ 1109 2079 ΛΕΥΚΟ ΜΟΝΟΦΥΛΛΑ 500 1087 ΛΕΥΚΟ ΜΟΝΟΦΥΛΛΑ 900 1197 028 ΜΕΣΑ ΕΞΩ ΜΟΝΟΦΥΛΛΑ 610 550 ΛΕΥΚΟ ΜΟΝΟΦΥΛΛΑ 460 354 028 ΜΕΣΑ ΕΞΩ ΜΟΝΟΦΥΛΛΑ 504 1087 ΛΕΥΚΟ ΜΟΝΟΦΥΛΛΑ 465 539 028 ΜΕΣΑ ΕΞΩ ΜΟΝΟΦΥΛΛΑ 660 882 ΛΕΥΚΟ ΜΟΝΟΦΥΛΛΑ 708 2150 ΛΕΥΚΟ ΜΟΝΟΦΥΛΛΑ 410 472 ΛΕΥΚΟ ΜΟΝΟΦΥΛΛΑ 712 2124 ΛΕΥΚΟ ∆ΙΦΥΛΛΑ 1310 2140 ΛΕΥΚΟ ΜΟΝΟΦΥΛΛΑ 690 1215 ΛΕΥΚΟ ∆ΙΦΥΛΛΑ 1310 2150 ΛΕΥΚΟ ∆ΙΦΥΛΛΑ 1575 1307 032 ΜΕΣΑ ΕΞΩ ΜΟΝΟΦΥΛΛΑ 500 490 ΛΕΥΚΟ ∆ΙΦΥΛΛΑ 1195 1312 032 ΜΕΣΑ ΕΞΩ ΜΟΝΟΦΥΛΛΑ 470 820 ΛΕΥΚΟ ∆ΙΦΥΛΛΑ 905 1037 032 ΜΕΣΑ ΕΞΩ ΣΤΑΘΕΡΑ 2572 539 ΛΕΥΚΟ
∆ΙΦΥΛΛΑ 960 1297 032 ΜΕΣΑ ΕΞΩ ∆ΙΦΥΛΛΑ 1248 1293 032 ΜΕΣΑ ΕΞΩ
∆ΙΦΥΛΛΑ 985 1207 032 ΜΕΣΑ ΕΞΩ ∆ΙΦΥΛΛΑ 1210 1970 ΛΕΥΚΟ ∆ΙΦΥΛΛΑ 975 1212 032 ΜΕΣΑ ΕΞΩ ∆ΙΦΥΛΛΑ 1210 1970 ΛΕΥΚΟ ∆ΙΦΥΛΛΑ 1281 2004 ΛΕΥΚΟ ∆ΙΦΥΛΛΑ 1345 1327 ΛΕΥΚΟ ∆ΙΦΥΛΛΑ 1371 2111 ΛΕΥΚΟ ∆ΙΦΥΛΛΑ 1340 1312 ΛΕΥΚΟ ∆ΙΦΥΛΛΑ 1386 2301 ΛΕΥΚΟ ∆ΙΦΥΛΛΑ 1170 1097 ΛΕΥΚΟ ∆ΙΦΥΛΛΑ 1335 2150 ΛΕΥΚΟ ∆ΙΦΥΛΛΑ 1350 2120 ΛΕΥΚΟ ∆ΙΦΥΛΛΑ 1335 2160 ΛΕΥΚΟ ∆ΙΦΥΛΛΑ 920 1022 ΛΕΥΚΟ ∆ΙΦΥΛΛΑ 2066 2207 ΛΕΥΚΟ ∆ΙΦΥΛΛΑ 1164 1963 ΛΕΥΚΟ ∆ΙΦΥΛΛΑ 1297 2177 ΛΕΥΚΟ ∆ΙΦΥΛΛΑ 1152 1979 ΛΕΥΚΟ ∆ΙΦΥΛΛΑ 1070 2090 ΛΕΥΚΟ ∆ΙΦΥΛΛΑ 1439 2130 ΛΕΥΚΟ ∆ΙΦΥΛΛΑ 1350 1187 ΛΕΥΚΟ ∆ΙΦΥΛΛΑ 1251 2070 ΛΕΥΚΟ ∆ΙΦΥΛΛΑ 1255 1182 ΛΕΥΚΟ ∆ΙΦΥΛΛΑ 724 995 ΛΕΥΚΟ ∆ΙΦΥΛΛΑ 1295 1137 ΛΕΥΚΟ ∆ΙΦΥΛΛΑ 1200 800 ΛΕΥΚΟ ∆ΙΦΥΛΛΑ 1255 2115 ΛΕΥΚΟ ∆ΙΦΥΛΛΑ 1350 2130 ΛΕΥΚΟ ∆ΙΦΥΛΛΑ 1260 2105 ΛΕΥΚΟ ∆ΙΦΥΛΛΑ 1220 1970 ΛΕΥΚΟ ΜΟΝΟΦΥΛΛΑ 860 2062 032 ΜΕΣΑ ΕΞΩ ∆ΙΦΥΛΛΑ 1210 1980 ΛΕΥΚΟ ΜΟΝΟΦΥΛΛΑ 650 1102 032 ΜΕΣΑ ΕΞΩ ∆ΙΦΥΛΛΑ 1177 2040 ΛΕΥΚΟ ΜΟΝΟΦΥΛΛΑ 455 640 032 ΜΕΣΑ ΕΞΩ ∆ΙΦΥΛΛΑ 1159 2070 ΛΕΥΚΟ ΜΟΝΟΦΥΛΛΑ 580 550 032 ΜΕΣΑ ΕΞΩ ∆ΙΦΥΛΛΑ 1281 1082 ΛΕΥΚΟ ΜΟΝΟΦΥΛΛΑ 630 750 032 ΜΕΣΑ ΕΞΩ ∆ΙΦΥΛΛΑ 1234 1208 ΛΕΥΚΟ

Page | 108
ΜΟΝΟΦΥΛΛΑ 580 550 032 ΜΕΣΑ ΕΞΩ ∆ΙΦΥΛΛΑ 1204 2070 ΛΕΥΚΟ ΜΟΝΟΦΥΛΛΑ 373 523 032 ΜΕΣΑ ΕΞΩ ∆ΙΦΥΛΛΑ 996 1250 ΛΕΥΚΟ ΜΟΝΟΦΥΛΛΑ 464 572 ΛΕΥΚΟ ∆ΙΦΥΛΛΑ 960 1200 ΛΕΥΚΟ ΜΟΝΟΦΥΛΛΑ 410 650 ΛΕΥΚΟ ∆ΙΦΥΛΛΑ 1360 1320 ΛΕΥΚΟ ΜΟΝΟΦΥΛΛΑ 500 1161 ΛΕΥΚΟ ∆ΙΦΥΛΛΑ 1350 2130 ΛΕΥΚΟ ΜΟΝΟΦΥΛΛΑ 1304 2095 ΛΕΥΚΟ ∆ΙΦΥΛΛΑ 1309 1178 ΛΕΥΚΟ ΜΟΝΟΦΥΛΛΑ 869 1995 ΛΕΥΚΟ ∆ΙΦΥΛΛΑ 1248 2130 ΛΕΥΚΟ
ΜΟΝΟΦΥΛΛΑ 690 2301 ΛΕΥΚΟ ΜΟΝΟΦΥΛΛΑ 592 933 058 ΠΡΑΣΙΝΟ ΜΕΣΑ ΕΞΩ
ΜΟΝΟΦΥΛΛΑ 738 1163 ΛΕΥΚΟ ΜΟΝΟΦΥΛΛΑ 577 927 058 ΠΡΑΣΙΝΟ ΜΕΣΑ ΕΞΩ
ΜΟΝΟΦΥΛΛΑ 526 1024 ΛΕΥΚΟ ΜΟΝΟΦΥΛΛΑ 592 927 058 ΠΡΑΣΙΝΟ ΜΕΣΑ ΕΞΩ
ΜΟΝΟΦΥΛΛΑ 960 2274 ΛΕΥΚΟ ΜΟΝΟΦΥΛΛΑ 590 927 058 ΠΡΑΣΙΝΟ ΜΕΣΑ ΕΞΩ
ΜΟΝΟΦΥΛΛΑ 962 2239 ΛΕΥΚΟ ΜΟΝΟΦΥΛΛΑ 770 1220 ΛΕΥΚΟ ΣΤΑΘΕΡΑ 1303 2095 ΛΕΥΚΟ ΜΟΝΟΦΥΛΛΑ 770 1230 ΛΕΥΚΟ ΣΤΑΘΕΡΑ 646 1597 ΛΕΥΚΟ ΜΟΝΟΦΥΛΛΑ 859 1966 ΛΕΥΚΟ ∆ΙΦΥΛΛΑ 744 644 028 ΜΕΣΑ ΕΞΩ ΜΟΝΟΦΥΛΛΑ 485 594 ΛΕΥΚΟ ∆ΙΦΥΛΛΑ 1452 2089 032 ΜΕΣΑ ΕΞΩ ΜΟΝΟΦΥΛΛΑ 500 480 ΛΕΥΚΟ
∆ΙΦΥΛΛΑ 1507 2094 032 ΜΕΣΑ ΕΞΩ ΣΤΑΘΕΡΑ 2395 1320 067/267 ΦΟΛΙ ΜΕΣΑ ΕΞΩ
∆ΙΦΥΛΛΑ 1362 2094 032 ΜΕΣΑ ΕΞΩ ∆ΙΦΥΛΛΑ 1141 1323 ΛΕΥΚΟ ∆ΙΦΥΛΛΑ 1387 2094 032 ΜΕΣΑ ΕΞΩ ΜΟΝΟΦΥΛΛΑ 544 1297 ΛΕΥΚΟ ∆ΙΦΥΛΛΑ 2028 1103 ΛΕΥΚΟ ΜΟΝΟΦΥΛΛΑ 564 1306 ΛΕΥΚΟ ∆ΙΦΥΛΛΑ 1180 1105 ΛΕΥΚΟ ΜΟΝΟΦΥΛΛΑ 549 1014 ΛΕΥΚΟ
∆ΙΦΥΛΛΑ 1160 2005 ΛΕΥΚΟ ∆ΙΦΥΛΛΑ 1443 2080 028 ΜΕΣΑ ΕΞΩ
∆ΙΦΥΛΛΑ 1460 2012 ΛΕΥΚΟ ∆ΙΦΥΛΛΑ 1418 2066 028 ΜΕΣΑ ΕΞΩ
∆ΙΦΥΛΛΑ 1485 1999 ΛΕΥΚΟ ∆ΙΦΥΛΛΑ 1404 2054 028 ΜΕΣΑ ΕΞΩ
∆ΙΦΥΛΛΑ 1170 2004 ΛΕΥΚΟ ∆ΙΦΥΛΛΑ 1423 2178 028 ΜΕΣΑ ΕΞΩ
∆ΙΦΥΛΛΑ 1138 2007 ΛΕΥΚΟ ∆ΙΦΥΛΛΑ 1450 2060 028 ΜΕΣΑ ΕΞΩ
∆ΙΦΥΛΛΑ 1126 2094 ΛΕΥΚΟ ∆ΙΦΥΛΛΑ 1470 404 028 ΜΕΣΑ ΕΞΩ
∆ΙΦΥΛΛΑ 1119 2104 ΛΕΥΚΟ ∆ΙΦΥΛΛΑ 1225 2120 ΛΕΥΚΟ ∆ΙΦΥΛΛΑ 1357 2094 ΛΕΥΚΟ ∆ΙΦΥΛΛΑ 1827 2106 ΛΕΥΚΟ ∆ΙΦΥΛΛΑ 1342 2119 ΛΕΥΚΟ ∆ΙΦΥΛΛΑ 1307 2111 ΛΕΥΚΟ ∆ΙΦΥΛΛΑ 1182 2089 ΛΕΥΚΟ ∆ΙΦΥΛΛΑ 1372 1226 ΛΕΥΚΟ ∆ΙΦΥΛΛΑ 1352 2067 ΛΕΥΚΟ ∆ΙΦΥΛΛΑ 1203 2073 ΛΕΥΚΟ ∆ΙΦΥΛΛΑ 1118 2104 ΛΕΥΚΟ ∆ΙΦΥΛΛΑ 1115 2070 ΛΕΥΚΟ ΜΟΝΟΦΥΛΛΑ 939 1230 028 ΜΕΣΑ ΕΞΩ ∆ΙΦΥΛΛΑ 1203 2067 ΛΕΥΚΟ ΜΟΝΟΦΥΛΛΑ 662 1135 ΛΕΥΚΟ ∆ΙΦΥΛΛΑ 1430 1964 ΛΕΥΚΟ ΜΟΝΟΦΥΛΛΑ 732 2074 ΛΕΥΚΟ ∆ΙΦΥΛΛΑ 1430 1200 ΛΕΥΚΟ ΜΟΝΟΦΥΛΛΑ 1132 785 ΛΕΥΚΟ ∆ΙΦΥΛΛΑ 1340 2110 ΛΕΥΚΟ ΜΟΝΟΦΥΛΛΑ 970 910 ΛΕΥΚΟ ∆ΙΦΥΛΛΑ 1755 2130 ΛΕΥΚΟ
ΜΟΝΟΦΥΛΛΑ 1125 640 ΛΕΥΚΟ ΜΟΝΟΦΥΛΛΑ 834 870 032 ΜΕΣΑ ΕΞΩ
ΜΟΝΟΦΥΛΛΑ 775 1550 ΛΕΥΚΟ ΜΟΝΟΦΥΛΛΑ 545 750 ΛΕΥΚΟ ΜΟΝΟΦΥΛΛΑ 555 647 ΛΕΥΚΟ ΜΟΝΟΦΥΛΛΑ 545 750 ΛΕΥΚΟ ΜΟΝΟΦΥΛΛΑ 630 640 ΛΕΥΚΟ ΜΟΝΟΦΥΛΛΑ 755 970 ΛΕΥΚΟ ΜΟΝΟΦΥΛΛΑ 1360 1108 ΛΕΥΚΟ ΜΟΝΟΦΥΛΛΑ 840 935 ΛΕΥΚΟ ∆ΙΦΥΛΛΑ 940 1150 ΛΕΥΚΟ ΜΟΝΟΦΥΛΛΑ 1063 1094 ΛΕΥΚΟ ΜΟΝΟΦΥΛΛΑ 885 655 028 ΜΕΣΑ ΕΞΩ ΜΟΝΟΦΥΛΛΑ 540 570 ΛΕΥΚΟ ΜΟΝΟΦΥΛΛΑ 875 1450 028 ΜΕΣΑ ΕΞΩ ΜΟΝΟΦΥΛΛΑ 800 2115 ΛΕΥΚΟ ΜΟΝΟΦΥΛΛΑ 875 655 028 ΜΕΣΑ ΕΞΩ ΜΟΝΟΦΥΛΛΑ 630 830 ΛΕΥΚΟ
ΜΟΝΟΦΥΛΛΑ 875 1450 028 ΜΕΣΑ ΕΞΩ ΣΤΑΘΕΡΑ 1162 997 028 ΜΕΣΑ ΕΞΩ
ΜΟΝΟΦΥΛΛΑ 966 2070 ΛΕΥΚΟ ∆ΙΦΥΛΛΑ 1348 2092 028 ΜΕΣΑ ΕΞΩ
∆ΙΦΥΛΛΑ 1314 1170 ΛΕΥΚΟ ∆ΙΦΥΛΛΑ 1340 2085 028 ΜΕΣΑ

Page | 109
ΕΞΩ
∆ΙΦΥΛΛΑ 1359 2048 ΛΕΥΚΟ ∆ΙΦΥΛΛΑ 1560 1107 028 ΜΕΣΑ ΕΞΩ
∆ΙΦΥΛΛΑ 1224 2075 ΛΕΥΚΟ ∆ΙΦΥΛΛΑ 1560 1087 028 ΜΕΣΑ ΕΞΩ
∆ΙΦΥΛΛΑ 1239 2102 ΛΕΥΚΟ ∆ΙΦΥΛΛΑ 1730 1119 028 ΜΕΣΑ ΕΞΩ
∆ΙΦΥΛΛΑ 1238 1993 ΛΕΥΚΟ ∆ΙΦΥΛΛΑ 1550 1137 028 ΜΕΣΑ ΕΞΩ
∆ΙΦΥΛΛΑ 1225 1975 ΛΕΥΚΟ ∆ΙΦΥΛΛΑ 1560 1122 028 ΜΕΣΑ ΕΞΩ
ΜΟΝΟΦΥΛΛΑ 635 835 ΛΕΥΚΟ ∆ΙΦΥΛΛΑ 1353 1987 ΛΕΥΚΟ ΜΟΝΟΦΥΛΛΑ 903 2063 ΛΕΥΚΟ ∆ΙΦΥΛΛΑ 1353 1987 ΛΕΥΚΟ ΜΟΝΟΦΥΛΛΑ 835 1992 ΛΕΥΚΟ ∆ΙΦΥΛΛΑ 1353 1087 ΛΕΥΚΟ ∆ΙΦΥΛΛΑ 1500 1992 ΛΕΥΚΟ ∆ΙΦΥΛΛΑ 1353 2017 ΛΕΥΚΟ ∆ΙΦΥΛΛΑ 980 1027 ΛΕΥΚΟ ∆ΙΦΥΛΛΑ 1445 2155 ΛΕΥΚΟ ∆ΙΦΥΛΛΑ 1594 2125 ΛΕΥΚΟ ∆ΙΦΥΛΛΑ 1204 2050 ΛΕΥΚΟ ∆ΙΦΥΛΛΑ 1591 2095 ΛΕΥΚΟ ∆ΙΦΥΛΛΑ 1452 2135 ΛΕΥΚΟ ∆ΙΦΥΛΛΑ 1542 2103 ΛΕΥΚΟ ∆ΙΦΥΛΛΑ 1447 2128 ΛΕΥΚΟ ∆ΙΦΥΛΛΑ 1331 2108 ΛΕΥΚΟ ∆ΙΦΥΛΛΑ 1690 1200 ΛΕΥΚΟ ∆ΙΦΥΛΛΑ 1334 2100 ΛΕΥΚΟ ∆ΙΦΥΛΛΑ 1653 1200 ΛΕΥΚΟ ∆ΙΦΥΛΛΑ 1341 2108 ΛΕΥΚΟ ∆ΙΦΥΛΛΑ 1973 983 ΛΕΥΚΟ ∆ΙΦΥΛΛΑ 1359 2110 ΛΕΥΚΟ ∆ΙΦΥΛΛΑ 1280 2075 ΛΕΥΚΟ ΜΟΝΟΦΥΛΛΑ 914 2060 ΛΕΥΚΟ ∆ΙΦΥΛΛΑ 1280 2075 ΛΕΥΚΟ ΜΟΝΟΦΥΛΛΑ 460 710 ΛΕΥΚΟ ∆ΙΦΥΛΛΑ 1280 2075 ΛΕΥΚΟ
ΜΟΝΟΦΥΛΛΑ 580 590 ΛΕΥΚΟ ΜΟΝΟΦΥΛΛΑ 940 2070 028 ΜΕΣΑ ΕΞΩ
ΜΟΝΟΦΥΛΛΑ 314 414 ΛΕΥΚΟ ΜΟΝΟΦΥΛΛΑ 542 1208 028 ΜΕΣΑ ΕΞΩ
Table A.2 Time measurements for loading profile
47 39 60 50 54 53 76 48 36 47 43 34 42 41 33 48 52 48 38 34 52 69 33 48 50 42 39 51 36 45 34 42 54 61 59 53 58 79 32 66 49 47 34 52 55 50 58 51 22 58
Table A.3 Time measurements for cutting machine
34 28 16 23 24 26 22 25 53 31 26 24 37 40 32 29 28 52 32 26 28 26 33 38 23 33 33 43 31 20 16 33 18 40 35 34 34 39 38 28 29 35 47 22 29 31 40 30 26 32
Table A.4 Time measurements for drilling
20 20 18 18 16 18 20 20 25 15
14 15 16 19 18 15 18 16 17 20
20 25 23 18 23 18 23 19 18 16
14 16 18 18 18 18 18 17 21 19
18 16 33 16 18 22 17 16 17 17

Page | 110
Table A.5 Time measurements for pneumatic screwing machine width (small)
26 23 24 27 28 28 34 23 22 36 25 32 25 25 23 26 28 23 22 36
27 25 23 26 27 25 25 24 24 24 23 26 28 30 29 28 24 34 27 24
27 29 23 27 28 27 22 25 24 24
Table A.6 Time measurements for pneumatic screwing machine width (medium)
37 34 32 39 35 36 44 31 30 46
30 33 30 32 32 35 36 29 28 48
35 36 42 29 34 33 32 31 32 31
38 32 33 37 39 36 31 44 35 32
37 35 34 30 36 35 29 32 31 31
Table A.7 Time measurements for pneumatic screwing machine width (large)
38 36 41 39 40 39 46 35 34 47
37 35 37 36 34 38 39 34 33 48
39 44 34 38 39 37 36 36 36 35
34 37 40 41 41 39 35 46 39 36
38 38 35 39 40 38 34 36 35 35
Table A.8 Time measurements for pneumatic screwing machine height (small)
27 26 30 28 29 29 34 25 24 35
27 25 26 26 24 28 29 24 24 36
28 32 24 28 28 26 26 26 26 25
24 26 29 30 30 29 25 34 28 26
28 27 25 29 29 28 24 26 25 25
Table A.9 Time measurements for pneumatic screwing machine height (medium)
36 34 41 37 39 38 47 33 32 48
35 32 34 34 32 37 39 31 30 51
38 44 32 37 38 35 35 34 34 33
32 34 39 42 41 37 33 47 38 34
37 36 32 38 39 37 31 35 33 33

Page | 111
Table A.10 Time measurements for pneumatic screwing machine height (large)
52 45 63 54 58 57 78 42 39 82
48 40 47 46 39 52 57 38 36 88
56 72 39 52 55 47 47 44 45 43
40 47 58 64 62 57 43 79 55 45
54 51 40 56 59 54 37 47 43 42
Table A.11 Time measurements for loading after glue
14 19 15 22 17 14 17 16 14 19 20 16 16 25 20 28 14 19 20 17 37 18 15 15 14 17 21 24 23 21 12 15 17 22 19 18 14 20 21 19 18 21 24 18 16 23 19 20 21 28
Table A.12 Time measurements for trimming machine
148 148 150 148 149 148 147 149 149 148 148 148 149 148 147 150 149 149 149 151 146 148 150 148 147 148 148 147 149 149 149 145 149 149 150 147 148 149 148 148 149 145 145 147 148 149 150 150 149 147
Table A.13 Time measurements for heating gun trimming
92 122 97 65 96 90 69 105 114 97 106 105 88 91 75 133 97 110 107 195
95 100 67 81 69 79 78 68 93 108 64 98 98 104 180 68 93 100 80 80
121 93 100 68 81 112 138 129 109 74
Table A.14 Time measurements for rubber placement on frames (small)
62 57 72 64 67 66 84 54 52 55 59 53 58 58 52 63 67 52 50 87 66 79 52 63 65 59 58 56 57 92 53 59 67 73 71 67 55 84 65 55 64 62 53 66 68 64 51 58 55 57

Page | 112
Table A.15 Time measurements for rubber placement on frames (medium)
69 80 73 65 85 75 79 78 101 62 57 78 69 61 68 67 61 73 78 59 75 52 77 94 60 73 76 68 68 65 87 70 61 68 79 86 84 78 64 102 71 76 75 72 61 77 80 75 58 68
Table A.16 Time measurements for rubber placement on frames (large)
76 99 85 82 91 86 88 88 99 81 84 82 83 80 83 83 80 86 88 79 84 87 87 96 79 86 87 83 83 82 88 90 80 83 88 92 91 88 82 99 79 82 86 85 80 87 89 86 79 83
Table A.17 Time measurements for rubber placement on doors (small)
114 110 123 116 136 125 130 128 158 113 139 133 119 112 118 117 111 123 129 111 107 125 127 149 111 123 126 118 118 115 122 128 112 118 130 138 135 129 114 159 118 134 124 122 112 128 131 125 110 118
Table A.18 Time measurements for rubber placement on doors (medium)
120 125 128 123 117 122 122 116 128 134 116 117 135 132 154 116 128 131 123 122 147 124 152 116 123 135 143 140 134 119 132 112 138 129 127 117 132 135 130 115 140 117 127 120 141 130 134 133 162 118
Table A.19 Time measurements for rubber placement on doors (large)
140 134 132 133 136 143 140 146 142 134 153 146 145 139 138 133 148 143 140 133 135 137 138 135 147 140 141 142 162 134 133 140 136 133 136 136 142 139 142 133 147 134 141 155 133 139 133 136 136 135

Page | 113
Table A.20 Time measurements for mechanism placement (small)
321 305 347 326 335 332 382 298 292 390 312 295 310 310 293 322 334 291 286 404 330 367 292 322 328 311 310 304 306 301 293 311 336 350 345 334 301 383 328 306 325 320 295 331 337 326 289 310 302 298
Table A.21 Time measurements for mechanism placement (medium)
336 320 361 340 349 347 394 314 308 401 327 311 325 324 309 337 348 307 302 414 345 380 308 337 342 327 325 319 321 316 310 326 350 363 360 348 317 395 342 321 340 335 311 345 351 340 305 325 317 314
Table A.22 Time measurements for mechanism placement (large)
404 367 465 415 436 431 546 351 337 564 384 344 379 377 339 408 433 334 322 596 426 512 337 407 420 381 379 365 369 357 341 382 438 471 460 434 359 549 421 368 414 403 343 428 441 416 330 378 360 352
Table A.23 Time measurements for the placement of Kenfer
85 82 82 78 89 83 85 85 97 76 90 90 80 76 80 79 75 83 85 75 70 76 85 93 75 83 84 80 80 78 75 81 76 80 86 89 88 85 77 97 80 88 83 82 76 85 86 83 74 80
Table A.24 Time measurements for loading and cleaning (small)
15 12 21 16 18 18 28 10 9 29 13 10 13 13 10 16 18 9 8 32 17 25 9 16 17 13 13 12 12 11 10 13 18 21 20 18 11 28 17 12 16 15 10 17 19 16 9 13 13 11

Page | 114
Table A.25 Time measurements for loading and cleaning (medium)
24 19 32 25 28 27 43 17 15 46 21 15 20 20 15 24 28 14 13 50 27 39 14 24 26 21 20 18 19 17 15 21 28 33 32 28 17 43 26 19 25 24 15 27 29 25 14 20 18 17
Table A.26 Time measurements for loading and cleaning (large)
44 33 40 33 35 30 34 30 34 38 58 26 40 43 41 56 39 40 38 35 42 31 49 35 30 35 43 47 48 42 29 43 30 34 39 38 30 44 41 40 59 34 26 38 33 47 40 42 43 62
Table A.27 Time measurements for spacer placement (small)
32 36 29 25 37 31 33 33 48 24 20 25 27 23 26 26 23 30 33 22 35 30 32 43 23 28 31 27 27 25 40 22 23 27 33 38 36 33 25 49 26 29 31 29 23 32 34 31 22 27
Table A.28 Time measurements for spacer placement (medium)
35 31 42 37 39 38 51 29 28 54 33 29 32 32 28 36 38 27 26 57 38 48 28 36 37 33 33 31 31 30 28 33 39 43 42 39 30 52 37 31 36 35 28 38 40 37 27 32 30 29
Table A.29 Time measurements for spacer placement (large)
58 47 53 54 53 46 55 57 54 45 40 58 53 49 59 54 56 56 67 47 58 54 50 46 50 50 46 53 56 45 62 51 55 64 46 53 54 50 50 49 45 49 46 51 56 60 59 56 48 67

Page | 115
Table A.30 Time measurements for glass placement (small)
11 9 14 11 12 12 17 8 8 18 10 8 10 9 8 11 12 8 7 20 12 16 8 1 11 10 10 9 9 8
8 10 12 14 13 12 9 17 11 9 11 11 8 12 12 11 7 10 9 8
Table A.31 Time measurements for glass placement (medium)
12 10 15 12 13 13 19 9 8 20 11 9 11 11 9 12 13 8 8 21 13 17 9 12 13 11 11 9 10 10
9 11 14 15 15 13 10 19 13 10 12 12 9 13 14 12 8 11 10 10
Table A.32 Time measurements for glass placement (large)
13 15 15 13 18 15 16 16 22 13 12 16 14 13 14 14 12 16 16 12 16 18 16 20 12 15 16 14 14 12 18 11 12 14 16 18 18 16 13 22 17 13 15 15 12 16 17 15 12 14
Table A.33 Time measurements for tiles and silicone placement (small)
34 30 41 35 38 37 49 28 27 51 32 28 31 31 27 34 37 27 25 54 36 46 27 34 36 32 31 30 30 29 27 31 38 41 40 37 29 40 36 30 35 34 27 37 38 35 26 31 29 29
Table A.34 Time measurements for tiles and silicone placement (medium)
38 33 45 39 42 41 55 32 29 57 35 31 35 35 30 38 42 29 28 61 41 51 30 38 40 35 35 33 34 32 30 35 42 46 45 42 32 55 40 34 39 38 31 41 43 39 29 35 33 32

Page | 116
Table A.35 Time measurements for tiles and silicone placement (large)
46 53 52 49 60 53 56 55 74 47 57 56 50 47 50 49 47 53 56 46 53 54 55 68 46 53 54 50 50 48 47 56 47 50 56 61 60 56 48 75 59 45 53 52 47 55 57 54 46 50
Table A.36 Time measurements for battens placement (small)
26 19 38 28 33 31 54 16 14 57 22 15 21 21 14 27 32 13 11 63 30 47 13 27 29 22 22 19 20 17 14 22 33 39 37 32 18 54 30 20 28 26 15 31 34 29 12 21 18 16
Table A.37 Time measurements for battens placement (medium)
48 36 66 51 57 56 32 25 40 34 41 29 40 39 28 49 90 31 28 96 54 80 27 49 52 41 56 27 23 105 29 41 58 68 65 57 40 35 37 33 51 47 29 55 59 51 34 91 52 37
Table A.38 Time measurements for battens placement (large)
104 84 93 71 83 126 61 77 81 70 59 90 62 70 62 70 88 104 99 87
105 80 58 76 79 75 62 84 90 80 114 73 73 76 66 100 80 88 86 148
87 65 69 70 62 69 68 61 77 78
Table A.39 Time measurements for transportation (small)
21 19 25 22 23 23 29 18 17 30 19 18 20 19 17 21 23 17 16 32 22 27 17 21 22 20 20 19 19 18 17 20 23 25 24 23 19 29 22 19 22 21 18 22 23 22 17 20 19 18

Page | 117
Table A.40 Time measurements for transportation (medium)
32 30 36 33 34 34 41 28 28 43 31 28 30 30 28 32 34 27 27 45 34 39 28 32 33 31 30 29 30 29 28 31 34 37 36 34 29 42 33 30 33 32 28 34 35 33 27 30 29 29
Table A.41 Time measurements for transportation (large)
48 60 54 62 45 47 51 57 60 59 55 52 52 64 50 54 53 47 56 57 54 56 59 65 54 50 60 55 67 56 49 52 51 59 51 47 51 51 47 54 53 47 52 42 53 64 47 54 55 51