Embed Size (px)
Citation preview
International Geomorphology 1986 Part I Edited by V. Gardiner © 1987 John Wiley & Sons Ltd
GEOMORPHIC PROCESSES OF AN ESTUARINE MARSH: PRELIMINARY RESULTS AND HYPOTHESES
L. M. Collins (*), J. N. Collins (**) and L. B. Leopold (*)
Departments of Geology and Geophysics (*) and Entomology (**), University of California, Berkeley, CA 95720, U.S.A.
ABSTRACT
Tidal energy available for geomorphic work decreases with distance upstream from tidal sources. Headward areas of drainage systems are transitional between tidal and biogenic influences. Levees that develop from inorganic sediment transported by tides are absent in upstream reaches. Contributions of inorganic sediment to soil development are restricted to areas near channel banks. Peat increased from 10 to 45% of total soil weight within 15m of a third order channel. The form of channels in cross section and profile varies in relation to tidal range. Where the full range is exhibited, the ratio of channel width to depth is greater than unity. Where thalweg elevation exceeds mean low tide level, the ratio is less than unity. Although thalweg gradient increases upstream, the relation of width to distance was found to be nearly constant between upstream and downstream reaches (2.6 cf. 2.8m width change per 1000m length, respectively).
Overall configuration of channel networks is affected by vegetation that regulates the distribution of tidal energy in headward reaches. Plant growth that constricts the cross section of a first order channel initiates its retrogression, which involves the formation of subterranean channels, potholes, and channel pans. The tidal prism displaced by retrogression is accommodated elsewhere by headward erosion. Differences in tidal schedule between opposing drainage systems represent potential hydraulic gradients across drainage divides. When headward erosion causes channel capture, the zone of flood tide convergence shifts towards the channel with the later schedule. The result is a channel that is continuous between two tidal sources. Eventually, a new divide is formed by rapid sedimentation within the convergence zone.
Drainage divides are often occupied by 'turf pans' that function as water storage compartments and result from intrinsic variability in plant productivity. Each physiographic feature of the marsh plain is distributed within a predictable narrow range of elevation.
1049
1050 L. M. Collins et al.
INTRODUCTION
Information about geomorphic processes of tidal marshes has been developed for a wide range of marsh structure, configuration, tidal regimen, and degree of human disturbance. A substantial part of what is known about the physical nature of marshes is contained in a few treatises that regard the particular physiographic history or morphology of selected marshes in North America and Western Europe (for example, Yapp et al., 1917; Steers, 1960; Redfield, 1965, 1972; Pethick, 1971; Atwater et al., 1979). This literature has fully established the general paradigm that the creation and elaboration of a marsh requires retention of sediment delivered by tides and subsequent colonization by vascular plants. Most geomorphic studies of mature marshes focus upon a single aspect of physiography such as low gradient channels (Ragotzkie, 1959; Pestrong, 1965; van Eerdt, 1985) or shallow lentic features (for example, Pethick, 1974; Kessel and Smith, 1978). A summary of the literature suggests that different geomorphic processes operate within mature marshes to create features with different forms. Apparently no research, however, has considered the hydrogeomorphic Interactions that maintain the system of transport and storage of water and sediment that we recognize as tidal marshland.
The mature marshes of the North American Pacific Coast are in part differentiated from youthful marshland of the same area by less frequent and briefer periods of tidal inundation. Each of these main types probably has characteristic channels, microtopography, and processes of formation and maintenance. We aim to examine for the mature type the physical and biological character and to discover from thess the significant processes that govern morphological change through time and the maintenance of quasi-equilibrium.
The research emphasizes the evolutionary dynamics of low order tidal channels and lentic environments. The findings are only expected to apply directly to marshes of similar structure and configuration as the study area, but might also indicate investigative approaches suitable for a variety of marsh conditions. Since the landscape is regarded as a dynamic physical template for biological activity, the geomorphic analysis will contribute to the restoration and conservation of tidal marsh ecosystems.
THE AREA
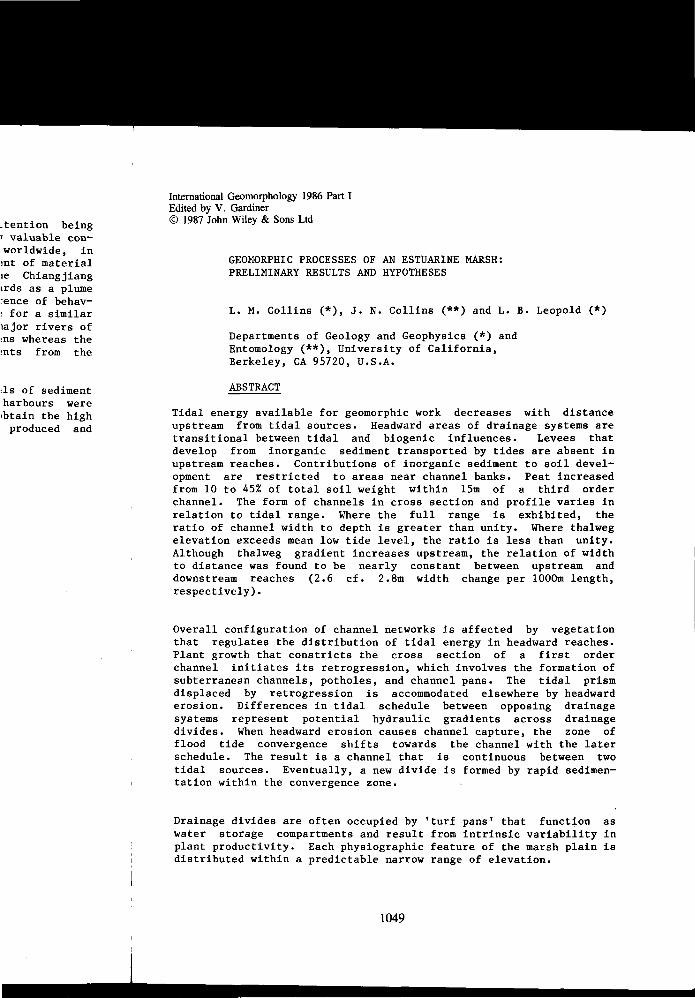
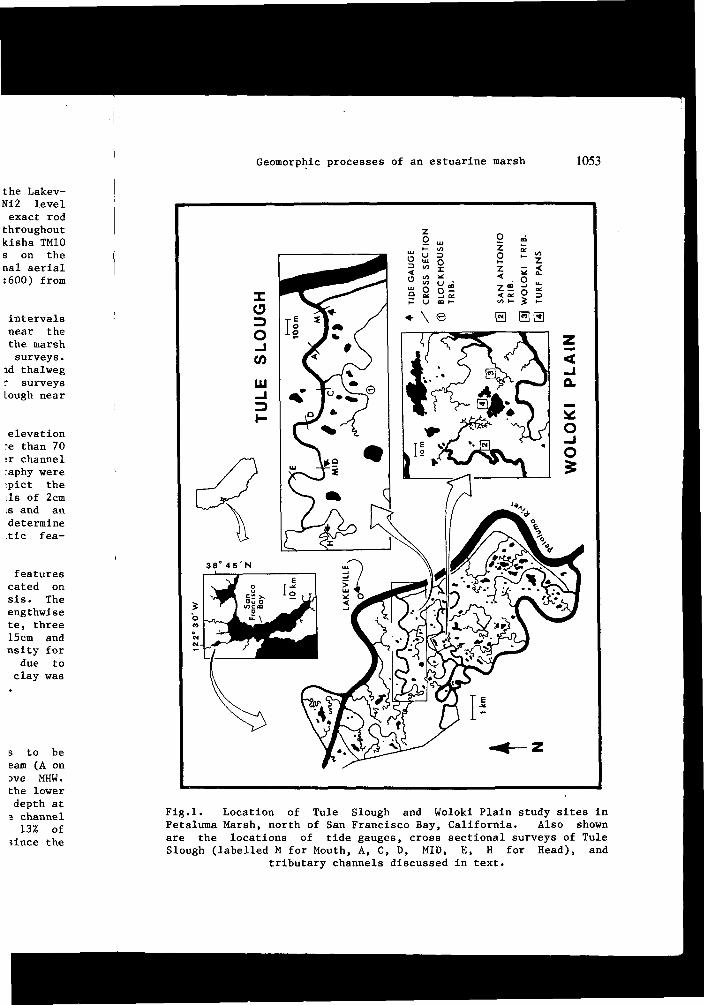
This project is being conducted at Petaluma Marsh, a 1145ha estuarine salt and brackish water tidal marsh located along the Petaluma River about 10km north of San Francisco Bay, California, U.S.A. (Fig.l). The Mediterranean climate of the central California coast is moderated at the marsh by coastal weather, including marine fog that commonly invades the Bay Area during the dry season. Average annual rainfall is less than 60cm, most of which normally falls between November and April. The regional tidal pattern is mixed (i.e., two unequal high and low tides occur each lunar day). Although the highest annual tides are predicted for January and July, the deepest inundation occurs during extreme and infrequent storm events, when

Geomorphic processes of an estuarine marsh 1051
the marsh receives upland flood waters from the Petaluma River. During the intense storm of early January 1982, for example, flood water attained a depth greater than lm above most of the marsh. Otherwise the depth of inundation across the marsh surface is usually less than 20cm (Collins and Resh, 1985).
Petaluma Marsh is a relatively pristine remnant of historical tidal marsh that until the advent of land reclamation in the middle of the last century nearly encircled the San Francisco Bay. The marsh is mostly comprised of peat and clay that contact ancient mudflat sediments at an average depth of 3.0m below the current marsh surface. There has been an upward building of the marsh with sea level rise. The maximum age of the marsh has been estimated to be 3000 to 5000 years (Atwater, 1979).
The marsh flora is typical of mature, high elevation estuarine salt marshes of northern California. The marsh plains between channels support almost a monoculture of pickleweed (Salicornea virginica L.) although other plant species including frankenia (Frankenia grandifo-lia Cham, and Schlech.), salt bush (Atriplex patula L.), jaumea (Jaumea carnosa [Less] Gray) and salt grass (Distichilis spicata [L.] Greene) co-occur with pickleweed in some areas. The elevational succession of species which is apparent at higher gradient salt marshes is indistinct at Petaluma Marsh, except along its margins. The natural levees support gumplant (Grendelia humilis Hook, and Arm.) and coyote brush (Bacharris pilularis D.C.) while slump blocks in channels are colonized by cordgrass (Spartina foliosa Trin.). Isolated colonies of bullrush (Scirpus spp.) occupy areas of low elevation adjacent to some headward channels.
Different aspects of geomorphology are investigated at two study sites within the central region of the marsh (Fig.l). The morphology of major channels is represented by Tule Slough, which has a total length greater than 7000m and receives no contribution from upland flow. The mouth of this slough opens directly into the river and does not adjoin a tidal mudflat. The dynamics of the marsh surface and its minor channels are examined for Woloki Plain, a 4.5ha area of the interior marsh surface that receives tidal water via Woloki and San Antonio sloughs.
Any confluence between the river and a channel that drains the marsh is regarded as the tidal source for that channel. We use the convention that downstream is the direction of the ebb tide.
MATERIALS AND METHODS
The field studies involved the microtopography of the marsh surface, the cross section and shape of channels large and small, the distribution of vegetation, and its relation to substrate. The elevations reported in this paper are referenced to the mean lower low water (MLLW) tidal datum of the Lakeville Marina (Fig.l), as determined by the National Oceanic and Atmospheric Administration (N0AA) for the 1960-78 tidal epoch. For the benefit of this project a survey crew of the California State Lands Commission established a temporary
1052 L. M. Collins et al.
benchmark within the marsh interior that was referenced to the Lakev-ille tidal datum. All surveys were performed with a Zeiss Ni2 level and a standard rod fitted with a bullseye level to assure exact rod vertical!ty. Elevatlonal closure of ±3mm was achieved throughout the study. A Red2A electronic distance meter and a Sokisha TM10 Theodolite were used to position horizontal control markers on the marsh surface for production of engineering-scaled orthogonal aerial photographs. These were used to produce photomaps (scale 1:600) from mylar positives of the study sites.
The cross sections of Tule Slough were surveyed at varying intervals along a 4250m long fourth-to-fifth order segment beginning near the tidal source (Fig.l). Levees along banks and portions of the marsh surface within 8m of each channel bank were included in the surveys. This permitted the description of levee heights and bank and thalweg profiles for the downstream half of Tule Slough. Similar surveys were developed for Blockhouse Tributary, which joins Tule Slough near an intermediate station (Fig.l).
To describe the surface topography of Soloki Plain, ground elevation was surveyed at more than 4000 points along a network of more than 70 transects that extended between lentic features and low order channel banks. The transect data and low altitude infrared photography were used to produce a high resolution topographic map. To depict the detail of superficial drainage patterns, contour intervals of 2cm were required. Comparisons between modern aerial photographs and an historical plane table map (Rogers, 1860) were made to determine general changes in number and planimetric morphology of lentic features and tidal channels.
Substrate cores were taken to verify the location of major features that are not apparent on modern photographs but are indicated on historical maps, and to collect samples for soil analysis. The coring device was a 38mm diameter steel pipe 2m long cut lengthwise to expose a core sample lm long. At each coring sample site, three replicates were taken from each of two depth intervals, 0-15cm and 30-45cm below the ground surface. Values of soil bulk density for field conditions were estimated as the volume of water lost due to complete desiccation by oven drying. The ratio of peat to clay was determined as the percent weight lost upon ignition at 450°C.
RESULTS AND DISCUSSIONS
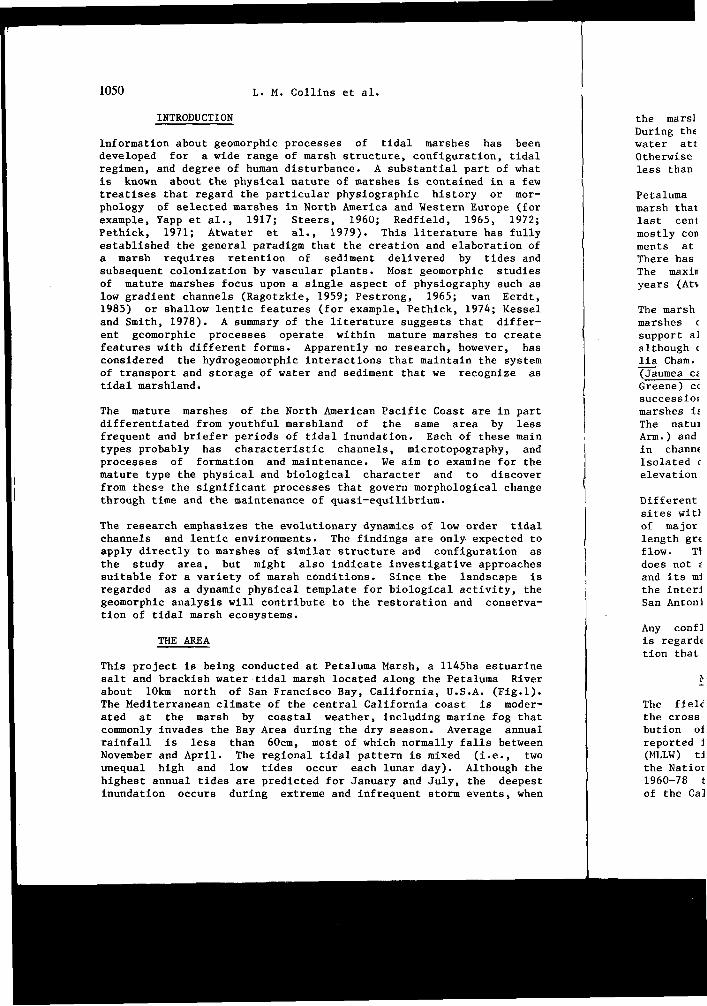
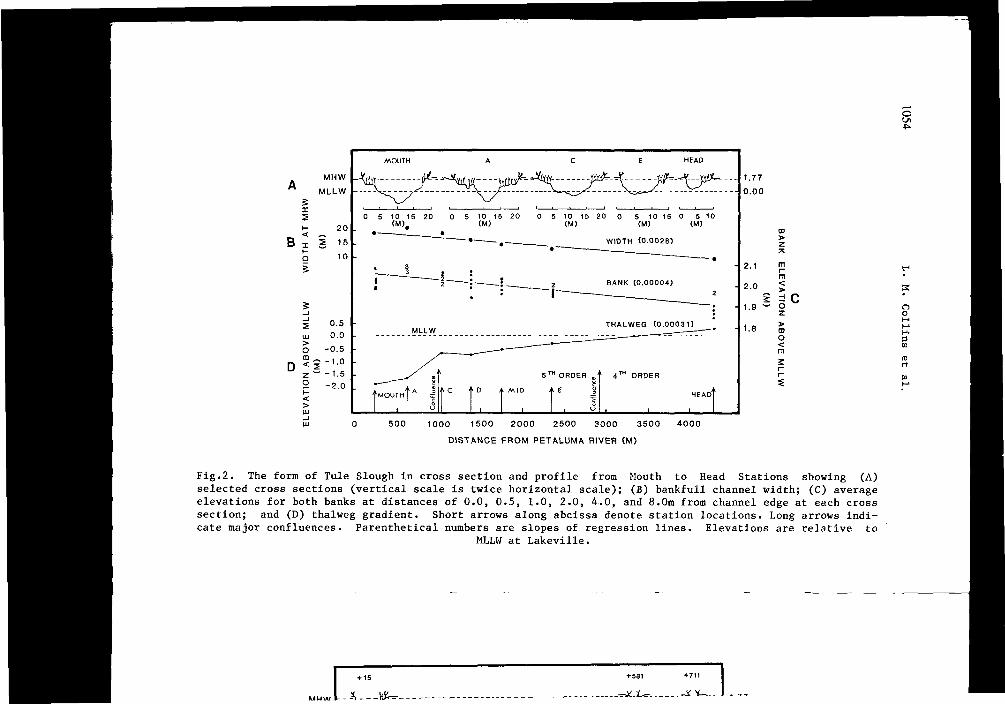
Major Channels. The cross section of Tule Slough tends to be triangular downstream and becomes more semicircular upstream (A on Fig.2). Natural levees that adjoin the channel protrude above MHW. At the upstream end this protrusion is nearly zero and at the lower end it is about 30cm. As for MLLW, it is about half channel depth at the downstream end of the system but near the level of the channel bed at a place 3500m upstream from the mouth. The upper 13% of channel length becomes drained of water at the ebb tide, since the bed elevation is above the plain of MLLW (D on Fig.2).
Geomorphic processes of an estuarine marsh 1053
38° 4 5 ' N
s / E .if o ^ a ,4 W SS >• ^ a
% r \ o u o % 1 </)CtO
o A £ \ Mm* n ~ - ^ B ^ a M •p N ^^^^^^^H_ _._ ^ C4- ^ -sy\m IB^I M •i
Fig.l. Location of Tule Slough and Woloki Plain study sites in Petaluma Marsh, north of San Francisco Bay, California. Also shown are the locations of tide gauges, cross sectional surveys of Tule Slough (labelled M for Mouth, A, C, D, MID, E, H for Head), and
tributary channels discussed in text.
B Q
5
20 .
15
10
0.5 -
0.0
-0.5
5-i.o - -1.5
-2.0
0 5 10 15 20 0 5 10 15 20 0 5 10 15 20 0 5 10 15 0 5 10 CM). (M) (M) (M) (M)
WIDTH (0.0028)
THALWEG (0.00031)
2.1
2.0
1.9
1.8
m
>
z > CD o < m
2 r-r-
w 0 500 1000 1500 2000 2500 3000 3500 4000
DISTANCE FROM PETALUMA RIVER (M)
Fig.2. The form of Tule Slough in cross section and profile from Mouth to Head Stations showing (A) selected cross sections (vertical scale is twice horizontal scale); (B) bankfull channel width; (C) average elevations for both banks at distances of 0.0, 0.5, 1.0, 2.0, 4.0, and 8.0m from channel edge at each cross section; and (D) thalweg gradient. Short arrows along abcissa denote station locations. Long arrows indicate major confluences. Parenthetical numbers are slopes of regression lines. Elevations are relative to
MLLW at Lakeville.
*; Wfe-=-_
+ 581 + 7 "
_^*.i^. scsu.
selected cross sections (vertical scale is twice horizontal scale); (B) bamuun cnannei. wiatn; (^j iVeia6c elevations for both banks at distances of 0.0, 0.5, 1.0, 2.0, 4.0, and 8.0m from channel edge at each cross section; and (D) thalweg gradient. Short arrows along abcissa denote station locations. Long arrows indicate major confluences. Parenthetical numbers are slopes of regression lines. Elevations are relative to
MLLW at Lakeville.
MHW
MLLW
+ 15 + 581 +711
^ J U A^- 1.77 0 .00
MHW
MLLW
1.77 0 .00
0 5 10 15 (M) •
0 5 10 0 5 (M) (M)
3.5 S
ML
LW
2.5
• • • • . WIDTH (0.0026)
BANK (0.00016)
•
3.0
2.5 -2
2.0 —
.1.5
1.0
OQ D
TH
AT
M
HW
LLI **-*'t~*v \_^v^v*v^v* - ^~»^ «=I^>*--**V*-~-V****<?-N^"=»=K^I?*-*~'~
O CD
1.5
S 1.0
0.5
0.0
- 0 . 5
THALWEG (0.00067)
Z
n
1.5
S 1.0
0.5
0.0
- 0 . 5
/ ) T~~
THALWEG (0.00067)
EL
EV
AT
I
1.5
S 1.0
0.5
0.0
- 0 . 5 • ' 4 ™ ORDER
+ 15
I I
Con
flue
nce
3 RD ORDER
1 1 1 1 Co
nfl
ue
nce
2"° ORDER
+ 581 +711
- J I ' • '
100 200 300 400 500
DISTANCE FROM TULE SLOUGH
600 700
O ID o 5 o
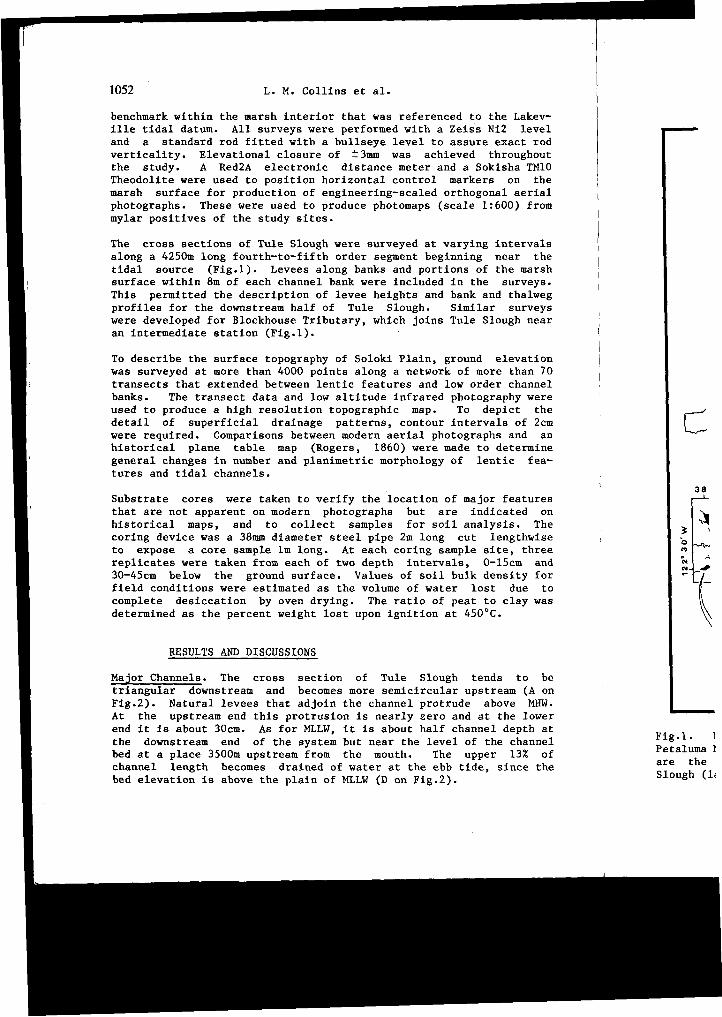
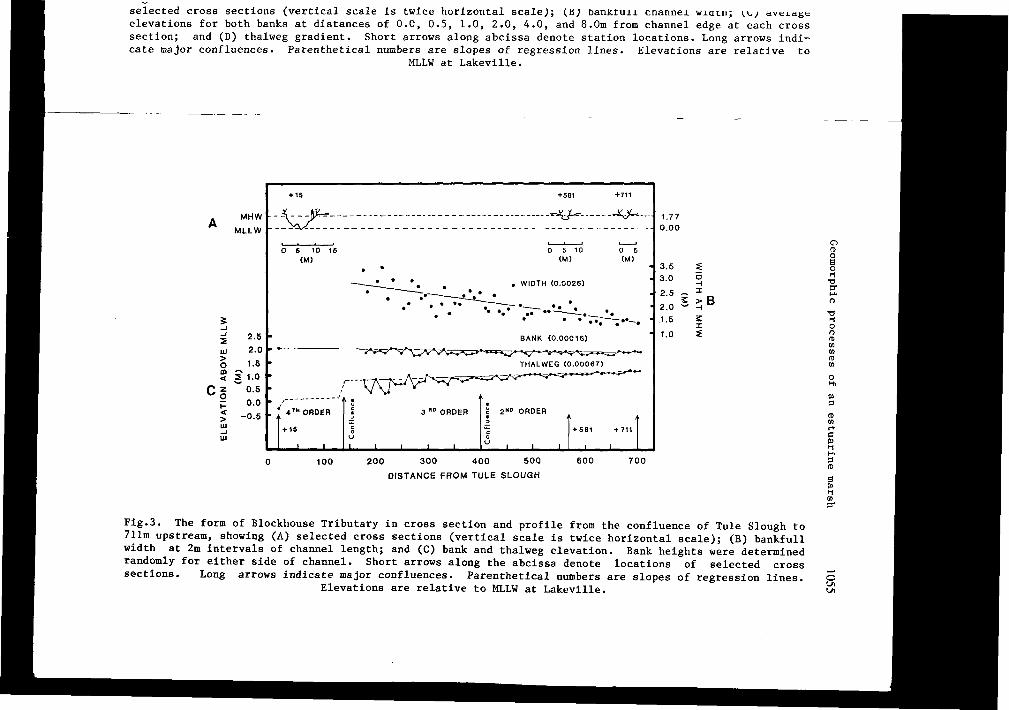
Fig.3. The form of Blockhouse Tributary in cross section and profile from the confluence of Tule Slough to 711m upstream, showing (A) selected cross sections (vertical scale is twice horizontal scale); (B) bankfull width at 2m intervals of channel length; and (C) bank and thalweg elevation. Bank heights were determined randomly for either side of channel. Short arrows along the abcissa denote locations of selected cross sections. Long arrows indicate major confluences. Parenthetical numbers are slopes of regression lines.
Elevations are relative to MLLW at Lakeville. o L/l L/l

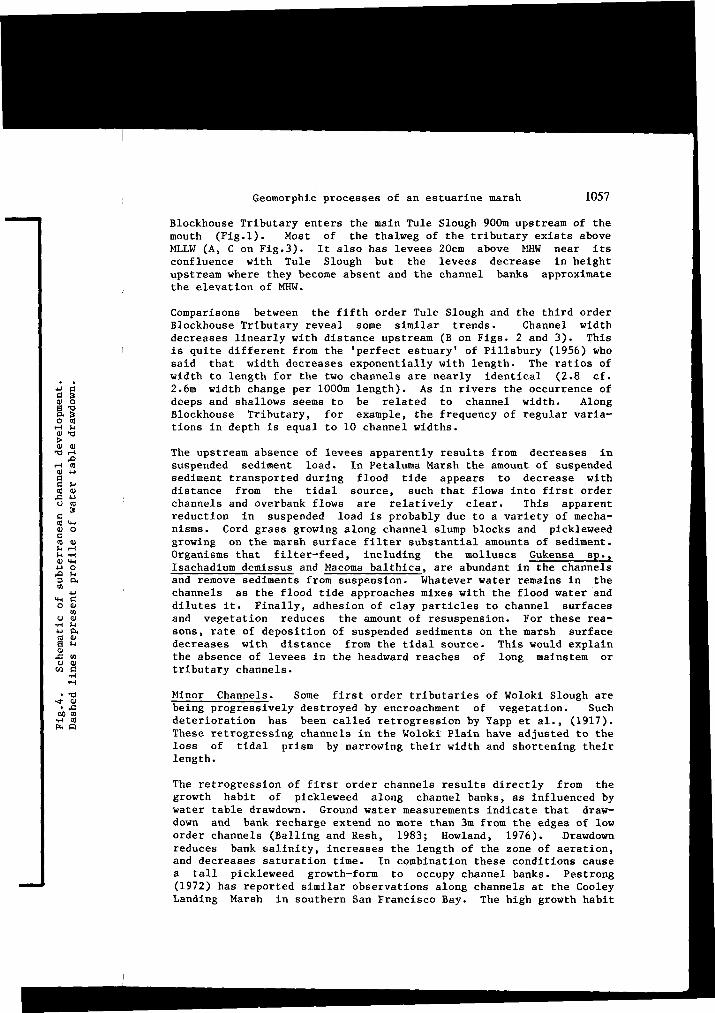
Fig.4. Schematic of subterranean channel development. Dashed lines represent profile of water table drawdown.
I - 1 *~\ 01 01 I-I o a *! no H M M H a. rr X f t r t a 01 01 a n 01 M O O P 3 rt n o. 01 01 H r t W o. M «! 01 H - CL bd o £ £ o s 3 W
01 H-* n re i-i o 0> M rr re O D - re re H - rt 3 " ro o 3 H - 3 " 3 01 rt rt H - re 3 " H - re c 3 " M- M re . H» 01 01 re M o 3 - > 3 o t-1 o M
rt VO D . CL a. *: r t O re 9 m m r t H - 3 H - re n s a H-1 01 CL 01 OP O 01 a 01 01 a oi re o o re Cti a. H - o o y re to 3 t - l c O
n. ~-J r t r n> rt n> si 0 9 01 en re 3 o rr rt 01 c 3 n 01 S a c 3 r t H. "0 3 n T ) B r t O . . Q rt n •a r t H> r t ( 1
to 01 a o rt rt rt r t re 1-1 0 0 rt c 01 m •* r t 3 rt 3 " 3 H - 01 n 3 0) S re c 01 ?r 01 rr C (0 K w re rt M rr IS'
n " ^ I-" m re rr in 3 " H - r t rr 01 < re (11 re 01 H - 3 . r t re 3 re s •o rr H - 01 D- rt fc? 2 3 / - s 3
w o n 01 r t o I-I o -a 01 01 01 rt re 01 M N a 01 0 0 H - M o s a. 01 H - o p t, r t r t r t 01 O H - 5 2 re 1> O 3 " « rr rt 01 rt H i re rt rt n rt re rn 01 no 01 o H - B o 01 re rt re r t 3 e 3 H - O 3* re re c 01 <! B 3 "* ^ c 01 m Oi o. i f s* o r t 01 O 3 * ><! rt 01 r t ro H- < c 01 o 3 a. rt 01 Q . a. » 01 01 o 01 n ^ rn HM fti p ^ * -* _ '— ~
Geomorphlc processes of an estuarine marsh 1057
Blockhouse Tributary enters the main Tule Slough 900m upstream of the mouth (Fig.l). Most of the thalweg of the tributary exists above MLLW (A, C on Fig.3). It also has levees 20cm above MHW near its confluence with Tule Slough but the levees decrease in height upstream where they become absent and the channel banks approximate the elevation of MHW.
Comparisons between the fifth order Tule Slough and the third order Blockhouse Tributary reveal some similar trends. Channel width decreases linearly with distance upstream (B on Figs. 2 and 3). This is quite different from the 'perfect estuary' of Pillsbury (1956) who said that width decreases exponentially with length. The ratios of width to length for the two channels are nearly identical (2.8 cf. 2.6m width change per 1000m length). As in rivers the occurrence of deeps and shallows seems to be related to channel width. Along Blockhouse Tributary, for example, the frequency of regular variations in depth is equal to 10 channel widths.
The upstream absence of levees apparently results from decreases in suspended sediment load. In Petaluma Marsh the amount of suspended sediment transported during flood tide appears to decrease with distance from the tidal source, such that flows into first order channels and overbank flows are relatively clear. This apparent reduction in suspended load is probably due to a variety of mechanisms. Cord grass growing along channel slump blocks and pickleweed growing on the marsh surface filter substantial amounts of sediment. Organisms that filter-feed, including the molluscs Gukensa sp., Isachadium demissus and Macoma balthica, are abundant in the channels and remove sediments from suspension. Whatever water remains in the channels as the flood tide approaches mixes with the flood water and dilutes it. Finally, adhesion of clay particles to channel surfaces and vegetation reduces the amount of resuspension. For these reasons, rate of deposition of suspended sediments on the marsh surface decreases with distance from the tidal source. This would explain the absence of levees in the headward reaches of long mainstem or tributary channels.
Minor Channels. Some first order tributaries of Woloki Slough are being progressively destroyed by encroachment of vegetation. Such deterioration has been called retrogression by Yapp et al., (1917). These retrogressing channels in the Woloki Plain have adjusted to the loss of tidal prism by narrowing their width and shortening their length.
The retrogression of first order channels results directly from the growth habit of pickleweed along channel banks, as influenced by water table drawdown. Ground water measurements indicate that drawdown and bank recharge extend no more than 3m from the edges of low order channels (Balling and Resh, 1983; Howland, 1976). Drawdown reduces bank salinity, increases the length of the zone of aeration, and decreases saturation time. In combination these conditions cause a tall pickleweed growth-form to occupy channel banks. Pestrong (1972) has reported similar observations along channels at the Cooley Landing Marsh in southern San Francisco Bay. The high growth habit
1058 L. M. Collins et al.
enables pickleweed branches to entangle across narrow headward channels. The branches overhang and collapse to form a fibrous bridge that collects sediment and floating debris. Slowly the channel constricts from the surface downward (Fig.4). A similar process has been described by Yapp et al., (1917) for the marshes of Dovey, England, and might be common among mature marshes with a similar clay-rich structure. The process of pickleweed bridging results in the formation of subterranean channels, which in time become occluded and cause the channel head to retrogress downstream. Water draining from ports can be observed in the banks of larger channels. Beyond these ports, subterranean channels can be traced by the occurrence of bullrush, surface rills, and exposed channel remnants. Complete blockage of low order channels by undercut bank material has been reported for other marshes (Chapman, 1974; Pestrong, 1965), but has not been observed in the Petaluma Marsh. Subterranean channels are important in providing drainage to high elevation marsh plains. Failure to consider them may be a source of substantial error in the calculation of drainage density for mature marshes.
Remnant first order segments that are wider than average persist as "channel pans" (Yapp et al., 1917) and potholes. The relatively deep features that have not yet lost subterranean access to tidal flow are called "potholes" to distinguish them from shallow channel pans that are isolated from direct tidal action and only receive water during inundation. Potholes usually have a diameter of less than 3m, but can be lm deep. Channel pans, as defined here, can have similar diameters but are usually less than 0.2m deep. Kessell and Smith (1978) report that within the sandy marshes of Nigg Bay, Scotland, pothole and channel pan formation results from the partial exhumation of pre-existing subterranean pipes. This process of pan formation is not apparent in the Petaluma Marsh.
The retrogression of one channel can cause another channel to erode headward. If the growth of vegetation that constricts one channel does not affect a reduction in downstream cross section, then some fraction of the tidal prism must be redirected to another channel in the same drainage area. The increase in prism of a small headward channel is apparently accommodated by an increase in channel length. Erosion of organic turf at the head of a first order channel is probably accomplished more easily than downstream erosion of clay banks.
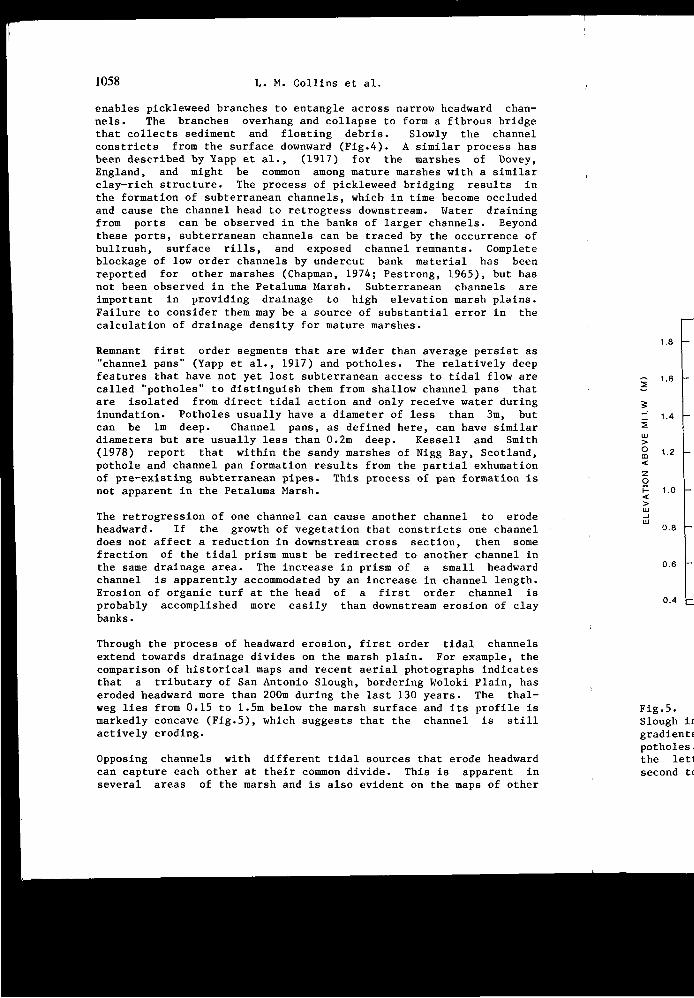
Through the process of headward erosion, first order tidal channels extend towards drainage divides on the marsh plain. For example, the comparison of historical maps and recent aerial photographs indicates that a tributary of San Antonio Slough, bordering Woloki Plain, has eroded headward more than 200m during the last 130 years. The thalweg lies from 0.15 to 1.5m below the marsh surface and its profile is markedly concave (Fig.5), which suggests that the channel is still actively eroding.
Opposing channels with different tidal sources that erode headward can capture each other at their common divide. This is apparent in several areas of the marsh and is also evident on the maps of other
Geomorphic processes of an estuarine marsh 1059
DISTANCE ALONG CHANNEL (M)
Fig.5. Thalweg profiles of retrogressing tributaries of Wolokl Slough in the vicinity of Woloki Plain. Dotted lines show thalweg gradients prior to retrogression, as indicated by base elevations of potholes. Arrows indicate changes in channel order. For example, the letter A indicates where the lower order tributary changes from second to third order. Parenthetical numbers are average thalweg
slopes excluding steep steps at confluences.
1060 L. M. Collins et al.
z o
1.8 — 1 " ORDER ^ * » f .
1.6 - / 1»* -. p—i ORDER 7y (0.006)
1.4
1 •*' /
— 1 " ORDER
I •''•*"''
1.2
2ND
* / >
1.0
0.8 ,
_ ORDER
U s 2 H D
' ORDER
'"< 2"° ORDER (0.004)
A
• THALWEG
0.6 _ / + POTHOLE BOTTOM
/ •^ (O.OOD 3»o ORDER 1 1 1 I I I I I I 50 100 150 200 250 300 350 400 450
DISTANCE ALONG CHANNEL (M)
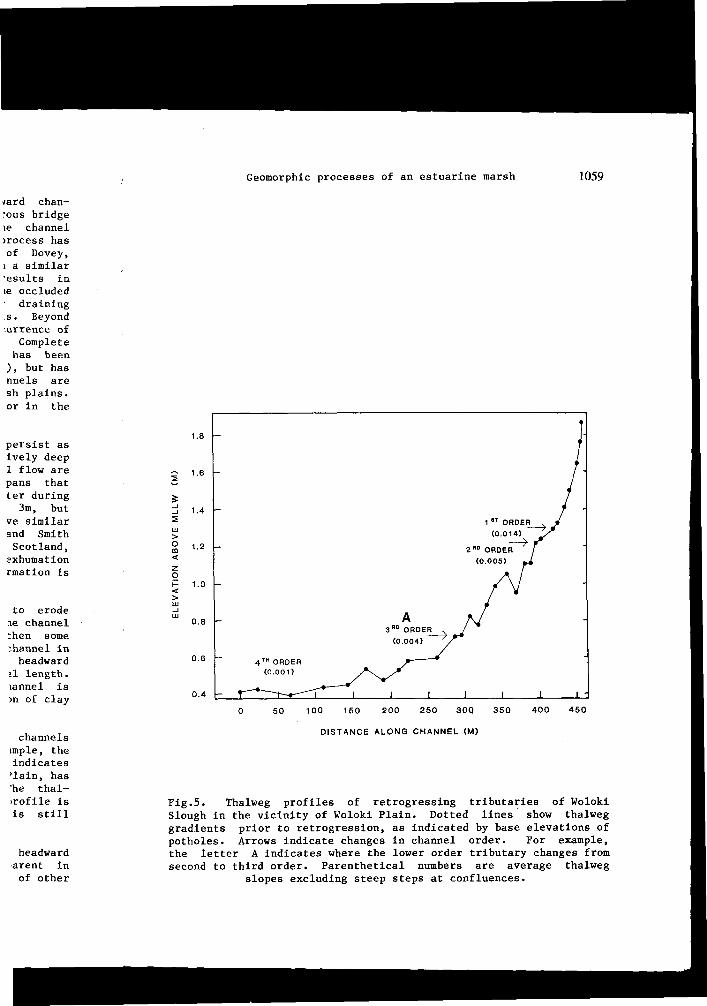
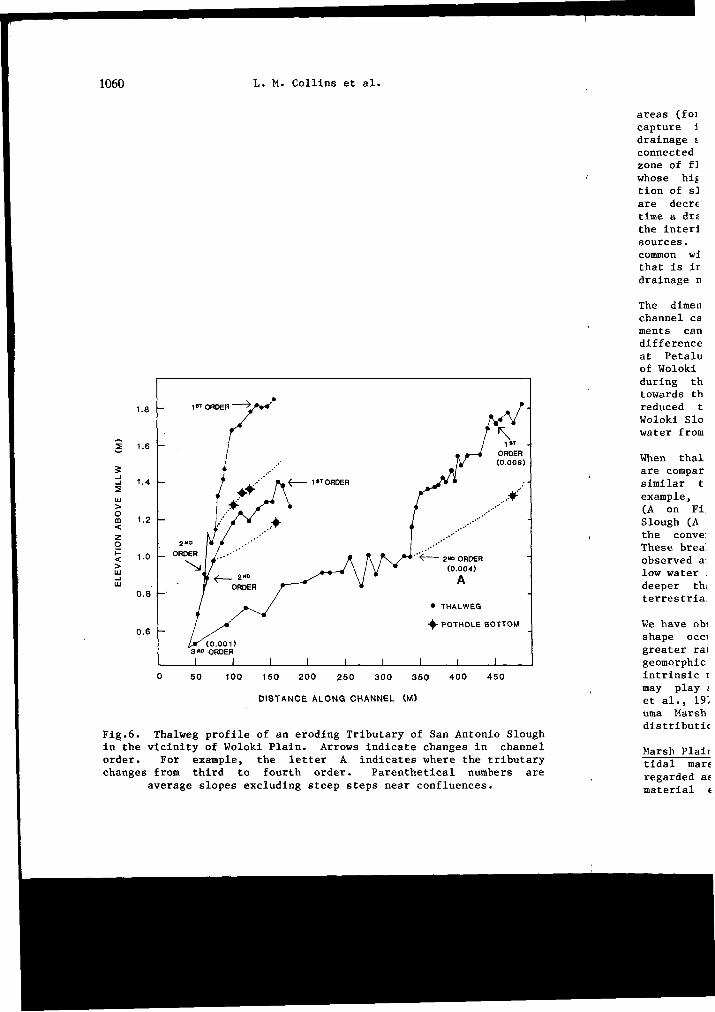
Fig.6. Thalweg profile of an eroding Tributary of San Antonio Slough in the vicinity of Woloki Plain. Arrows indicate changes in channel order. For example, the letter A indicates where the tributary changes from third to fourth order. Parenthetical numbers are
average slopes excluding steep steps near confluences.
Geomorphic processes of an estuarine marsh 1061
areas (for example, Pestrong, 1965). The initial result of channel capture is usually the interconnection of two entirely separate drainage systems. If the tidal schedule varies between the two connected drainages, a hydraulic gradient will exist that causes the zone of flood stage convergence to shift downstream along the channel whose high tide is later in time. At the convergence zone the duration of slack high water is longer and discharge and velocity maxima are decreased. Consequently, sedimentation rates are increased. In time a drainage divide can develop at the convergence zone, but in the interim a channel is created that is continuous between two tidal sources. This is called a looped slough. The tidal loops which are common within mature marshes probably represent a successional stage that is intermediate between the combination and division of opposing drainage networks.
The dimensions of channels within drainages that are subject to channel capture must adjust to changes in tidal prism. The adjustments can be insignificant or great, depending upon the degree of difference in tidal schedules. An analysis of historical conditions at Petaluma Marsh revealed that the headward extent of the mainstem of Woloki Slough was captured by a tributary of San Antonio Slough during the last century. The convergence zone shifted downstream towards the mouth of Woloki Slough, where sedimentation has since reduced the channel dimensions. The original headward region of Woloki Slough increased from first to fourth order and now receives water from San Antonio Slough.
When thalweg profiles for retrogressing and eroding channel systems are compared, those in retrogression are shown to have gradients similar to an eroding channel of the next higher order. For example, an eroding second order tributary of San Antonio Slough (A on Fig.5) and a retrogressing third order tributary of Woloki Slough (A on Fig.6) have equivalent slopes. The short steep steps of the convex thalweg correspond to places where stream order changes. These breaks in gradient that resemble hanging valleys are commonly observed and suggest that low order thalwegs are graded to an average low water level of the larger confluent channel, rather than to its deeper thalweg. This distinguishes tidal confluences from those of terrestrial systems.
We have observed that changes in drainage configuration and channel shape occur in a mature and relatively pristine tidal marsh at greater rates than can be attributed to sea level rise. Substantial geomorphic work is accomplished along energy gradients produced by intrinsic marsh processes. Although extreme tidal and storm events may play an important geomorphic role in some marshes (Bayliss-Smith et al., 1979), morphological changes among drainage systems in Petaluma Marsh mainly result from biogenic activities that regulate the distribution of tidal energy at drainage divides.
Marsh Plains. Generally the net direction of sediment flux for a tidal marsh is assumed to be landward. Marshes have therefore been regarded as natural filters that reduce the quantities of inorganic material entering marine systems (for example, Sather and Smith,
1062 L. M. Collins et al.
1984). Retention of sediments delivered by tides might be restricted, however, to areas nearest channels.
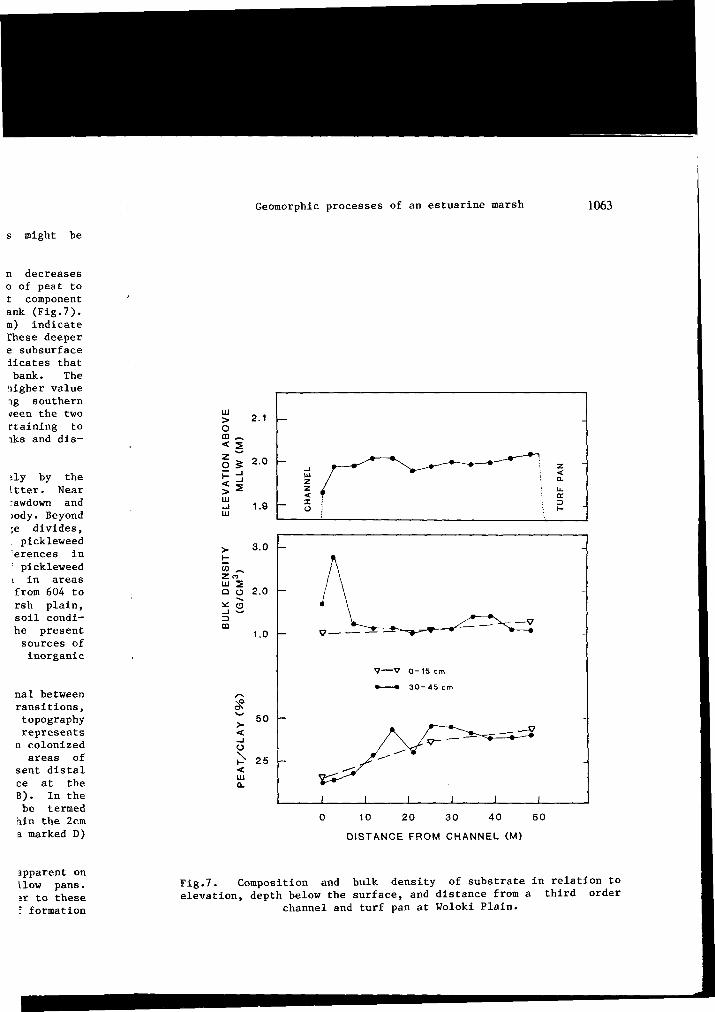
We have observed that the rate of inorganic sedimentation decreases with distance from channel banks. Analysis of the ratio of peat to clay in shallow cores (0-15cm) revealed that the peat component increased by almost 300% with distance from a channel bank (Fig.7). Substrate samples taken from a deeper stratum (30-45cm) indicate similar but more irregular patterns of peat increase. These deeper samples represent ancient physiography as well as possible subsurface eluviation. The analysis of soil bulk density also indicates that peat abundance increases with distance from a channel bank. The maximum value of 45% peat by weight represents a much higher value than reported by Pestrong (1965) for younger marshes along southern San Francisco Bay. Comparisons of percent peat between the two sites, however, are confounded by lack of information pertaining to the location of his sample sites relative to channel banks and distance from the tidal source.
In Petaluma Marsh, peat turf is produced almost entirely by the accumulation of plckleweed roots, rhyzomes, and surface litter. Near channel banks, which are characterized by water table drawdown and abundant clay, plckleweed tends to be tall, sparse, and woody. Beyond channel influences and especially on the broad drainage divides, where the water table is usually very high and saline, plckleweed tends to be uniformly short, dense and fleshy. The differences in plant architecture cause, annual above-ground production of plckleweed to be significantly higher on the open marsh plain than in areas adjacent to low order channels. Values reported range from 604 to 1086 g m_2year-> for a first order channel and the marsh plain, respectively (Balling and Resh, 1983). The analysis of soil conditions and primary production rates suggests that most of the present interior marsh surface has developed from intrinsic sources of organic matter, rather than by deposition of imported inorganic sediment.
The headward extensions of drainage systems are transitional between tidal and biogenic influences. To characterize these transitions, careful study was made of the Woloki Plain surface topography (Fig.8). The lowest topography (1.7 to 1.8m above MLLW) represents interior areas of an extinct lentic feature that has been colonized by vegetation (for example, the region marked A ) . Broad areas of ground within the next higher 10cm contour interval represent distal margins of the extinct feature, as well as the marsh surface at the headward ends of first order tributaries (area marked B). In the interval 1.9 to 2.0, overland flow paths or what might be termed broad shallow rills are apparent (area marked C). Within the 2cm interval between 2.00 to 2.02, broad drainage divides (area marked D) incorporate much of the open marsh plain.
Only slight and irregular variations in ground height are apparent on drainage divides, except where they intersect at large shallow pans. These are basins that usually contain water. We refer to these lentic features as 'turf pans' to distinguish their mode of formation
s might be
Geomorphic processes of an estuarine marsh 1063
n decreases o of peat to t component ank (Fig.7). m) indicate Ihese deeper e subsurface dicates that bank. The riigher value ig southern *een the two rtaining to iks and dis-
>ly by the Ltter. Near rawdown and >ody. Beyond ;e divides, pickleweed
erences in : pickleweed i in areas from 604 to rsh plain, soil condi-he present sources of inorganic
nal between ransitions, topography represents n colonized
areas of sent distal ce at the B). In the be termed iiin the 2cm a marked D)
10 20 30 40 50
DISTANCE FROM CHANNEL (M)
apparent on Llow pans. a to these : formation
Fig.7. Composition and bulk density of substrate in relation to elevation, depth below the surface, and distance from a third order
channel and turf pan at Woloki Plain.

1064 L. M. Col l ins e t a l .
il ','? '/Tp ,/7 «!£ f , ^ \ \ ;.#/f
l<ft QU
j*.--4flk

IS Am
Fig.8. Topographic map of a portion of Woloki Plain, showing (A) an extinct turf pan captured by a tributary of San Antonio Slough (microrelief of extinct pan interior not surveyed); (B) low areas of headward drainages; (C) broad shallow rills that direct overland flow; (D) drainage divides; (E) high ground bordering turf pans; (G) subterranean channels indicated by hatches; (H) traces of remnant first order channels indicated by dotted lines; and (I) mosquito control ditches that divert tidal flow into channel pans. Ditch spoil and its effect on tidal drainage is not shown. Extant pans are shown as large black areas. ©
Channels are depicted at bankfull stage. Si

o OS ON
2.0
1.0 LU > O m < z o I-< > LU _ l LU
0 . 0
1.0 -
FM ^m mm w$
S I ROOT ZONE 1 MARSH PLAIN
2 MARSH PLAIN PAN SEDIMENT
m DECOMPOSED 3 EXTINCT PAN PEAT
PEAT TURF 4 MARSH PLAIN
ANCIENT MUDFUT 5 EXTANT PAN
t-1
o
Fig.9. Soil core samples from transect on Woloki Plain.
> f t 1 3 1-1 N r t C D It CO r t • « H O I t H - O i-l > CO H i CO co f t m Ft CO CO CO s oo y~\ • t i H f t H - 3 O . 3 H o- H - 3 * c O o y* i-^ a- H - 3 * ID f t o < CO 3 f t f t B* H - 3 no r t rt CO 3 T t p . f t r - h-» rr f t 3 " H - CO t t m f t rr
O • 3 3 H i O CO H f t i-( CL <l f t r t Co q O . ro i t H o o o M- 3 V£> CO 3 f t O . » o ro M i t f t 3 • O I t l-h P T - r t M . CO f t i-l r t rt T J M S • CO a CO f, r t 3 f t 0 0 ^ 4 M H i V j CO (-! n m 3 - H i CO r t fl> M 3 * H - O H - f t l-( «* S " 3 * O I t M CO f t M rr CO 3 " £ - I - " O CO I-I H - H> 3 " i i t ^ PI O CO o H - f t 0 5 r t O 3 " • cr i t ; I t 0 s_^ O C I - 1 H - t H i CO O <_> • O n> ft> S! r> 1-1 M r t « 0 0 i-i to a n> •# ^ m Fl f, rt H i f, 3 Ol H i CO f, rr m o
o O l-h 3 ID O C7* o 3 " 3 " O . f t M CO « I t O CO CO D . C M rt H - f t m rt CO 3 o f t (6 f ) in C M l-h f t M rt CO q ^ rt CO H - IT) I-I H - M 3 CO f t f t e 0 0 CO 0 0 a. Ft r i r r C L n W H+. *-* n' rr, "-• ** ~ ~ * • ~
W CO r t CO v l l 0 < < • It 'rt CO
O rr r t 00 O rt
•O Co O T3
00 3"
B •a o
r H d. co I- 3 * H- B i ft <! Co I H- H- M
rt EL. M ft ft
h 13 Co rt I O
M O Hi H- Co rt rt M O ft !-• 0 rt ft co a rt rt C B 3* rt Co n

Fig.9. Soil core samples from transect on Woloki Plain.
> r t • 3 i-i N r t a, >o ro 01 r t > a H n ro p - O 1 > 01 H i 01 01 ro ro s 01 CO CO 5 1 0 0 > ^ CO h3 P l r t p - 3 Q . 3 1-3 W 01 r t CO r t i ^ CL CO P 1 0 H i r t P - 3 * e O o p - p - o. p - 3* ro ro o < CO 3 ro i t er P - 3 0 0 r t n 01 3 • 3 p . ro P - P 1 3 " ro 3 1 P - 01 ro ro ro 3 * ^ 11 O V | 3 * 3 * P - B P - 01 H
O V | 3 3 H i o 01 B ro n a < ro r t 01 0 a ro ro H O O 0 p - 3 i O 01 3 ro 0. w 0 01 p - ro • ro • 3 01 ro ro < 01 r t M O r t 3 O ro H i l * " 3 p . 01 ro H r t 1-1 1 3 M a . 01 o . CO a r t 3 r t 0 0 - 4 M H i V | 01 c 0 CO O r t S p . p . M ro p - a 3 " H i 01 r t ro P* 3 " P 1 o p . r t I- I » 3 " 3 " 0 ro M 01 r t P 1 3 * CO 3 - * - P 1 0 P> CO H r t 0 0 ro 11 CL P 1 11 ro P - H i 3 * I- I ro P - 01 o oi O P - ro 0 0 r t 0 3 * • c ro ; ro O -~s O C p " p - 3 * H i 0 H B ro ro 01 CL 0) O O . o ro ro S O H M r t S 0 0 H 01 « ro - ^ CO B a H HI a 3 CO H i 01 a u- 01 0 • 3 Oi H i 1 3 CD n i t r t
O O H i 3 ro O a - O 3 " 3 * a ro M 01 0 ro O 01 CO a C M H p - ro CO 1 0 • 3 • 3 1 0 c B 3 * co 3 o r t ro n ro c P < H I ro P " H CO c ^ . H 01 p - • a n p - p > 3 01 r t r t C 0 0 01 0 0 r t a. B 0 0 3 * 0 O 01 r t H 01 O r t r t 01 H o a o 01 H H i 3 3 V I 01 01 B p . ro c 0 ro 01 3 r t 3 * 3 " 0 0 B 01 0 0 r t ro 3 * 3 1 01 H V ! 3 B p - p . 3 * (0 H 01 Oi (» 01 3 * 3 " o i-l 3 o H ro < p - p - Oi * 0 - 3 r t i-h . B ro ro 0 0 01 3 ro co ro r t 01 CL r t co 01 CO ro
0 0 P - P - ro P - P- 01 a 3 * * 3 O l ro >o 3 0 ro 01 3 3 " r t a 01 p - ro H a. CO >. C L r t ro P- • 3 CO P - 3 / ^ 3 *
ro 3 o 0 0 o r t pi p - 01 S 0 0 0 0 P " 3 01 3 a • H i-t ro p - 01 0 1 a. B H 01 CO r t • 3 ro 3 " 3 O 3 " r t O H i
ro 3 C L 3 * c ro s ' r t V ! r t «, ro 01 H 0 0 01 «• 01 0 0 H 01 ro ro O r t 3 * a ro 01 01 < ro 3 P - 3 " 3 * 3 r t B 0 • 3 01
o CL 01 P - I-I 01 01 p - ro O ro r t 3 O ro H P - r t ? r 0 r t na 3 * 3 0 O 01 01 D . 3 3 ro 01 O M 01 ro V | 01 M O CO H i M H i r t o 01 3 * O ro 01 r t O . a. 01 1—1 01 p - *~\ H i 3 " ro ro r t 3 " r t r t D - 01 P> H i i t O 01 3 < p - 01 X I 3 3 CO
H i 1 3 o 3 I- I ro 3 3 r t c a. p - 3 " <jt ro 0 p • *~\ r t CO P . 01 r t CL 3 1 0 0 c H i M ro H r t p . vi ro C L 0 » 3 r t a ro H • 3 H i 01 01 >. oi ro P - 01 0 p . H i 1 0 . » VC P 1 < S ! 3 * H i 3 N 3 * ro 01 r t 3 • 3 1 Ci M O O x 01 0 01 3 * 01 H h * 01 H . 0 ro r t < H i r t ro 0 0 vo ro O P - p - P - P - O 01 " 3 a 3 " O 0 B B p r t V | O cr r t 01 0 01 *» p -
3 n> r t ro B r t 1 3 ro o p . 3 3 P - p - ro 3 " 0 1 P « U 1 - - J 0 0 H O 3 ro CO a t i n 01 01 r t H ro 0> ro P - 3 0 c 3 * P - r t B 01 1 ro 3 01 n I- I H r t oo > ro < a 1-1 ro 0 01 01 v - ^ * • ro H i 7? a. B ro ro V | r t P - 3 r t Q . D . 3 " r t c • 3 ro . 3 " - 3 01 r t
CL n> K r t I-I 3 " p - T ) C/3 l-l i-l a* co ro ro CO 3 3 i-l ^ ^ r t O 3 . - t ) 01 C 0 0 r t P - 01 P - H 3 P > ro p" 3 ro (t> P - H - V ! ro B H oo • 3 P - O ro ro 0 01 H i v_-- o~ 0 0 3 " 01 p " *~\ ro 0 p > 01 ^ r t » 3 P - O H i M 0 0 01 CL 01 n H ro CL C L
<! 3 01 Oi 01 01 o ro H 3 S 01 0 ro 0 ro 01 01 r t S ^ l - 1
a H i 01 01 p . (-" 3 " O 3 O 3 O 3 " CO 01 3 H 01 » (D r t M . l-l a 3 O ro P- CO 2 3 0 K H i H ro M CO 3 * P - VO 3 3 0 1 0 ro 3 01 H i H B ro I t H C L ro P3 f t M O • a V I C ro 3 * ro 3 B 0 3 3 * 1-1 B X O > 3 O O ^ J M n CO & r t 3 OJ r t O 01 « V P - CO J i p . w 3 " a O Oi i-t K i-i o r t 01 0o o ro ro ro 0 01 0 K P - 11 fi 3 M • t^ 3 3 " O 01 CO 0 0 01 r t ro • a H i 01 11 ro l t ro 3 0) P - p -
• a 3 0i 01 o >x> ro p - o* r t H i 01 01 H B r t 01 ro ro ro 01 3 *~s 0 0 Oi O r t v ^ a " 3 " a H 01 i t r t 01 r t CO V ) 1 01 r t B O - O Q r t a 1 n a n P 1 3 * co a - 3 ro P - < H O • 3 0 . 0 0 M X> 3 B * & c ro p - • 3 < 3 " 3 * 3 * ro r t 3 3 *
n> ro ro c ro o V I ro ro o1 01 ro O 01 ro ro 0 r t ro M CO Oi a H Oi p . r r H 3 B n 01 01 ro r t H 3 " 0 * M 3 H i 01 n 01 a o- < 01 01 0 0 01 r t r t 3 r t Q< 01 H 3 " " 3 Oi P . 3 01 rt ro ro ro a < 01 01 p . H • 3 3 01 3 " H O H i ro v i 01 B r t C P - r t CO c V ) 01 H B co H • 3 P - 3 c 3 * P - r t 01 O 3 B a. 3 3 0 • 3 01 ro CO H a P - 01 ro 01 ro H i 3 r t P -
- H 3 o p . n M ro o o ro 01 3 3 M 01 O O o * 0 ro r t 01 a p - O 0 . p . 01 0 3 0 0 V | 01 ro 3 r t r t 01 3 B ro r t 3 r t H i < o r t l-l p . i Q CO 3 r t 01 C H i r t H i 3 ^ H i a. P - V P 1
01 H rose n 0 ro 0 . H r t CO 3 - i t r t O 01 r t ro O 01 3 " r t H - H i P - 3 " 01 l-l 01 0 0 O - 01 01 T3 r t Oi M ^ • 0 01 r t ro r t ro 01 v; V | ro c 01 H C L r t H H « ( 1 3 " " 3 r t O V ) cr ro P- r t H 3 * P » - 3 i t • 3 01 r t r t 01 ro 11 H ro p» r t H 01 ro ro 01 • 3 3 r t n 1 P - 1 P - 01 01
l-i ro H V | CO 3 N p - CO o o o « 01 ro 01 p . • 3 C 3 " 3 D . ro M \D 3 " ro c a. 0 r t H a 01 O 3 * CO H i ro 01 01 O = r P - r t n a. o p 1 Oi P- ro 3 O r t o- 3 • 3 3 3 H M 01 01 V I 0 ^ J ro co 0 0 H I ro ro 3 H i 01 c PJ P - 3 ro 3 -( t H P" o. o S B p - 3 O r t 3 H 3 * 01 CO 0 01 P - H i r t 01 01 c 01 •e - 01 3 * H i r t C L 01 CO Cu r t H • 3 p - 3 V 1 01
• 3 ro O c CT 8 O 01 r t r t H i 3 * Q. s * ro 01 H r t 3 O - r t P 1 r> c v ^ ro p - 3 " 1 3 01 ro B H 01 0 01 01 3 - B 3 H D . e o ro c r t v j 01 (t> p . a. r t r t 3 * 0 0 Oi P - c r t 0 CO 01 O co r t 01 01 01 p - 0 01 01 01 0 3 a 01 0 0 CO C P 1 3
ro C r t O • 3 p i O • a 0 CO ro ro 3 " ro i-l 3 3 3 * 3 ro c 3 P - 3 " r t 3 C 0 0 ro « H c CO 3 ro f t v£> 01 ro 01 O 0> P - o ro a C 01 ro P - 3 01 H i O . < a 01 r t ro D . P - «! n 0 . 01 CO 01 r t ro CO H 3 3 0 01 ro 3 H 01 co a 0 0 - 3 P >
oi ro H o B 01 01 B p - oi ro 3 r t m r t B p - B 01 0 0 3 1 M M ro C P - < H i 01 Cu 0 3 * C L 01 ro P - . 01 r t O T 3 CO p . CO ro 3 ro r t a* o r t 3 !«( a. O 3 " P> H i 01 a 01 3 3 * ro c a - 01 0 01 n ro O* 01 01 3 ro 3 P> 11 P 1 O r t 3 * v ^ ro . o 01 ro 0 0 3 3 * r t r t 0 ro a 0 0 01 1-1 ro 0 H O H 0 , ^< O 0 01 r t 0 0 ro n O 11 D . 01 0 3 ro 01 0 0 ro ro • 01 3 H - 01 i-l 0> « 0 0 ro P 1 l-l c " 3 1-1 i-t CO CO 01 CO ro r t ro ro H i 3 P - 3 " ro 0 ro 3 V ! 01 . r t 0 0 i t c 3 * n P - 11
r t ro C O ro o H O Oi o. 0 « l-t ro 3 " • H 3 " p - CO D . O P - r t n H n p . ro 0 H CO t - 1
01 01 01 3 o X K O H ro C P - p . 0 < ro p . O . r t ro 01 r t O * 3 0 0 01 ro 0 r t V | 01 0 0 0 < 01 a 01 H 0 3 * r t c CL 3 • 3 r t o 01 M ro 01 l-l CO 3 r t r t c CO ro 01 3 ro 3 * r t r j - C 3 * ro co 3* r t 01 H i 3 - B • < CO H 3 ro . ro i t P 1 3 " 0 01 H H M H 5 ro 3 " M " 3 0 o. 01 ro 0 0 3 * 3 * 3 c 1-3 D . 0 • ro 3 " H 0 0 ro P - CO ro Oi T ) 01 CO O H i < 0 0 ro p - 01 01 01 ro r t 01 C o . O 01 3 o i ro ro l-l l-l 3 * 0 H 01 p - 0 0 0 . 0 . co O ro r t 1 01 " 3 0 C p - r t ro H 0 3 P 1
r t 01 p . p | r t 3 r t l-t p - 1-1 p - rt ro H i P - H i ro 01 r t 01 ro ro c 01 3 O . 3 " rr 01 3 • 3 0 3 3 O H 01 01 - 3 P 1
ro 01 P - 3 01 ro Oi P - s <! 01 c Oi 01 M 01 CO M fll O C CO p - ro ro P1 ro 01 3 " CO p - C L ro M - 0 0 i t 01 V | H i ro 3 (H r t CL H P 1 01 01 P - ro 3 3 r t 3 * r t 01 0 O CO 01 0 H rr P 1 r t 3 • 3 p . a H ro Oi C L r t 3 ro P - 3 CO
o o 01 a P - 3 P " 3 P - 0 0 0 0 p - ro 0 P - r t ro 01 O O ro 3 H i 01 ro CO p . ro 3 P - p - B ro 01 r t r t 3 * O CO 0 H H i 5 O r t • 3 01 ro P - H i H O. ro . O 01 c 01 r t 01 H H i r t 3 r t P - CO r t 01 CO CO ro i » - \ U1 ro 01 C L n 3 B r t
a r t P - 3 o ro o < ro I-I r t 3 O 01 r t Oi a r t ro r t n O ro r t r t P - ro 0 r t 3 * r t CO a 01 0 . 01 V ! p - 0 CL ro C
ro "a 3 " O a* p - 0 01 Oi 01 00 g c p i p - 3 * $ 01 ro 3 * 01 O . V | C C 01 0 P 1 1 01 r t co B 0 ro 1
a. M ro H vi a* o r t M H l-l p . r t 00 g
r t • 3 r t 0 ro p - 1 " 3 a- CD P - . 1 ^ B H 3 " 11 0 . a ro t r c ro r t - 3 3 TJ H i
o O 0 o 3 * O P - co 3 p - H i P " C P - K 0 3 « M r t > < p - 01 ro r t 3- a p - 01 ro 01 a 3 V p - 01 01 H 1 H . 01 p - • 3
o. r t c M ro 3 01 o l-t V i B n ro 3 " 3 3 * 01 r t 3 * V I 01 p " H r t I t r t 3 H 11 3 H CL O ro • 3 0> C < o CO 3 l-l H P - r t CO 3 0 3 ! r t 0 0 ro r t O P - z O . r t O M CO n ro 3 " pr O ro 0 0 r t 11 f t 1 01 3 O ro •a c CL ro ro P - r t p . s M P 1
3 " H 3 JO O 01 3 " 3 1 ro 01 ro 3 * ro 3 1 B 01 B S~\ B 01 C 01 C B 01 ro r t 3 C L r t 0 0 o H ro 01 o 01 O O N 0 0 ro Oi 01 ro c B _ B ro a. O • a O H 01 a. 01 r t • 3 P * n 01 3 r t p - ro P - C L p . CO
H - ro 0 0 H i C L > 3 01 3 ro r t 0 . I-I 3 " « 3 3 01 ro m K S 0 01 r t H O M - O 01 11 ro H 0 *£> 3 " n r t C L 1 01 3 3 3 O r t i-i 01 o 01 3 " ro ro O ro a 3 r t p - u- H 01 r t r t ro C O S 0 0 01 3 - n P 1
01 7? 3 * P - p - 3 " f t 01 01 ro 01 P - 3 01 01 O o* 3 ro o P - 3 * r t 01 ro ro S ro 01 ro ro 0 ro co 1 3 3 1 0 3 * ro 01 H 0 0 01 p - ro 3* 0 01 01 - J 3 ro 01 3 01 ro 01 0 0 H 3 H 01 • l i ro •<3 a w H i 3 ro o r t •a 3 1 a • P 1 co ro 0 3 * - 3 1 3 v i 3 1 • 1 3 3 • • H i r t 1 •*~s 1 C L r t 0 0 M 01 • ro ro r t ro

1068 L. M. Collins et al.
self-perpetuating. It deepens as a function of the upwardly building adjacent turf. Thus, turf pans are created without scour, excavation, or the importation of surface debris; their formation only requires an intrinsic variability in the rate of peat accumulation.
Our hypothesis for turf pan formation is supported by core sample data as well as the cartography of surface microrelief. Pan sediments are distinguished by their black colour, lack of cohesiveness, and inclusion of microcrustacean tests. A variety of extant pans have been cored and their sediments always overlay decomposed peat. Cores taken through pickleweed turf on drainage divides have revealed ancient pan sediments at depths from 10 to 30cm below the present marsh surface, and these pans also overlay peat. Turf pan sediments at Fetaluma Marsh have never been found in contact with the ancient mudflat surface. No evidence has been collected which suggests that turf pan formation originates on a pre-marsh tidal mudflat.
Early maps show turf pans that presently do not exist. The process of extinction for turf pans is apparently similar to that described for other types of pans in different tidal wetlands. Core samples taken along a transect line that extended through the headward drainage area of San Antonio Slough Tributary show that the channel has recently captured a large turf pan. The comparison of historical and modern maps indicates that the capture occurred within the last 130 years. Since then a stratum of peat and clay has been deposited on the pan sediments (Fig.9). This suggests that the capture of a pan by a channel permits inorganic sedimentation and subsequent invasion by vegetation. Turf pans that have been captured and colonized are distinctive in aerial infra-red photographs and are common among headward drainage areas in Petaluma Marsh. A similar process of extinction has been described by Yapp et al., (1917) for primary and secondary pans in the Dovey Marshes of England.
Turf pans can increase the likelihood that drainage networks will be united, and therefore promote low order channel dynamics. Since the pans exist on drainage divides, they can reduce the distance that first order channels of different drainage systems must erode head-ward to interconnect. Evidence of channel capture through turf pans is not uncommon. In some cases, where flood tides from the two channels with similar tidal schedules converge at the pan, a drainage divide is re-established by pan extinction. This would explain why ancient turf pans can be found beneath the surface of existing divides.
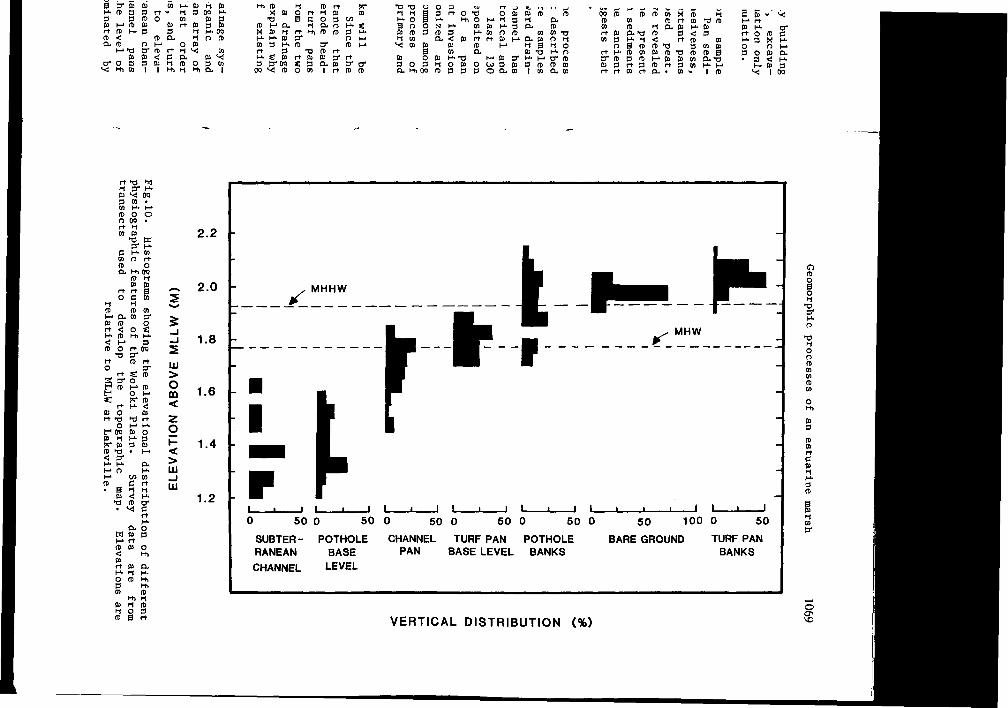
To summarize, in the upper reaches of interior tidal drainage systems, groundwater fluctuations, biogenic activities, organic and inorganic sedimentation, and erosion interact to create an array of physiographic features. Beyond the headward extent of first order channels, subterranean waterways, potholes, channel pans, and turf pans are distributed in predictable patterns with respect to elevation and distance from a tidal source (Fig.10). Subterranean channels and potholes have similar base elevations, but channel pans usually occur at slightly higher elevations. Above the level of channel pans, the physiography of the marsh surface is dominated by
I - 3
B 3* 01 IB H- ft 3 3 3 3 n> 01 M ro 01 rt ro <D < D . ro
01 O- O 3
V! Hi 01
01 H- » i-i H 3 00 01
01 r t 01 3
ro o. I 0 M o o> 3" It 01 < C 3
1-i VI
oi i-i m o
01 3 3 Oi H- 00 n ro
01 V ! 3
I I Hi i-i "1 D. I
H i d r|
tihl & o H - S ; ro re 3 H-
n M 3* ro M fD r t 01 3* r t Q. 01 3" o* I r t d (t
>"t M H - O B O to ro 1-1 01
vi oi oi
a rt o w o o i o i r o ro H- Hi O M « 3 H Q. N H - 01 01 H« 3 0 . ni O 9 H* CO O ft CD 01 »rj Q. < 01 r t r t O i M O - O i O i i
01 (0 M >i B x o B 01 O. 01 T3 H- O
01 o 01 H - T J H » a 1 K p o1 n 3 O 3 H O 0 l O U 3 0 l 3 r o ( I 1 0 l c 1 . H 1 0 0 r e 3 3 3 0 a . c o 1 co a 01
ni i t 11 n K in H 01 ro r t co i"d re re n a . 01 H- 01
01 o.>a re 3 < 3 3 H- n < r t m o) o B r o n i ' a 3 0 1 0 1 H - r o o i o i r o T i r o r o B it 9 i t p t i n o a-x> S n a i t r t d n H ' H r t 01 r t Q. . 01 - J ro
S"
r t ho tr| M 3 * H-01 VI 00 3 01 • 01 H- I-1
( t o o 0 00 • r t H 01 01
•O HI 3" H-
C H- 01 01 ri r t re o O. Hi 00
ro H 01 01
rt rt B o c 01
H I-i fD ft 01 H" Q. 01 Co ro rt < o H. re < l-1 3 re o r t 00
T3 3* r t ft r t 0 - , = > *
r t S3 ro g 3" O P ro r-> ro
3* o
t-1 O M 7? ro H- <
B O 01 r t >d T l i t
o t-'oo 01 hi X 01 ro "o < 3 -
01 o
3 01
' w 01 . C r t B i-l 1-1 01 <J H.
13 re o-• v i c
a, o M 01 3 M r t re o> o < Hi
H> re
Hi H 01 1-1 re M g 3 ro B r t
2.2 -
~ 2.0 -5
5
111 > o CQ
<
< > LU - I LU
1.8
1.6 -
1.4 -
1.2
100 0
SUBTER- POTHOLE CHANNEL TURF PAN POTHOLE RANEAN BASE PAN BASE LEVEL BANKS CHANNEL LEVEL
BARE GROUND TURF PAN BANKS
o ro o B o M
•o 3-
H o o re
o H>
01
3 ro 01 r t 3 01 1 H-
3 re
1-1 CO 3 "
VERTICAL DISTRIBUTION (%)
1070 L. M. Collins et al.
primary production. Patches of bare ground that are the precursors of turf pans are most common on the broad drainage divides. In these areas the watertable is seldom below the base level of turf pans. This suggests that the pans help regulate the water table level, perhaps by evaporative losses as well as recharge. The highest rates of primary production occur at turf pan margins, where the ground is aerated and drained of salts. These areas are therefore some of the highest on the interior marsh plain.
CONCLUSIONS
Petaluma Marsh is a mature estuarine tidal system in quasi-equilibrium between tidal and biological energetics. A series of hypotheses have been formulated that implicitly regard the landform as a function of the distribution of energy for geomorphic work. The hypotheses are presented as statements that indicate the principal topics of current research:
1. Throughout the estuary, the local lower low water tidal datum (MLLW) represents a plane of zero hydraulic head.
2. The geomorphic work attributed to tidal energy, including the deposition as well as the erosion of sediments, depends upon tidal range (MHHW-MLLW) and therefore decreases with distance from a tidal source.
3. The headward reaches of drainage systems are zones of transition between tidal and biological energetics.
4. Primary production of vascular vegetation in first order channels causes their retrogression.
5. Within a closed drainage system, tidal prism continuity requires erosion to compensate for retrogression.
6. The interconnection of drainage systems by headward erosion through a common divide can realize the potential hydraulic head created by a difference in tidal schedule.
7. Channel reconfiguration continues at a faster rate than can be attributed to sea level rise.
8. Most geomorphic change results from biogenic activity that regulates the distribution of tidal energy across marsh plains.
9. Marsh plains are cybernetic ecosystems, wherein primary productivity decreases if the surface of accumulated peat exceeds the elevation coincident with optimal duration or frequency of tidal inundation.
10. The formation of large lentic features on drainage divides is due entirely to spatial variation in primary productivity.
Geomorphic processes of an estuarine marsh 1071
ors these pans.
level, rates
is the
quasl-es of
Acknowledgements
We wish to thank the California Department of Fish and Game and the California State Lands Commission for logistical support. Valuable information continues to be supplied by Kent G. Dedrick, William E. Dietrich, and Brian F. Atwater. The capable field assistance of Kirk Vincent, Moshe Inbar, Tom McKeag, Peter Whiting, and Mike Kellogg is gratefully acknowledged. We also thank Vince H. Resh for computer facilities. The project has been funded in part by the University of California Water Resources Center under grant WRC P-79-58, the United States Geological Survey under contract USGS 052-752-85 and by a generous donation from the Conservation Associates.
. The ncipal
datum
the upon
stance
ition
order
ires
rosion c head
can be
that
uc-
s the tidal
es is
REFERENCES
Atwater, B. F., Conrad, S. G., Dowden, J. N., Hedell, C. W., Mac-Donald, R. C , and Savage, W., 1979. History, landforms, and vegetation of the estuary's tidal marshes, in San Francisco Bay the Urbanized Estuary, (Ed. Conomos), pp347-385. Pacific Division, American Association for the Advancement of Science.
Balling, S. S., and Resh, V. H., 1983. The influence of mosquito control recirculation ditches on plant biomass, production and composition in two San Francisco Bay salt marshes. Estuarine Coastal, and Shelf Sciences, 16, 151-161.
Barnby, M. A., Collins, J. N., and Resh, V. H., 1985. Aquatic macroinvertebrate communities of natural and ditched potholes in a San Francisco Bay salt marsh. Estuarine, Coastal, and Shelf Sciences, 20, 331-347.
Bayliss-Smith, T. P., Healey, R., Lailey, R., Spencer, T., and Stod-dart, D. R., 1979. Tidal flows in salt marsh creeks. Estuarine and Coastal Marine Science, 9, 235-255.
Chapman, V. J., 1974. Salt Marshes and Salt Deserts of the World, second edition, Cramer, Lehre.
Collins, J. N., and Resh, V. H., 1985. Utilization of natural and man-made habitat by the salt marsh song sparrow, Melospiza melodia samueliss (Baird). California Fish and Game, 71, 40-52.
Dionne, J. C , 1985. The role of ice and frost in tidal marsh development , in Abstracts for papers for the First International Conference on Geomorphology, (Ed. Spencer), Manchester.
Howland, M. D., 1976. Hydrology of the Palo Alto Baylands, Palo Alto, California with emphasis on the tidal marshes. Masters Thesis, Department of Geology, Stanford University, Palo Alto.
Kessel, R. H., and Smith, J. S., 1978. Tidal creek and pan formation in intertidal salt marshes, Nigg Bay, Scotland. Scottish Geographical Magazine, 43, 159-168.
Penfound, W. T., and Hathaway, E. S., 1938. Plant communities in the marshlands of southern-eastern Louisianna. Ecological Monographs, 8, 1-56.
Pestrong, R. marshes. 10i 1-87.
Pestrong, R.
1965. The development of drainage patterns on tidal Stanford University Publications, Geological Sciences,
1972. Tidal-flat sedimentation at Cooley Landing, Southwest San Francisco Bay. Geology, 8, 251-288.
1072 L. M. Collins et al.
Pethick, J. S., 1971. Salt marsh morphology. Ph.D. Thesis, Cambridge University.
Pethick, J. S., 1974. The distribution of salt pans on tidal salt marshes. Journal of Biogeography, 1, 57-62.
Pillsbury, G. B., 1956. Tidal hydraulics (revised edition), Corps of Engineers, United States Army.
Ragotzkie, R. A., 1959. Drainage patterns in salt marshes, in Proceedings of the Salt Marsh Conference, Marine Institute, Sapelo Island, Georgia, pp22-28.
Redfield, A. C , 1965. Ontogeny of a salt marsh estuary. Science, 147, 50-54.
Redfield, A. C , 1972. Development of a New England Salt Marsh. Ecological monographs, 42, 201-237.
Rogers, A. F., 1860. Map of a part of the Petaluma Creek, California. Plane Table Sheet #6, United States Coast Survey.
Sather, H. J., and Smith, R. D., 1984. An overview of major wetland functions and values. United States Fish and Wildlife Service, FWS/0BS-84/18.
Steers, J. A., 1960. Physiography and evolution: the physiography and evolution of Scolt Head Island, in Scolt Head Island, (Ed.Steers), ppl2-66. W. Heffer, Cambridge.
^ van Eerdt, M. M., 1985. Salt marsh cliff stability in the Ooster-shelde. Earth Surface Processes and Landforms, 10, 95-106.
Yapp, R. H., John, D., and Jones, 0. T., 1917. The salt marshes of the Dovey Estuary, Part II, the salt marshes. Journal of Ecology, 5, 65-103.