Embed Size (px)
Citation preview

1
International Gas Union
Natural Gas
Facts & Figures
December 2010

2
1. Natural Gas Supply & Infrastructure
Reserves: Conventional & Unconventional
Infrastructure
LNG
2. Costs and Efficiency
Power Generation
Industry
Chemical Feedstock
3. Environmental Impact
Power generation from gas with / without Carbon Capture & Storage (CCS)
Efficient Partner for Renewables
4. Prospects for Developments of Further Technological Options
Navigation-tool for the “Natural Gas –
Facts & Figures” slide-pack
Commercial Sector
Residential
Transportation Sector
3
Goals and Objectives
Highlight the value of natural gas to ensure its fullest
economic and environmental contribution in low carbon
energy systems
4
Cost estimates
Note:
The cost estimates in this package have been based on reliable, verifiable data. However they
may not concur with cost estimates in other publications.
This may be due to a variety of factors and assumptions, e.g.:
•Prices of fossil fuels
•CO2 prices
•Location factors
•Size of plants
•Costs of steel
•EPC costs
•Discount factors
•Lifetime of plants
All cost comparisons in this package should therefore be considered as indicative. While capital
costs of different options may vary considerably in absolute terms, in relative terms there is very little
variance
(For reasons of consistency all cost data used in this package have been taken from the June 2010, Mott MacDonald
(MMD) report for the UK DECC)
5
Natural Gas
Supply & Infrastructure

6
Natural Gas reserves:
plenty & more to come
Proven conventional reserves* are growing
In addition:
Unconventional gas has come within
technological & economic reach
Volume
Conventional
Unconventional
The total long-term recoverable gas resource base is more than 850 tcm, only 66 tcm has already been produced.
- IEA-WEO2009 -
* 185 tcm in 2008
Shale gas
Coal bed
methaneTight gas

7
Conventional Reserves:
plenty and more to come
Global gas reserves have more than doubled since 1980,
reaching 182 trillion cubic metres at the beginning of 2009;
reserve additions in 2008 amounted to 190% of production
0
40
80
120
160
200
1980 1990 2000 2009
tcm Europe
Latin America
North America
Africa
Asia-Pacific
E. Europe/Eurasia
Middle East
Source IEA WEO2009
Growing proven reserves

8
Source MIT, 2010
Conventional Reserves & Unconventional Reserves
as Estimated for North America
Probable Reserves
Possible Reserves
Proven Reserves
TCF
Additional Low
Probability Potential
9
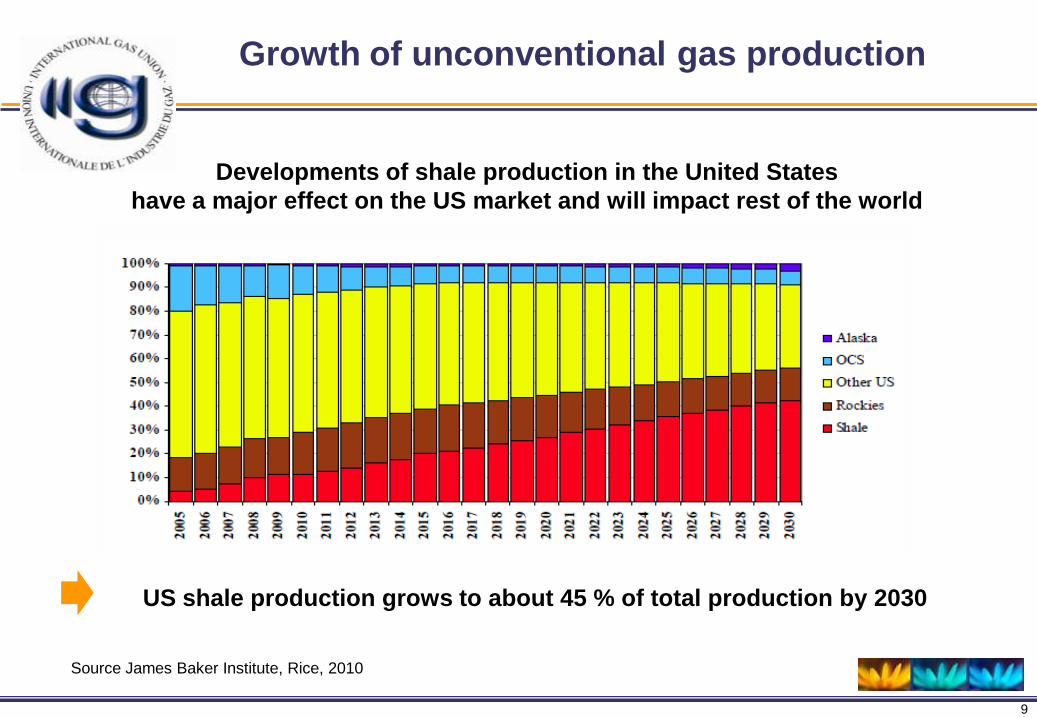
Source James Baker Institute, Rice, 2010
Growth of unconventional gas production
Developments of shale production in the United States
have a major effect on the US market and will impact rest of the world
US shale production grows to about 45 % of total production by 2030

10
Source: Schlumberger
Worldwide shale potential
A 2007 study showed 688 shale formations
in 142 petroleum basins.
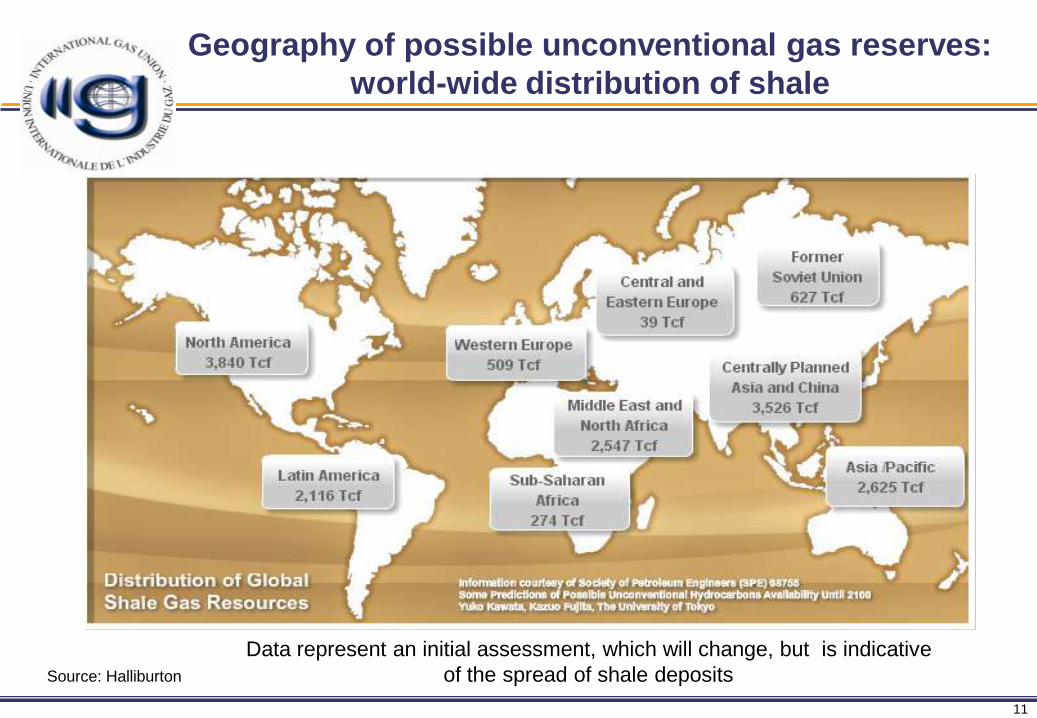
Geography of possible unconventional gas reserves:
world-wide distribution
Proven and operational
unconventional reserves
Available unconventional
reserves
11
Source: Halliburton
Geography of possible unconventional gas reserves:
world-wide distribution of shale
Data represent an initial assessment, which will change, but is indicative
of the spread of shale deposits
12
The prospects of unconventionals
Potential for more domestic production in many countries
Particularly for China this could help to reduce dependence
on coal
First exports of unconventional gas under developmentAustralia: first CBM LNG export project (8.5 mt/a)
13
Lower cost of energy transmission of gas vs electricity
Gas pipelines offer more energy transportation capacity
Lower visual impact from transport of gas vs electricity
Easier and more economic to store gas than electricity
Natural Gas and Electricity

14
Energy Transportation
50 mln m3/day
(diesel)

15
The LNG market:
Connecting regions
16
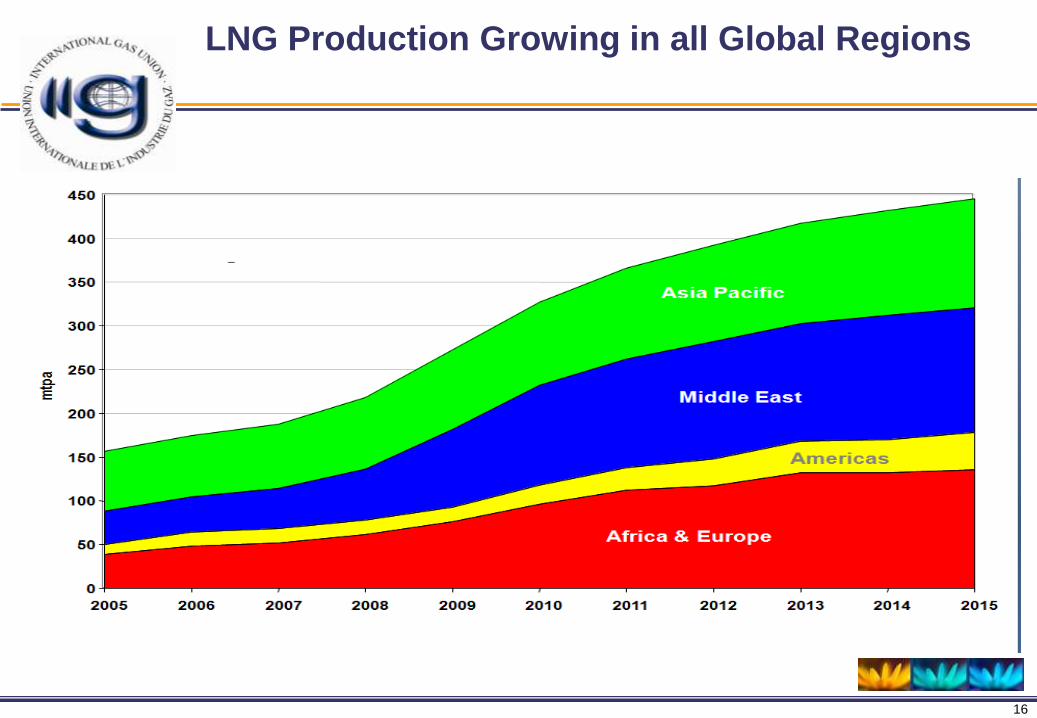
LNG Production Growing in all Global Regions

17
The LNG industry has a total of around 1 660 bcm of LNG available for sale from existing production over the period 2009-2025
IEA WEO 2009
Growing Liquidity in the LNG Market “Flexible
LNG”
“Flexible” LNG makes the LNG industry very responsive to changing
demands of the global market
LNG adds to the diversification of the supply sources
18
0
100
200
300
400
500
600
700
800
900
Production Regas Capacity
Europa Africa North America South America ME AsiaPacific
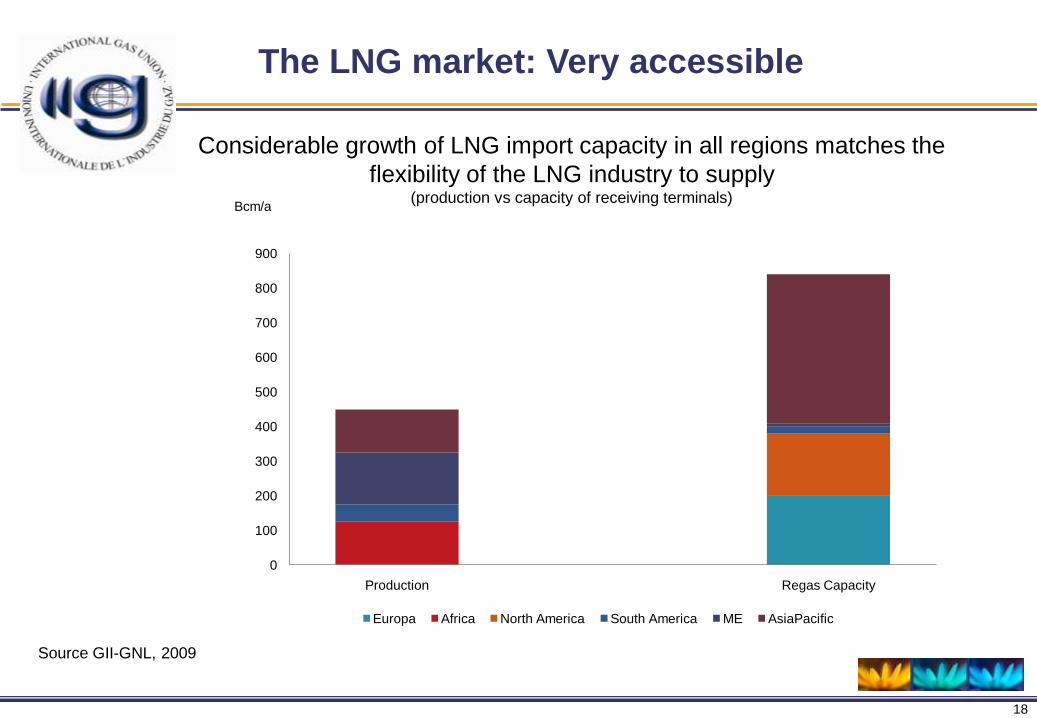
The LNG market: Very accessible
Bcm/a
Source GII-GNL, 2009
Considerable growth of LNG import capacity in all regions matches the
flexibility of the LNG industry to supply(production vs capacity of receiving terminals)
19
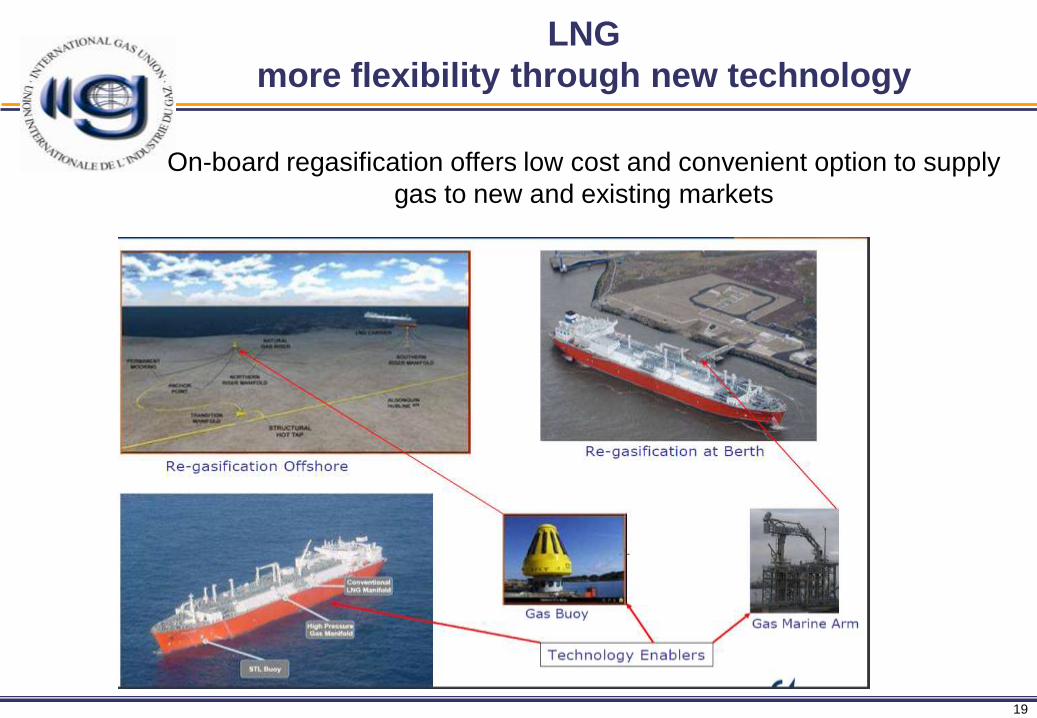
LNG
more flexibility through new technology
On-board regasification offers low cost and convenient option to supply
gas to new and existing markets
20
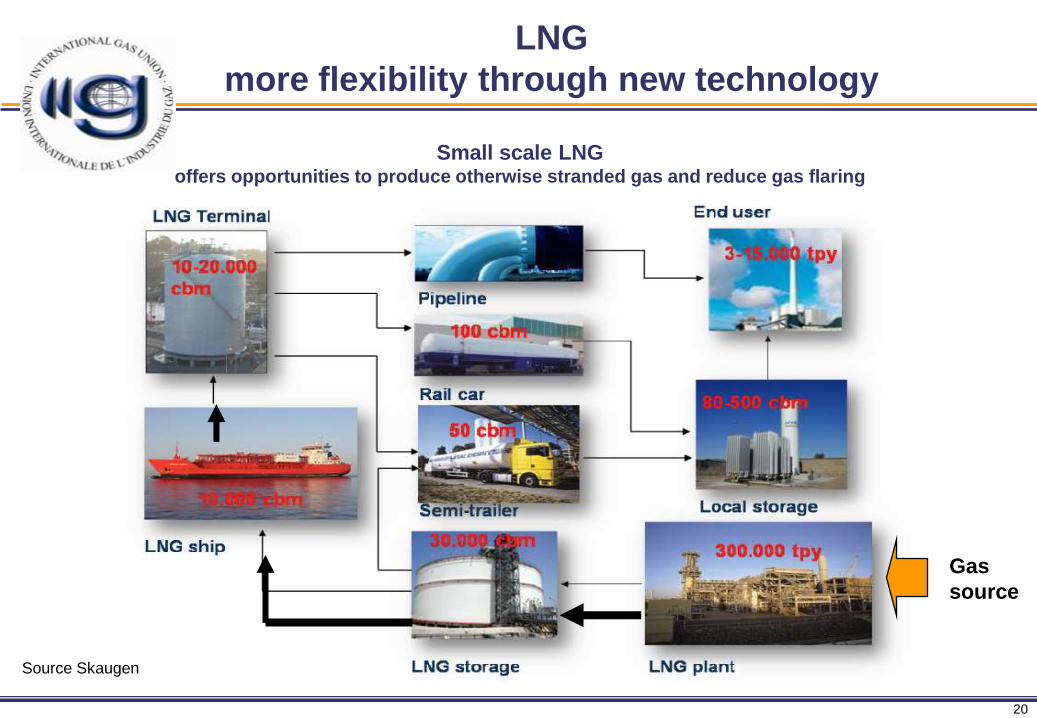
Small scale LNGoffers opportunities to produce otherwise stranded gas and reduce gas flaring
LNG
more flexibility through new technology
Source Skaugen
Gas
source
21
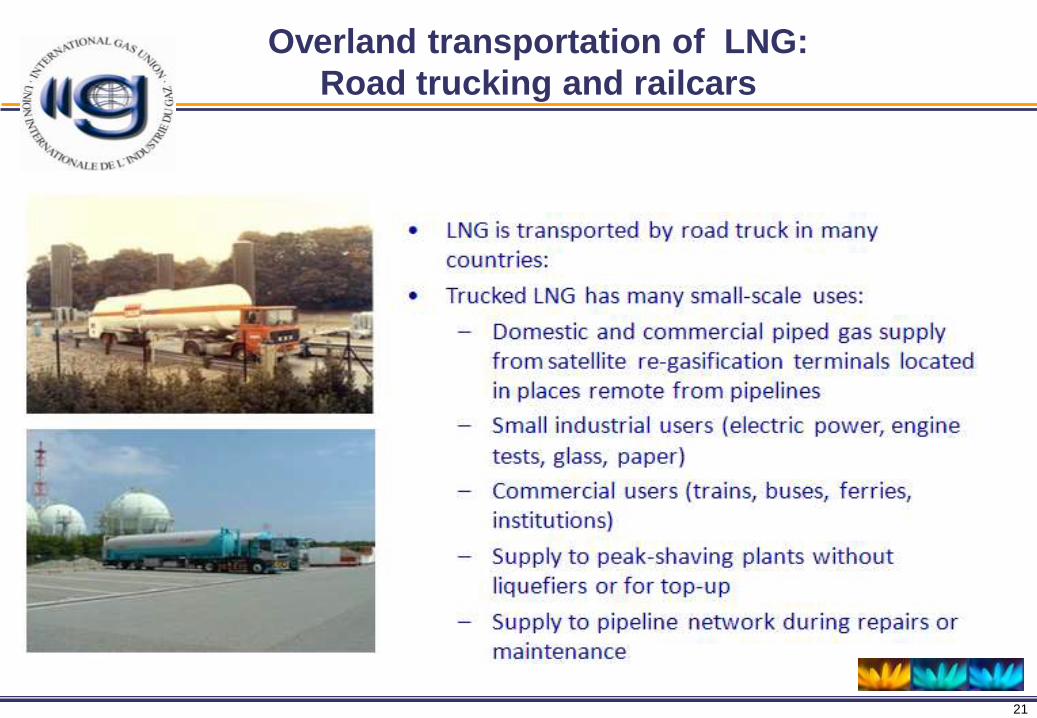
Overland transportation of LNG:
Road trucking and railcars

22
Costs and Efficiency
23
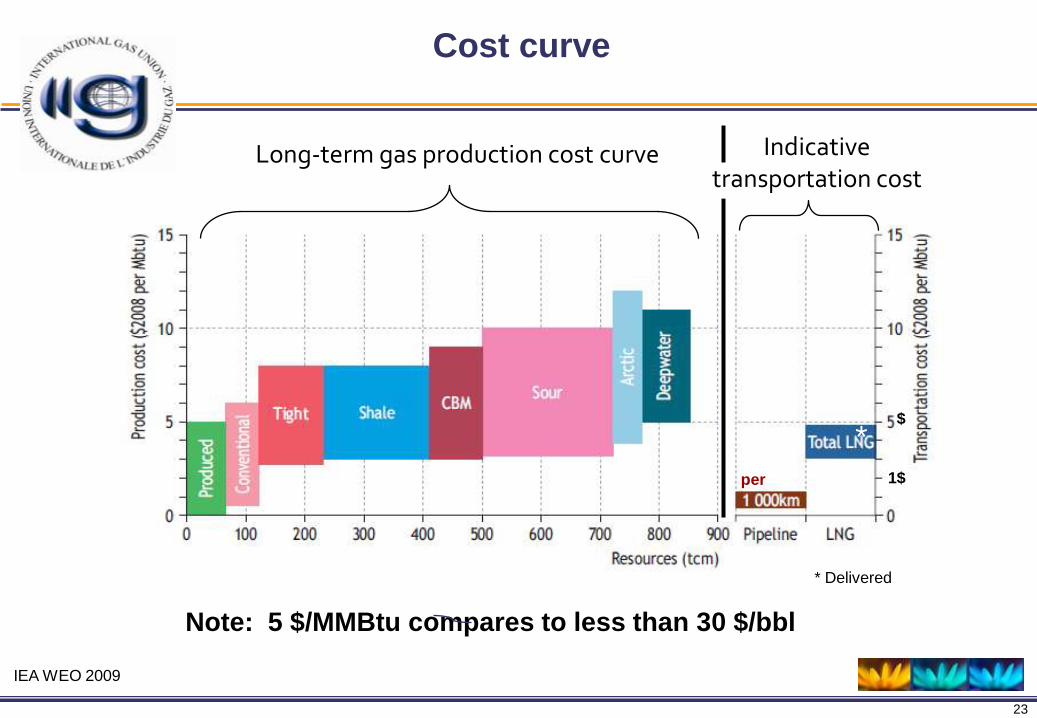
Cost curve
IEA WEO 2009
Long-term gas production cost curve
Note: 5 $/MMBtu compares to less than 30 $/bbl
per
$
1$
Indicative transportation cost
* Delivered
*

24
Cost of supply
Costs of production of new supplies and transportation to markets vary
considerably.
But generally today:
New supplies to markets will cost less than
7 $/MMBtu (is less than 40$/bbl equivalent)

25
Power Generation

26
Embryonic Expansion Maturity Decline
Nuclear
Hydro
Wind
Solar
Meeting Electricity DemandEXPLANATORY NOTES
Electricity demand
fluctuates from hour to hour
over a year
Jan Dec
Same demand ranked in descending order
“load duration curve”
DEMAND FOR ELECTRICITY CAN BE MET FROM A VARIETY OF SOURCES
MID-LOAD
BASE-LOAD
PEAK-LOAD
27
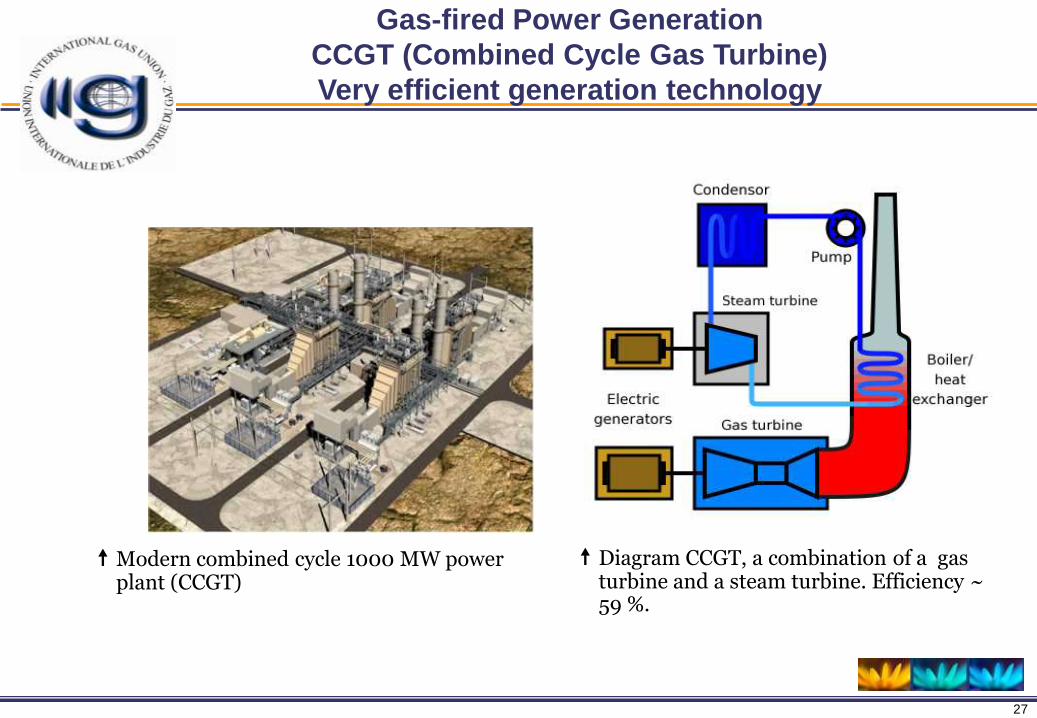
Gas-fired Power Generation
CCGT (Combined Cycle Gas Turbine)
Very efficient generation technology
Modern combined cycle 1000 MW power plant (CCGT)
Diagram CCGT, a combination of a gas turbine and a steam turbine. Efficiency ~ 59 %.

28
Gas-fired Power Generation
CCGT (Combined Cycle Gas Turbine)
Very efficient generation technology
High efficiency (relative to other options)
Less thermal waste & less cooling needed
Compact equipment
Lower investment and operating costs than oil or coal plant
Shorter construction time and easier permitting process
Few environmental problems (relatively clean)
Less CO2 emission rights needed than for oil or coal
Suitable for meeting base load and mid load demand

29
Gas-fired power generation
Lowest capital costs per MW installed
Source MMD
2
5
1
4
3
Gas CCGT Coal Supercritical Onshore Wind Offshore Wind Nuclear Solar
Capital costs of options may vary considerably in absolute terms,
but very little in relative terms
Indicative, cost levels mln
$/MW
30
30
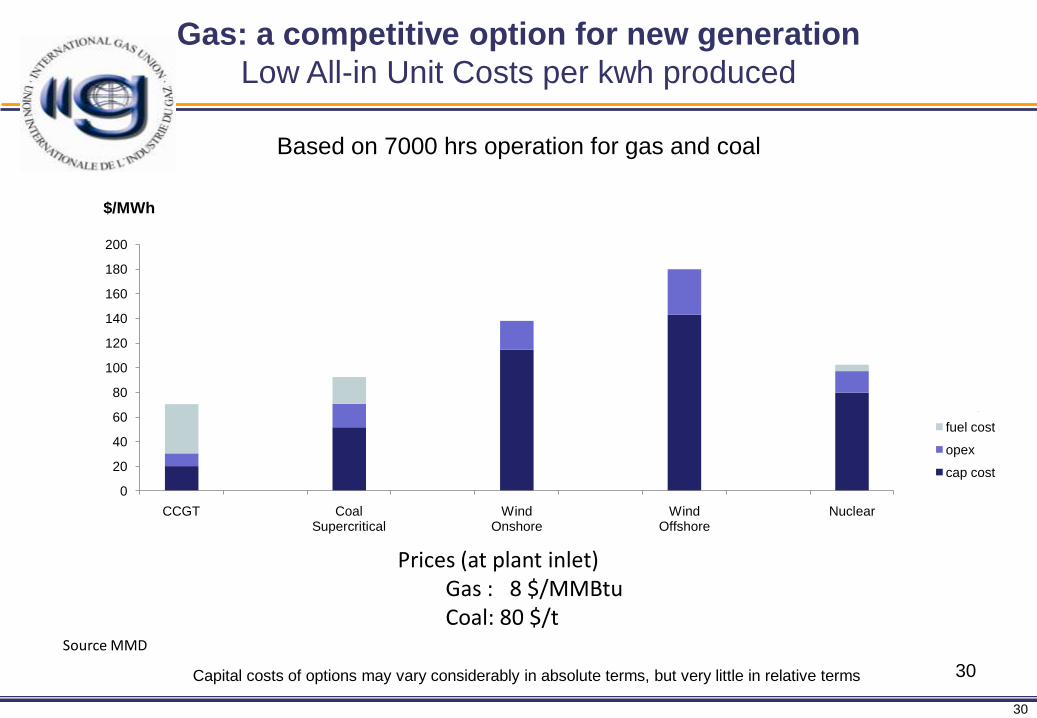
Gas: a competitive option for new generation
Low All-in Unit Costs per kwh produced
Prices (at plant inlet)Gas : 8 $/MMBtuCoal: 80 $/t
Source MMD
0
20
40
60
80
100
120
140
160
180
200
CCGT Coal Supercritical
Wind Onshore
Wind Offshore
Nuclear
CO2 price 20
fuel cost
opex
cap cost
Capital costs of options may vary considerably in absolute terms, but very little in relative terms
$/MWh
Based on 7000 hrs operation for gas and coal
31
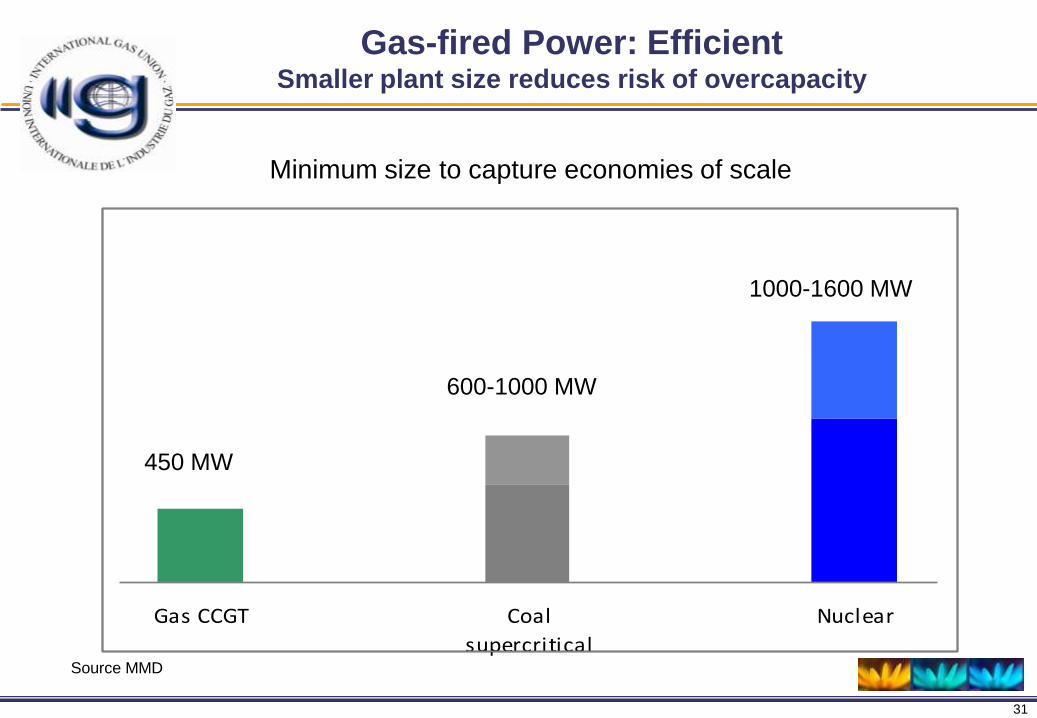
Gas-fired Power: EfficientSmaller plant size reduces risk of overcapacity
Gas CCGT Coal
supercritical
Nuclear
450 MW
600-1000 MW
1000-1600 MW
Source MMD
Minimum size to capture economies of scale

32
Gas-fired power: Efficientshort construction time reduces risks demand uncertainty
Shortest construction time
ETP, IEA 2010
0
1
2
3
4
5
6
7
8
CCGT Coal Nuclear
year
s
Plus shortest time for permitting etc

33
CHP: Combined Heat & Power. Also: "cogeneration“
Proven technology
To reduce thermal waste from power production and use the heat.
Higher efficiency than separate generation
Saves energy and emissions
Total efficiency ~80 %.
Can take biogas
CHP: A very energy-efficient option

34
Industry
35
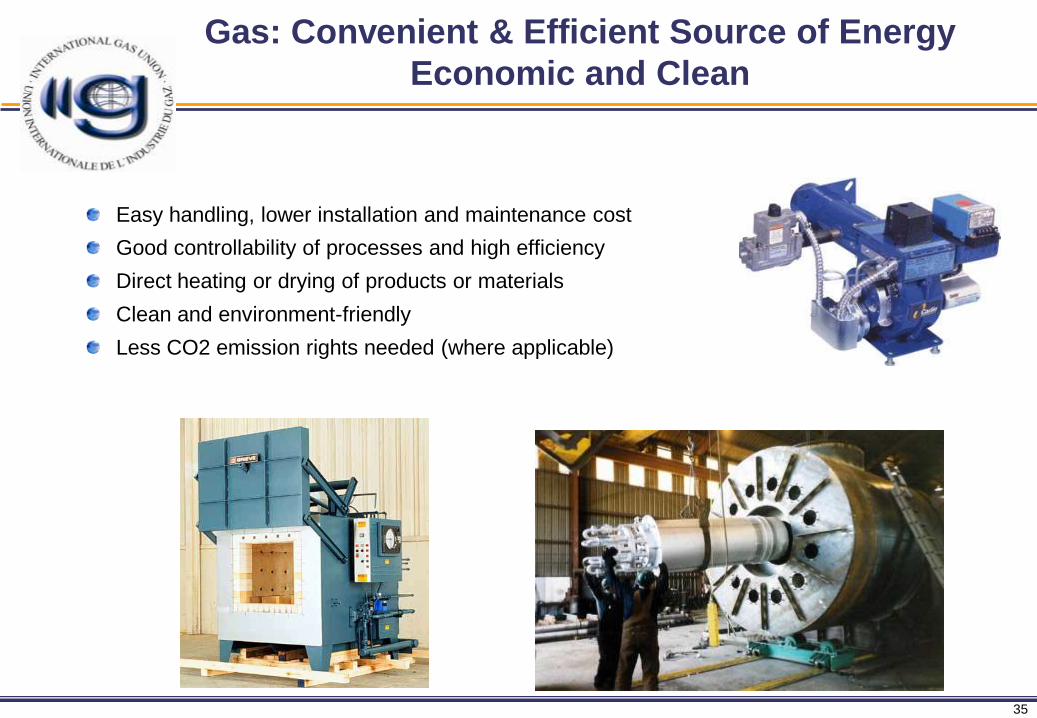
Gas: Convenient & Efficient Source of Energy
Economic and Clean
Easy handling, lower installation and maintenance cost
Good controllability of processes and high efficiency
Direct heating or drying of products or materials
Clean and environment-friendly
Less CO2 emission rights needed (where applicable)
36
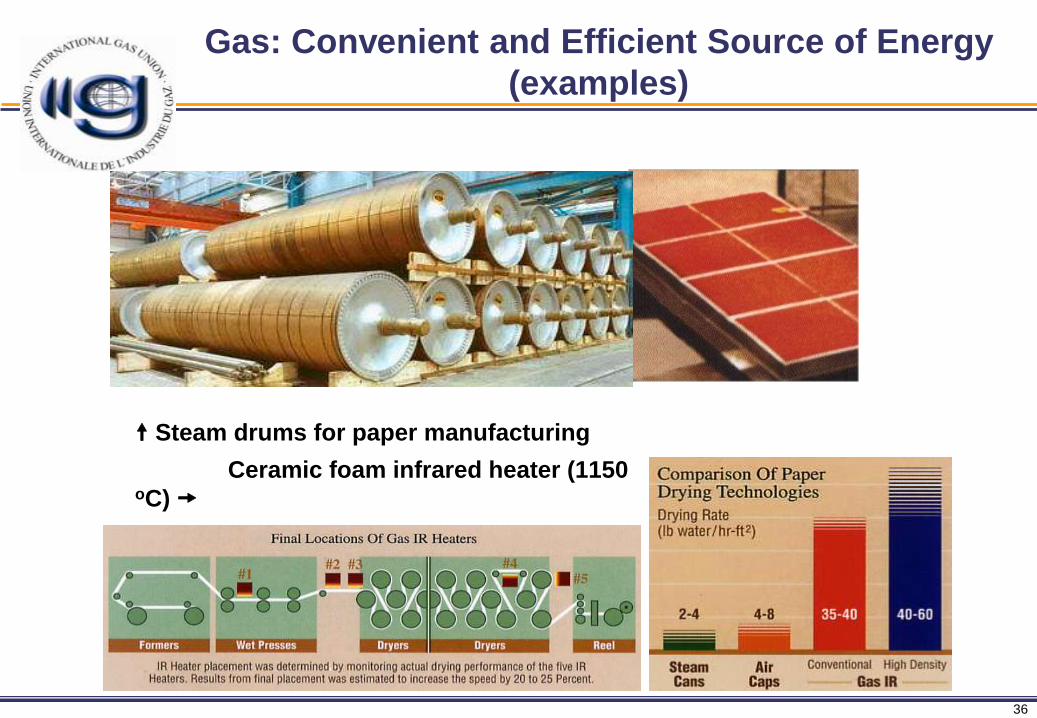
Steam drums for paper manufacturing
Ceramic foam infrared heater (1150 oC)
Gas: Convenient and Efficient Source of Energy
(examples)

37
Infrared (IR) paint drying
Batch grain dryer
Gas: The Efficient Source of Energy(examples)

38
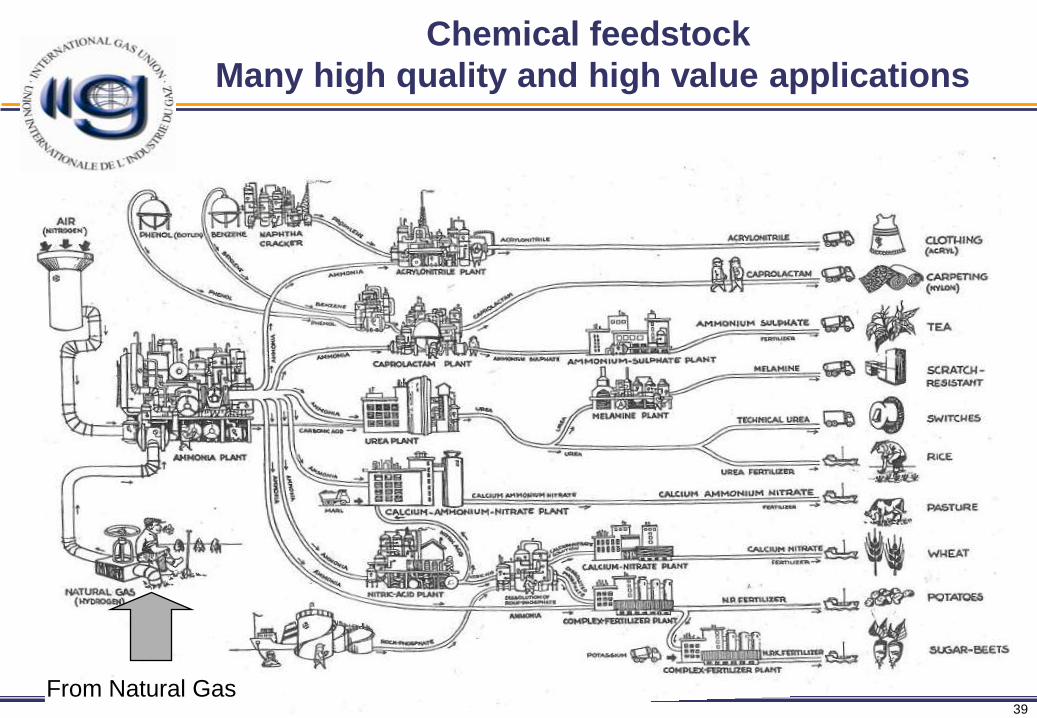
Industry chemical feedstock
More than 165 bcm/a
Gas conversion industry uses gas as an efficient and valuable
source for chemical conversion into other products which are sold
worldwide
ammonia converts some 135 bcm/year → for production of fertilizer,
fibers, etc
methanol converts 30 bcm/year
39
Chemical feedstock
Many high quality and high value applications
From Natural Gas

40
Commercial Sector

41
Offices, schools, hospitals, leisure centers and hotels…
Shops, restaurants, café's, …
Small businesses, workshops, garages …
Gas: The Efficient Source of Energy
Commercials
• Easy handling once infrastructure is present
• Lower investment cost compared to other fuels
• High efficiency heating equipment available (incl. condensation)
42
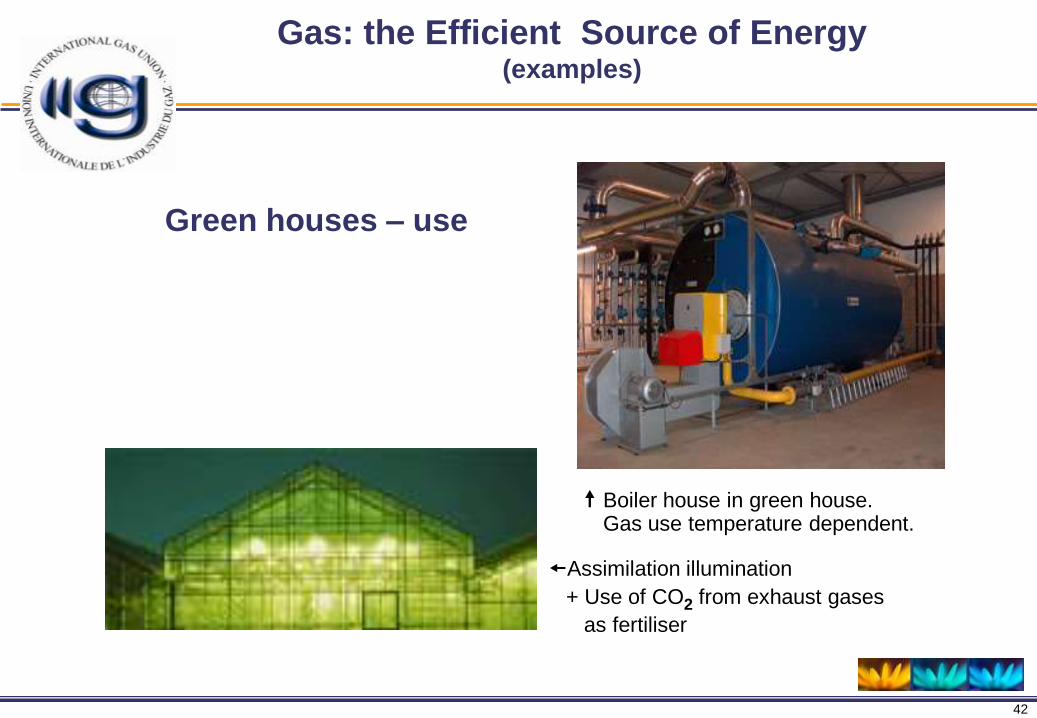
Green houses – use
Boiler house in green house.Gas use temperature dependent.
Assimilation illumination
+ Use of CO2 from exhaust gases
as fertiliser
Gas: the Efficient Source of Energy(examples)

43
Residential Sector

44
Efficient fuel for Heating, Hot water and Cooking
Residential
High efficiency heating system (hot water boiler) with storage vessel
High efficiency heating system
• Clean and easy handling once infrastructure is present
• Low installation cost vs. other fuels• High efficiency heating equipment
available• High comfort factor • Individual heating systems in
apartment blocks

45
Transportation Sector
46
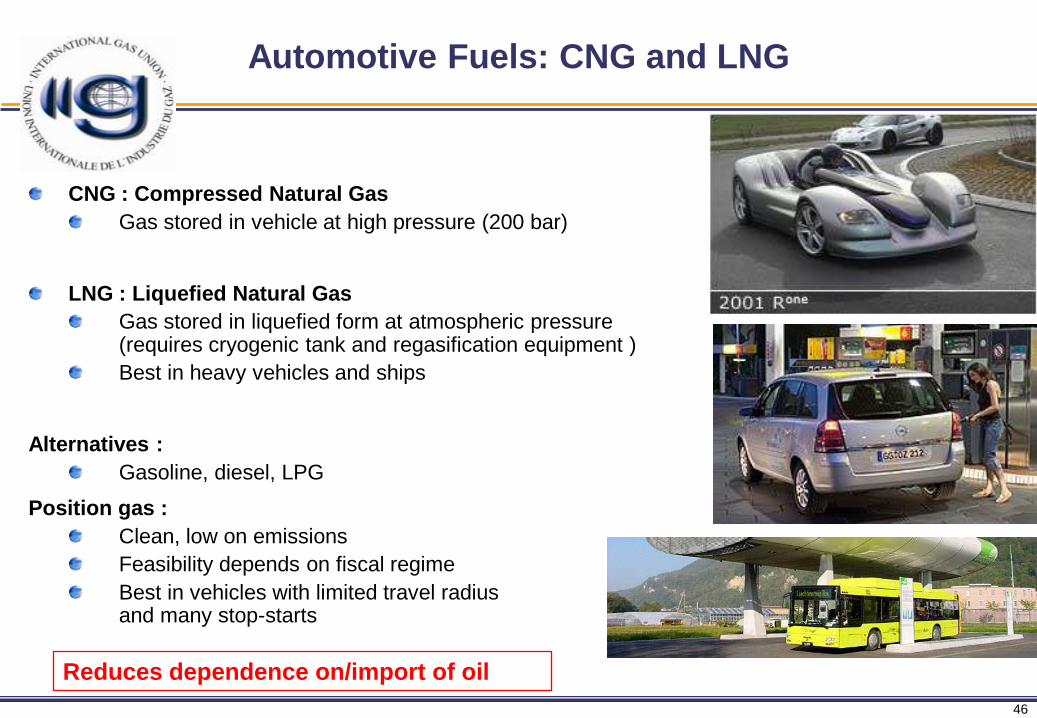
Automotive Fuels: CNG and LNG
CNG : Compressed Natural Gas
Gas stored in vehicle at high pressure (200 bar)
LNG : Liquefied Natural Gas
Gas stored in liquefied form at atmospheric pressure (requires cryogenic tank and regasification equipment )
Best in heavy vehicles and ships
Alternatives :
Gasoline, diesel, LPG
Position gas :
Clean, low on emissions
Feasibility depends on fiscal regime
Best in vehicles with limited travel radiusand many stop-starts
Reduces dependence on/import of oil
47
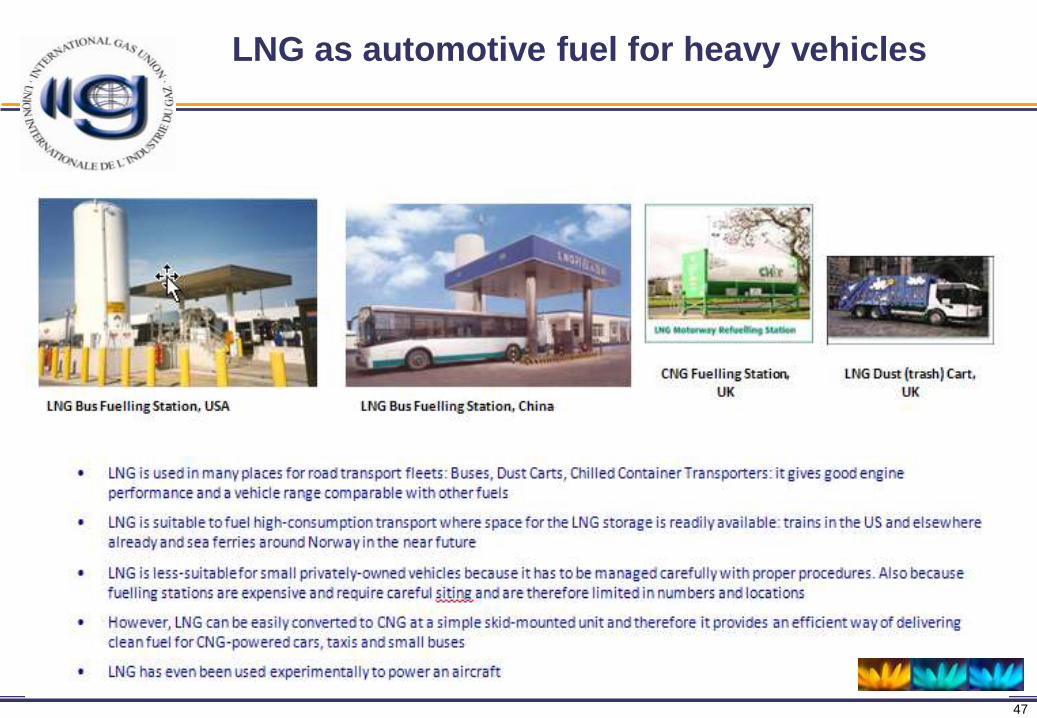
LNG as automotive fuel for heavy vehicles

48
LNG propelled ferry, Norway
LNG as fuel for ships

49
Road transport CNG based
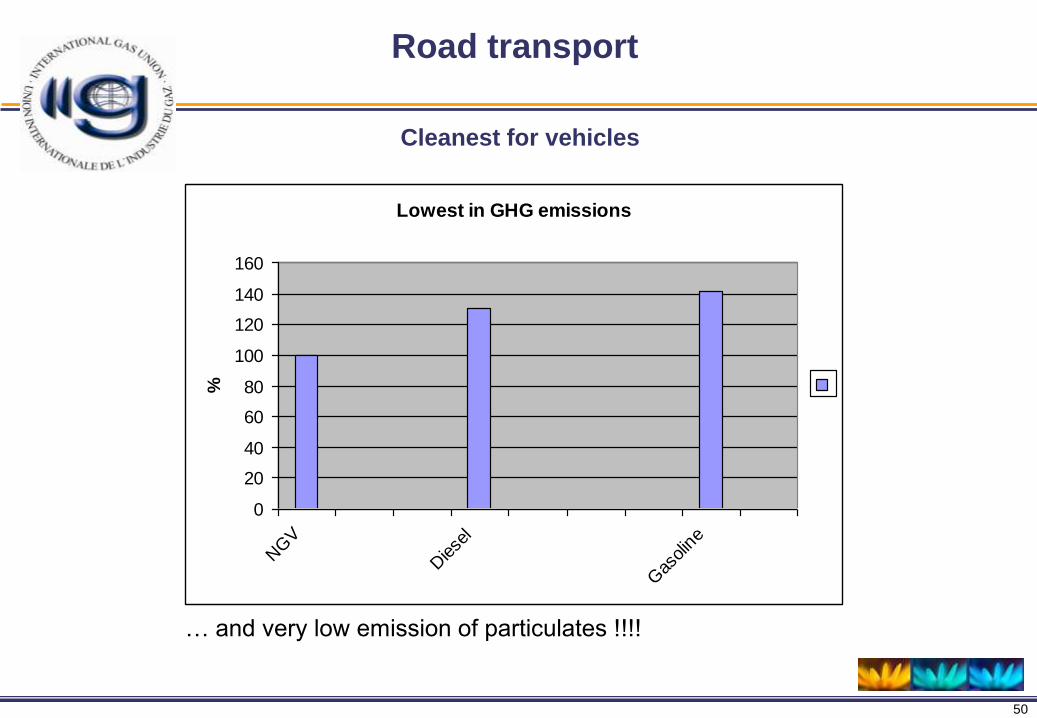
50
Cleanest for vehicles
Lowest in GHG emissions
0
20
40
60
80
100
120
140
160
NG
V
Diese
l
Gas
olin
e
%
Road transport
… and very low emission of particulates !!!!
51
Environmental Impact

52
Natural Gas fired generation has the smallest
ecological footprint
Natural Gas
Wind
Solar
10
10,000
40,000
Land use in acres to have 1,000 MW of capacity
Source: Union Gas Ltd.
53
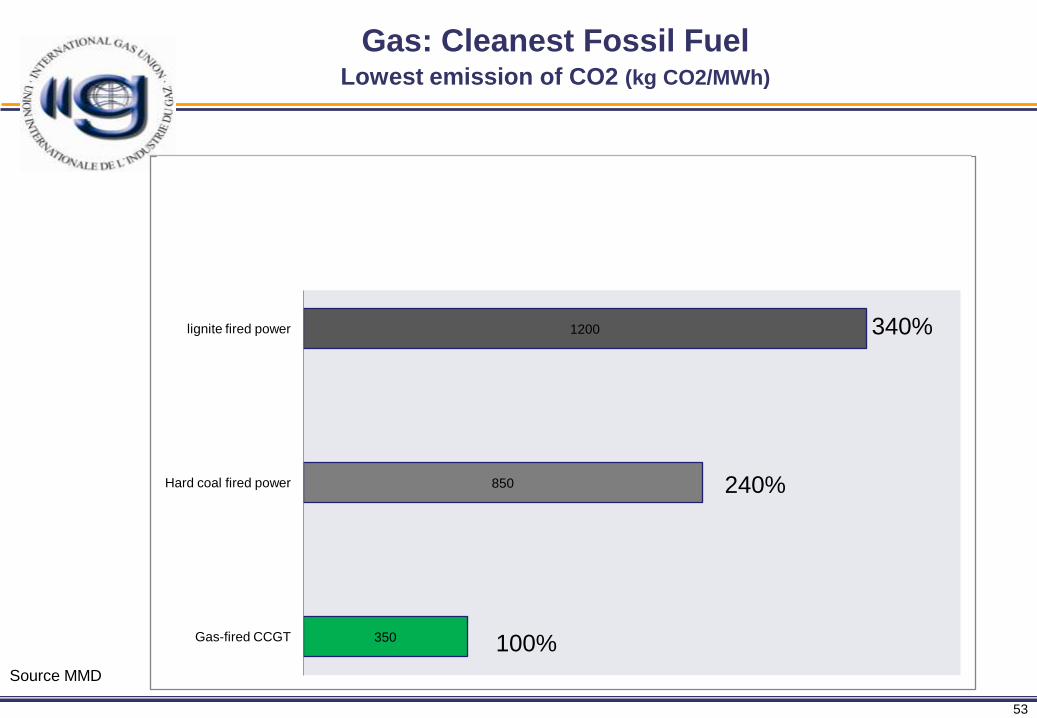
350
850
1200
Gas-fired CCGT
Hard coal fired power
lignite fired power
Gas: the Cleanest Fossil FuelLowest emission of CO2
kg CO2/MWh
Source MMD
100%
240%
340%
Gas: Cleanest Fossil FuelLowest emission of CO2 (kg CO2/MWh)
54
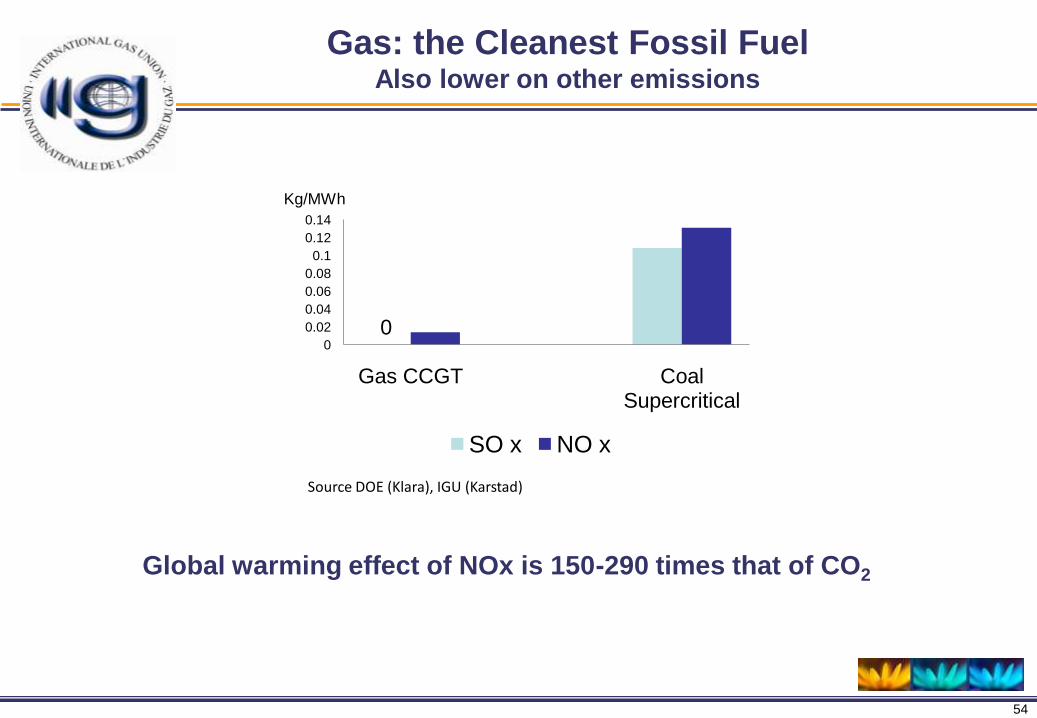
Gas: the Cleanest Fossil FuelAlso lower on other emissions
Global warming effect of NOx is 150-290 times that of CO2
00
0.02
0.04
0.06
0.08
0.1
0.12
0.14
Gas CCGT Coal Supercritical
SO x NO x
Kg/MWh
Source DOE (Klara), IGU (Karstad)

55
Gas: the Cleanest Fossil FuelAlso lower on other emissions
Excludes mercury emissions from coal-fired generation
Global warming effect of NOx is 150-290 times that of CO2

56
Replacing coal with gas for electricity generation: cheapest
& fastest way to meet CO2 reduction targets
0
50
100
150
200
250
300
1980 1990 2000 2010 2020 2030 2040 2050 2060 2070
Mt C
O2
/ y
ear
Year
UK - Electricity CO2 emissions - Case 1 v Case 2
Case 1
Case 2
0
50
100
150
200
250
300
1980 1990 2000 2010 2020 2030 2040 2050 2060 2070
Mt C
O2
/ y
ear
Year
UK - Electricity CO2 emissions - Case 1 v Case 2
Case 1
Case 2
0
50
100
150
200
250
300
1980 1990 2000 2010 2020 2030 2040 2050 2060 2070
Mt C
O2
/ y
ear
Year
UK - Electricity CO2 emissions - Case 1 v Case 2
Case 1
Case 2
UK Targets
with New
“Dash
for Gas”
UK
TargetsW
ith
Coal
Source Shell
Potential UK CO2 Emissions
• Over 40% of global CO2 emissions comes from Power Generation
• Over 70% comes from coal-fired Generation
Source Karstad IGU
A near-term initiative to displace coal
generation with additional generation from existing natural
gas combined cycle capacity could result in reductions in
power sector CO2 emissions on the order of 10%.
An additional potential benefit of displacement of coal
generation with gas will be the reduction in mercury and
criteria pollutants regulated under the Clean Air Act.
MIT, 2010, on the US market
US example UK example
57
CO2 saved today lowers climate risk tomorrow and
reduces the overall abatement costs
The next decade is critical. If emissions do not peak by around 2020 and
decline steadily thereafter, achieving the needed 50% reduction by 2050 will
become much more costly. In fact, the opportunity may be lost completely.
Attempting to regain a 50% reduction path at a later point in time would
require much greater CO2 reductions, entailing much more drastic action on
a shorter time scale and significantly higher costs than may be politically
acceptable.
IEA, ETP 2010

58
Power generation:
CCS for gas and coal
59
CCSExplanatory notes
CCS = Carbon Capture and Storage
Process of carbon sequestration from exhaust gases.
CCS currently regarded as economic at CO2-emission “tax” levels
well above 50 $/tonne.
This section discusses only so-called post combustion carbon-
sequestration.
For the analysis a distinction is made between the CO2 capture and
transportation / storage of CO2.

60
Gas with CCS versus coal with CCSLess CO2 to be captured, transported and stored
Per kwh of electricity produced:•Less than 45% of CO2 to be transported
•Less than 45% CO2 to be stored0
100200300400500600700800900
CO2 captured per kwh(based on 90% CO2 removal)
•Lower costs of CO2 transportation•Lower call on (scarce) CO2 storage capacity
Source: MMD
61
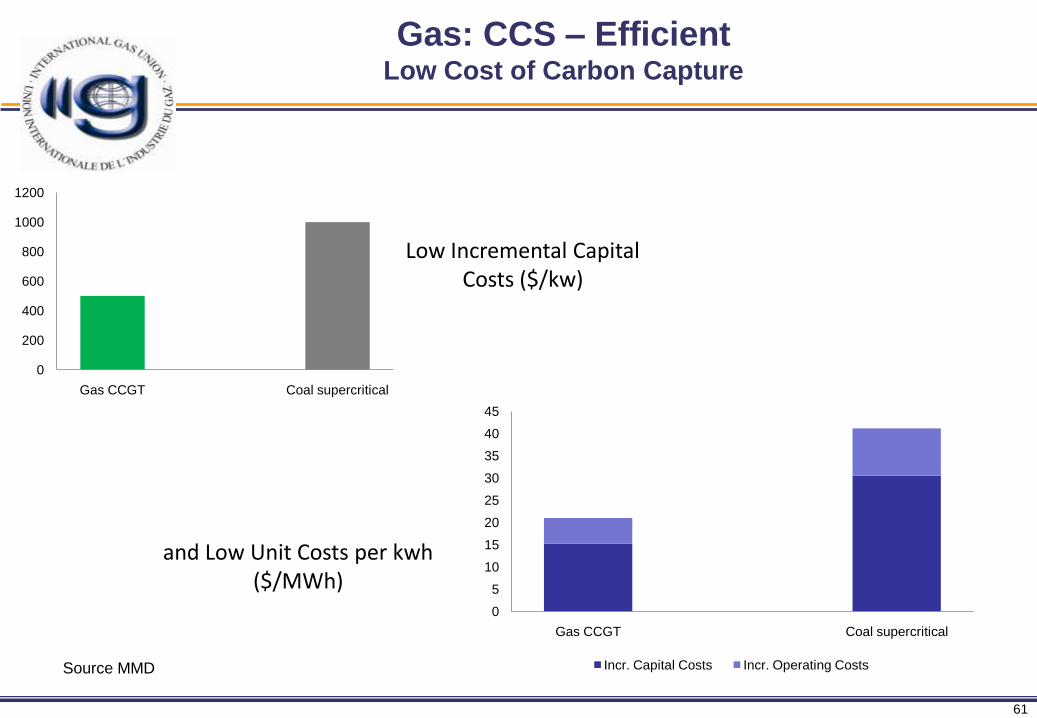
Gas: CCS – EfficientLow Cost of Carbon Capture
0
200
400
600
800
1000
1200
Gas CCGT Coal supercritical
Low Incremental Capital Costs ($/kw)
and Low Unit Costs per kwh($/MWh)
0
5
10
15
20
25
30
35
40
45
Gas CCGT Coal supercritical
Incr. Capital Costs Incr. Operating CostsSource MMD
62
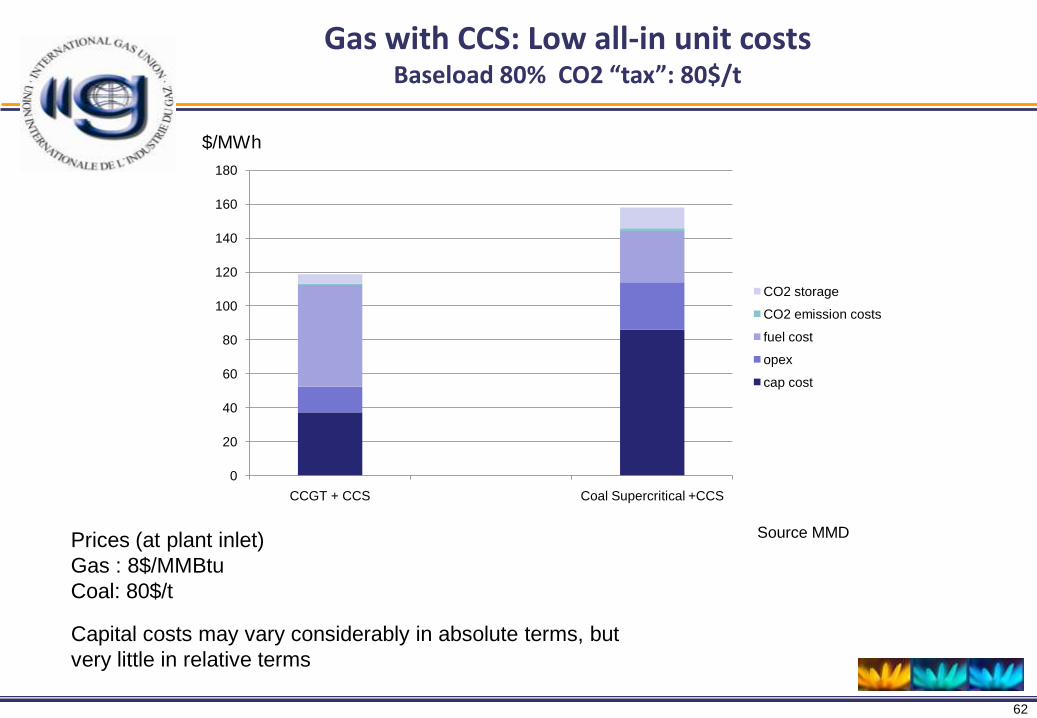
Gas with CCS: Low all-in unit costsBaseload 80% CO2 “tax”: 80$/t
Prices (at plant inlet)
Gas : 8$/MMBtu
Coal: 80$/t
Source MMD
0
20
40
60
80
100
120
140
160
180
CCGT + CCS Coal Supercritical +CCS
CO2 storage
CO2 emission costs
fuel cost
opex
cap cost
Capital costs may vary considerably in absolute terms, but
very little in relative terms
$/MWh
63
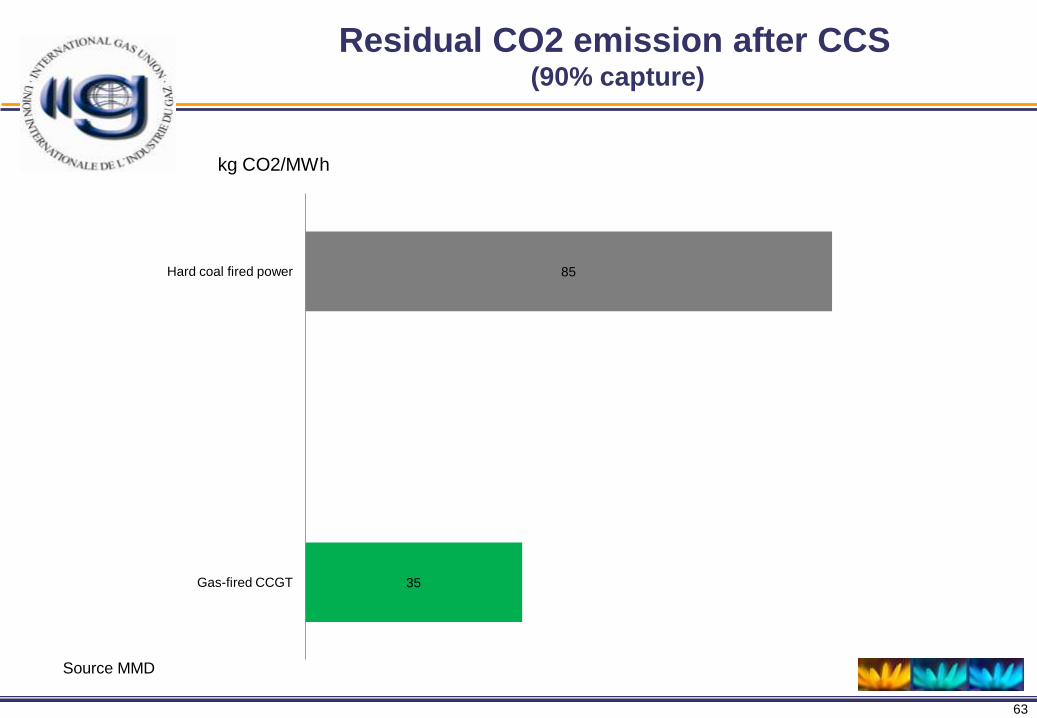
Residual CO2 emission after CCS(90% capture)
35
85
Gas-fired CCGT
Hard coal fired power
Source MMD
kg CO2/MWh
64
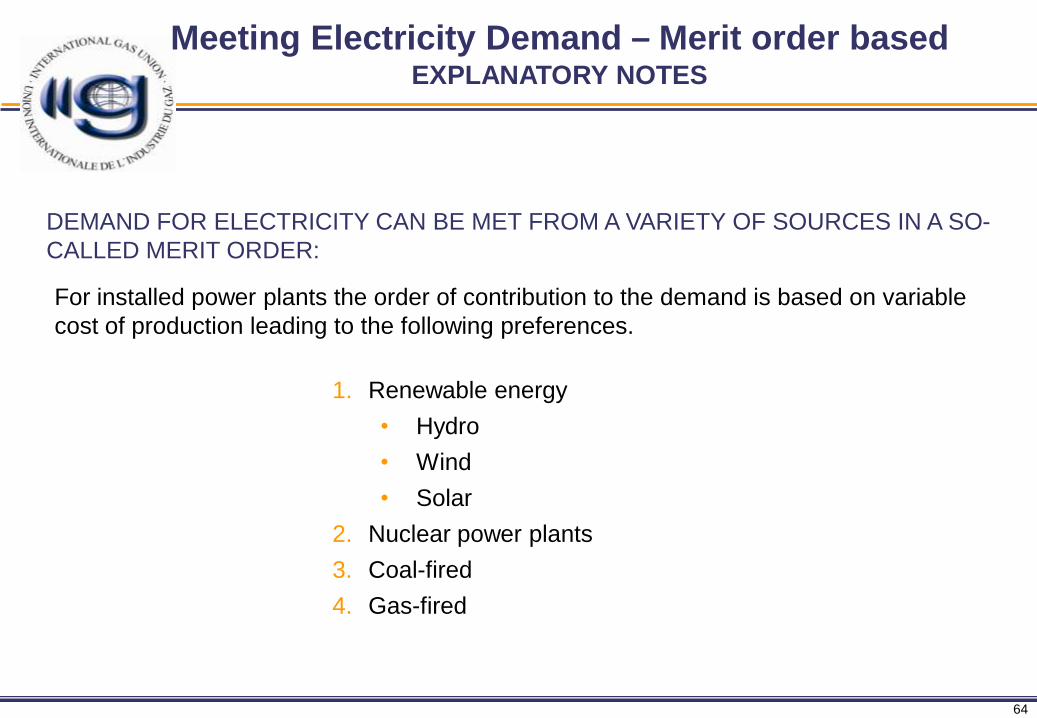
Meeting Electricity Demand – Merit order basedEXPLANATORY NOTES
DEMAND FOR ELECTRICITY CAN BE MET FROM A VARIETY OF SOURCES IN A SO-
CALLED MERIT ORDER:
1. Renewable energy
• Hydro
• Wind
• Solar
2. Nuclear power plants
3. Coal-fired
4. Gas-fired
For installed power plants the order of contribution to the demand is based on variable
cost of production leading to the following preferences.

65
Efficient and Clean Partner for RenewablesExample: Wind and solar complemented by Gas
Example:
Onshore wind supplies some 2700 hrs of intermittent power
backed up by 4300 hrs of gas-fired power, ensuring that supply
meets demand
● Wind and solar energy is volatile.
● Gas-fired generation capacity can enable wind and solar power supplies
Wind
Solar
Natural
Gas

66
Natural Gas complementing electricity supply from
renewables
EXAMPLE OF IMPACT OF POWER SUPPLIES FROM
NUCLEAR, HYDRO, SOLAR AND WIND
ON SUPPLY FROM GAS AND COAL
Source REE, Heren

67
Natural Gas with or w/o CCS
is the cleanest fossil fuel
1
0,75
0,5
0,25
0
GHG Emissions
Metric Tons CO2 per MWH
Wind (0)
Nuclear
Solar ”Clean” Natural Gas* (0.05)
”Clean”Coal*(0.13)
Oil (0.91)Coal
(0.98)
Natural Gas (0.37)
* With CCS

68
Prospects for Developments
of Further Technological
Options

69
Potential for future developments
Micro CHP
Fuel cells
Green gas

70-
Micro CHP:
• Heat and power
from one
apparatus
• High efficiency
system with
generator
• Your own home
power plant
Commercial applications in various countries
Micro CHP
71
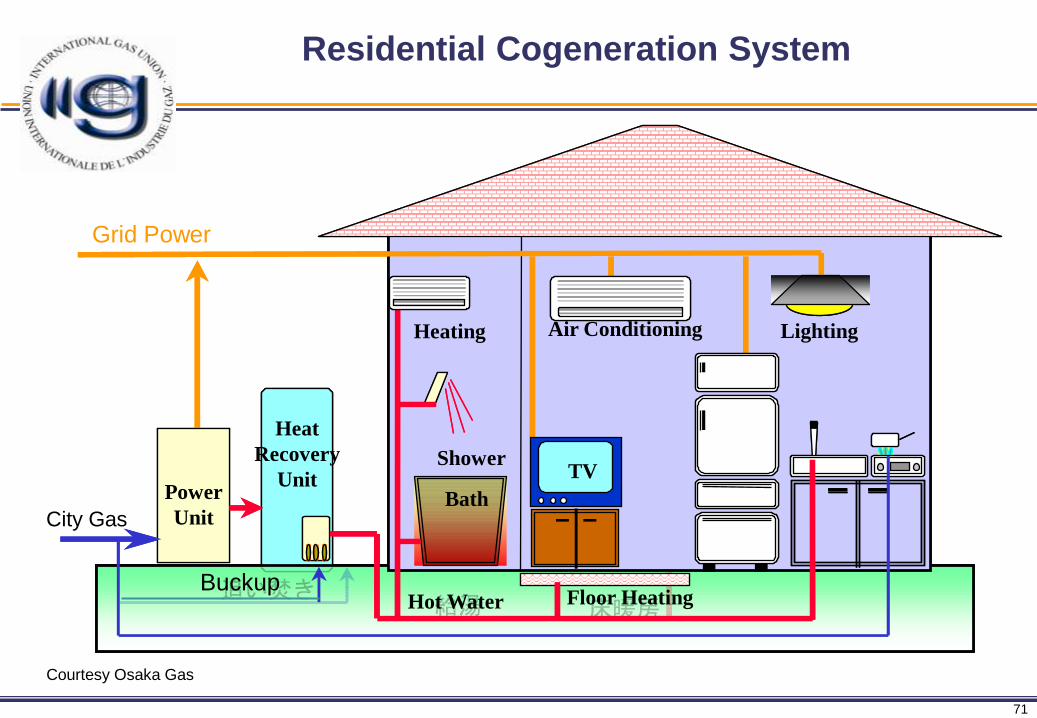
Residential Cogeneration System
貯湯槽
GE
PEFC
本体
追い焚き給湯 床暖房
風呂
エアコン 照明
TVシャワー
暖房乾燥
貯湯槽Power
Unit
Grid Power
City Gas
BuckupHot Water Floor Heating
Bath
Air Conditioning Lighting
TVShower
Heating
Heat
Recovery
Unit
Courtesy Osaka Gas

72
Fuel cells
1. Produce H2 using electricity from solar cells or other renewables or
from gas in a reformer
2. Fuel cell :
2 H2 + O2 2 H2O + electricity
+ heat

73
Fuel cells – Some characteristics
Silent, low maintenance
High electrical efficiency ; total efficiency 80 to 90 %
No CO2 emissions (with likely exception for production of H2 from natural gas)
Fuel cells have stationary applications (buildings, plants, telecommunications) and transportation uses (cars, buses, trucks and machinery)
Today still high cost per installed kW

74
Green Gas
Source Senternovem