Embed Size (px)
Citation preview
2011 International Food and Agribusiness Management Association (IFAMA). All rights reserved
127
International Food and Agribusiness Management Review
Volume 14, Issue 4, 2011
Large Commercial Producer Market Segments for
Agricultural Capital Equipment
Maud Roucan-Kanea, Corinne Alexander
b, Michael D. Boehlje
c,
Scott W. Downeyd, and Allan W. Gray
e
a Assistant Professor, Department of Agricultural and Industrial Sciences,
Sam Houston State University, 1831 University Avenue, Huntsville, Texas, 77340, U.S.A.
b Associate Professor, Department of Agricultural Economics, Purdue University
403 W. State St., West Lafayette, Indiana, 47907, U.S.A.
c Professor, Department of Agricultural Economics, Purdue University
West Lafayette, Indiana, 47907, U.S.A. d Assistant Professor, Department of Agricultural Economics, Purdue University
403 W. State St., West Lafayette, Indiana, 47907, U.S.A.
e Professor, Department of Agricultural Economics, Purdue University
403 W. State St., West Lafayette, Indiana, 47907, U.S.A.
Abstract
Using cluster analysis, this research identifies four buying behavior segments of commercial
producers who purchase capital items: Convenience, Price, Performance, and a group of Balance
buyers who consider all of these factors as well as customer service and support services in
roughly equal allotments. The Balance segment is the largest of the four. Price and Performance
buyers tend to be younger, larger, and better educated than the Convenience or Balance buyers.
We discuss the implications of these customer market segments for capital equipment marketers
and salespeople.
Keywords: Cluster Analysis, Capital Equipment, Market Segmentation, Commercial Producers
Corresponding author: Tel: +1 765.494.4249
Email: [email protected]
M. Roucan-Kane: [email protected] M.D. Boehlje: [email protected]
S.W. Downey: [email protected] A.W. Gray: [email protected]
Roucan-Kane et al. / International Food and Agribusiness Management Review / Volume 14, Issue 4, 2011
2011 International Food and Agribusiness Management Association (IFAMA). All rights reserved.
128
Introduction
A review of the current literature reveals that not much has been written about the buying behav-
ior of farmers as they make decisions about the purchase of capital items. Yet this information is
critical for firms to deploy marketing budgets effectively. Consolidation among farming opera-
tions today means that there are fewer potential customers for capital equipment dealers and
manufacturers. One implication of consolidation, first noted by Kohls (1959), is that the remain-
ing, larger customers have seen an expansion in purchasing power. This translates to tremendous
market opportunities for suppliers of capital items. Understanding how producers buy is valuable
to those sellers who hope to develop strategies for attracting and retaining customers in an evolv-
ing agricultural marketplace. This information is also valuable to researchers who are concerned
about the factors that drive economic decisions on the farm.
This paper presents the results of a market segmentation of U.S. commercial producers using
cluster analysis that will help practitioners and researchers better understand buying preferences
for capital items in the agricultural sector. U.S. commercial agricultural producers are defined as
farming operations with annual sales of $100,000 or greater1. This group represented 16% of op-
erations in 2007 but accounted for 58% of the estimated value of machinery and equipment in
the United States (USDA, 2007; p104). Therefore, understanding and successfully serving these
commercial producers who represent such a large portion of machinery and equipment expendi-
tures is critical to the success of dealers and manufacturers as they look for ways to retain cus-
tomers, increase repeat customer transactions, and capture and increase customer lifetime ex-
penditures.
This research aims to identify today’s distinct market segments for capital items for U.S. com-
mercial agricultural producers. This cluster analysis is used to segment the commercial producer
market based on survey data describing their buying behavior for capital items (such as equip-
ment, machinery, etc). We find four buying segments for capital items: Balance, Convenience,
Price, and Performance. Finally, we discuss the implications of our results for suppliers of capital
equipment serving these market segments.
Previous Research
To the best of our knowledge, there has been very little research on buying behavior and custom-
er segmentation of agricultural capital markets. The literature that specifically focuses on agri-
cultural capital equipment market segments is a subset of the broader literature on market seg-
mentation and of the industrial market segmentation focuses on segmenting business customers.
Kotler and Keller (2011) define market segmentation as a three-step process that starts by identi-
fying distinct groups of consumers who have different needs and wants, then selecting one or
more market segments to target, and lastly communicating the benefits of the company’s offering
to each target market. Much of the industrial market segmentation literature focuses on the first
step of identifying the distinct groups of buyers and the bases (for example, demographics, pur-
chasing approaches, etc.) for segmenting them, rather than the strategic problem of allocating
1 When the Large Commercial Producer Survey was first conducted, the USDA definition of a commercial farm was
a farm with at least $100,000 in gross sales (USDA, 1998). In the 2008 survey, we still use $100,000 in gross sales
as a benchmark definition of a commercial farm.

Roucan-Kane et al. / International Food and Agribusiness Management Review / Volume 14, Issue 4, 2011
2011 International Food and Agribusiness Management Association (IFAMA). All rights reserved.
129
marketing resources (Plank, 1985; Freytag and Clarke, 2001). In one seminal study on how firms
use market segmentation, Wind and Cardozo (1974) found that it is most often used as a market-
ing tool ex post to explain the outcome of a marketing effort but they argue it would be best used
ex ante in the planning and implementation of marketing efforts. Freytag and Clarke (2001) ar-
gue the segmentation approach depends on the whether the market situation can be characterized
as a simple market transaction or a complex relationship management. In the case of complex
relationship management, which is most relevant to our study of agricultural producers, the firm
needs to understand the customers’ needs and wants and the choice of which segments to serve
will depend on how well the firm’s strengths match the customers’ needs and wants. Overall, the
industrial market segmentation literature focuses on the analytical tools of how to segment the
markets and on how firms utilize segmentation in their marketing efforts.
As with the industrial market segmentation literature, most of the literature on market segments
for agricultural capital equipment focuses on both how to segment farmers and on describing the
market segments. Kohls (1956, 1959) was one of the first to study how farmers purchase capital
equipment and he interviewed 201 farmers in Central Indiana in June 1955. He found that alt-
hough capital purchases tend to be relatively large, farmers do not shop around much and most
of their purchasing activity is done within five miles of their home (Kohls, 1956). Before making
their purchase decision, farmers discuss it with the dealers, consult neighbors, relatives, and
friends, have read some form of literature about the product, and have usually seen a similar item
in operation on friends’ or neighbors farms (Kohls, 1956). Kohls (1956) also indicated that a fa-
vorable price and having the desired item are the two main reasons that explain the farmer’s de-
cision to choose a specific dealer. Kohls (1956) also studied dealer and brand loyalty and found
that no socioeconomic characteristics significantly explained dealer loyalty. Although only sig-
nificant at the 20 percent level, brand preference tended to be negatively related with income,
age, and farm experience; and positively related with farmer’s exposure to radio, television, and
printed publications. Farmers who believed there were greater differences among available deal-
ers tended to have higher brand preferences as well.
Kool et al. (1997) studied Dutch farmers’ purchasing decision processes for inputs. They found
that the more familiar the farmer was with the product and the smaller the purchase, the quicker
the farmer makes a purchase decision. In this case, farmers mainly focus on prices, the availabil-
ity of alternatives, and special bargains. Thus, suppliers should emphasize price level, distribu-
tion (availability), and brand knowledge. In contrast, for infrequent decisions, farmers spend a
considerable amount of time on the decision and suppliers in those cases should focus on product
performance, price in relation to product performance, and personal selling. The authors also
found that a personal relationship between the farmer and the vendor decreased the evaluation of
other alternatives by the farmers, which suggests that suppliers should spend time investing in
their relationship with the farmer. The Kool et al.’s (1997) study highlights that both price and
relationship appear to play a role in farm buyer preferences for equipment.
Pratik (2008) presented a case study of an Indian company manufacturing small-scale tractors.
The company was trying to select the most appropriate market segment for its product given the
advantages of their product, tractorization in India, the industry, and the available market seg-
ments. The company’s major dilemma was determining whether the small and marginal farmers
were the most appropriate target market, whether they would represent enough sales, and wheth-
Roucan-Kane et al. / International Food and Agribusiness Management Review / Volume 14, Issue 4, 2011
2011 International Food and Agribusiness Management Association (IFAMA). All rights reserved.
130
er these farmers could be convinced to buy a small tractor instead of a large one given the saying
“the bigger, the better”.
Gloy and Akridge (1999) used cluster analysis to segment the commercial producer market for
agricultural inputs (expendable items, such as feed, seed, and fertilizer, relative to capital items,
such as equipment). Their work was based on data from the 1998 Purdue Large Commercial
Producer Survey and they identified four market segments: Balance, Price, Performance, and
Convenience. Their four market segments refine the traditional three segments of Business, Eco-
nomic, and Price (Downey, Holschuh, and Jackson, 1999) where members of the Balance and
Performance segments are Business buyers, members of the Price segment are Economic buyers
and members of the Convenience segment are Relationship buyers.
Walley et al. (2007) used data from a survey of farmers and farm contractors to examine the im-
portance of brand in the industrial purchase decision, and more specifically in the United King-
dom (UK) tractor market. They found that brand name was the most important purchase decision
factor with a 38.95% weight in the decision and ranked above price, dealer proximity, and quali-
ty of dealer service. The dealer is also an influential part of the decision through their location
and their quality of service. Since the respondents award the highest brand utility scores to the
brands they own, with the exception of one tractor brand, the authors concluded that tractor own-
ers are very brand loyal.
Harbor, Martin and Akridge (2008) used data from the 2003 Purdue Large Commercial Producer
Survey to assess the nature of brand loyalty for capital items among commercial agricultural
producers in the United States. They found that over half of the respondents consider themselves
loyal to brands of capital items. The data show that attending but not completing high school and
producing corn or soybeans increased the likelihood of being brand loyal to capital items. Other
variables that positively influenced capital brand loyalty included the reported use of media to
obtain information useful for making input decisions, and the perception that substantial differ-
ences in performance exist across branded capital items.
Boehlje and Roucan-Kane (2009) presented a case study of Deere’s market segmentation. Deere
had historically focused on and had a strong market position in power, implement and combine
equipment with traditional commercial producers in Midwest corn/soybean agriculture. Howev-
er, a customer segmentation analysis indicated that there are eight different and important cus-
tomer segments in the farm machinery and equipment market (not-for-profit public companies,
not-for-profit property owner, part-time producers, traditional producers, large producers, extra-
large producers, agricultural service providers, and commercial companies) with different atti-
tudes, goals, behaviors, and needs. By starting from the customer’s standpoint, Deere realized
that some of these segments were growing exponentially — particularly the large/mega farm, the
agricultural service provider/custom contractor, and some of the not-for-profit (state and federal
government, etc.) segments – and could be Deere’s future source of growth. However, these
“new” customers needed machinery and equipment with different features convincing Deere to
invest in electronic technology as long as it was simple to use and reliable.
The segmentation literature in general focuses more on grouping customers into market segments
than on the implementation of a marketing plan based on these market segments (Dibb and Sim-
Roucan-Kane et al. / International Food and Agribusiness Management Review / Volume 14, Issue 4, 2011
2011 International Food and Agribusiness Management Association (IFAMA). All rights reserved.
131
kin, 1994). Therefore, after we identify the market segments, we will focus on describing the
customers in each segment based on characteristics salespeople can easily observe or elicit by
asking key questions (Wind and Cardozo 1974; Gupta and Chintangunta 1994; Wyner 1999;
Mudambi 2002). Finally, we will discuss implications of these market segments for salespeople
interacting with their customers.
Data
This research uses phone survey data collected during the 2008 Large Commercial Producer Pro-
ject conducted by The Center for Food and Agricultural Business at Purdue University. The sur-
vey specifically targeted mid-size and large producers of corn/soybeans, wheat/barley/canola,
cotton, dairy, swine, and beef farming operations. State quotas were set so that targeted produc-
ers were in states that accounted for 75 percent of 2007 U.S. production in each of the six target
enterprise classes. The questionnaire was successfully answered by 2,575 producers during Janu-
ary and February 2008, resulting in a response rate of 28 percent (Roucan-Kane et al. 2010).
Methods
The cluster analysis used in this study follows the same methodology as Gloy and Akridge
(1999), Alexander, Wilson and Foley (2005), and Roucan-Kane et al. (2010). First, we select the
clustering variables. We used responses to a buying behavior question because behavioral data is
more descriptive of the customers’ basic reasons for purchase (Dibb and Simkin, 1994; Assael,
1995). In addition, one advantage of using cluster analysis is that it “minimizes research bias by
not specifying classes according to pre-specified conceptions (Rosenburg and Turvey, 1991).
This key survey question asked the respondents to weigh the influence of five factors they may
consider to choose their capital equipment supplier.
We used a two-step clustering algorithm (Gloy and Akridge, 1999; Alexander, Wilson and Fo-
ley, 2005; and Roucan-Kane et al., 2010). First, we used Ward’s Minimum Variance hierar-
chical clustering algorithm to identify the appropriate number of clusters and obtain seed values
that are being used in the second step. Second, we used the k-means non-hierarchical clustering
algorithm to identify the market segments.
Results
The key survey question used in the segmentation analysis asked the respondents to weigh the
influence of five factors they may use to choose their capital equipment supplier. The influence
of these factors was measured on a forced sum scale using the following question: When you
choose a supplier for capital equipment, how is your decision influenced by the following fac-
tors? Assign a percentage value to each factor based on its importance in the decision. The
percentages should add to 100 in each column. The response categories included conven-
ience/location, customer service/information, price, product performance, and support services.
The survey defined customer service/information as responsiveness, follow-up, advice, etc.
Product performance referred to characteristics such as durability of the equipment. Support ser-
vice was related to whether the dealer offered delivery, repair, and application services. We left
the definition of convenience/location, customer service/information, and price up to the re-
Roucan-Kane et al. / International Food and Agribusiness Management Review / Volume 14, Issue 4, 2011
2011 International Food and Agribusiness Management Association (IFAMA). All rights reserved.
132
spondent’s interpretation. Our discussion with some respondents on this topic suggested that
producers relate convenience/location to the presence of local suppliers, long operating hours,
etc. The same question was asked for financial products, animal health, feed, seed, and crop pro-
tection chemicals.2
The data cleaning process, prior to the cluster analysis, consisted of deleting 227 observations
that represented respondents that had a farm size less than the lower bound of the mid-size farm
definition as defined by Alexander et al. (2009). We then deleted 124 observations where the re-
spondent allocated the full 100% to a single factor. These single-factor buying behaviors each
represent a distinct, and narrowly defined, market segment. Further, these single-factor market
segments each represent about 1% or less of the respondents and are too small for a capital
equipment firm to serve with a tailored marketing program. The data cleaning process reduced
the number of observations from 2574 to 2223 producers.
Based on the pseudo-t2 value and the pseudo F-statistic for the cluster analysis, there were four
natural clusters for capital equipment buying behavior. Table 1 presents the sample means for
the clustering variables and the names of each cluster based on the most influential factor in the
choice of a capital equipment provider. Tables 2 and 3 demonstrate that these clusters meet the
validation criteria suggested by Gloy and Akridge (1999), i.e. that members of the segments dif-
fer in the non-clustering variables such as their demographics, general business characteristics,
management practices, and attitudes.
Segments’ Characteristics
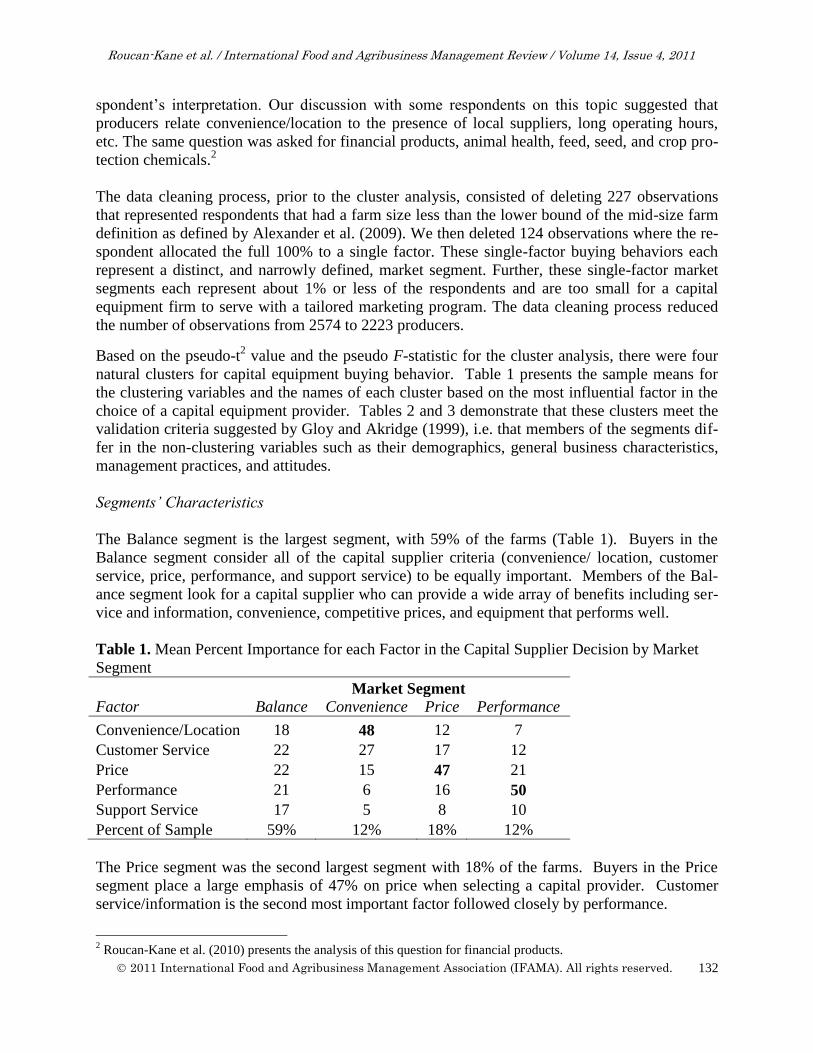
The Balance segment is the largest segment, with 59% of the farms (Table 1). Buyers in the
Balance segment consider all of the capital supplier criteria (convenience/ location, customer
service, price, performance, and support service) to be equally important. Members of the Bal-
ance segment look for a capital supplier who can provide a wide array of benefits including ser-
vice and information, convenience, competitive prices, and equipment that performs well.
Table 1. Mean Percent Importance for each Factor in the Capital Supplier Decision by Market
Segment
Market Segment
Factor Balance Convenience Price Performance
Convenience/Location 18 48 12 7
Customer Service 22 27 17 12
Price 22 15 47 21
Performance 21 6 16 50
Support Service 17 5 8 10
Percent of Sample 59% 12% 18% 12%
The Price segment was the second largest segment with 18% of the farms. Buyers in the Price
segment place a large emphasis of 47% on price when selecting a capital provider. Customer
service/information is the second most important factor followed closely by performance.
2 Roucan-Kane et al. (2010) presents the analysis of this question for financial products.

Roucan-Kane et al. / International Food and Agribusiness Management Review / Volume 14, Issue 4, 2011
2011 International Food and Agribusiness Management Association (IFAMA). All rights reserved.
133
The Convenience segment accounted for 12% of the farms. This segment placed an average
weight of 48% on the convenience and location provided by a capital provider. Customer ser-
vice/information is the second most important factor to the Convenience segment.
The Performance segment also accounted for 12% of the farms. Approximately one half of the
purchase decision of producers in the Performance segment is based on the performance of the
products. Price is the second most important factor to the Performance segment.
Figure 1 indicates differences in market segment membership between the crop and livestock
producers. Crop producers are slightly more likely to be Performance and Price buyers, while
livestock producers are more likely to be Convenience buyers of capital items.
Figure 1. Market Segments for Crop and Livestock Producers
Demographics
Producers in the Balance segment are slightly less educated than the average with 27% having a
bachelor’s degree or more education (Table 2). They also tend to be slightly older than producers
in other segments. In terms of gross sales, 37% of the Balance segment have gross sales over $1
million, 25% have sales between $500,000 and $1 million, and 38% have gross sales less than
$500,000. We cannot draw any inferences about the sales distribution for the population of Bal-
ance buyers since we oversampled producers with higher gross sales; that said, we can compare
the distribution of gross sales across segments. The majority of the Balance buyers (76%) con-
sider themselves primarily crop operations, while 24% of the Balance buyers consider them-
selves primarily livestock operations.
Roucan-Kane et al. / International Food and Agribusiness Management Review / Volume 14, Issue 4, 2011
2011 International Food and Agribusiness Management Association (IFAMA). All rights reserved.
134
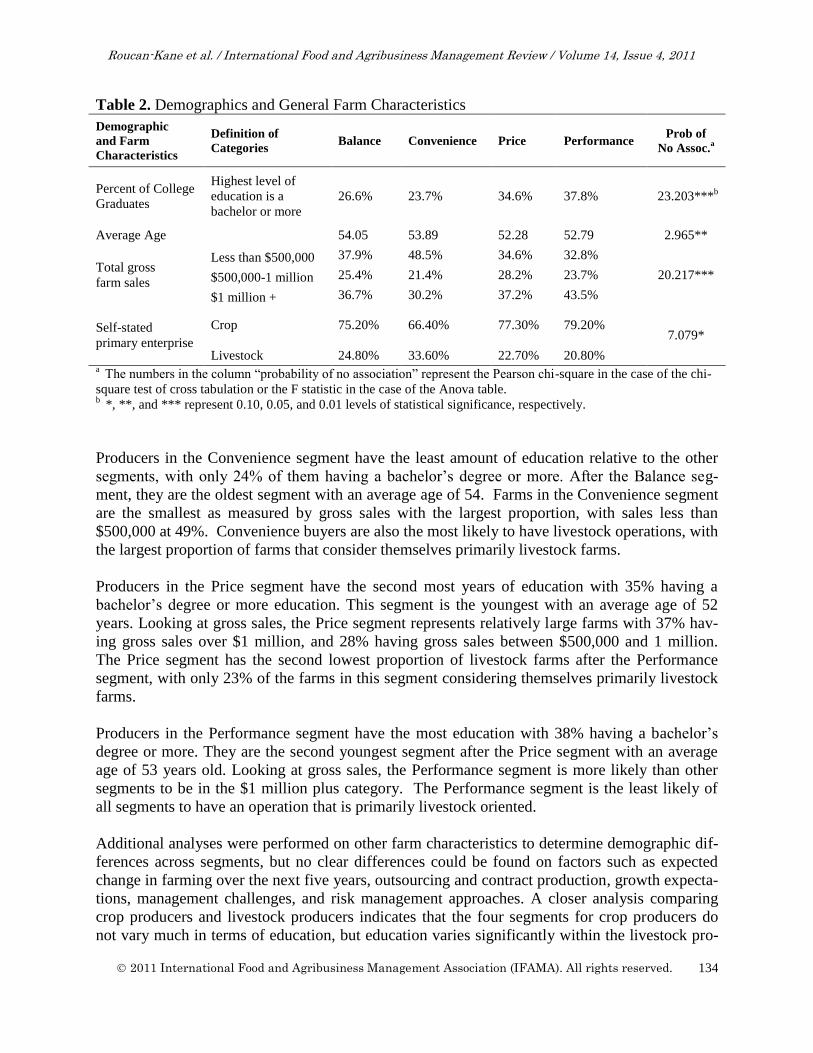
Table 2. Demographics and General Farm Characteristics
Demographic
and Farm
Characteristics
Definition of
Categories Balance Convenience Price Performance
Prob of
No Assoc.a
Percent of College
Graduates
Highest level of
education is a
bachelor or more
26.6% 23.7% 34.6% 37.8% 23.203***b
Average Age 54.05 53.89 52.28 52.79 2.965**
Total gross
farm sales
Less than $500,000 37.9% 48.5% 34.6% 32.8%
20.217*** $500,000-1 million 25.4% 21.4% 28.2% 23.7%
$1 million + 36.7% 30.2% 37.2% 43.5%
Self-stated
primary enterprise
Crop 75.20% 66.40% 77.30% 79.20% 7.079*
Livestock 24.80% 33.60% 22.70% 20.80% a The numbers in the column “probability of no association” represent the Pearson chi-square in the case of the chi-
square test of cross tabulation or the F statistic in the case of the Anova table. b *, **, and *** represent 0.10, 0.05, and 0.01 levels of statistical significance, respectively.
Producers in the Convenience segment have the least amount of education relative to the other
segments, with only 24% of them having a bachelor’s degree or more. After the Balance seg-
ment, they are the oldest segment with an average age of 54. Farms in the Convenience segment
are the smallest as measured by gross sales with the largest proportion, with sales less than
$500,000 at 49%. Convenience buyers are also the most likely to have livestock operations, with
the largest proportion of farms that consider themselves primarily livestock farms.
Producers in the Price segment have the second most years of education with 35% having a
bachelor’s degree or more education. This segment is the youngest with an average age of 52
years. Looking at gross sales, the Price segment represents relatively large farms with 37% hav-
ing gross sales over $1 million, and 28% having gross sales between $500,000 and 1 million.
The Price segment has the second lowest proportion of livestock farms after the Performance
segment, with only 23% of the farms in this segment considering themselves primarily livestock
farms.
Producers in the Performance segment have the most education with 38% having a bachelor’s
degree or more. They are the second youngest segment after the Price segment with an average
age of 53 years old. Looking at gross sales, the Performance segment is more likely than other
segments to be in the $1 million plus category. The Performance segment is the least likely of
all segments to have an operation that is primarily livestock oriented.
Additional analyses were performed on other farm characteristics to determine demographic dif-
ferences across segments, but no clear differences could be found on factors such as expected
change in farming over the next five years, outsourcing and contract production, growth expecta-
tions, management challenges, and risk management approaches. A closer analysis comparing
crop producers and livestock producers indicates that the four segments for crop producers do
not vary much in terms of education, but education varies significantly within the livestock pro-

Roucan-Kane et al. / International Food and Agribusiness Management Review / Volume 14, Issue 4, 2011
2011 International Food and Agribusiness Management Association (IFAMA). All rights reserved.
135
ducers. Specifically, 50% of livestock producers in the performance segment had a bachelor’s
degree or more. This proportion declines to 31% for the Price segment, 22% for the Balance
segment, and 9% for the Convenience segment. This means livestock producers in the Balance
and Convenience segments have significantly fewer years of education than their crop counter-
parts. As for age, livestock producers in the Convenience segment are slightly younger (50.6
years old versus 53.7 years old) than crop producers.
For marketing managers, demographic information about the four segments has several implica-
tions. First, the Balance segment is quite large for both the crop and livestock sectors. This im-
plies that there are significant opportunities for marketers who want to consider targeting this
segment. Yet, the preferences of this segment are complex because these buyers are motivated
similarly by all value bundle characteristics – price, performance, convenience, customer service,
and support services. The support services aspect of the value bundle may offer marketers the
most opportunity for developing a differentiated offering that targets this segment. The Balance
segment cares about support services more than any other segment. Along with their older age,
this group wants to have confidence that the company they buy from will maintain and service
the equipment they sell. This is a revenue opportunity for capital equipment sellers.
Beyond the Balance segment, it is worth noting the role that customer service plays. This factor
was ranked first or second for all but the Performance segment. Customer service activities sup-
port the relationship with the customer, in contrast to support services which focus on products
and implementation. Marketers and sales people would do well to recognize that interaction with
customers before and after the sale may influence the buying decision. For marketing strategies
that do not clearly indicate a price or performance dimension, customer service and the role of
local sales and technical staff may be an area worth considering as a key point of differentiation.
Information Characteristics
Respondents were asked to rate the usefulness of information sources and communication medi-
as (Table 3). Respondents rated local dealer sales/technical people to be the most useful infor-
mation sources on average, followed by other farmers, manufacturer salespeople, extension ser-
vice, and lenders. Manufacturer technical specialists and independent paid consultants were rated
the least useful. This finding suggests that manufacturers of capital items should consider in-
creasing the training they offer local dealers representatives, rather than sending their own repre-
sentatives to producers. The high rating of other farmers confirms the results of Kool et al.
(1997) who stated that “presence [of the product] in the evoked set of farmers is vital to the mar-
ket success of a product”. Capital items are a major investment for producers, and producers
gather information about an item before purchase to reduce the risk that they make a poor in-
vestment. Buying a product that they have observed another producer use or that is recommend-
ed by other producers lowers the risk associated with the investment. Therefore, if a manufactur-
er wishes to succeed in a new market, promoting at trade shows with current customers who can
provide testimonials either in person or through videos, and offering leasing opportunities where
producers can test the capital item before purchase may lower producers’ perception of the risk
associated with a major investment.

Roucan-Kane et al. / International Food and Agribusiness Management Review / Volume 14, Issue 4, 2011
2011 International Food and Agribusiness Management Association (IFAMA). All rights reserved.
136
Table 3. Information Characteristics
Information
Characteristics Definition/Categories Balance Convenience Price Performance
Prob of
No Assoc.
Mean
Usefulness
of information
sources
(1=never useful,
5=always useful)
Extension service 2.63 2.61 2.70 2.68 0.51
Manufacturer salespeople 2.80 2.66 2.84 2.87 2.44*
Manufacturer technical
specialists 2.34 2.14 2.34 2.51 5.52***
Independent, paid
consultants3
2.44 2.27 2.43 2.47 0.71
Local dealer sales/technical
people 3.21 3.14 3.09 3.19 1.62
Lenders 2.55 2.50 2.45 2.37 1.86
Other farmers 3.05 2.97 3.09 3.10 0.97
Mean
Usefulness
of communication
media
(1=never useful,
5=always useful)
General farm publications 3.33 3.25 3.33 3.33 0.56
Crop/livestock specific
publications 3.10 2.95 3.08 3.15 1.82
Agricultural newspapers 3.01 2.90 3.04 3.02 0.91
Agricultural newsletters 2.87 2.76 2.90 2.93 1.33
Farm shows 2.82 2.66 2.73 2.77 2.56*
Direct mail 2.62 2.48 2.63 2.63 1.39
Supplier’s meetings 2.69 2.57 2.76 2.71 1.99
Agricultural websites 2.44 2.14 2.51 2.51 6.20***
Field days 2.74 2.60 2.75 2.75 1.55
Agricultural radio programs 2.46 2.40 2.41 2.54 0.95
Agricultural TV programs 2.29 2.30 2.37 2.33 0.65
Telephone contact 2.16 2.15 2.26 2.23 1.26
There are only a few statistically significant differences in how segments rate the usefulness of
information sources. The Performance segment is significantly more likely to consider manufac-
turer salespeople and technical specialists to be useful than the other segments, while the Con-
venience segment rates them less useful. Performance buyers who are seeking optimum perfor-
mance of the product value the more detailed information that can be provided by the manufac-
turer technical specialists. In contrast, Convenience buyers tend to place a low value on detailed
information and would rather rely on the recommendation of the local dealer.
Producers were also asked to rate the usefulness of communication media, and on average they
rated general farm publications the most useful, followed by crop/livestock specific publications, 3 Usefulness of consultants was calculated only for the respondents who use environmental, crop, management
consultants or nutritionists.

Roucan-Kane et al. / International Food and Agribusiness Management Review / Volume 14, Issue 4, 2011
2011 International Food and Agribusiness Management Association (IFAMA). All rights reserved.
137
agricultural newspapers, agricultural newsletters, farm shows, field days, supplier’s meetings,
direct mail, agricultural websites, agricultural radio programs, agricultural TV programs, and tel-
ephone contact. Capital suppliers may wish to target their advertisements to these general farm
publications and crop/livestock-specific publications when the target market of the publication
matches the target market for their product. There are only a few statistically significant differ-
ences in how segments rate the usefulness of communication media. The Balance segments finds
farm shows more useful than the other segments, while the Convenience segment finds them the
least useful. For agricultural websites, Price and Performance buyers rate them as more useful
than the other segments, and Convenience buyers rate them the least useful.
Decision-making Process
To sell effectively to producers, it is important for manufacturers and dealers to understand how
their customers make decisions (Table 4). Although there are no significant differences across
segments, slightly over half of the respondents make decisions without input from others. For
these producers, it is important for technical representatives and salespeople to directly approach
the primary decision-maker. The second largest set of respondents make decisions after exten-
sive discussions with other family members and/or employees. For these producers, it is im-
portant for technical representatives and salespeople to engage more members of the operation.
As sales representatives think about their strategy, they first need to determine how each of their
customers make their purchasing decisions and respond accordingly.
Table 4. Decision-making Process for the Purchase of Capital Items
Percentage of respondents Balance Convenience Price Performance Prob of No
Assoc.
Made by me with very little input from
family members and/or employees 48.60% 58.40% 49.60% 51.50%
17.655
Made by me after extensive discus-
sions with other family members
and/or employees 34.70% 24.80% 36.40% 31.30%
Made by the person responsible for
using the item after extensive discus-
sion with others on the farm. 9.60% 8.80% 8.10% 7.60%
Made by the person responsible for the
item with little input from anyone else. 5.20% 6.50% 4.10% 6.90%
Made by a purchasing agent hired by
our farm. 1.80% 1.50% 1.80% 2.70%
When it comes to attitude towards price, producers tend to somewhat disagree with the statement
“when buying capital items, I usually purchase the lowest priced products” (Table 5). The Per-
formance segment is the most likely to disagree that they purchased the lowest priced products,
which is consistent with their focus on product performance and not on price. Interestingly, the
Convenience segment, and not the Price segment, is the least likely to disagree, i.e. more Con-
venience buyers agree with this statement than Price buyers. It is possible that the Convenience
segment trusts their local dealer to consistently provide the best prices, or this segment simply
Roucan-Kane et al. / International Food and Agribusiness Management Review / Volume 14, Issue 4, 2011
2011 International Food and Agribusiness Management Association (IFAMA). All rights reserved.
138
sees the travel and shopping requirements to work with non-local dealers as adding to the costs.
This area warrants more study.
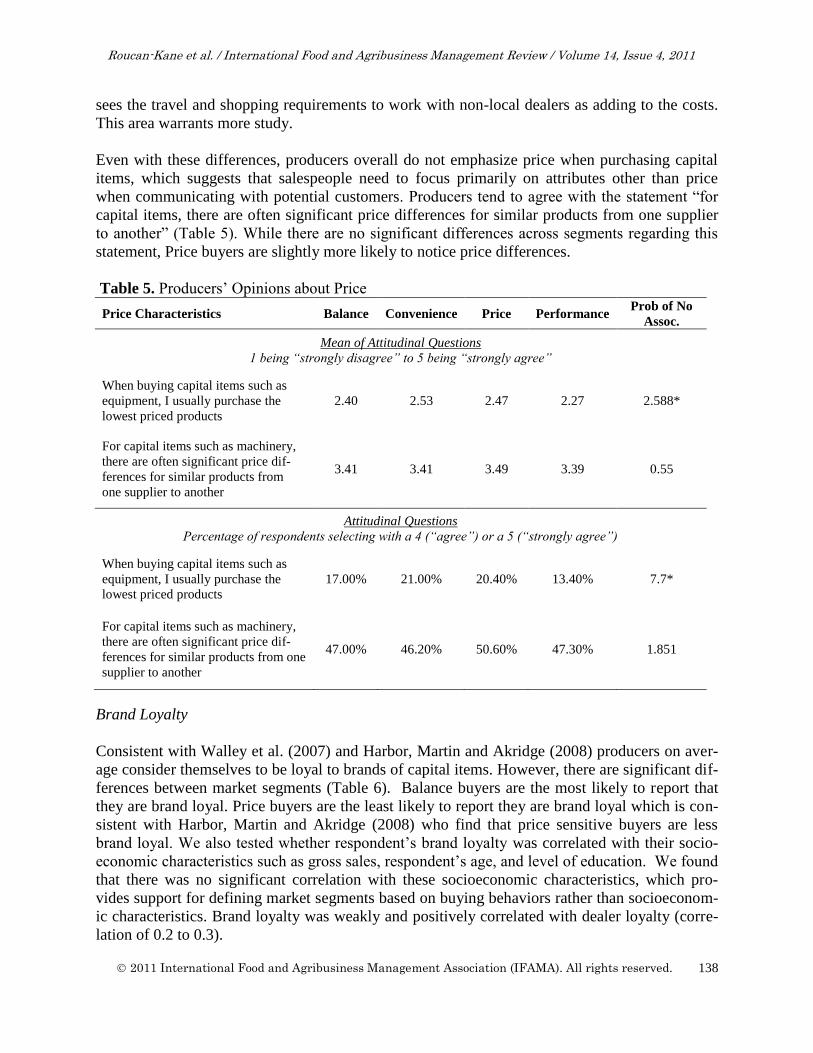
Even with these differences, producers overall do not emphasize price when purchasing capital
items, which suggests that salespeople need to focus primarily on attributes other than price
when communicating with potential customers. Producers tend to agree with the statement “for
capital items, there are often significant price differences for similar products from one supplier
to another” (Table 5). While there are no significant differences across segments regarding this
statement, Price buyers are slightly more likely to notice price differences.
Table 5. Producers’ Opinions about Price
Price Characteristics Balance Convenience Price Performance Prob of No
Assoc.
Mean of Attitudinal Questions
1 being “strongly disagree” to 5 being “strongly agree”
When buying capital items such as
equipment, I usually purchase the
lowest priced products
2.40 2.53 2.47 2.27 2.588*
For capital items such as machinery,
there are often significant price dif-
ferences for similar products from
one supplier to another
3.41 3.41 3.49 3.39 0.55
Attitudinal Questions
Percentage of respondents selecting with a 4 (“agree”) or a 5 (“strongly agree”)
When buying capital items such as
equipment, I usually purchase the
lowest priced products
17.00% 21.00% 20.40% 13.40% 7.7*
For capital items such as machinery,
there are often significant price dif-
ferences for similar products from one
supplier to another
47.00% 46.20% 50.60% 47.30% 1.851
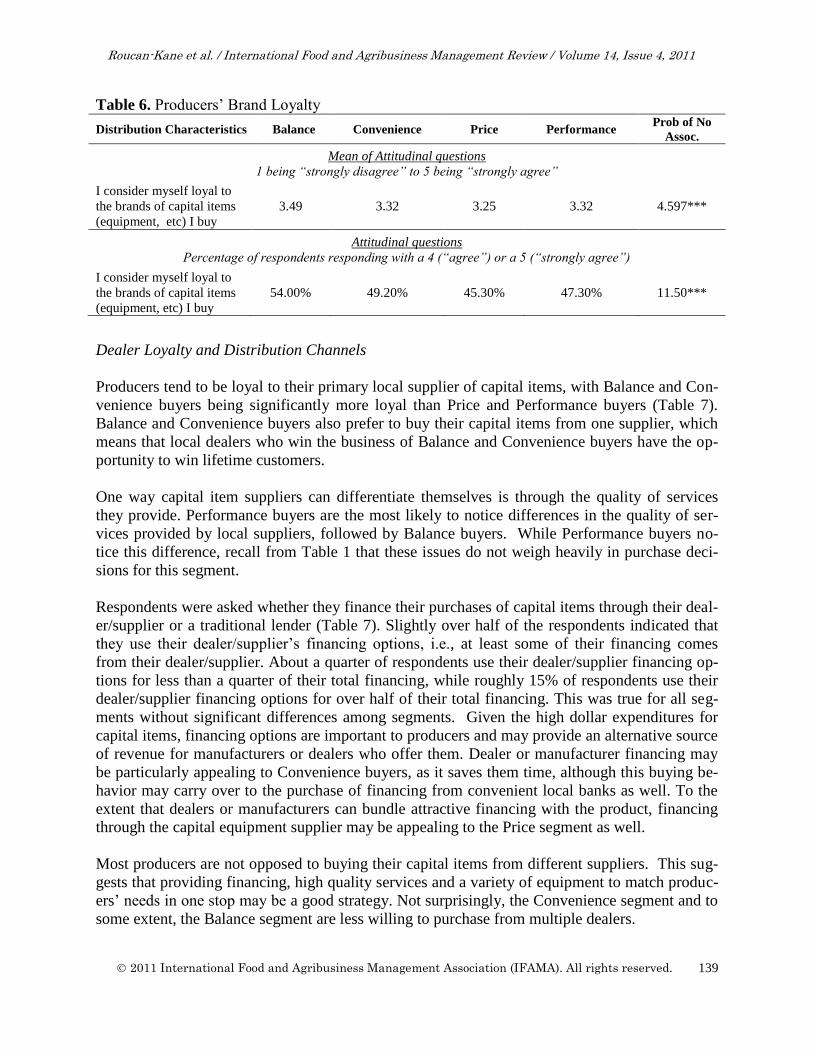
Brand Loyalty
Consistent with Walley et al. (2007) and Harbor, Martin and Akridge (2008) producers on aver-
age consider themselves to be loyal to brands of capital items. However, there are significant dif-
ferences between market segments (Table 6). Balance buyers are the most likely to report that
they are brand loyal. Price buyers are the least likely to report they are brand loyal which is con-
sistent with Harbor, Martin and Akridge (2008) who find that price sensitive buyers are less
brand loyal. We also tested whether respondent’s brand loyalty was correlated with their socio-
economic characteristics such as gross sales, respondent’s age, and level of education. We found
that there was no significant correlation with these socioeconomic characteristics, which pro-
vides support for defining market segments based on buying behaviors rather than socioeconom-
ic characteristics. Brand loyalty was weakly and positively correlated with dealer loyalty (corre-
lation of 0.2 to 0.3).
Roucan-Kane et al. / International Food and Agribusiness Management Review / Volume 14, Issue 4, 2011
2011 International Food and Agribusiness Management Association (IFAMA). All rights reserved.
139
Table 6. Producers’ Brand Loyalty
Distribution Characteristics Balance Convenience Price Performance Prob of No
Assoc.
Mean of Attitudinal questions
1 being “strongly disagree” to 5 being “strongly agree”
I consider myself loyal to
the brands of capital items
(equipment, etc) I buy
3.49 3.32 3.25 3.32 4.597***
Attitudinal questions
Percentage of respondents responding with a 4 (“agree”) or a 5 (“strongly agree”)
I consider myself loyal to
the brands of capital items
(equipment, etc) I buy
54.00% 49.20% 45.30% 47.30% 11.50***
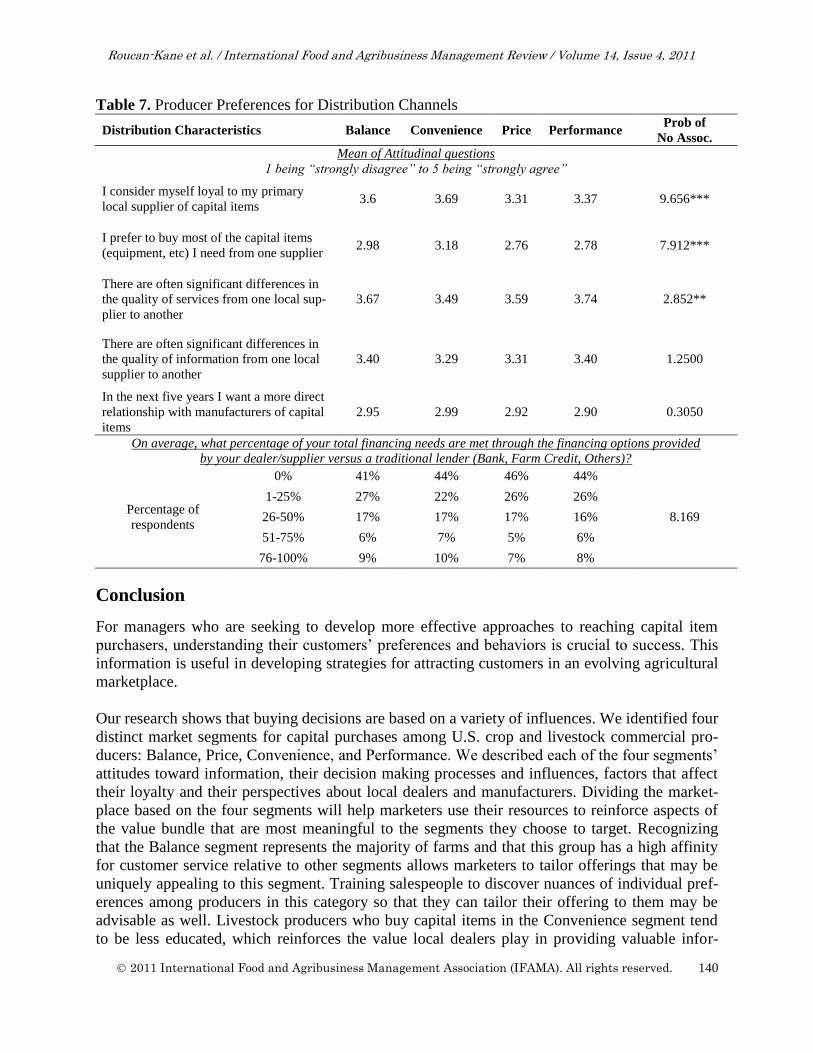
Dealer Loyalty and Distribution Channels
Producers tend to be loyal to their primary local supplier of capital items, with Balance and Con-
venience buyers being significantly more loyal than Price and Performance buyers (Table 7).
Balance and Convenience buyers also prefer to buy their capital items from one supplier, which
means that local dealers who win the business of Balance and Convenience buyers have the op-
portunity to win lifetime customers.
One way capital item suppliers can differentiate themselves is through the quality of services
they provide. Performance buyers are the most likely to notice differences in the quality of ser-
vices provided by local suppliers, followed by Balance buyers. While Performance buyers no-
tice this difference, recall from Table 1 that these issues do not weigh heavily in purchase deci-
sions for this segment.
Respondents were asked whether they finance their purchases of capital items through their deal-
er/supplier or a traditional lender (Table 7). Slightly over half of the respondents indicated that
they use their dealer/supplier’s financing options, i.e., at least some of their financing comes
from their dealer/supplier. About a quarter of respondents use their dealer/supplier financing op-
tions for less than a quarter of their total financing, while roughly 15% of respondents use their
dealer/supplier financing options for over half of their total financing. This was true for all seg-
ments without significant differences among segments. Given the high dollar expenditures for
capital items, financing options are important to producers and may provide an alternative source
of revenue for manufacturers or dealers who offer them. Dealer or manufacturer financing may
be particularly appealing to Convenience buyers, as it saves them time, although this buying be-
havior may carry over to the purchase of financing from convenient local banks as well. To the
extent that dealers or manufacturers can bundle attractive financing with the product, financing
through the capital equipment supplier may be appealing to the Price segment as well.
Most producers are not opposed to buying their capital items from different suppliers. This sug-
gests that providing financing, high quality services and a variety of equipment to match produc-
ers’ needs in one stop may be a good strategy. Not surprisingly, the Convenience segment and to
some extent, the Balance segment are less willing to purchase from multiple dealers.
Roucan-Kane et al. / International Food and Agribusiness Management Review / Volume 14, Issue 4, 2011
2011 International Food and Agribusiness Management Association (IFAMA). All rights reserved.
140
Table 7. Producer Preferences for Distribution Channels
Distribution Characteristics Balance Convenience Price Performance Prob of
No Assoc.
Mean of Attitudinal questions
1 being “strongly disagree” to 5 being “strongly agree”
I consider myself loyal to my primary
local supplier of capital items 3.6 3.69 3.31 3.37 9.656***
I prefer to buy most of the capital items
(equipment, etc) I need from one supplier 2.98 3.18 2.76 2.78 7.912***
There are often significant differences in
the quality of services from one local sup-
plier to another
3.67 3.49 3.59 3.74 2.852**
There are often significant differences in
the quality of information from one local
supplier to another
3.40 3.29 3.31 3.40 1.2500
In the next five years I want a more direct
relationship with manufacturers of capital
items
2.95 2.99 2.92 2.90 0.3050
On average, what percentage of your total financing needs are met through the financing options provided
by your dealer/supplier versus a traditional lender (Bank, Farm Credit, Others)?
Percentage of
respondents
0% 41% 44% 46% 44%
8.169
1-25% 27% 22% 26% 26%
26-50% 17% 17% 17% 16%
51-75% 6% 7% 5% 6%
76-100% 9% 10% 7% 8%
Conclusion
For managers who are seeking to develop more effective approaches to reaching capital item
purchasers, understanding their customers’ preferences and behaviors is crucial to success. This
information is useful in developing strategies for attracting customers in an evolving agricultural
marketplace.
Our research shows that buying decisions are based on a variety of influences. We identified four
distinct market segments for capital purchases among U.S. crop and livestock commercial pro-
ducers: Balance, Price, Convenience, and Performance. We described each of the four segments’
attitudes toward information, their decision making processes and influences, factors that affect
their loyalty and their perspectives about local dealers and manufacturers. Dividing the market-
place based on the four segments will help marketers use their resources to reinforce aspects of
the value bundle that are most meaningful to the segments they choose to target. Recognizing
that the Balance segment represents the majority of farms and that this group has a high affinity
for customer service relative to other segments allows marketers to tailor offerings that may be
uniquely appealing to this segment. Training salespeople to discover nuances of individual pref-
erences among producers in this category so that they can tailor their offering to them may be
advisable as well. Livestock producers who buy capital items in the Convenience segment tend
to be less educated, which reinforces the value local dealers play in providing valuable infor-

Roucan-Kane et al. / International Food and Agribusiness Management Review / Volume 14, Issue 4, 2011
2011 International Food and Agribusiness Management Association (IFAMA). All rights reserved.
141
mation to those customers. Understanding that Price and Performance segments tend to be larger,
younger and more educated allows salespeople to know where to begin their discovery of indi-
vidual producer preferences. These two groups tend to value manufacturer’s resources. Local
dealers who want to serve these segments should manage access to manufacturers or work to en-
hance the expertise of their staff who serve these demanding groups of buyers.
Capital item marketers should be aware of several behaviors of the commercial producers they
serve. Farm shows seem to be good venues for reaching Balance buyers, but websites are some-
what more useful to the Price and Performance segments. However, none of the traditional
means of providing information are valuable to any segments. Given the complexity of technolo-
gy being used in many capital items, particularly equipment, marketers must do a better job of
crafting information that will be useful to customers. At the same time, price does not weigh
heavily in purchase decisions for any segments. Perhaps marketers should consider whether at-
tractive pricing or useful information provides better marketing outcomes. There is some brand
loyalty, most among Balance buyers, and loyalty to local dealers is a little higher, but most pro-
ducers buy from more than one dealer. This represents an opportunity for marketers to focus on
customer retention by providing differentiated services and information that discourage buyers
from shopping for undifferentiated products elsewhere and researchers to consider which dealer
activities are most likely to lead to loyalty. Buyers in all segments see differences between deal-
ers in terms of service quality, which reinforces the opportunity for differentiation where service
is a strength.
There are several questions raised in this study that warrant further inquiry as to the motivations
for segment membership. It could be that Balance buyers, the oldest segment, have simply
learned from experience to include several factors in their selection process; or it could be that
having less education as the Convenience buyers do, leads to placing more trust in working with
suppliers who are easily accessible. Demographic differences are often easily measurable and
understanding the relationships between demographic variables and behavior could provide
clearer direction to field sales and service professionals. Similarly, understanding the reasons
that larger buyers tend to be Price buyers could help equipment sellers better position their of-
fers. Whether larger buyers weigh price higher because they believe they will receive preferen-
tial service or because they possess service capabilities in their own operations is an interesting
question for future research to address. Although not directly measured in this study, the broader
impact of trust and commitment within relationships between equipment dealers and their large
farm customers could explain some of the attitudes toward loyalty and relationship warrants at-
tention as well.
Future research should focus on how to implement a targeted marketing plan when there is one
dominant segment and three other distinct segments. How should a capital items firm tailor their
marketing to these segments? Can a single marketing plan targeted at the Balance segment also
serve the other segments that are more focused on a single attribute such as price or service?
Should there be separate marketing plans for each or can some of these segments be combined?
Perhaps most importantly, researchers should work to uncover the information content and mode
of delivery that is most meaningful to buyers. Given how much money manufacturers and dealer
invest in advertising, farm shows, and websites the general lack of usefulness of this information
across all segments is disturbing. Less disturbing is the value placed on information that comes

Roucan-Kane et al. / International Food and Agribusiness Management Review / Volume 14, Issue 4, 2011
2011 International Food and Agribusiness Management Association (IFAMA). All rights reserved.
142
from dealer and manufacturer staff, but if willingness to shop at a variety of locations continues
to grow, even those resources must continue to be challenged to improve their skills and
knowledge.
From an academic perspective, one hole in the market segmentation literature is understanding
the causal factors that motivate farmers to choose a particular buying behavior. The economics
literature offers several theoretical foundations such as search cost, opportunity cost, and risk
aversion that could offer additional insight into how a particular farmer’s buying behavior
evolves.4 In future iterations of the Large Commercial Producer project, we intend to develop
questions about farmer motivations for their buying behaviors.
References
Alexander, C., M. Boehlje, S. Downey, A. Gray, M. Gunderson, and M. Roucan-Kane, “Serving
Producers in Volatile Times; Themes from the 2008 Large Commercial Producer
Survey.” Dept. of Agricultural Economics, Purdue University, March 2009.
Alexander, C., C. Wilson, and D. Foley. 2005. “Agricultural Input Market Segments: Who Is
Buying?” Journal of Agribusiness, 23(2): 113-132.
Assael, H. 1995. Consumer Behavior and Marketing Action, 5th
edition. Cincinnati, Ohio:
South-Western College Publishing.
Boehlje, M. and M. Roucan-Kane. 2009. ”Strategic Decision Making under Uncertainty:
Innovation and New Product Introduction during Volatile Times.” International Food
and Agribusiness Management Review 12 (4): 199-219.
Dibb, S. and L. Simkin. 1994. “Implementation Problems in Industrial Market Segmentation.”
Industrial Marketing Management 23: 55-63.
Downey, D.W., M. Holschuh, and M.A. Jackson. 1999. AgriSelling: Principles and Practice,
Third Edition. St. Louis, Missouri: Doane Agricultural Services Company. pp 90-96.
Freytag, P.V. and A.H. Clarke. 2001. “Business to Business Market Segmentation.” Industrial
Marketing Management 30: 473-486.
Gloy, B.A. and J.T. Akridge. 1999. “Segmenting the commercial producer marketplace for agri-
cultural inputs.” International Food and Agribusiness Management Review 2(2):145-163.
Gupta, S., and P.K. Chintangunta. 1994.“On using demographic variables to determine segment
membership in logit mixture models.” Journal of Marketing Research 31:128-36.
Harbor, A., M. A. Martin, and J. T. Akridge. 2008. “Assessing Input Brand Loyalty among U.S.
Agricultural Producers.” International Food and Agribusiness Management Review, 11
(1): 17-33.
4 We are indebted to a reviewer for this suggestion.
Roucan-Kane et al. / International Food and Agribusiness Management Review / Volume 14, Issue 4, 2011
2011 International Food and Agribusiness Management Association (IFAMA). All rights reserved.
143
Kohls, R.L. 1956. “Farmers’ Selection of Farm Machinery Dealers.” The Journal of Marketing
21: 446-450.
Kohls, R.L. 1959. “The Farm Today.” The Journal of Marketing 24 (2): 59-62.
Kool, M., M. T.G. Muelenberg, and D. Broens. 1997. “Extensiveness of Farmers’ Buying Pro-
cesses”. Agribusiness 13(3): 301-318.
Kotler, P. and K.L. Keller. 2011. Marketing Management, 14th
edition. Upper Saddle River,
New Jersey: Prentice Hall.
Mudambi, S. 2002. “Branding importance in business-to-business markets: Three buyer clus-
ters.” Industrial Marketing Management 31: 525-533.
Plank, R.E. 1985. “A Critical Review of Industrial Market Segmentation.” Industrial Marketing
Management 14: 79-91.
Rosenburg, A., and C.G. Turvey. 1991. “Identifying management profiles of Ontario swine pro-
ducers through cluster analysis.” Review of Agricultural Economics 13:201-213.
Roucan-Kane, M., C. Alexander, M.D. Boehlje, S.W. Downey, and A.W. Gray. 2010. “Agricul-
tural Financial Market Segments.” Agricultural Finance Review 70(2): 231-244.
U.S. Department of Agriculture, Economics Research Service, Resource Economics Division.
1998. Agricultural Income and Finance Situation and Outlook.AIS-69. USDA, Wash-
ington, DC.
U.S. Department of Agriculture, National Agricultural Statistics Service. 2009. 2007Census of
Agriculture. http://www.agcensus.usda.gov/Publications/2007/Full_Report/usv1.pdf
U.S. Department of Agriculture, National Agricultural Statistics Service. 2008. Quick Stats,
USDA, Washington, D.C. http://www.nass.usda.gov/#top.
Walley, K., P. Custance, S. Taylor, A. Lindgreen, and M. Hingley. 2007. “The importance of
brand in the industrial purchase decision: a case study of the UK tractor market.” Journal
of Business & Industrial Marketing 22(6):383-393.
Wind, Y. and R. Cardozo. 1974. “Industrial Market Segmentation.” Industrial Marketing Man-
agement 3:153-166.
Roucan-Kane et al. / International Food and Agribusiness Management Review / Volume 14, Issue 4, 2011
2011 International Food and Agribusiness Management Association (IFAMA). All rights reserved.
144


