Embed Size (px)
Citation preview

International Evidence on Financial Derivatives Usage
Söhnke M. Bartram*, Gregory W. Brown†, and Frank R. Fehle‡
Abstract This paper presents international evidence on the use of financial derivatives for a sample of 7,319 nonfinancial firms from 50 countries including the United States. Across all coun-tries, 60% of the firms use derivatives in general, while 45% use currency derivatives, 33% use interest rate derivatives, and only 10% use commodity price derivatives. Firm-specific factors associated with derivatives use are very similar across different countries. The size of the derivatives market in local currency and the level of risk in a firm’s home country are the most important country-specific factors determining derivatives usage. The results provide mixed statistical support for popular theories of derivative use. However, a naive hypothesis that firms simply hedge once reaching a certain level of financial sophistication is most consistent with the findings. Finally, we examine whether derivatives use is associ-ated with higher firm value. We find positive valuation effects primarily for firms using interest rate derivatives.
November, 2004 Keywords: Derivatives, corporate finance, risk management, hedging, international finance JEL Classification: G3, F4, F3
* Lancaster University, Management School, Lancaster LA1 4YX, United Kingdom, Phone: +44 (1524) 592 083, Fax: +1 (425) 952 10 70, Email: <[email protected]>, Internet: <http://www.lancs.ac.uk/staff/ bartras1/> † Corresponding author. Kenan-Flagler Business School, University of North Carolina at Chapel Hill, CB 3490 McColl Building, Chapel Hill, NC 27599-3490, USA, Phone: +1 (919) 962-9250, Fax: +1 (919) 962-2068, Email: <[email protected]>, Internet: <http://intranet.kenan-flagler.unc.edu/faculty/browngr/>. ‡ Barclays Global Investors and Moore School of Business, University of South Carolina, Columbia, SC 29208, USA, Phone: +1 (803) 777-6980, Fax: +1 (803) 777-6876, Email: <[email protected]>, Internet: <http://dmsweb.badm.sc.edu/fehle/>. The views and opinions expressed in this paper are the authors' and do not represent the views and opinions of Barclays Global Investors. The authors gratefully acknowledge research funding by the Richard H. Jenrette Business Education Fund, Maas-tricht Research School of Economics of Technology and Organizations (METEOR), Lancaster University, and Lan-caster University Management School as well as support by Mike Pacey, Global Reports, Standard & Poor’s Global Rating Service and Thomson Financial in establishing the dataset. We are indebted to an anonymous referee, Yior-gos Allayannis, Allesandro Beber, Philip Brown, John Graham, Wayne Guay, David Haushalter, Ugur Lel, Berna-dette Minton, Alexander Triantis and seminar participants at the 2003 Meetings of the European Finance Associa-tion, the 2004 Meetings of the American Finance Association, the 2004 CEPR Summer Symposium in Financial Markets, Duke University, Erasmus University Rotterdam, Goethe University Frankfurt, ISCTE, Katholieke Univer-siteit Leuven, Lancaster University, London School of Economics, Tilburg University, University of North Carolina, University of Porto, University of South Carolina, University of Texas at Austin, Warwick Business School and Washington University for helpful comments and suggestions. We also thank Kevin Aretz, Nishad Kapadia, Joao Pereira, Yaw-Heui Wang, and Idlan Zakaria for providing excellent research assistance.
International Evidence on Financial Derivatives Usage
Abstract This paper presents international evidence on the use of financial derivatives for a sample of 7,319 nonfinancial firms from 50 countries including the United States. Across all coun-tries, 60% of the firms use derivatives in general, while 45% use currency derivatives, 33% use interest rate derivatives, and only 10% use commodity price derivatives. Firm-specific factors associated with derivatives use are very similar across different countries. The size of the derivatives market in local currency and the level of risk in a firm’s home country are the most important country-specific factors determining derivatives usage. The results provide mixed statistical support for popular theories of derivative use. However, a naive hypothesis that firms simply hedge once reaching a certain level of financial sophistication is most consistent with the findings. Finally, we examine whether derivatives use is associ-ated with higher firm value. We find positive valuation effects primarily for firms using interest rate derivatives.
1
1 Introduction The use of financial derivatives contracts by nonfinancial corporations has grown rapidly over the
last two decades, yet to date there is little consensus regarding both how and why firms use de-
rivatives. Especially lacking are comprehensive data on the use of derivatives by nonfinancial
firms outside of the United States even though these firms represent the majority of users.1 This
paper takes a step toward filling the gap by examining the use of financial derivatives by 7,319
companies in 50 countries including the United States – by far the largest and broadest sample of
firms studied to date.
This research has four main objectives. First, we seek to document the usage of foreign ex-
change (FX), interest rate (IR), and commodity price (CP) derivatives and compare characteris-
tics of users across countries and firms. Our results show that in many countries outside the
United States firms commonly use derivatives. Across all countries, more than half of the sample
firms (60.3%) use some type of derivative. More precisely, 45.2% of the firms use FX deriva-
tives, 33.1% use interest rate derivatives, and 10.0% use commodity price derivatives. For the
2,231 U.S. firms in the sample, the rates are similar: 64.9% of firms use some type of derivatives
with 37.7% using FX derivatives, 40.4% using interest rate derivatives and 16.3% using com-
modity price derivatives. We find that the type of derivatives used varies across the different
classes of financial risk. For example, 37.4% of firms use forwards (and/or futures) to hedge FX
risk, and 11.2% use swaps. Usage rates are reversed for interest rate derivatives where swaps are
the most popular risk management instrument (used by 29.0% of firms) and forwards are used by
only 1.1% of firms. The use of derivatives with non-linear payoffs varies less across types of risk:
9.7% of firms use FX options and 7.4% of firms use some type of non-linear interest rate deriva-
tive (e.g., option, cap, floor, and/or swaption). In contrast to FX and IR derivatives, commodity
price hedgers do not appear to have a preferred type of contract with forwards, futures, swaps and
options all used in roughly the same proportion.
Our second objective is to use a large and diverse sample of international firms to increase
the power of tests which examine the motivations for derivatives use. Since prior research and
anecdotal evidence suggest that nonfinancial corporations use derivatives primarily for hedging
1 Sections 2 and 3.2 provide summary statistics on derivatives users.
2
purposes,2 the extant empirical research (mostly using samples of U.S. firms) has sought to test
economic rationales of financial risk management. For example, financial theory suggests that
corporate risk management is apt to increase firm value in the presence of capital market imper-
fections such as bankruptcy costs, a convex tax schedule (Smith and Stulz, 1985), or underin-
vestment problems (Bessembinder, 1991; Froot, Scharfstein, and Stein, 1993). While recent em-
pirical studies provide some evidence in support of these theories,3 some findings suggest that
risk management may arise from principal-agent conflicts between managers and shareholders or
additional factors not well motivated by existing risk management theory such as earning man-
agement and speculation (Tufano, 1996; Brown, 2001; Core, Guay and Kothari, 2002).
We find that derivatives use appears consistent with some of the predictions generated by
theories of shareholder value maximization. At a fundamental level, we find strong evidence that
the use of derivatives is, in fact, hedging rather than simply speculation. Specifically, firms that
use FX derivatives have higher proportions of foreign assets, sales, and income, and firms that
use interest rate derivatives have higher leverage. In line with the financial distress hypothesis,
tests indicate that derivatives users have significantly higher leverage as well as lower liquidity
(as measured by quick and current ratios). However, we also find evidence clearly counter to the
most widely-cited theories. For example, large profitable firms with fewer growth opportunities
(low market-to-book ratios) tend to hedge more. In fact, our results suggest that common theo-
retical predictions for which firms should use derivatives actually provide very little explanatory
power. Instead, derivatives usage appears most consistent with a naive hypothesis that financially
mature or sophisticated corporations use derivatives irrespective of other firm characteristics.
Our third objective is to examine the use of derivatives at the country level and establish
what country-specific factors, if any, are important determinants. Overall, these factors are usu-
ally less important than firm-specific factors. One factor consistently relevant is the size of the
local-currency derivatives market (as measured by daily turnover of over-the-counter FX and IR
derivatives among financial institutions). This suggests that supply-side constraints are an impor-
tant determinant of derivatives use. These results are particularly relevant given recent policy
2 See Guay (1999), Allayannis and Ofek (2001), and Hentschel and Kothari (2001). 3 See Nance, Smith and Smithson, 1993; Mian, 1996; Géczy, Minton, and Schrand, 1997; Allayannis and Ofek, 2001, among others.
3
debates surrounding financial risk. We also find that the levels of financial and economic risks in
a country are positively related to hedging, but that political risk reduces the use of derivatives.
Our fourth objective is to determine whether derivatives use is associated with higher firm
value. A limited amount of recent research has started to examine this important issue. Our com-
prehensive sample allows for more powerful tests regarding the relation between risk manage-
ment and firm value. Consistent with the conclusions of Graham and Rogers (2002) and Allayan-
nis and Weston (2001) we find some evidence that derivatives use is likely to be associated with
higher firm value. However, the results for U.S. firms using FX derivatives, which are analogous
to those in Allayannis and Weston, are fairly weak in our (later) sample period and are not pre-
sent in the broad sample of international firms. In contrast, we do find strong results indicating
that interest rate risk management is associated with higher firm value for both U.S. and interna-
tional firms. Taken together, our results suggest that increases in firm value are closely related to
leverage and interest rate risk management.
The remainder of the paper is organized as follows: General motivation as well as a sum-
mary of the evidence from related studies is presented in Section 2. Section 3 describes the data.
Empirical results from firm-specific tests are presented in Section 4, while Section 5 examines
country-specific factors. The effect of derivative use on firm value is examined in Section 6. Sec-
tion 7 discusses some alternative specifications and robustness checks. Finally, Section 8 con-
cludes.
2 Motivation and Related Literature Studying the global use of derivatives is important. While a few commodity-based (e.g., agricul-
tural) industries have a long history of hedging with exchange-traded derivatives, the use of de-
rivatives has grown remarkably since the introduction of foreign exchange and interest rate prod-
ucts in the 1970s. For example, Panel A of Table 1 reports data from the Bank for International
Settlements (BIS) triennial surveys showing that the FX derivatives market continued to grow
rapidly in the 1990s. Specifically, daily turnover of FX forwards and swaps grew from an average
of 187 billion U.S. dollars (USD) in 1989 to a peak of 1,206 billion USD in 1998.4 While compa-
nies in the U.S. are an important part of the global derivatives market, they account for a minority
4 The introduction of the Euro in 1999, and thus the elimination of intra-eurocurrency trading, is the primary reason for the decline from 1998 to 2001.
4
of derivatives turnover. Panel B of Table 1 shows that U.S. firms are responsible for only about
13.7% of total foreign exchange and 18.1% of total interest rate derivatives turnover. Examining
only nonfinancial firms reveals that the U.S. share is higher but still only about a quarter of total
turnover. While the primary users of derivatives are financial institutions such as banks, insurance
companies, and investment managers, the use of derivatives by nonfinancial firms is consider-
able. Panel C of Table 1 shows the notional value and percentage of outstanding FX and IR de-
rivatives contracts held by nonfinancial firms in 2001. Even though the percent of holdings at-
tributable to nonfinancial firms is less than a quarter of outstanding values, the magnitudes are
large. The notional value of all types of FX derivatives held by nonfinancial firms was more than
4 trillion USD in 2001. Nonfinancial firms are even bigger users of interest rate derivatives –
holding more than 7 trillion USD in notional value in 2001. Together these data show the impor-
tance of examining derivatives usage by nonfinancial firms outside the United States.
Studying nonfinancial firms is also important because their motivations and strategies for
using derivatives are the least understood. In addition, nonfinancial firms make up the majority of
large firms using derivatives. As accounting disclosure requirements changed in the early 1990s,
numerous academic studies have examined derivatives usage by nonfinancial firms. The majority
of these studies use samples of U.S. firms, primarily because of data availability (e.g., disclosure
is sufficient for their purposes and there are many companies to study). Nonetheless, the United
States might not be the best laboratory for examining derivatives usage. Since it is among the
most financially stable countries in the world, financial risk management with derivatives may be
less critical for U.S. firms. Likewise, international trade, measured as imports plus exports as a
percent of GDP, is not particularly high for the United States suggesting that FX hedging (the
most studied type of financial risk management) may be relatively less important for U.S. firms.
The general approach of existing empirical studies is to consider the neoclassical frame-
work of Modigliani and Miller (1958) where financial risk management at the firm level can cre-
ate shareholder value when capital market imperfections give rise to deadweight costs born by
shareholders. (In the next section we provide a brief review of risk management theory.) Perhaps
the biggest shortcoming of these studies is that the results, taken as a whole, are inconclusive,
since different studies find support for different rationales of derivatives usage. Early studies test
hedging motives of firms on the basis of survey data. For example, Nance, Smith and Smithson
(1993) study the use of derivatives by 159 large U.S. nonfinancial corporations based on their
5
responses to a questionnaire. They find that firms using derivatives have more growth options,
are larger, employ fewer hedging substitutes, have less coverage of fixed claims, and face more
convex tax functions. Mian (1996) studies a sample of 2,799 U.S. nonfinancial firms after the
FASB introduced new reporting requirements for derivatives. The results support the hypothesis
that hedging activities exhibit economies of scale while the evidence is weak with respect to taxes
and inconsistent with regard to hedging based on financial distress costs. Géczy, Minton, and
Schrand (1997) analyze a sample of 372 Fortune 500 nonfinancial firms in the United States.
They find that firms with greater growth options, tighter financial constraints, extensive foreign
exchange rate exposure, and economies of scale in hedging activities are more likely to use cur-
rency derivatives. Graham and Smith (1999) and Graham and Rogers (2002) investigate the tax
incentive to hedge and provide evidence that U.S. firms hedge to increase debt capacity (but
probably not in response to tax schedule convexity).
Other studies that examine specific industries or individual firms benefit from the availabil-
ity of detailed data on exposure and corporate hedging activities. Typically, these data allow for
calculating more precise measures of the extent of hedging. In a study of the North-American
gold mining industry, Tufano (1996) finds evidence for theories of managerial risk-aversion as
the use of commodity derivatives is positively (negatively) related to the stock (option) holdings
of managers. Tufano finds little evidence that managers maximize shareholder value. Brown,
Crabb, and Haushalter (2002) also examine the North-American gold mining industry and find
evidence consistent with managers changing hedge ratios as the result of speculative motives. In a
study of the U.S. oil and gas industry, Haushalter (2000) finds support for the relation between
hedging and financial distress costs in the United States. On the other hand, Brown (2001) under-
takes a clinical study of a U.S.-based manufacturer’s use of FX derivatives and finds little support
for the financial distress or other primary theories of risk management and instead proposes that
earnings management, competitive factors in the product market, or contracting efficiency gains
motivate hedging.
Other studies have examined the use of derivatives in countries besides the United States.
Most examine just one or two countries and many rely on studies similar to the Wharton survey
of U.S. firms (see Bodnar, Hayt, and Marston, 1998). To the best of our knowledge, only a few
studies have looked at derivatives usage by firms in many countries. Allayannis, Brown, and
Klapper (2003) examine the use of foreign currency debt, including FX hedging, by firms in eight
6
East Asian countries. They generally find support for value-maximizing risk management theo-
ries. A recent paper by Lel (2002) undertakes an in-depth analysis of corporate governance,
agency relationships, and hedging using data for 373 firms with American Depository Receipts
(ADRs) from 35 countries. Using the same sample of ADRs, Allayannis, Lel, and Miller (2003)
find higher firm value (as measured by Tobin’s Q) for firms that use FX derivatives when country
and company governance standards are high.
3 Data 3.1 Sources and Collection Methods
Until the last few years, data on derivatives usage by firms outside of the U.S. was disclosed on a
largely voluntary basis. A move toward common international accounting standards (and new
standards in many countries that specifically address derivatives) means that it is now practical to
study international derivatives use at the firm level.5 Our sample is constructed by matching firms
with accounting data on the Thomson Analytics database with firms that have annual reports in
English for the year 2000 or 2001 on the Global Reports database.6 Firms appear in our sample
only once, either in 2000 or 2001. This initial screen results in 9,173 companies. We exclude cor-
porations in the financial services industry leaving 7,467 firms. We drop an additional 148 com-
panies for assorted reasons, such as an unreadable annual report, resulting in a final sample size
of 7,319 companies in 50 countries. The 50 countries in our sample represent 99.3% of global
market capitalization in 2000 and 2001. The firms in our sample represent 62.5% of overall
global market capitalization and 82.2% of global market capitalization of nonfinancial firms.7
We search annual reports for information about derivatives use. Firms are classified as de-
rivatives users if their annual report specifically mentions the use of derivatives. To search the
reports we undertook a combination of electronic and manual searches. Initially, a list of search
5 For example, the following are recent standards (and effective dates) adopted by so-called G4+1 countries and the International Accounting Standards Board (IASB) as part of the movement toward common reporting standards: United States, FAS 133 (effective June 15, 1999); United Kingdom, FRS 13 (effective March 23, 1999); Australia, AAS 33 (effective January 1, 2000); Canada, AcSB Handbook Section 3860 (Financial Instruments - Disclosure and Presentation, effective January 1, 1996); New Zealand, FRS-31 (effective December 31, 1993); IASB, IAS 32 (March 1995, modified March 1998 to reflect issuance of IAS 39 effective January 1, 2001). 6 Global reports (www.global-reports.com) is an online information provider of public company documents in full-color, portable document format (PDF). While our sample represents a broad selection of international companies, casual inspection indicates that there is a bias toward larger companies. 7 Since our data span two years, these values are calculated by computing each firm’s percent of global market capi-talization for the year it appears and summing across all firms in our sample.
7
terms is established by manually analyzing a subsample of about 200 annual reports across all
countries to identify expressions that indicate the use of particular types of derivatives. Deriva-
tives users are classified by the underlying asset (i.e., foreign exchange, interest rates, or com-
modity price) as well as by type of derivative (i.e., forward, future, swap, and option). Next, we
implement an automated search (using a concordancer) for 37,537 expressions formed as combi-
nations of the expressions found in the manual search.8 From this initial dataset, 200 firms (100
derivatives users and 100 non-users) were randomly sampled to identify errors. Average reliabil-
ity across exposure categories was 94.6%. When possible we added or deleted terms to the pri-
mary search. After rerunning the improved primary search, a random sample of 200 additional
firms yielded an average reliability rate of 96.0%. Additional adjustments to the search did not
improve reliability. To further improve the reliability of the classification, we created an index
based on search hits of terms too general to be included in the concordancer search, but likely to
be related to derivatives use.9 We then manually checked and classified firms with high scores
that were initially classified as non-users, and firms with low scores initially identified as users,
since these firms have higher error rates. In total, more than 1,800 firms are checked and classi-
fied manually.
Overall, we estimate error rates in the dataset below 1.1-2.3% for the different types of us-
ers.10 Nonetheless, we can only make an estimate because in a few cases it is not clear, even after
a careful reading of the annual report, if a firm is actually using derivatives. For example, some
firms state that they “may” use derivatives or include a boilerplate statement about accounting for
the use of derivatives without specifically stating that they are, in fact, users. The advantages of
our approach are that a large dataset can be created and the classification is fairly systematic. It
comes at the cost of potentially adding noise to the process if the search result leads to a wrong
decision with regard to the classification of a firm. Given the large size of our sample and that we
appear to misclassify users about as frequently as non-users, misclassification errors should not
affect our conclusions. Since data on the corporate use of stock options and foreign currency de-
8 A full list of the search terms is available on request from the authors. 9 The terms include futures, swap or swaps, swaption*, collar*, derivat*, call option* or put option*, hedg*, cash flow hedg*, fair value hedg*, risk management, effective portion* or ineffective portion*, notional amount*, option* contract*, option* where “*” signifies any additional character(s). The index sums the number of these terms found in the annual report (regardless of the number of times) for a maximum score of 14. 10 Based on results of hand-checking cross-referenced with index scores, we estimate the following error rates: 1.5% for general derivatives, 1.1% for FX derivatives, 2.3% for IR derivatives, and 2.3% for CP derivatives.
8
nominated debt are not readily available, we also search the annual report information on these
and create two dummy variables with value one (and zero otherwise) if the annual report contains
information on stock options or foreign debt, respectively.
All accounting data from Thomson Analytics is in millions of U.S. dollars to be comparable
across countries. In many cases the data we analyze are ratios, so these are also largely compara-
ble across years.11 In order to eliminate outliers, the top and bottom one percent of the observa-
tions are dropped from the dataset for the accounting variables. We also apply “logical limits” to
a few of our proxies to retain the economic intuition. For example, we require the profit margin to
be greater than -100%. Not all variables are available for all firms so we examine some variables
in a separate robustness section.12
To control for systematic (e.g., reporting) differences across countries and for industry ef-
fects, we adjust variables constructed from the accounting data. We estimate regressions with
each of the accounting measures as the dependent variables and, as the independent variables,
dummy variables for country, industry (our sample includes firms in 44 of the 48 Fama-French
industries), and fiscal year. We use the residuals from these regressions as our explanatory vari-
ables.13 In order to reduce the chance of our result being influenced by economic cycles, we use
three-year averages of variables where this impact seems most relevant (e.g. profit margin).
3.2 International Derivatives Usage Rates
Table 2 reports the percentage of firms using derivatives of different types for major countries, as
well as by geographic region and major industry grouping. Across the whole sample of 7,319
nonfinancial firms, more than half (60.3%) use some kind of derivative. Most common is the use
of foreign exchange rate derivatives (45.2%), followed closely by interest rate derivatives
(33.1%), with commodity price derivatives a distant third (10.0%). While we only report results
for a few individual countries, there is substantial variation in derivatives use across countries. To
11 However, we have undertaken robustness checks for all the analyses to make sure that our results are not driven by which year we examine. 12 An Addendum is available that provides details on each of the explanatory variables, mean values by country for variables used in the primary analysis (and robustness checks), and a correlation table for the most used variables. It also includes some supplemental results from selected statistical tests. 13 We do this type of adjustment because it is sometimes not possible to include many industry dummies when we examine countries separately. Alternatives such as median adjusting by country and using industry dummy variables (when possible) lead to very similar results.
9
illustrate, if we consider countries with at least 30 observations, only 16.7% of Chinese firms in
the sample use derivatives, while 95.5% of firms in New Zealand report derivatives use. In con-
trast, usage rates across major geographic regions are not very different, ranging from a low of
51.2% for firms in the Asia-Pacific region to 78.0% for firms in Africa and the Middle East. Us-
age rates in the U.S. and Canada (63.8%) and Europe (61.4%), which comprise the majority of
our sample, are very similar. In contrast, usage rates are significantly higher for firms located in
more developed (OECD) countries, 64.3%, versus 39.6% in non-OECD countries. Interestingly,
the usage rate for U.S. firms is somewhat higher than for all non-U.S. firms, but this is almost
entirely due to differences with non-OECD countries. Examining derivatives use by major indus-
try reveals that usage rates (excluding financial firms) are highest in the utility and chemicals
industries and lowest in the consumer goods and miscellaneous (mostly service) industries.14
While these general derivatives usage rates are interesting, they mask differences when de-
rivatives are categorized by type of underlying risk. For example, Japanese firms are among the
most common users of foreign exchange and interest rate derivatives, whereas they are slightly
less likely than the typical firm to use commodity derivatives. Derivatives use among non-OECD
countries is lower for all types of risk, but disparities are extreme for interest rate and commodity
price derivatives where the rates differ by nearly a factor of four. Examining derivatives usage by
type of financial risk and industry also reveals distinct patterns. As one would expect, the use of
commodity price derivatives is concentrated in a few industries such as utilities, oil, mining, steel,
and chemicals. However, the use of interest rate derivatives also varies substantially across indus-
tries with utilities having the highest usage rates (61.7%) and mining the lowest (20.3%). FX de-
rivatives usage is somewhat more uniform with rates in all industries between 36% and 69%.
Table 2 also breaks down derivatives usage by type of instrument.15 Specifically, we con-
sider forwards (including futures), swaps, and options separately. For interest rate derivatives,
14 These industries correspond to the 17 industry classification of Kenneth French available at: http://mba.tuck.dartmouth.edu/pages/faculty/ken.french/data_library.html. In our sample, about two-thirds of the firms in the miscellaneous category are in three sub-industries (by 2 digit SIC code): various business services (73), communication services (48), professional services (87). 15 Note that while we obtain high reliability on overall derivatives usage and derivatives usage by risk category, it is sometimes not possible to identify the use of individual instruments, thus the statistics by instrument type slightly understate actual usage rates.
10
options include swaptions, caps, collars, and floors.16 For currency risk, forwards (used by 37.4%
of firms) are the most commonly used instrument, while swaps (11.2%) and options (9.8%) are
much less common. For managing interest rate risk, swaps are the most common instrument
(29.0%), followed by options (7.4%). Only 1.1% of firms use interest rate forwards or futures. In
contrast to these results, firms use different types of commodity price derivatives at roughly the
same rate: 5.3% use forwards and futures, 3.0% use swaps, and 2.4% use options. These patterns
are surprisingly robust across geographic region and OECD membership. The same is true across
industries for foreign exchange and interest rate derivatives, but for commodity price derivatives
there are apparent differences. For example, forwards are the most common instrument in the
mining industry, whereas swaps are most common in the oil and utilities industries.17 Overall, the
general pattern of usage is consistent with that found in prior studies of U.S. firms.18
4 Firm-Specific Determinants of Corporate Derivatives Usage One of the primary objectives of this paper is to investigate the rationales for corporate hedging
on an international scale. As noted previously, hypotheses tested in prior research are derived
mostly from existing theories describing the incentives for derivatives use based on such factors
as bankruptcy (financial distress) costs, taxes, the underinvestment problem, and managerial in-
centives. Below in Section 4.1, we only briefly describe the most widely cited theories and pre-
dictions since many existing papers provide excellent detailed discussions.19 To facilitate com-
parison, we follow the existing literature wherever possible.
4.1 Theory and Hypotheses
4.1.1 Financial Distress Costs and Taxes
Cash flow volatility can lead to situations where a firm’s available liquidity is insufficient to fully
meet fixed payment obligations, such as wages and interest payments, on time. Financial risk
management can reduce the probability of encountering such states of nature and thus lower the
16 For completeness, we allow for foreign exchange and commodity price swaptions, caps, collars and floors but these never yield usage rates greater than 0.2%. 17 Since it is not a primary focus of this paper, we leave an analysis of the choice of instrument(s) to future research. 18 For example, Géczy, Minton, and Schrand (1997) report usage by 59.1% (for any derivative) and 41.4% (for cur-rency derivatives) for their sample of 372 Fortune 500 firms. 19 See, among others, Géczy, Minton, and Schrand, 1997; Bartram, 2000; and Graham and Rogers, 2002, and Stulz, 2002

11
expected value of costs associated with financial distress (Smith and Stulz, 1985; Shapiro and
Titman, 1986; Stulz, 1996). Likewise, lowering the chance of financial distress can increase the
optimal debt-equity ratio and therefore the associated tax shield of debt (Myers, 1984, 1993;
Leland, 1998). In addition, if firms face a convex tax schedule reducing the volatility of taxable
income will reduce the expected value of tax liabilities (Smith and Stulz, 1985).
These theories predict that firms with higher leverage, shorter debt maturity, lower interest
coverage, and less liquidity (e.g., lower quick ratio) are more likely to use derivatives to hedge
financial risk. Similarly, firms with higher dividend yield are less likely to be financially con-
strained since these firms are more likely to have stable cash flows and lower financial con-
straints. Firms with higher profitability and firms with a larger fraction of tangible assets are ex-
pected to have lower financial distress costs and are thus less likely to hedge with derivatives.
Since bankruptcy costs are less than proportional to firm size (Warner, 1977), smaller firms
should be more likely to hedge. Tax motivations for risk management have been tested empiri-
cally by employing the tax rate and income tax credits as explanatory variables (Graham and
Smith, 1999; Graham and Rogers, 2002).
4.1.2 Underinvestment
Risk management can also increase shareholder value by harmonizing financing and investment
policies (Froot, Scharfstein, and Stein, 1993). When raising external capital is costly (e.g., be-
cause of transaction costs), firms may underinvest. Derivatives can be used to increase share-
holder value by coordinating the need for and availability of internal funds. Conflicts of interest
between shareholders and debtholders can also lead to underinvestment. An underinvestment
problem can occur when leverage is high and shareholders only have a small residual claim on a
firm’s assets, thus the benefits of safe but profitable investment projects accrue primarily to
bondholders and may be rejected by managers (Myers, 1977; Bessembinder, 1991). A credible
risk management plan can mitigate underinvestment costs by reducing the volatility of firm value.
As the underinvestment problem is likely to be more severe for firms with significant growth and
investment opportunities, various measures such as the market-to-book ratio, research and devel-
opment (R&D) expenses to sales ratio, capital expenditure to sales, net assets from acquisitions to
size are used for testing the underinvestment hypothesis. Other researchers (Géczy, Minton, and
Schrand, 1997) suggest that underinvestment is likely to be most severe for highly levered firms
12
with significant growth opportunities and thus interact the market-to-book ratio (among others)
with leverage to quantify this effect.
4.1.3 Management Incentives
Many theoretical models (e.g., Merton, 1973) show that equity value is an increasing function of
asset volatility, thus managers acting on behalf of the stockholders may have an incentive not to
hedge. However, most senior managers have a highly undiversified financial position because
they derive substantial (monetary and non-monetary) wealth from their employment by the firm.
Consequently, risk-aversion may cause managers to deviate from acting purely in the best interest
of shareholders by expending resources to hedge diversifiable risk.20 Thus, firms that are closely
held will be more likely to use derivatives. Corporate risk management can mitigate these con-
flicts of interest if compensation schemes appropriately link managers’ pay to the stock price of
the firm.21 This suggests that the use of stock option plans in a corporation can be a determinant
of corporate hedging. Executive stock options can effectively reduce a manager’s risk aversion
and lower the propensity for using derivatives to decrease idiosyncratic risk. Firms with multiple
classes of shares often have a controlling group with superior voting rights. If management or ill-
diversified shareholders are represented in the controlling group, managerial or shareholder risk
aversion is more likely to affect corporate actions. Accordingly, the existence of multiple share
classes is expected to be positively related to the use of derivatives.
4.1.4 Financial Sophistication Hypothesis
Anecdotal evidence suggests that financial risk management has evolved to the point where
nearly all financially sophisticated firms use derivatives. For example, popular press articles sug-
gest that analysts and credit ratings agencies expect firms to manage financial risks (see Brown,
2001), so typically more established firms covered by these types of institutions have external
pressures to use derivatives for reasons not well described by theory. If this is the case, empirical
examination should distinguish between firms using derivatives primarily because of the theoreti-
cal motivations already described and firms using derivatives simply because of an ability to do
so, regardless of other firm characteristics. Consequently, we make predictions for many of the
variables based on how we believe they describe the “financial sophistication” of firms. Specifi-
20 See Stulz (1984), Stulz (1990), and Mayers and Smith (1982). 21 See Han (1996), Campbell and Kracaw (1987) and Smith and Stulz (1985).
13
cally, we predict that firms with large size, stock options, multiple share classes, more leverage,
higher profits, low growth opportunities, foreign business ventures and financing, a low quick
ratio, and high dividend payouts, are what one might reasonably (but somewhat ambiguously)
consider companies with a mature treasury operation. In addition, we believe that firms in multi-
ple industry segments and with foreign equity listings are more likely to be financially sophisti-
cated. In some sense, this represents a “straw-man” theory that other theories should be able to
directly challenge. Of course, none of these explanations are mutually exclusive and each may
explain some part of derivative usage. In this case, it becomes useful to examine the relative im-
portance of the various explanations. Table 3 summarizes predictions and provides definitions for
most of the firm-specific independent variables we examine.
4.2 Univariate Analysis
Table 4 reports the country and industry adjusted (where appropriate) means and standard devia-
tions of our explanatory variables and control variables for hedgers and non-hedgers (i.e., deriva-
tives users and non-users). Also reported are results from nonparametric Wilcoxon tests for dif-
ferences in samples. We examine results separately for general, FX, IR, and CP derivatives and
split the sample for U.S. and non-U.S. firms. We do not table these results to conserve space, but
make note of differences in the text. Since we subsequently examine the same variables in a mul-
tivariate setting, we discuss these results only briefly.
Consistent with the financial distress and tax hypotheses, general derivatives users have
higher leverage and income tax credits as well as lower quick ratios and less tangible assets.
However, other results are counter to the financial distress hypothesis. In particular, hedgers are
larger, are more profitable (higher ROA), have longer debt maturity, and have higher interest
coverage ratios. The univariate results do not generally support the underinvestment hypothesis.
Hedgers have lower market-to-book ratios and capital expenditures and tend to be less R&D in-
tensive. However, the interaction between market-to-book and leverage has the predicted differ-
ence—hedgers are more likely to be growth firms with high debt levels. Results in Table 4 also
provide little support for the managerial incentives hypothesis. In the full sample, hedgers are
more likely to have multiple share classes, but they are less closely held and more likely to use
stock options. We also find that hedgers tend to operate in a greater number of industry segments
and are more likely to have a foreign equity listing. Overall, while these results provide mixed
support for theory, they are completely consistent with the financial sophistication hypothesis.
14
It would be preferable to only include firms in our sample that are known to have financial
exposures, but it is not trivial to distinguish between firms with and without exposures of differ-
ent types. For example, a firm without any foreign sales or assets can have a significant indirect
exchange rate exposure if its primary competitors are foreign firms. As a consequence, we con-
sider all firms in our primary analysis. Nevertheless, we do attempt to categorize firms as having
“high” or “low” exposures of various types. For FX, we consider firms’ foreign assets, sales and
income. Table 4 reports values for these variables individually. We also create a “high FX expo-
sure” dummy variable that is equal to one for firms that have non-zero values of any of the three
measures. Similarly, we define dummy variables identifying (1) high interest rate exposure for
firms with leverage above the country median and (2) high commodity price exposure for firms in
the utilities, oil, mining, steel, and chemicals industries. Finally we create a “general high expo-
sure” dummy variable that is equal to one if any of the FX, IR, or CP exposure variables is equal
to 1. While these measures are not perfect, on average they should separate firms with high expo-
sure from those with low exposure. For instance, results in Table 4 show that in all cases, hedgers
are more likely to be identified as having an exposure. In the subsequent analysis we also con-
sider results based only on firms identified as having foreign assets, sales and income.22
Finally, we note that results are very similar when FX and IR derivatives users are exam-
ined separately. In addition, most of these results hold for U.S. as well as international firms and
across types of risk. Almost never is a result significant in the U.S. and significant with the oppo-
site sign for non-U.S. firms. One notable exception is that FX derivatives users in the U.S. have
higher market-to-book ratios – a finding similar to Géczy, Minton, and Schrand (1997).
4.3 Multivariate Analysis of Firm Factors by Country and Risk Type
In order to determine the simultaneous effects of different factors on the likelihood of derivatives
usage, we estimate PROBIT models. We estimate models for a variety of samples: all countries,
the six individual countries with the most observations in our sample (the United States, United
Kingdom, Japan, Germany, Canada, and Australia), and all other countries. The explanatory vari-
ables we examine here are a subset of those discussed in Section 4.2. We use two criteria for in-
22 When we limit the sample to firms with high exposure, we exclude 664 hedgers in the general derivatives classifi-cation, 1036 hedgers in the FX derivatives classification, 647 hedgers in the IR derivatives classification, and 382 hedgers in the CP derivatives classification. Thus, between 15.2% and 52.4% of hedgers are excluded from the sam-ple.
15
cluding variables in this analysis. First, we exclude variables that are close substitutes for other
variables we include. Second, we exclude some variables (e.g., R&D) that have a significant ef-
fect on the sample size. A more complete selection of variables is discussed in the robustness
section. Models are also estimated separately for FX, IR, and CP derivatives usage though results
are not reported.
Table 5 reports results for general derivatives users. For all countries (first column), suffi-
cient data are available for 6,454 firms. In general, the results are similar to those suggested by
the univariate statistics. The financial distress and tax hypotheses are supported by the positive
coefficients for leverage and the income tax credit dummy variable, as well as the negative coef-
ficient for the quick ratio. However, the positive coefficients for size and profit margin are con-
trary to predictions. The full sample also provides mixed support for the underinvestment theory.
Contrary to the prediction, the coefficient for the market-to-book ratio is negative, yet the coeffi-
cient for the interaction between market-to-book and leverage is positive.23 There also exists
mixed support for the managerial incentives hypothesis—both the presence of stock options and
multiple share classes are positively related to derivatives use. It is possible that these results
might both support the managerial incentives hypothesis if managers on average hold very in-the-
money options and are thus using derivatives to preserve the value of their equity-like positions.
We include several variables in the analysis as controls. For example, we would like to
condition our analysis on the unobserved levels of exposure. For IR exposure, leverage is our
proxy (and is already included in the analysis). To identify firms more likely to use derivatives
because of significant FX exposure, we include our FX exposure dummy variable, which is, as
predicted, positively related to derivatives use. We include a foreign debt dummy variable sepa-
rately, because it may be an FX hedging tool that is a complement to derivatives, a source of ex-
posure (e.g., for firms in developing countries), or an FX hedging tool that substitutes for deriva-
tives (e.g., for U.S. firms). The first two explanations suggest a positive relation between foreign
debt and derivatives use, and the last suggests a negative relation. Thus, the estimated positive
coefficient is consistent with foreign debt either acting as a complement to derivatives or creating
an FX exposure on average. The foreign listing dummy identifies firms with an ADR. Firms with
ADRs are significantly more likely to hedge. Another control variable is the percent of each
23 We have also used the book-to-market ratio as an alternative to the market-to-book ratio and find qualitatively similar results.
16
country’s market capitalization included in our sample. Our concern is that we are more likely to
cover larger, and therefore more globally oriented companies, in countries where our sample in-
cludes a smaller fraction of firms. If these types of firms are more likely to use derivatives this
could create a sample bias. A negative coefficient on the “percentage market cap” variable would
signal a potential problem; however, we obtain a positive coefficient.
A primary contribution of this study is to compare derivatives use across many countries
using comparable data. The remaining columns in Table 5 show that the results discussed above
differ very little across countries. In fact, for all but one case where a variable is significant for
the full sample, the sign of the significant coefficients for individual countries is the same (the
quick ratio in Australia has a positive coefficient). Overall, these results are very interesting since
they indicate that factors determining derivatives usage are surprisingly common across different
countries. We also note the apparent increase in statistical power gained from examining firms
across many countries. Coefficients that are the same sign in most sub-samples but only statisti-
cally significant in a few countries, are statistically significant in the full sample.
Examining results by risk type (not reported) reveals that some factors are important for one
type of risk but not another. For FX derivatives, the coefficients for income tax credits, the inter-
action between market-to-book and leverage, and stock options are no longer significantly greater
than zero. The coefficient on leverage is notably smaller in almost all of the samples. In contrast,
for interest rate derivatives the coefficients for the leverage variable increase significantly in
magnitude in most samples. The coefficients for income tax credits, profit margin, and stock op-
tions are statistically zero. Also, the coefficient on the coverage ratio becomes significantly nega-
tive in several samples. A somewhat different set of factors is significant in the regression for
commodity price derivatives’ use. Results are similar to the general derivatives specification for
leverage, the dividend dummy variable, size and income tax credits. However, coverage is nega-
tively related to CP derivatives use in the U.S. and the full sample. As noted, the results in Table
5 are from estimations using all firms with sufficient data. We repeat the estimations using only
firms defined as having high exposures (i.e., high exposure dummies equal to 1). The only impor-
tant differences for general derivatives users with high exposures are that the magnitudes of the
coefficients on the quick ratio and profit margin decrease somewhat (so that neither is signifi-
cantly different from zero at the 5% level). Results for individual countries are generally robust in
so far as the signs and magnitudes of most coefficients are reasonably stable.
17
The results from the analysis in this section, especially those by class of underlying finan-
cial risk, yield another intriguing finding. Although, somewhat different factors are important for
different types of risk, the factors are surprisingly robust across countries and sub-samples of
countries. In only a very few cases does the sign of a significant coefficient for a single country
differ from the sign of a significant coefficient for the full sample. Since it is extremely unlikely
that these results would be obtained by chance, it suggests that:
(1) Similar firm-specific factors are very important in determining risk management pol-
icy across countries.
(2) Contrary to risk management theory that tends to treat all financial risks similarly,
there are somewhat different factors that determine whether or not firms hedge dif-
ferent types of risk.
(3) The findings are not supportive of any one theory entirely, except our alternative “fi-
nancial sophistication” hypothesis.
This third point may be the most important. While taken together, other studies have found
each of the relations we document, most find a subset of our results that leads them to conclude
one or more theories are best supported by the data. Because our results are so strong and consis-
tent, we feel that a logical conclusion from our analysis is that none of the primary theories we
examine are unequivocally supported by the data. This seems especially true for the financial
distress and underinvestment hypotheses. Since our proxies relating to the managerial incentives
hypothesis are fairly crude, there may be important factors we fail to capture. Similarly, it may be
that other motivations (such as earnings smoothing or industry competitition) that are difficult to
examine empirically provide a better explanation of the results (see, for example, Mello, Parsons,
and Triantis, 1995).
4.4 Analysis of Sub-Samples
One advantage of our large sample is that we can use it to identify sub-samples of firms that
should be very likely (as well as very unlikely) to be motivated by particular theories of risk man-
agement. This also allows us to identify the relative importance of different motivations for risk
management in the event that multiple theories apply. Specifically, in this section we present tests
based on the application of screens to our sample firms so as to identify sub-samples most likely
(and unlikely) to be affected by expected financial distress costs, underinvestment costs, and
18
managerial incentives. For example, we limit the analysis to firms defined as having a high expo-
sure and identify firms most likely to have substantial (expected) financial distress costs by creat-
ing a sub-sample of the 250 firms with the lowest Altman Z-scores.24 We compare derivatives use
in this sub-sample to the sub-sample of 250 high exposure firms with the largest Z-scores. The
results are shown in Panel A of Table 6. Among the firms identified as having high expected fi-
nancial distress costs, 66.8% use derivatives as compared to 48.4% of firms identified as having
low expected costs. The difference in usage across the two sub-samples is statistically significant
at 0.1% level.
We also identify firms most likely to suffer from underinvestment costs by examining the
product of leverage and the market-to-book ratio. On average about 71.2% of high-cost firms use
derivatives versus 67.2% of low-cost firms—a difference that is not significant. To identify the
250 firms with the highest managerial incentives to hedge we select firms with multiple share
classes and the lowest ESOP proceeds. We compare these to the 250 firms with the highest ESOP
proceeds and without multiple share classes. In this case we also find that firms we consider to
have high managerial incentives hedge significantly more (81.2% versus 64.0%). Prior results
reveal the importance of firm size, so we repeat the analysis after partitioning the sample into
firms larger and smaller than the country median. For larger firms, a statistically significant dif-
ference remains for the financial distress result. For smaller firms, the result is reversed. Only
differences for managerial incentives are significant.
These results have some interesting implications. First, different theories of risk manage-
ment may apply to different size firms. Specifically, financial distress may be a more relevant
motivation for larger firms, whereas managerial incentives may be more important for smaller
firms. Second and more importantly, it appears that these theories (or more precisely, proxies)
can explain marginal derivatives usage for firms facing extreme conditions. However, we do not
interpret this as good news for the explanatory power of the theories since on average much more
than half of the 250 firms thought to be least likely to use derivatives still use them! In short,
these results further suggest that theories of risk management may have some marginal explana-
tory power, but other factors such as financial sophistication are probably the primary determi-
nants of derivatives usage.
24 We use the modified form from Altman (2000). We adjust the measure for country effects.

19
5 Country-Specific Determinants of Derivatives Usage Recently, influential policy makers have suggested that access to derivatives can enhance macro-
economic development. For example, in a recent speech U.S. Federal Reserve Board Chairman
Alan Greenspan25 remarked,
“The further development of derivatives markets, particularly in smaller econo-mies where idiosyncratic risk may be more difficult to hedge, will likely facilitate greater cross-border flows and a more productive distribution of global savings.”
Thus, it is important to determine what country-specific factors, if any, promote or inhibit the use
of derivatives, especially if these factors can be influenced by policy. With this goal in mind, we
propose a set of four hypotheses relating the use of derivatives to aspects of countries’ economic
and legal environments.
5.1 Theory and Hypotheses
Casual inspection of the triennial BIS survey indicates a positive relation between the economic
size (GDP) of a country and the amount of total derivatives turnover. It is less obvious whether
this relation is proportional to the size of nonfinancial businesses’ financial exposures or applies
to derivatives usage rates. Because larger economies are likely to have larger and more liquid
financial markets, we hypothesize that usage rates will be positively related to firms’ access to
derivatives, ceteris paribus. To measure derivatives market access, we construct a variable quanti-
fying the size of the local-currency derivatives market relative to the size of the economy. Spe-
cifically, we sum average daily turnover net of inter-dealer double-counting in the over-the-
counter FX and IR derivatives market excluding turnover with nonfinancial firms to avoid a me-
chanical relation. We divide by nominal gross domestic product (GDP) to standardize the meas-
ure. Derivatives market data are from the 2001 BIS Triennial Survey.26 GDP estimates are from
the World Bank. Both estimates are in U.S. dollars, and GDP is calculated using market exchange
rates. Since the FX values are very positively skewed due to a small number of countries that are
currency trading centers (e.g., the United Kingdom and Switzerland) we take the inverse rank of
this statistic and assign countries without BIS data a rank of one. We also consider alternative
25 From comments at the Banque de France International Symposium on Monetary Policy, Economic Cycle, and Financial Dynamics, Paris, France, March 7, 2003. 26 The survey covers foreign exchange and OTC derivatives turnover in April 2001, as reported by about 2,530 mar-ket participants in 48 countries. Further details on the data collection methodology and reporting are available in the full BIS report (available at http://www.bis.org/publ/rpfx02.htm) on pages 30-46.
20
measures characterizing overall economic development such as GDP per capita, and Organization
for Economic Cooperation and Development (OECD) membership.
On the other hand, economies with more developed markets tend to be more stable and
therefore firms based in these countries may have less need for risk management. Thus, our sec-
ond hypothesis predicts that measures of economic, financial, and political risk are directly re-
lated to derivatives usage, ceteris paribus. As measures of country risk we employ economic,
financial, and political risk indices (as well as the composite index) reported in the International
Country Risk (ICR) Guide for 2000.27 The index values are inverse measures of country risk since
higher scores indicate lower risk. As alternatives to these metrics we consider (1) the natural
logarithm of GDP since larger countries should be more economically diversified and therefore
provide a less risky operating environment for nonfinancial business, and (2) imports plus exports
as a percent of GDP (henceforth, trade magnitude) since, the more open an economy, the more
likely it is that firms are exposed to FX or other risks such as economic and financial contagion.
Additional hypotheses about the use of derivatives by nonfinancial firms across countries
can be derived from differences in the legal environments. We expect that these factors are less
important but examine them nonetheless, because they have been studied in prior work. Consis-
tent with LaPorta et al. (1998), we predict that in countries where the legal system is more effi-
cient and contracts can be enforced, firms should be more likely to use derivatives. We examine
several measures of legal environment. Our primary variable is the legality index constructed by
Berkowitz, Pistor, and Richard (2001), which effectively measures both the legal environment
and enforcement of contracts. Low values of the index reflect poor legal quality. As alternatives,
we also examine the La Porta et al. (1998) aggregate index of creditor rights and the rule-of-law
index created by Kaufman, Kray, and Zoido-Lobaton (1999).
Our fourth, and final, hypothesis centers on the agency relationship between shareholders
and managers. Lel (2004) hypothesizes (and finds evidence suggesting) that the existence of im-
portant internal and external corporate governance factors are positively related to hedging with
derivatives. In countries that afford shareholders significant rights, managers may wish to under-
take risk management with derivatives to avoid being replaced because of poor firm performance
attributable to financial risks (see Breeden and Viswanathan, 1996, for related arguments). Alter-
27 The ICR Guide is published by The PRS Group, 6320 Fly Road, Suite 102, East Syracuse, NY 13057-0248, USA.

21
natively, managers acting in the best interests of shareholders may have an incentive not to hedge
if hedging benefits primarily bondholders at the expense of shareholders. Consequently, the pre-
dicted relation between shareholder rights and derivatives use is ambiguous. Nonetheless, we
examine the index of shareholder rights described in La Porta et al. (1998) in case one effect
dominates. Still another hypothesis suggests weak shareholder protection may also encourage
managers to use derivatives but for their own benefit (e.g., insuring their personal wealth). We
predict that high ownership concentration (specifically, the percentage of market capitalization of
closely held shares as reported by Dahlquist et al., 2003) implies lower diversification of share-
holders and therefore a greater desire to hedge with derivatives. Table 7 summarizes predictions
and provides definitions for most of the country-specific independent variables we examine.
5.2 Univariate Analysis of Country Factors
Examining univariate tests for the country-specific variables reported in Table 8 again reveals
mixed evidence for theoretical predictions. First, the evidence supports our market access hy-
pothesis. Hedgers tend to be in countries with larger derivatives markets, higher GDP per capita,
and OECD countries. The univariate statistics do not generally support our country risk hypothe-
sis. Country risk as measured by the ICR composite index, the logarithm of GDP, and trade
magnitude all indicate that hedgers tend to be in safer countries. However, when we examine the
ICR financial, economic and political risk measures separately, the results depend on type of risk.
Hedgers are in countries with lower political and economic risk, but (slightly) higher financial
risk. This highlights one of the main shortcomings of the univariate analysis. Since politically and
economically safer countries are likely to have more developed capital markets it is difficult to
disentangle the roles of market access and country risk in these results. The evidence regarding
our legal structure hypothesis is also ambiguous. Hedgers tend to be in countries with better over-
all legal environments as measured by the legality and rule-of-law indices, yet they also are more
likely to be in countries with weak creditor rights. Similarly, the results suggest that agency costs
related to derivatives use are probably low. Hedgers tend to be in countries with better share-
holder rights and less concentrated equity ownership.28
28 Overall, these results are fairly consistent with the findings of Lel (2002) that better corporate governance posi-tively influences hedging.
22
5.3 Multivariate Analysis of Country Factors
In order to test the relation between derivatives use and country-specific factors, we estimate two
types of models. The first is a single-equation PROBIT model using the full sample of general
derivatives users that includes the firm-specific factors discussed above as well as country-
specific variables. The second is a trivariate PROBIT model with separate equations for FX, IR,
and CP derivatives. We also table estimates of the marginal effects, so we can compare the rela-
tive economic significance of different factors.
The results are presented in Table 9. We only table results using what we think are the best
proxies for each hypothesis, but we discuss the alternative proxies. We first point out that adding
country variables has little effect on the coefficients of the firm-specific variables. For example,
in the general derivatives specification, only two variables change significance levels. The coeffi-
cient on stock options is no longer significant for general derivatives (but actually becomes sig-
nificantly negative for FX and IR derivatives), and the coefficient on the coverage ratio becomes
significant at the 10% level. Overall, the magnitudes of the coefficients in Table 9 are remarkably
similar to those in Table 5 thus reiterating the importance of firm-specific effects.
The positive coefficients on derivatives market rank support the market access hypothesis.
There is mixed evidence for the country risk hypothesis. The coefficient on both the ICR finan-
cial and economic risk (not tabled) indices are always negative and statistically significant sug-
gesting that in countries with higher financial and economic risk firms are more likely to use de-
rivatives, ceteris paribus. However, there is a consistently significant positive relation between the
ICR political risk index and derivatives use suggesting that in countries with more political risk,
firms use derivatives less often. Other proxies for country risk (log of GDP, and trade magnitude)
fail to consistently support the predicted relation. These results are plausible if financial and eco-
nomic risk can be mitigated with derivatives while political risks hinder derivatives usefulness or
availability (as per the rule-of-law hypothesis).
There is only weak support for the rule-of-law hypothesis. An effective legal environment
(legality) is significantly positively related to FX derivatives use but not to general, IR, or CP
derivatives use. It is hard to interpret these results unless there are systematic differences between
the contracts employed by users of different types of derivatives. For example, perhaps FX de-
rivatives contracts are less likely to fall under the jurisdiction of (higher quality) external legal

23
systems than other derivatives contracts.29 Alternative measures of rule-of-law are similarly in-
conclusive. The results do not shed light on the hypothesis regarding the agency relationship be-
tween managers and shareholders except for IR derivatives. The negative coefficient is consistent
with management of closely held firms preferring not to hedge if this primarily benefits debthold-
ers. Estimations with the shareholder rights variable (results not reported) provide no supporting
evidence. The estimated correlation between FX and IR derivatives use is 0.41, the correlation
between FX and CP derivatives use is 0.16, and the correlation between IR and CP derivatives
use is 0.23. While these values are somewhat less than simple Pearson correlation coefficients,
they are all statistically significant at the 1% level.
The economic importance of country-specific factors (i.e., marginal effects) are always less
than the most important firm-specific factor (firm size). Instead, the most important country fac-
tor, either derivatives market rank or financial risk, is about as economically significant as the
second or third most important firm-specific factor (typically leverage and dividend payout). The
economic (as well as the statistical) significance of the rule-of-law and agency cost proxies are
always relatively small. Overall, the average magnitude of the four most important firm-specific
effects is typically much greater than the average magnitude of the four country-specific effects.
In summary, the results regarding market access strongly support the conjectures of policy
makers that firms in some countries encounter costly constraints on the supply-side of derivatives
markets. Also as predicted, the results for country risk suggest both financial and economic risk
motivate the use of derivatives. As we conjectured, little evidence suggests that rule-of-law or the
agency relationship between managers and shareholders affect the use of derivatives.
6 Derivatives Use and Firm Value Theories of risk management suggest that derivatives use affects firm value. Those suggesting
that risk management reduces expected financial distress costs, underinvestment, agency costs,
etc. imply that risk management may increase firm value. Theories suggesting managers under-
take risk management for their own benefits imply that risk management may decrease firm
value. If some firms (or managers) act sub-optimally by not using derivatives, it may be possible
29 This might be the case if CP and IR derivatives counter-parties are more likely to be global banks or dealers, and FX derivatives counter-parties are more likely to be local banks or dealers.
24
to empirically detect the valuation effects of derivatives use. Recently, several studies have exam-
ined this possibility. As with the empirical literature examining motives for derivatives use, there
exist conflicting conclusions.
Allayannis and Weston (2001) find that U.S. firms with foreign exchange exposure using
FX derivatives have about 4% higher firm value as measured by Tobin’s Q. Simkins, Carter, and
Rogers (2003) find a substantially larger hedging premium of 12-16% for firms in the U.S. airline
industry. Evidence suggests the premium comes from reduction of underinvestment costs. Using
a sample of firms with ADRs, Allayannis, Lel, and Miller (2003) find a positive relation between
FX derivatives use and firm value for firms with good corporate governance (or in countries with
overall good governance standards). However, Nguyen and Faff (2003) study Australian firms’
use of FX and IR derivatives and find a negative relation between hedging and firm value. Like-
wise, Guay and Kothari (2003) suggest that the value of derivatives positions is not significant
enough to have important direct valuation effects. Lookman (2003) suggests that the valuation
effects in prior studies are attributable to derivatives usage acting as a proxy for other variables
that are known to affect firm value (such as agency costs and managerial ability).
One problem with tests using firm value as the dependent variable is the implicit assump-
tion that some firms act sub-optimally by not using derivatives and therefore have lower value.
An alternative to these types of tests entails inferring the economic value of derivatives usage by
isolating its effect on other firms characteristic. For example, Graham and Rogers (2002) estimate
a simultaneous equations model to isolate the change in value of the debt tax-shield attributable to
hedging. They find a positive effect of around 1% of firm value. To examine the valuation effects
of derivatives use, we expand the analyses in Graham and Rogers (2002) and Allayannis and
Weston (2001) to include all types of derivatives use across all countries in our sample.
First, we estimate simultaneous equation models similar to Graham and Rogers (2002) and
calculate valuation effects in line with their reported values. The two equation system consists of
a PROBIT model similar to that reported in Table 9 for the hedging equation (since we only have
binary variables) and a linear leverage equation. Table 10 reports results from the estimations. To
conserve space we only report the coefficients on the hedging variables from the linear leverage
models as well as mean and median estimates of the increase in value of the debt tax shield.30 We
30 Full results for both equations are available on request.
25
find that for all four exposure classes hedging is an important factor determining leverage. The
estimated coefficients suggest that hedging is associated with an increase in leverage ranging
from about 3% for FX derivatives users to 15% for CP derivatives users. These increases in lev-
erage translate into mean estimated increases in firm value of 0.29% to 1.70%. For general de-
rivatives users the mean value is 0.86% or about three-quarters of the 1.11% value estimated by
Graham and Rogers for 84 large U.S. firms.
In our second test, we consider the relation between derivatives use and firm value more di-
rectly by undertaking an analysis similar to Allayannis and Weston (2001). Our tests are substan-
tially more powerful because we have many more firms and we do not suffer from the problem
that value is likely to be related to exchange rate realizations. Specifically, Allayannis and Wes-
ton find that their results are strongest in years when the U.S. dollar appreciates against other cur-
rencies. These effects should wash out in our large international sample since one country's ap-
preciating currency is another country's depreciating currency. Allayannis and Weston hypothe-
size and document that the effect should only be pronounced for firms with exposures, therefore
we examine firms with high and low exposures separately.
Because there are so many well documented determinants of firm value (e.g., the diversifi-
cation discount), a multivariate analysis is necessary for obtaining reliable results.31 Table 11
presents results of these multivariate tests. The dependent variable is Tobin’s Q which we define
as the natural logarithm of the market value of common equity plus the book value of total debt
plus the book value of preferred stock all divided by the book value of total assets.32 We only
table the results of one specification but have estimated several alternatives since the inclusion of
31 In particular, we use the log of total assets to control for firm size and the ratio of total debt to size to control for effects of financial leverage on firm value (see LaPorta et al., 1997; Lang and Stulz, 1994; Servaes, 1996). In addi-tion to our profitability measure, we include a dummy variable with value 1 if the company pays a dividend (and 0 otherwise) as an added proxy for the availability of internal funds for investment projects. Since firms with large growth opportunities may be more or less likely to use derivatives and since growth opportunities are related to firm value (Myers, 1977), we control for investment growth with the ratios R&D to sales and capital expenditures to sales (Capex). Industrial and geographic diversification has been shown to impact firm value as well. In particular, Berger and Ofek (1995), Lang and Stulz (1994) and Servaes (1996) present empirical support for a discount of conglomerate diversification. We control for industrial diversification with the number of business segments that make up the com-pany’s revenue. Similarly, other researchers have documented valuation effects for operating in several countries (see Coase, 1937; Dunning, 1973; Morck and Yeung, 1991; Bodnar, Tang and Weintrop, 1997), so we include the ratio of foreign sales to total sales as a control for the impact of geographic diversification. 32 Because of data limitations we must use the book values of debt and preferred stock in our calculation of firm value. If hedging leads to a higher market value of debt or preferred stock (but not higher equity value), our measure would be unable to identify this increase in value. This would bias our results against finding an effect.
26
the Capex and R&D ratios limit our sample size. Other specifications yield similar conclusions.
The coefficient for the hedging variable is the one of interest. We find some support for a
positive value effect of general derivatives usage but only for firms with low exposure. The esti-
mated value increase of 9% is exceptionally large. Strangely, the effect is concentrated among IR
derivatives users with low exposure (leverage). The coefficients suggest that investors reward
users of interest rate derivatives with a substantial hedging premium of 5% to 13% of firm value.
As an aside, we note that many of the control variables are significant and have the expected sign.
The log of assets and dividends tend to have significant negative coefficients, while geographic
diversification, R&D and capital expenditures (specifications not reported) have a positive impact
on value. For robustness we also (1) examine the ratio of the market value of the firm to total
sales as an alternative estimate of Tobin’s Q, and (2) conduct the analysis without taking the natu-
ral log of Q. We also consider only U.S. firms excluding utilities with more than $500 million in
assets, as do Allayannis and Weston. None of these alternatives leads to materially different out-
comes.
Because the result for IR derivatives is puzzling, we undertake additional analysis to better
understand its source. The effect is concentrated among G7 countries and is especially strong in
(but not limited to) the U.K. Including industry and country dummy variables (instead of adjust-
ing the explanatory variables for country and industry) strengthens the result somewhat so it is
not caused by omitted country or industry factors. Running separate regressions for each industry
shows that the effect is not constant nor significant across all industries, though it is never nega-
tive and significant. The effect is strongest for miscellaneous (mostly service) industries and retail
trade. We also examine hedgers that use interest rate derivatives but not FX or CP derivatives and
find coefficients of similar magnitude but somewhat weaker statistical significance (in part be-
cause of a smaller sample size). This suggests that the effect is related to interest rate derivatives
in particular.
Assuming that the results are not due to chance or model misspecification, it is difficult to
interpret these findings for firm value.33 In particular, it is hard to understand why the results are
33 Because the size of the effect seems unrealistically large, we are skeptical of the finding and suspect it is from an unknown omitted factor. To get a better intuitive feel for how large the value effect is we make the assumption (con-servative for our purposes) that all interest rate derivative users hedge 100% of their total debt and then calculate that the value increase associated with IR derivatives ranges from 17%-28% of the notional value of the derivative con-tracts.

27
only strong and consistent for interest rate derivatives users. One possibility is that these results
reflect changes in interest rates specific to the sample period. From the beginning of 2000 to the
end of 2001 interest rates declined (sometimes substantially) or remained constant in all but 7 of
the countries in our sample. These were mostly smaller countries that together make up less than
3% of firms. However, nonfinancial firms typically use interest rate derivatives to extend the ef-
fective duration of their debt (e.g., swap floating payment for fixed payments) so we would ex-
pect interest rate hedgers to benefit on average from increasing not decreasing interest rates. An-
other possibility is that interest rate derivatives use is the best proxy for an overall risk manage-
ment program that increases value.34 Payoffs from IR derivatives are less likely to be directly
related to operating cash flows since their primary use is for adjusting the duration of liabilities,
thus the availability of alternative risk management tools, such as location of production facilities,
is limited. Then again, if there exist opportunities to increase value primarily with interest rate
derivatives, this implies some property of their market or aspect of their use that is different from
FX or CP derivatives. For example, interest rate derivatives used by nonfinancial firms tend to
have longer maturities than FX derivatives or interest rates are more highly correlated with the
business cycle. Still another possibility is that IR derivatives use is often mandated by lenders
(e.g., banks as part of a loan) that have a superior ability to identify firms for which interest rate
risk is value-enhancing.
7 Alternative Specifications and Robustness Checks We undertake a set of additional robustness checks to gauge the reliability of our results. One
primary concern is that for some firms in our sample the disclosure of derivatives use is not man-
dated by local accounting standards. This may bias the results, especially for country variables
whose values are correlated with the likelihood of disclosure. To investigate this possible bias, we
create a sub-sample of firms for which we know disclosure is mandatory. These are firms in the
so-called G4+1 group (U.S., U.K., Canada, Australia, and New Zealand) as well as firms con-
forming to international accounting standards (IAS). This leads to a sub-sample of 4,473 firms.
34 As Allayannis and Weston (2001) point out (p. 269) “it is likely that firms that use derivatives also use other types of risk management activities….hence, other types of risk management activities, and firms’ overall risk manage-ment capabilities and sophistication may also contribute to the somewhat large hedging premium found here.”
28
Overall, the results are similar to those in Table 9.35 This suggests that a reporting bias does not
drive our results. If we consider the complement to this sample—the 1,986 firms for which we
are less sure of the quality of reporting—the results (not reported) for firm-specific factors are
consistent with those in Table 9. However, the statistical significance of the country factors is
greatly reduced. This may be because of poor disclosure by firms or simply because removing the
G4+1 group significantly reduces the variation in these measures and the power of the tests.
One of the primary findings is that supply-side effects are important determinants of deriva-
tive usage. However, our primary variable for derivative market size may be endogenously de-
termined if demand for derivatives contracts by nonfinancial firms has a significant positive im-
pact on derivatives turnover among financial institutions. Consequently, we take a closer look at
this potential problem. Revisiting the data provided in Panel C of Table 1 shows that in 2001 non-
financial firms held only 9.9% of outstanding interest rate derivatives and 22% of outstanding
foreign exchange derivatives. Examining net turnover attributable to nonfinancial counterparties
as a percent of all turnover in the FX and IR derivatives markets results in even smaller values
(9.7% for FX and 5.0% for IR in 2001).36 This indicates the effect of nonfinancial firms on total
market demand is likely to be small.
We also conduct several statistical tests to more reliably assess our conjecture. First, we as-
sume that derivative market rank is endogenous and examine the effect of derivative use in a si-
multaneous equations setting (similar to that in Table 10). As identifying country variables we
use GDP per capita, the natural logarithm of GDP, stock market volatility, dummy variables for
OECD and G7 membership, and country credit rating. The results (not reported) show that gen-
eral, FX, and CP derivative use by nonfinancial firms are not significant explanatory variables for
derivative market rank (but FX derivative use is significant at the 5% level). In contrast, coeffi-
cients in the hedging equations for the endogenous (predicted) values of derivative market rank
are all significant at the 1% confidence level and coefficient values increase somewhat in magni-
tude. To directly test if high demand by nonfinancial firms leads to growth in the size of the de-
rivatives markets, we examine historical data from the BIS triennial surveys by country and coun-
35 For FX derivatives the multiple share class dummy, the market-to-book ratio, and the ICR Financial index are no longer significant at the 10% level. For IR derivatives, profit margin becomes significant while foreign debt turns insignificant. For CP derivatives, the ICR Financial index becomes insignificant at the 10% level. 36 Data are from the BIS 2001 Triennial Central Bank Survey of Foreign Exchange and Derivatives Market Activity Tables E.27 and E.30.1.
29
terparty. Specifically, using data from the 1995, 1998, and 2001 surveys for 39 countries, we test
if high levels of net turnover among nonfinancial firms is positively related to growth in total net
turnover during the next 3 years. Results suggest no such causality. In summary, we are confident
that endogeneity is not driving the findings for derivative market size.
The specifications examined previously have not included all the firm-specific variables of
interest because some variables are close substitutes for one another (e.g., the quick ratio and the
current ratio) and because not all variables are available for all firms (e.g., R&D). Consequently,
we examine alternative specifications for general derivatives use. These additional tests yield
some interesting results. First, tangible assets (as a percent of total assets) and debt maturity,
which both are predicted by the financial distress hypothesis to be negatively related to deriva-
tives use, consistently have positive and significant coefficients. We interpret these results as fur-
ther evidence against the financial distress hypothesis. Results using the current ratio are quite
similar to those using the quick ratio. ROA as an alternative to gross profit margin yields consis-
tently larger positive coefficients. R&D and capital expenditures (both as a percent of sales),
which should be proxies for underinvestment costs, are not consistently significant. In general,
the results across different sub-samples using alternative explanatory variables and complemen-
tary statistical procedures all yield very similar results. Consequently, we are confident that the
observed relations are not due to sample selection bias or model misspecification.
8 Summary and Conclusion This study examines the use of derivatives by 7,319 firms in 50 countries that together comprise
about 80% of the global market capitalization of nonfinancial companies. Our study is the first
comprehensive global examination of hedging practices and, in contrast to most prior studies,
examines the use of several types of derivatives (foreign exchange, interest rate, and commodity
price). Overall, we find that derivatives use by firms outside the United States is very widespread.
Beyond its descriptive content, there are several other valuable aspects of our study. First, the
large sample size increases power of statistical tests examining the determinants of hedging and
thus helps shed light on the ambiguity of studies investigating mostly U.S. firms. Second, the
wide array of countries represented allows us to examine whether similar factors are associated
with derivatives use in different countries. Third, we can similarly compare the importance of
country-specific factors and firm-specific factors. Fourth, we can use the broad scope of the sam-
ple to identify reasonably sized sub-samples of firms that may be of particular interest (e.g., firms
30
that have high expected financial distress costs). Fifth, the international data means we are less
likely to have our tests (especially valuation tests) biased by exchange rate movements since
these should wash out in the full sample.
Overall, we are able to resolve some conflicting conclusions from prior studies regarding
the determinants of hedging. In short, almost all of the factors studied by prior researchers appear
to be associated with derivatives use. This suggests that the mixed results from prior studies are
due primarily to a lack of power. This is the good news. The bad news is that the strong results
from our tests are consistent with some theoretical predictions, but in several cases unambigu-
ously inconsistent. We interpret this as evidence that commonly cited theoretical motivations for
risk management are of secondary importance for determining which firms use derivatives. In-
stead, the results are most consistent with an alternative hypothesis that derivatives are financial
tools which firms integrate into their financial operations once they obtain a certain level of so-
phistication. This suggests a possible need for both further theoretical and empirical analysis. On
the theoretical side, it implies a need for rethinking the primary factors that are associated with
derivatives use, or perhaps a shift in focus to determining optimal derivative strategies instead of
whether or not firms should hedge. On the empirical side, we propose that research should exam-
ine more general (or complex) models of firm risk that may be able to resolve the apparent con-
flicts with theory that we document. For example, it could be that credit risk is an important fac-
tor for determining derivatives use. New theory could suggest a framework that could in turn help
specify an appropriate empirical test for this relation. This might, for instance, help explain why
profitability is in some cases positively related to derivatives use (contrary to the prediction from
the simple financial distress theory) especially for firms outside the U.S..
It also appears that new insights are needed to explain the results regarding firm valuation
and derivatives use. In particular, additional analysis needs to be undertaken to understand the
precise mechanisms by which derivatives use affects firm value. Is it through the tax shield as
suggested by the positive relation between hedging and leverage? Is the effect stronger for users
of interest rate derivatives because of risk-bearing by firms? Perhaps corporate governance or
managerial ability plays a role as suggested by Allayannis, Lel, and Miller (2003) and Lookman
(2003). Alternatively, is it possible that some firms are able to profitably take advantage of pre-
dictable changes in the yield curve or credit spreads with derivatives as suggested by Titman
31
(1992) and Baker, Greenwood, and Wurgler (2003)? We leave these questions to subsequent re-
search.
An important and robust conclusion is that firms with less liquid derivatives markets, typi-
cally in less developed countries, are less likely to hedge. This is consistent with the assertions of
some policy makers that derivatives could be important in limiting the severity of economic
downturns in developing economies. The importance of this finding is reinforced by other results
showing that these firms (typically in countries with higher economic and financial risk) implic-
itly prefer to hedge more often, ceteris paribus. Consequently, it is likely that financial policy
makers could facilitate corporations’ financial risk management activities by pursuing strategies
that encourage the development of local-currency derivatives markets.
32
References Allayannis, G., and E. Ofek. 2001. “Exchange Rate Exposure, Hedging, and the Use of Foreign
Currency Derivatives.” Journal of International Money and Finance 20: 273-296.
Allayannis, G., and J.P. Weston 2001. “The Use of Foreign Currency Derivatives and Firm Mar-ket Value.” Review of Financial Studies 14:1: 243-276.
Allayannis, Y., G. Brown and L. Klapper 2003. “Capital Structure and Financial Risk: Evidence from East Asia.” Journal of Finance 58:6 2667-2709.
Allayannis, Y., U. Lel, and D. Miller, 2003, “Corporate Governance and the Hedging Premium around the World.” Darden School working paper.
Altman, E. 2000. “Predicting Financial Distress of Companies: Revisiting the Z-score and Zeta Models.” New York University working paper.
Baker, M., R. Greenwood, and J. Wurgler, 2003. “The Maturity of Debt Issues and Predictable Variation in Bond Returns.” Journal of Financial Economics 70:2: 261-291.
Bartram, S.M. 2000. “Corporate Risk Management as a Lever for Shareholder Value Creation.” Financial Markets, Institutions, and Instruments 9:5: 279-324.
Berger, P.G., and E. Ofek 1995. “Diversification’s Effect on Firm Value.” Journal of Financial Economics 37:1: 39-65.
Berkowitz, D., K. Pistor, and J. Richard 2003. “Economic Development, Legality and the Trans-plant Effect.” European Economic Review 47:1: 165-195.
Bessembinder, H. 1991. “Forward Contracts and Firm Value: Investment Incentive and Contract-ing Effects.” Journal of Financial and Quantitative Analysis 26:4: 519-532.
Bodnar, G. and G. Gebhardt 1999. “Derivatives Usage in Risk Management by US and German Nonfinancial Firms: A Comparative Survey.” Journal of International Financial Manage-ment and Accounting 10:3: 153-188.
Bodnar, G.M., G.S. Hayt and R.C. Marston 1998. “1998 Wharton Survey of Financial Risk Man-agement by US Nonfinancial Firms.” Financial Management 27:4: 70-91.
Bodnar, G., C. Tang and J. Weintrop 1997. “Both Sides of Corporate Diversification: The Value Impact of Geographical and Industrial Diversification.” NBER Working Paper.
Breeden, D., and S. Viswanathan 1996. “Why Do Firms Hedge? An Asymmetric Information Model.” Duke University working paper.
Brown, G. 2001. “Managing Foreign Exchange Risk with Derivatives.” Journal of Financial Eco-nomics 60:2/3: 401-449.
Brown, G., P. Crabb, and D. Haushalter 2002. “Are Firms Successful at Selective Hedging?” University of North Carolina working paper.
Campbell, T.S., and W.A. Kracaw 1987. “Optimal Managerial Contracts and the Value of Corpo-rate Insurance.” Journal of Financial Quantitative Analysis 22:3: 315-328.
Carter, D., Rogers, D., and Simkins, B., 2003, “Does Fuel Hedging Make Economics Sense? The Case of the US Airline Industry.” Oklahoma State University working paper.
Coase, R. 1937. “The Nature of Firms.” Economica 4: 386-405.
33
Core, J.E., W.R. Guay, and S.P. Kothari 2002. “The Economic Dilution of Employee Stock Op-tions: Diluted EPS for Valuation and Financial Reporting.” Accounting Review 77:3: 627-653.
Cox, D.R. and Snell, E.J. 1989. The Analysis of Binary Data, Second Edition, London: Chapman and Hall.
Dahlquist, M., L. Pinkowitz, R. Stulz, R. Williamson 2003. “Corporate Governance and the Home Bias.” Journal of Quantitative and Financial Analysis 38:1: 87-110.
Downie, D., J. McMillan and E. Nosal 1996. “The University of Waterloo Survey of Canadian Derivatives Use and Hedging Activities.” In Managing Financial Risk, Yearbook 1996, C.W. Smithson, ed. CIBC-Wood Grundy: New York, 214-233.
Dunning, J. 1973. “The Determinants of International Product.” Oxford Economic Papers 25: 289-336.
Froot, K.A., D.S. Scharfstein, and J.C. Stein 1993. “Risk Management: Coordinating Corporate Investment and Financing Policies.” Journal of Finance 48:5: 1629-1658.
Géczy, C., B.A. Minton, and C. Schrand 1997. “Why Firms Use Currency Derivatives.” Journal of Finance 52:4: 1323-1354.
Graham, J.R., and C.W. Smith, Jr. 1999. “Tax Incentives to Hedge.” Journal of Finance 54:6: 2241-2263.
Graham, J.R., and D.A. Rogers 2002. “Do Firms Hedge In Response to Tax Incentives?” Journal of Finance 57:2: 815-840.
Greene, W., 2001, Econometric Analysis, 4th Edition, Prentice Hall, Saddle River, NJ, USA.
Guay, W., 1999, The Impact of Derivatives on Firm Risk: An Empirical Examination of New Derivatives Users, Journal of Accounting and Economics 26: 319-351.
Guay, W., and Kothari, S.P., 2003, “How much do firms hedge with derivatives?”, forthcoming Journal of Financial Economics.
Han, L.M. 1996. “Managerial Compensation and Corporate Demand for Insurance.” Journal of Risk and Insurance 63:3: 381-404.
Haushalter, G.D. 2000. “Financing Policy, Basis Risk, and Corporate Hedging: Evidence from Oil and Gas Producers.” Journal of Finance 55:1: 107-152.
Kaufmann, D., A. Kraay and P. Zoido-Lobaton 1999. "Aggregating Governance Indicators". World Bank Policy Research Department working paper No. 2195.
La Porta, R., F. Lopez-de-Silanes, A. Shleifer, and R.W. Vishny 1997. “"Legal Determinants of External Finance," Journal of Finance 52:3: 1131-1150.
La Porta, R., F. Lopez-de-Silanes, A. Shleifer, and R.W. Vishny 1998. “Law and Finance.” Jour-nal of Political Economy 106:6: 1113-1155.
La Porta, R., F. Lopez-de-Silanes, and A. Shleifer 1999. “Corporate Ownership Around the World.” Journal of Finance 54:2: 471-517.
Lang, L., and R.M. Stulz 1994. “Tobin’s Q, Corporate Diversification and Firm Performance.” Journal of Political Economy 102: 1248-1280.

34
Lel, U. 2002. “Corporate Hedging Policy Around the World.” University of Indiana working pa-per.
Leland, H. 1998. “Agency Costs, Risk Management, and Capital Structure.” Journal of Finance 53:4: 1213-1243.
Lookman, A. 2003. “Does Hedging Really Affect Firm Value?” Carnegie Mellon University working paper.
MacMinn, R.D. 1987. “Insurance and Corporate Risk Management.” Journal of Risk and Insur-ance 54:4: 658-677.
Mayers, D., and C.W. Smith Jr. 1982. “On the Corporate Demand for Insurance.” Journal of Business 55:2: 281-296.
Mello, A., J. Parsons, and A. Triantis,1995, An Integrated model of Multinational Flexibility and Financial Hedging, Journal of International Economics 39:1, 27-51.
Mian, S.L. 1996. “Evidence on Corporate Hedging Policy.” Journal of Financial and Quantitative Analysis 31:3: 419-439.
Modigliani, F., and M.H. Miller 1958. “The Cost of Capital, Corporation Finance, and the Theory of Investment.” American Economic Review 48:3: 261-297.
Morck, R. and B. Yeung 1991. “Why Investors Value Multinationality.” Journal of Business 64: 165-187.
Myers, S.C. 1977. “Determinants of Corporate Borrowing.” Journal of Financial Economics 5: 147-175.
Myers, S.C. 1984. “The Capital Structure Puzzle.” Journal of Finance 39:3: 575-592.
Myers, S.C. 1993. “Still Searching for Optimal Capital Structure.” In: Stern, J.M., and D.H. Chew, Jr. (eds.). The Revolution in Corporate Finance. Basil Blackwell, New York, NY, 91-99.
Nance, D.R., C.W. Smith, Jr., and C.W. Smithson 1993. “On the Determinants of Corporate Hedging.” Journal of Finance 48:1: 267-284.
Nguyen, H., and R. Faff 2003. “Are Financial Derivatives Really Value Enhancing? Australian Evidence.” University of South Australia working paper.
Servaes, H. 1996. “The Value of Diversification During the Conglomerate Merger Wave.” Jour-nal of Finance 51: 1201-1225.
Shapiro, A.C., and S. Titman, S. 1986. “An Integrated Approach to Corporate Risk Manage-ment.” In: Stern, J.M., and D.H. Chew (eds.). The Revolution in Corporate Finance, Basil Blackwell, New York, NY, 215-229.
Smith, C.W., and R.M. Stulz. 1985. “The Determinants of Firms' Hedging Policies.” Journal of Financial and Quantitative Analysis 20:4: 391-405.
Stulz, R.M. 1984. “Optimal Hedging Policies.” Journal of Financial and Quantitative Analysis 19:2: 127-140.
Stulz, R.M. 1990. “Managerial Discretion and Optimal Hedging Policies.” Journal of Financial Economics 26:1: 3-27.

35
Stulz, R.M. 2002. Risk Management and Derivatives. Southwestern Publishing Company.
Titman, S. 1992. “Interest Rate Swaps and Corporate Financing Choices.” Journal of Finance 47:4: 1503-1516.
Tufano, P. 1996. “Who Manages Risk? An Empirical Examination of the Risk Management Prac-tices in the Gold Mining Industry.” Journal of Finance 51:4: 1097-1137.
Warner, J.B. 1977. “Bankruptcy Costs: Some Evidence.” Journal of Finance 32:2: 337-347.
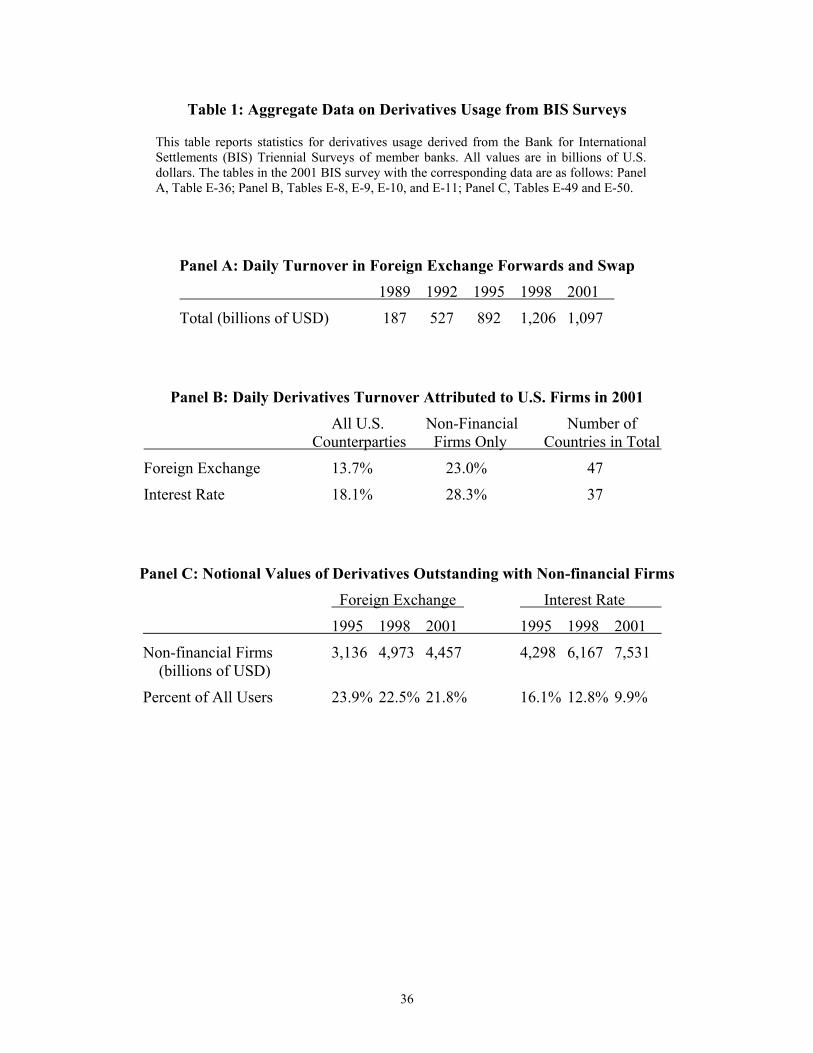
36
Table 1: Aggregate Data on Derivatives Usage from BIS Surveys
This table reports statistics for derivatives usage derived from the Bank for International Settlements (BIS) Triennial Surveys of member banks. All values are in billions of U.S. dollars. The tables in the 2001 BIS survey with the corresponding data are as follows: Panel A, Table E-36; Panel B, Tables E-8, E-9, E-10, and E-11; Panel C, Tables E-49 and E-50.
Panel A: Daily Turnover in Foreign Exchange Forwards and Swap 1989 1992 1995 1998 2001
Total (billions of USD) 187 527 892 1,206 1,097
Panel B: Daily Derivatives Turnover Attributed to U.S. Firms in 2001 All U.S. Non-Financial Number of
Counterparties Firms Only Countries in Total
Foreign Exchange 13.7% 23.0% 47
Interest Rate 18.1% 28.3% 37
Panel C: Notional Values of Derivatives Outstanding with Non-financial Firms Foreign Exchange Interest Rate
1995 1998 2001 1995 1998 2001
Non-financial Firms 3,136 4,973 4,457 4,298 6,167 7,531 (billions of USD)
Percent of All Users 23.9% 22.5% 21.8% 16.1% 12.8% 9.9%

37
Table 2: Summary Statistics of Derivatives Use The table shows summary statistics of derivatives use by country, region, industry and for all firms. In particular, it presents the number of firms and the percentage of firms using derivatives. The percentage of firms using derivatives in general and a particular instrument (forward, swap, option) is shown separately for foreign exchange rate derivatives, interest rate derivatives and commodity price derivatives. Statistics for Forwards include Futures; Options include Caps, Floors, Collars and Swaptions.
Foreign Exchange Derivatives Interest Rate Derivatives Commodity Price Derivatives Firms User General Forward Swap Option General Forward Swap Option General Forward Swap Option
Australia 305 66.6 51.5 47.9 8.5 17.7 42.3 3.6 39.0 15.1 14.1 9.8 3.6 4.9 Canada 599 59.9 45.4 33.4 8.2 7.8 27.2 0.3 24.2 3.0 18.7 8.7 5.3 6.2 Germany 413 47.0 39.2 27.1 11.1 12.8 24.2 1.9 18.2 9.7 4.6 2.4 0.5 0.5 Japan 368 81.3 75.5 71.2 33.4 18.2 60.6 0.5 59.5 14.4 9.8 6.3 1.9 1.6 United Kingdom 886 64.2 54.5 48.8 17.2 7.9 36.6 0.6 31.9 10.8 3.8 2.7 1.4 0.8 United States 2,231 64.9 37.7 30.7 6.4 7.2 40.4 0.6 35.8 6.9 16.3 8.6 5.2 3.3 Other countries 2,517 53.4 44.4 35.8 11.2 10.5 23.0 1.6 19.3 5.4 5.0 2.3 1.5 1.3
US & Canada 2,830 63.8 39.3 31.3 6.7 7.3 37.6 0.6 33.3 6.0 16.8 8.6 5.2 3.9 Europe 2,530 61.4 50.9 42.1 15.5 12.6 32.4 1.9 27.1 9.3 5.0 2.7 1.4 1.0 Asia & Pacific 1,743 51.2 44.1 39.3 12.3 9.2 27.3 1.0 25.7 7.2 6.0 3.4 1.7 1.5 Africa/Middle East 127 78.0 74.8 57.5 5.5 15.7 22.0 0.0 18.1 3.9 7.9 7.1 0.0 1.6 Latin Amer./Carib. 89 71.9 51.7 32.6 15.7 9.0 37.1 1.1 30.3 5.6 18.0 6.7 6.7 7.9 OECD 6,133 64.3 47.3 39.4 12.2 11.0 37.4 1.3 32.9 8.5 11.4 6.1 3.4 2.7 Non-OECD 1,186 39.6 34.6 27.3 5.8 3.6 10.8 0.3 9.0 1.8 3.0 1.3 0.9 0.7 Non-US 5,088 58.3 48.5 40.3 13.3 10.9 29.9 1.4 26.1 7.6 7.3 3.9 2.0 1.9
Automobiles 159 72.3 61.6 49.7 19.5 11.9 42.1 0.6 40.9 8.2 5.0 3.1 0.6 0.0 Chemicals 177 78.5 68.9 63.3 17.5 15.8 48.6 0.6 46.3 9.0 16.9 9.0 4.5 4.0 Clothing 133 69.2 55.6 42.1 8.3 12.8 33.8 0.8 27.1 5.3 6.8 4.5 2.3 0.8 Construction 443 58.0 42.0 33.0 14.0 8.1 35.9 1.4 30.2 8.1 7.0 2.7 2.7 1.1 Consumer Goods 281 52.0 43.4 37.7 14.9 15.7 31.0 2.8 27.0 7.8 3.6 2.1 0.0 1.4 Durables 225 59.6 53.8 47.6 8.9 13.8 30.7 1.8 25.8 4.0 5.3 1.8 1.3 0.0 Fabricated Products 56 75.0 62.5 53.6 23.2 7.1 42.9 0.0 39.3 12.5 10.7 7.1 0.0 1.8 Food 358 67.3 52.0 43.9 18.4 12.0 43.6 3.1 40.2 10.3 16.5 14.0 2.5 3.1 Machinery 929 68.7 60.6 52.9 9.3 13.3 30.1 0.9 25.9 6.0 3.3 1.6 0.5 0.1 Mines 241 58.9 41.5 34.9 5.0 10.8 20.3 0.4 17.0 5.4 35.7 28.2 2.9 16.6 Miscellaneous 2,881 50.8 36.6 29.4 7.7 7.1 26.1 0.6 22.5 6.8 2.8 1.1 0.7 0.4 Oil 276 71.4 38.4 30.8 11.2 9.4 38.4 1.1 34.1 5.1 50.4 19.6 25.4 12.0 Retail 403 60.0 37.7 31.0 9.9 7.2 37.7 1.0 32.3 7.7 3.2 1.7 0.2 0.5 Steel 164 73.2 60.4 52.4 16.5 12.2 43.3 1.8 38.4 9.1 30.5 18.9 3.7 3.7 Transportation 350 69.1 52.9 43.1 17.4 12.0 47.4 1.7 43.7 10.9 17.1 5.4 8.9 3.7 Utilities 243 84.0 43.6 31.3 26.7 9.5 61.7 3.3 57.2 13.2 44.4 23.9 18.1 15.6
All firms 7,319 60.3 45.2 37.4 11.2 9.8 33.1 1.1 29.0 7.4 10.0 5.3 3.0 2.4
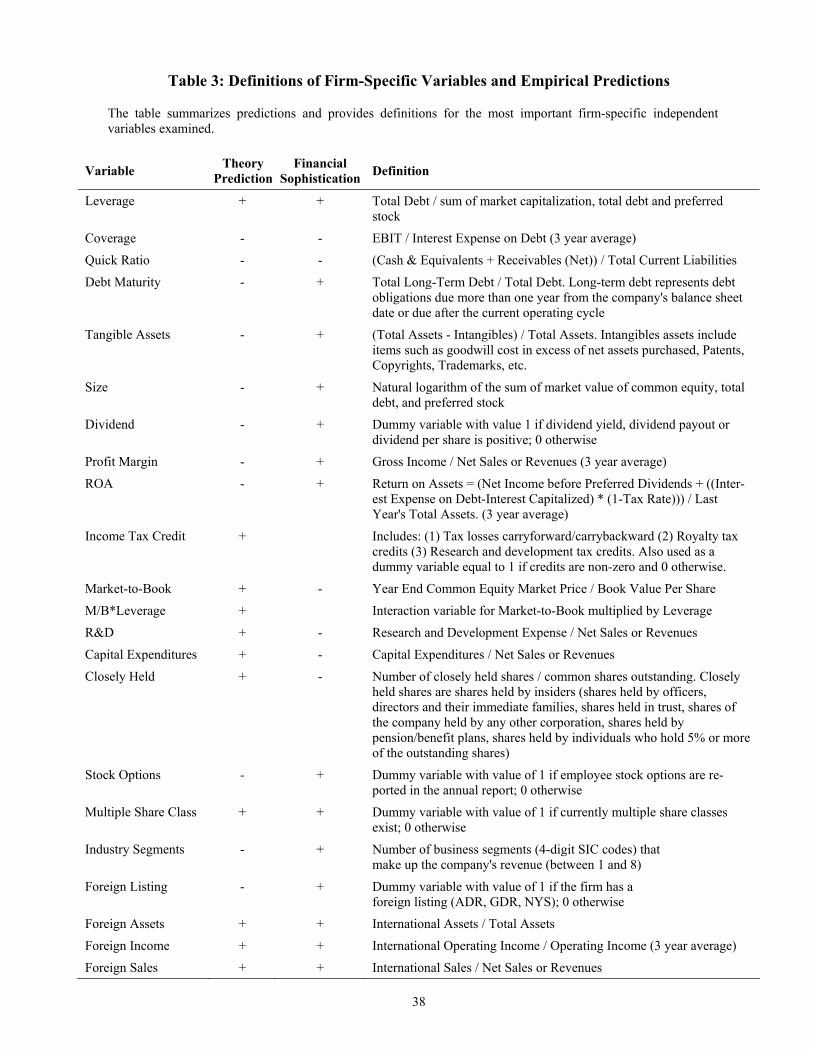
38
Table 3: Definitions of Firm-Specific Variables and Empirical Predictions
The table summarizes predictions and provides definitions for the most important firm-specific independent variables examined.
Variable Theory Prediction
Financial Sophistication Definition
Leverage + + Total Debt / sum of market capitalization, total debt and preferred stock
Coverage - - EBIT / Interest Expense on Debt (3 year average)
Quick Ratio - - (Cash & Equivalents + Receivables (Net)) / Total Current Liabilities
Debt Maturity - + Total Long-Term Debt / Total Debt. Long-term debt represents debt obligations due more than one year from the company's balance sheet date or due after the current operating cycle
Tangible Assets - + (Total Assets - Intangibles) / Total Assets. Intangibles assets include items such as goodwill cost in excess of net assets purchased, Patents, Copyrights, Trademarks, etc.
Size - + Natural logarithm of the sum of market value of common equity, total debt, and preferred stock
Dividend - + Dummy variable with value 1 if dividend yield, dividend payout or dividend per share is positive; 0 otherwise
Profit Margin - + Gross Income / Net Sales or Revenues (3 year average)
ROA - + Return on Assets = (Net Income before Preferred Dividends + ((Inter-est Expense on Debt-Interest Capitalized) * (1-Tax Rate))) / Last Year's Total Assets. (3 year average)
Income Tax Credit + Includes: (1) Tax losses carryforward/carrybackward (2) Royalty tax credits (3) Research and development tax credits. Also used as a dummy variable equal to 1 if credits are non-zero and 0 otherwise.
Market-to-Book + - Year End Common Equity Market Price / Book Value Per Share
M/B*Leverage + Interaction variable for Market-to-Book multiplied by Leverage
R&D + - Research and Development Expense / Net Sales or Revenues
Capital Expenditures + - Capital Expenditures / Net Sales or Revenues
Closely Held + - Number of closely held shares / common shares outstanding. Closely held shares are shares held by insiders (shares held by officers, directors and their immediate families, shares held in trust, shares of the company held by any other corporation, shares held by pension/benefit plans, shares held by individuals who hold 5% or more of the outstanding shares)
Stock Options - + Dummy variable with value of 1 if employee stock options are re-ported in the annual report; 0 otherwise
Multiple Share Class + + Dummy variable with value of 1 if currently multiple share classes exist; 0 otherwise
Industry Segments - + Number of business segments (4-digit SIC codes) that make up the company's revenue (between 1 and 8)
Foreign Listing - + Dummy variable with value of 1 if the firm has a foreign listing (ADR, GDR, NYS); 0 otherwise
Foreign Assets + + International Assets / Total Assets
Foreign Income + + International Operating Income / Operating Income (3 year average)
Foreign Sales + + International Sales / Net Sales or Revenues
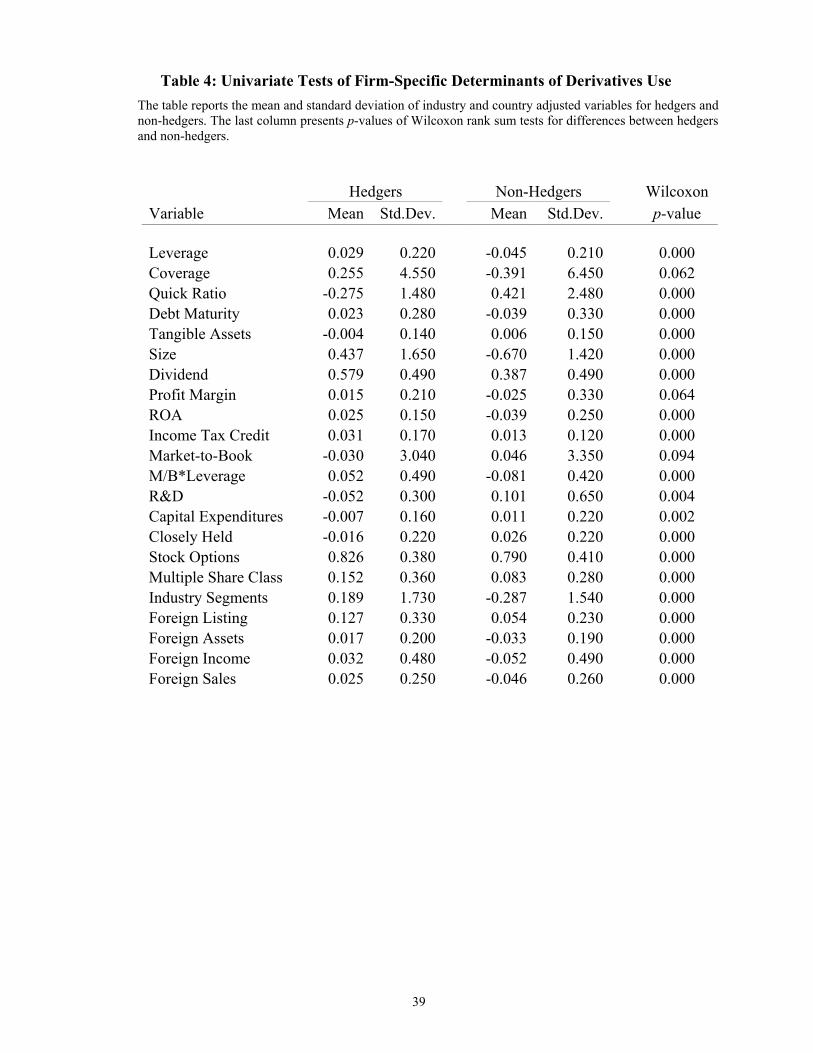
39
Table 4: Univariate Tests of Firm-Specific Determinants of Derivatives Use The table reports the mean and standard deviation of industry and country adjusted variables for hedgers and non-hedgers. The last column presents p-values of Wilcoxon rank sum tests for differences between hedgers and non-hedgers.
Hedgers Non-Hedgers Wilcoxon Variable Mean Std.Dev. Mean Std.Dev. p-value
Leverage 0.029 0.220 -0.045 0.210 0.000 Coverage 0.255 4.550 -0.391 6.450 0.062 Quick Ratio -0.275 1.480 0.421 2.480 0.000 Debt Maturity 0.023 0.280 -0.039 0.330 0.000 Tangible Assets -0.004 0.140 0.006 0.150 0.000 Size 0.437 1.650 -0.670 1.420 0.000 Dividend 0.579 0.490 0.387 0.490 0.000 Profit Margin 0.015 0.210 -0.025 0.330 0.064 ROA 0.025 0.150 -0.039 0.250 0.000 Income Tax Credit 0.031 0.170 0.013 0.120 0.000 Market-to-Book -0.030 3.040 0.046 3.350 0.094 M/B*Leverage 0.052 0.490 -0.081 0.420 0.000 R&D -0.052 0.300 0.101 0.650 0.004 Capital Expenditures -0.007 0.160 0.011 0.220 0.002 Closely Held -0.016 0.220 0.026 0.220 0.000 Stock Options 0.826 0.380 0.790 0.410 0.000 Multiple Share Class 0.152 0.360 0.083 0.280 0.000 Industry Segments 0.189 1.730 -0.287 1.540 0.000 Foreign Listing 0.127 0.330 0.054 0.230 0.000 Foreign Assets 0.017 0.200 -0.033 0.190 0.000 Foreign Income 0.032 0.480 -0.052 0.490 0.000 Foreign Sales 0.025 0.250 -0.046 0.260 0.000
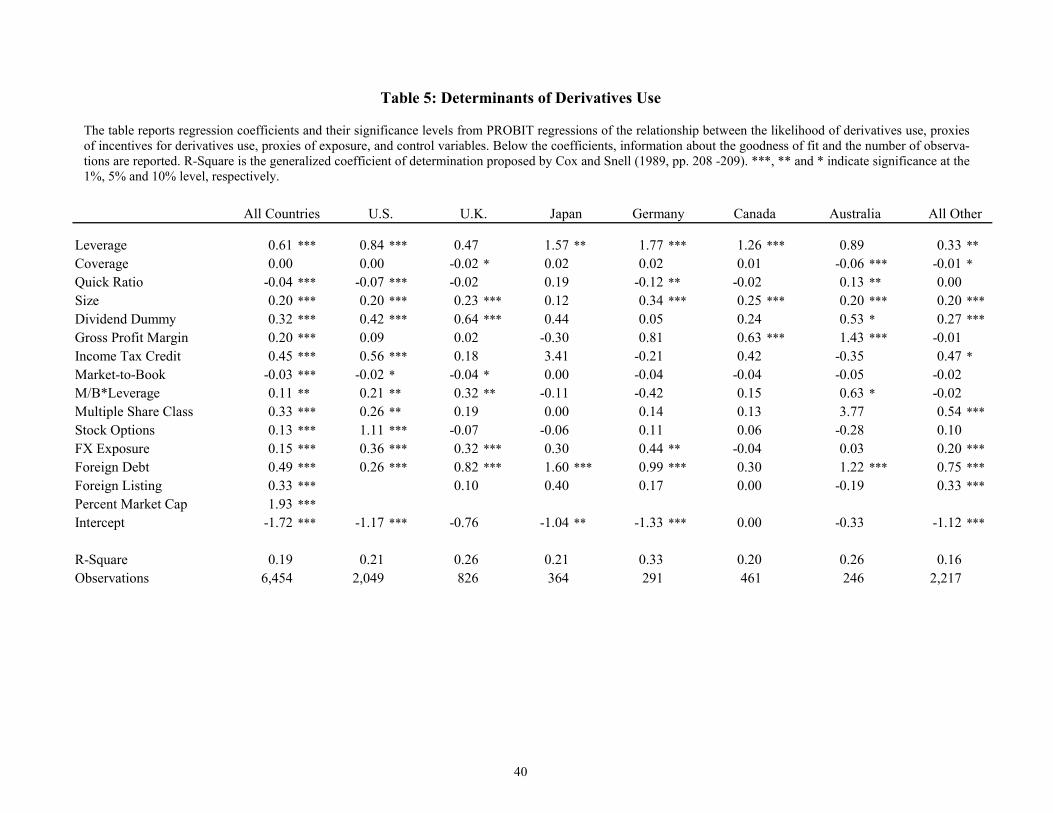
40
Table 5: Determinants of Derivatives Use
The table reports regression coefficients and their significance levels from PROBIT regressions of the relationship between the likelihood of derivatives use, proxies of incentives for derivatives use, proxies of exposure, and control variables. Below the coefficients, information about the goodness of fit and the number of observa-tions are reported. R-Square is the generalized coefficient of determination proposed by Cox and Snell (1989, pp. 208 -209). ***, ** and * indicate significance at the 1%, 5% and 10% level, respectively.
Leverage 0.61 *** 0.84 *** 0.47 1.57 ** 1.77 *** 1.26 *** 0.89 0.33 **Coverage 0.00 0.00 -0.02 * 0.02 0.02 0.01 -0.06 *** -0.01 *Quick Ratio -0.04 *** -0.07 *** -0.02 0.19 -0.12 ** -0.02 0.13 ** 0.00Size 0.20 *** 0.20 *** 0.23 *** 0.12 0.34 *** 0.25 *** 0.20 *** 0.20 ***Dividend Dummy 0.32 *** 0.42 *** 0.64 *** 0.44 0.05 0.24 0.53 * 0.27 ***Gross Profit Margin 0.20 *** 0.09 0.02 -0.30 0.81 0.63 *** 1.43 *** -0.01Income Tax Credit 0.45 *** 0.56 *** 0.18 3.41 -0.21 0.42 -0.35 0.47 *Market-to-Book -0.03 *** -0.02 * -0.04 * 0.00 -0.04 -0.04 -0.05 -0.02M/B*Leverage 0.11 ** 0.21 ** 0.32 ** -0.11 -0.42 0.15 0.63 * -0.02Multiple Share Class 0.33 *** 0.26 ** 0.19 0.00 0.14 0.13 3.77 0.54 ***Stock Options 0.13 *** 1.11 *** -0.07 -0.06 0.11 0.06 -0.28 0.10FX Exposure 0.15 *** 0.36 *** 0.32 *** 0.30 0.44 ** -0.04 0.03 0.20 ***Foreign Debt 0.49 *** 0.26 *** 0.82 *** 1.60 *** 0.99 *** 0.30 1.22 *** 0.75 ***Foreign Listing 0.33 *** 0.10 0.40 0.17 0.00 -0.19 0.33 ***Percent Market Cap 1.93 ***Intercept -1.72 *** -1.17 *** -0.76 -1.04 ** -1.33 *** 0.00 -0.33 -1.12 ***
R-Square 0.19 0.21 0.26 0.21 0.33 0.20 0.26 0.16Observations 6,454 2,049 826 364 291 461 246 2,217
Germany Canada Australia All OtherAll Countries U.S. U.K. Japan
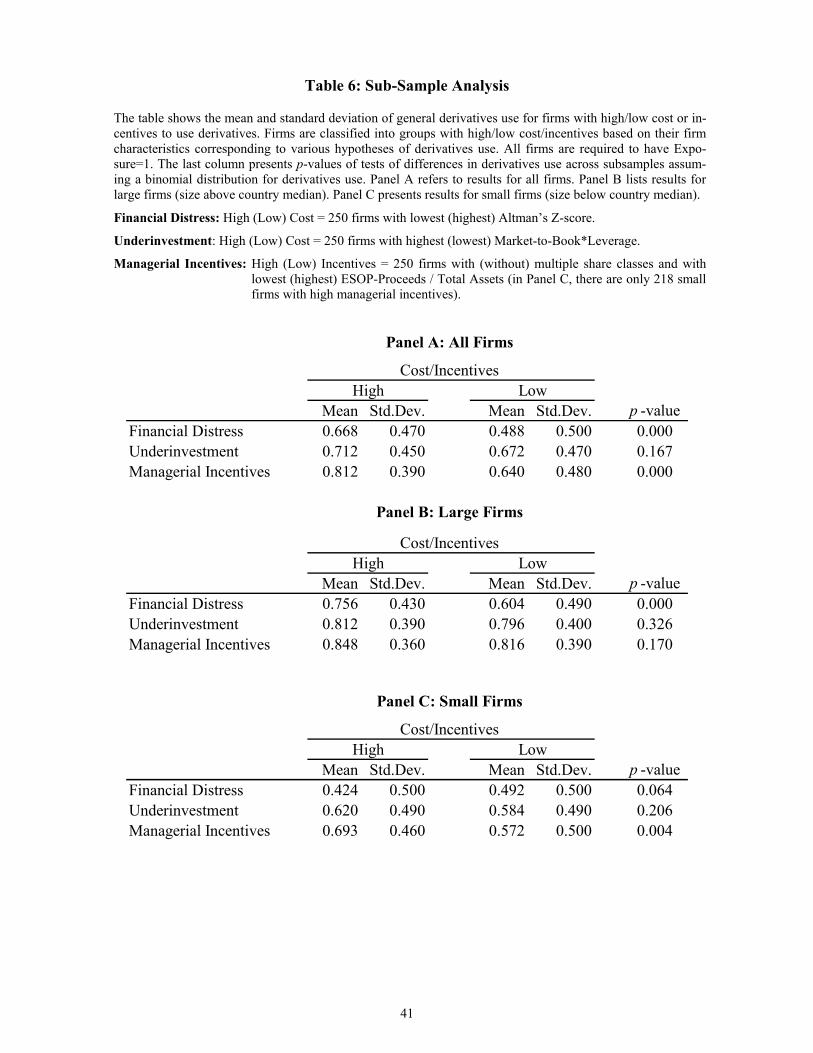
41
Table 6: Sub-Sample Analysis
The table shows the mean and standard deviation of general derivatives use for firms with high/low cost or in-centives to use derivatives. Firms are classified into groups with high/low cost/incentives based on their firm characteristics corresponding to various hypotheses of derivatives use. All firms are required to have Expo-sure=1. The last column presents p-values of tests of differences in derivatives use across subsamples assum-ing a binomial distribution for derivatives use. Panel A refers to results for all firms. Panel B lists results for large firms (size above country median). Panel C presents results for small firms (size below country median).
Financial Distress: High (Low) Cost = 250 firms with lowest (highest) Altman’s Z-score.
Underinvestment: High (Low) Cost = 250 firms with highest (lowest) Market-to-Book*Leverage.
Managerial Incentives: High (Low) Incentives = 250 firms with (without) multiple share classes and with lowest (highest) ESOP-Proceeds / Total Assets (in Panel C, there are only 218 small firms with high managerial incentives).
Panel A: All Firms
Cost/Incentives
Mean Std.Dev. Mean Std.Dev. p -valueFinancial Distress 0.668 0.470 0.488 0.500 0.000Underinvestment 0.712 0.450 0.672 0.470 0.167Managerial Incentives 0.812 0.390 0.640 0.480 0.000
Panel B: Large Firms
Cost/Incentives
Mean Std.Dev. Mean Std.Dev. p -valueFinancial Distress 0.756 0.430 0.604 0.490 0.000Underinvestment 0.812 0.390 0.796 0.400 0.326Managerial Incentives 0.848 0.360 0.816 0.390 0.170
Panel C: Small Firms
Cost/Incentives
Mean Std.Dev. Mean Std.Dev. p -valueFinancial Distress 0.424 0.500 0.492 0.500 0.064Underinvestment 0.620 0.490 0.584 0.490 0.206Managerial Incentives 0.693 0.460 0.572 0.500 0.004
High Low
High Low
High Low
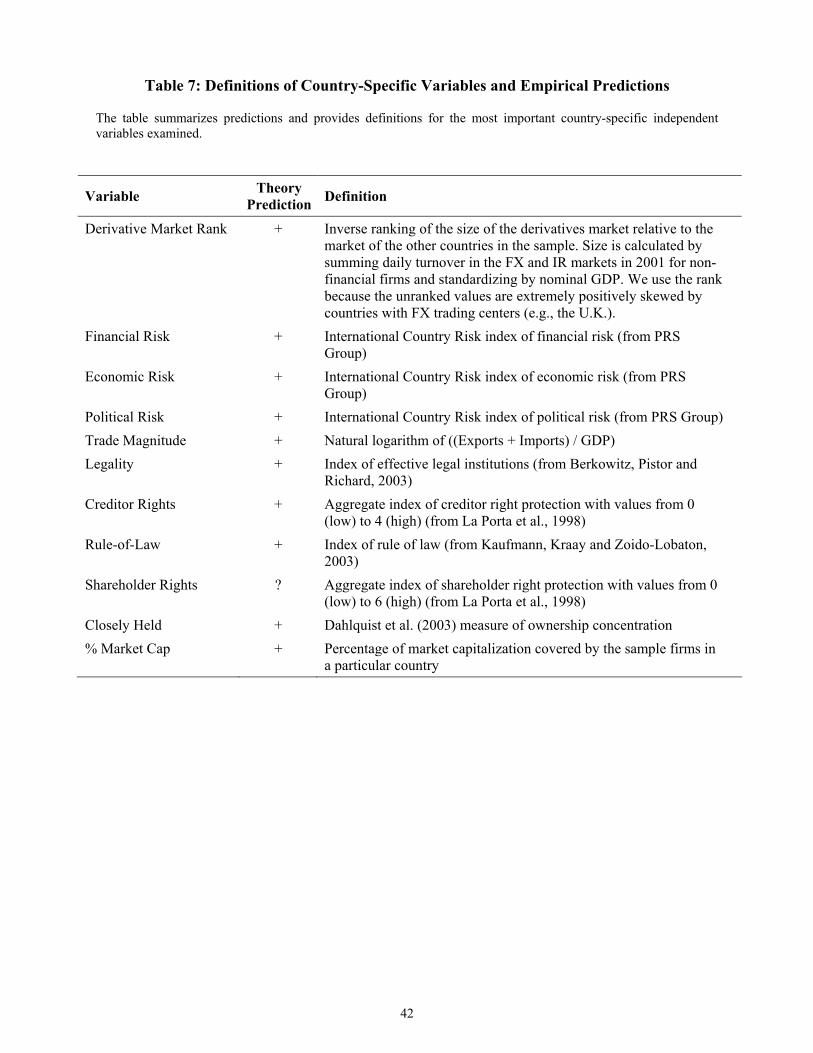
42
Table 7: Definitions of Country-Specific Variables and Empirical Predictions
The table summarizes predictions and provides definitions for the most important country-specific independent variables examined.
Variable Theory Prediction Definition
Derivative Market Rank + Inverse ranking of the size of the derivatives market relative to the market of the other countries in the sample. Size is calculated by summing daily turnover in the FX and IR markets in 2001 for non-financial firms and standardizing by nominal GDP. We use the rank because the unranked values are extremely positively skewed by countries with FX trading centers (e.g., the U.K.).
Financial Risk + International Country Risk index of financial risk (from PRS Group)
Economic Risk + International Country Risk index of economic risk (from PRS Group)
Political Risk + International Country Risk index of political risk (from PRS Group) Trade Magnitude + Natural logarithm of ((Exports + Imports) / GDP) Legality + Index of effective legal institutions (from Berkowitz, Pistor and
Richard, 2003) Creditor Rights + Aggregate index of creditor right protection with values from 0
(low) to 4 (high) (from La Porta et al., 1998) Rule-of-Law + Index of rule of law (from Kaufmann, Kraay and Zoido-Lobaton,
2003) Shareholder Rights ? Aggregate index of shareholder right protection with values from 0
(low) to 6 (high) (from La Porta et al., 1998) Closely Held + Dahlquist et al. (2003) measure of ownership concentration % Market Cap + Percentage of market capitalization covered by the sample firms in
a particular country

43
Table 8: Univariate Tests of Country-Specific Determinants of Derivatives Use The table shows the mean and standard deviation of different variables for hedgers and non-hedgers. The last column presents p-values from Wilcoxon rank sum tests for differences between hedgers and non-hedgers.
WilcoxonVariable Mean Std.Dev. Mean Std.Dev. p -value
Derivative Market Rank 38.12 9.26 35.91 11.58 0.000OECD Membership 0.89 0.31 0.75 0.43 0.000GDP per Capita 27.02 8.86 24.11 9.93 0.000Financial Risk 38.42 3.71 38.89 3.44 0.000Economic Risk 42.18 2.13 42.10 2.12 0.000Political Risk 85.89 7.42 83.38 9.21 0.000Trade Magnitude 3.80 0.78 4.15 0.94 0.000Legality 20.18 1.83 19.74 2.08 0.000Creditor Rights 1.94 1.25 2.32 1.38 0.000Rule-of-Law 1.37 0.40 1.32 0.42 0.000Shareholder Rights 4.13 1.28 4.05 1.38 0.055Closely Held 0.26 0.19 0.31 0.20 0.000
Hedger Nonhedger
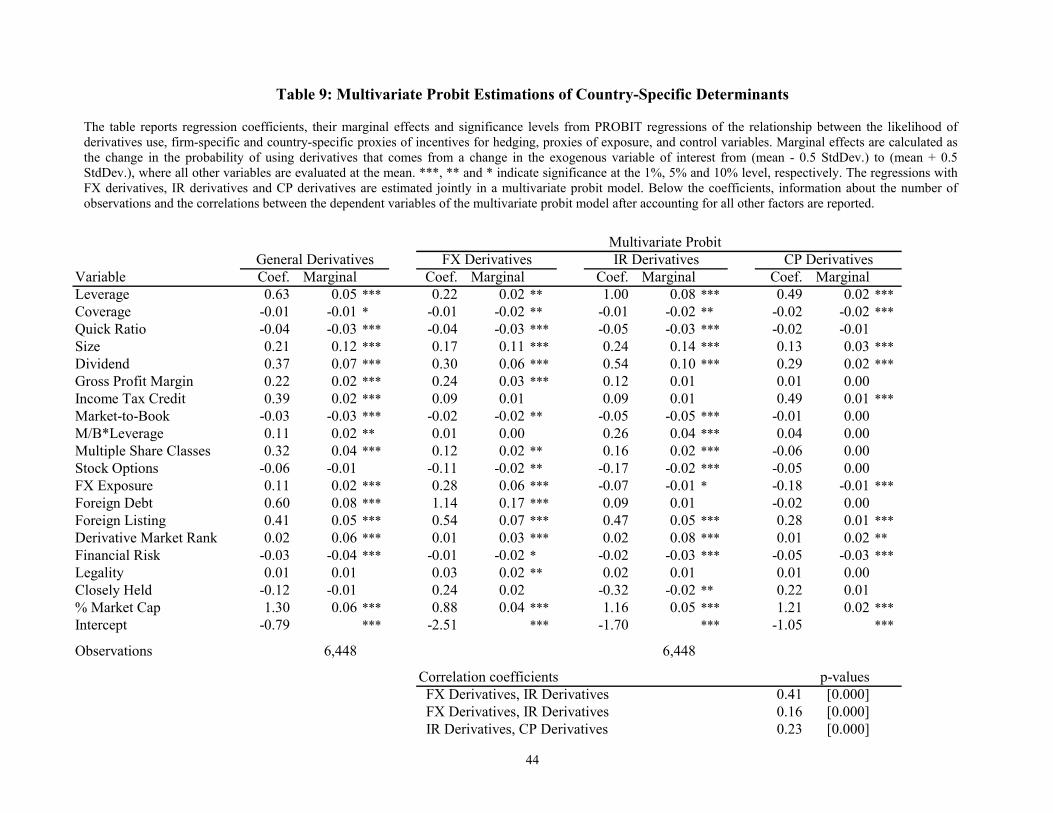
44
Table 9: Multivariate Probit Estimations of Country-Specific Determinants
The table reports regression coefficients, their marginal effects and significance levels from PROBIT regressions of the relationship between the likelihood of derivatives use, firm-specific and country-specific proxies of incentives for hedging, proxies of exposure, and control variables. Marginal effects are calculated as the change in the probability of using derivatives that comes from a change in the exogenous variable of interest from (mean - 0.5 StdDev.) to (mean + 0.5 StdDev.), where all other variables are evaluated at the mean. ***, ** and * indicate significance at the 1%, 5% and 10% level, respectively. The regressions with FX derivatives, IR derivatives and CP derivatives are estimated jointly in a multivariate probit model. Below the coefficients, information about the number of observations and the correlations between the dependent variables of the multivariate probit model after accounting for all other factors are reported.
Multivariate Probit
Variable Coef. Marginal Coef. Marginal Coef. Marginal Coef. MarginalLeverage 0.63 0.05 *** 0.22 0.02 ** 1.00 0.08 *** 0.49 0.02 ***Coverage -0.01 -0.01 * -0.01 -0.02 ** -0.01 -0.02 ** -0.02 -0.02 ***Quick Ratio -0.04 -0.03 *** -0.04 -0.03 *** -0.05 -0.03 *** -0.02 -0.01Size 0.21 0.12 *** 0.17 0.11 *** 0.24 0.14 *** 0.13 0.03 ***Dividend 0.37 0.07 *** 0.30 0.06 *** 0.54 0.10 *** 0.29 0.02 ***Gross Profit Margin 0.22 0.02 *** 0.24 0.03 *** 0.12 0.01 0.01 0.00Income Tax Credit 0.39 0.02 *** 0.09 0.01 0.09 0.01 0.49 0.01 ***Market-to-Book -0.03 -0.03 *** -0.02 -0.02 ** -0.05 -0.05 *** -0.01 0.00M/B*Leverage 0.11 0.02 ** 0.01 0.00 0.26 0.04 *** 0.04 0.00Multiple Share Classes 0.32 0.04 *** 0.12 0.02 ** 0.16 0.02 *** -0.06 0.00Stock Options -0.06 -0.01 -0.11 -0.02 ** -0.17 -0.02 *** -0.05 0.00FX Exposure 0.11 0.02 *** 0.28 0.06 *** -0.07 -0.01 * -0.18 -0.01 ***Foreign Debt 0.60 0.08 *** 1.14 0.17 *** 0.09 0.01 -0.02 0.00Foreign Listing 0.41 0.05 *** 0.54 0.07 *** 0.47 0.05 *** 0.28 0.01 ***Derivative Market Rank 0.02 0.06 *** 0.01 0.03 *** 0.02 0.08 *** 0.01 0.02 **Financial Risk -0.03 -0.04 *** -0.01 -0.02 * -0.02 -0.03 *** -0.05 -0.03 ***Legality 0.01 0.01 0.03 0.02 ** 0.02 0.01 0.01 0.00Closely Held -0.12 -0.01 0.24 0.02 -0.32 -0.02 ** 0.22 0.01% Market Cap 1.30 0.06 *** 0.88 0.04 *** 1.16 0.05 *** 1.21 0.02 ***Intercept -0.79 *** -2.51 *** -1.70 *** -1.05 ***
Observations 6,448 6,448
Correlation coefficients p-values FX Derivatives, IR Derivatives 0.41 [0.000] FX Derivatives, IR Derivatives 0.16 [0.000] IR Derivatives, CP Derivatives 0.23 [0.000]
CP DerivativesIR DerivativesFX DerivativesGeneral Derivatives
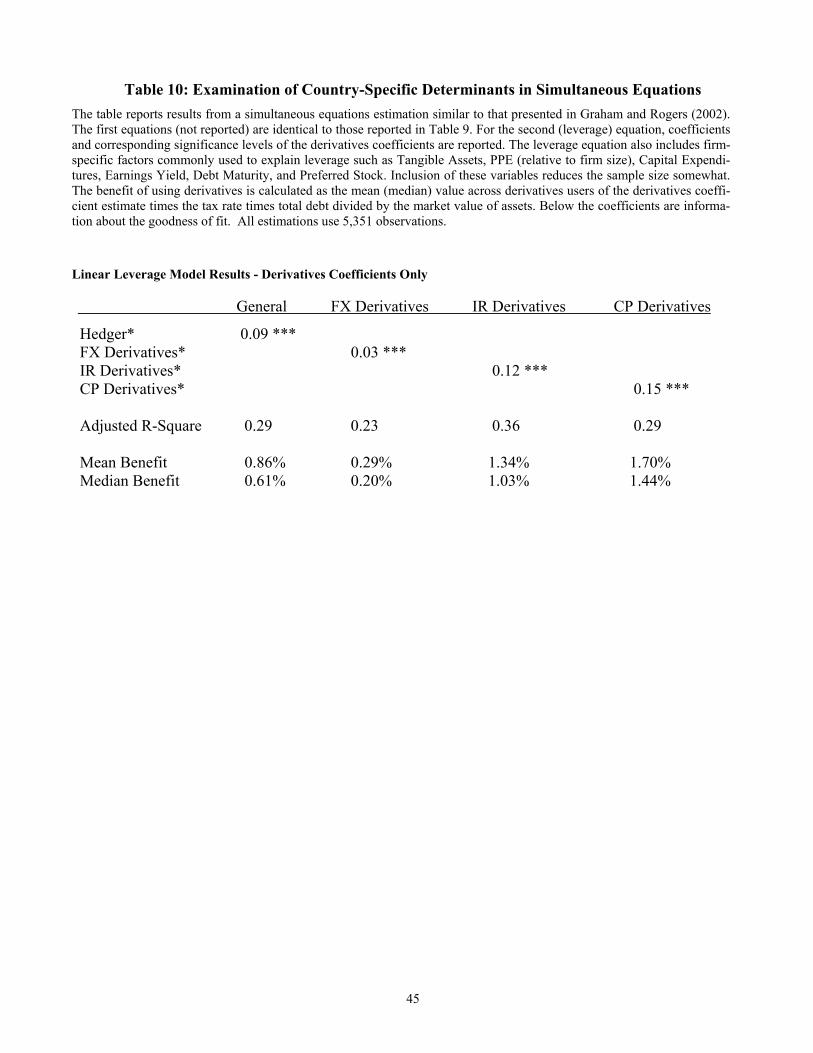
45
Table 10: Examination of Country-Specific Determinants in Simultaneous Equations The table reports results from a simultaneous equations estimation similar to that presented in Graham and Rogers (2002). The first equations (not reported) are identical to those reported in Table 9. For the second (leverage) equation, coefficients and corresponding significance levels of the derivatives coefficients are reported. The leverage equation also includes firm-specific factors commonly used to explain leverage such as Tangible Assets, PPE (relative to firm size), Capital Expendi-tures, Earnings Yield, Debt Maturity, and Preferred Stock. Inclusion of these variables reduces the sample size somewhat. The benefit of using derivatives is calculated as the mean (median) value across derivatives users of the derivatives coeffi-cient estimate times the tax rate times total debt divided by the market value of assets. Below the coefficients are informa-tion about the goodness of fit. All estimations use 5,351 observations.
Linear Leverage Model Results - Derivatives Coefficients Only General FX Derivatives IR Derivatives CP Derivatives
Hedger* 0.09 *** FX Derivatives* 0.03 *** IR Derivatives* 0.12 *** CP Derivatives* 0.15 *** Adjusted R-Square 0.29 0.23 0.36 0.29 Mean Benefit 0.86% 0.29% 1.34% 1.70% Median Benefit 0.61% 0.20% 1.03% 1.44%

46
Table 11: Multivariate Analysis of Value Effects of Derivatives Use
The table reports the coefficients and significance levels of multivariate tests with Tobin’s Q. ***, ** and * indicate significance at the 1%, 5% and 10% level, re-spectively. Below the coefficients, information about the goodness of fit and the number of observations are reported. OLS regressions are estimated separately for firms with low and high exposure. Tobin’s Q is defined as the natural logarithm of the market value of common equity plus the book value of total debt plus the book value of preferred stock all divided by the book value of total assets.
General Derivatives FX Derivatives IR Derivatives CP DerivativesLow Exposure High Exposure Low Exposure High Exposure Low Exposure High Exposure Low Exposure High Exposure
Derivatives 0.09 * 0.00 0.04 -0.02 0.13 *** 0.05 *** 0.03 -0.04Leverage -2.22 *** -1.38 *** -1.19 *** -1.43 *** -2.83 *** -0.87 *** -1.45 *** -1.05 ***Total Assets (log) -0.04 ** 0.00 -0.03 *** 0.00 -0.01 0.00 0.00 0.00Dividend -0.03 -0.10 *** -0.10 *** -0.09 *** -0.04 -0.06 *** -0.10 *** -0.09 **ROA -0.05 0.34 *** -0.06 0.36 *** 0.13 * 0.38 *** 0.16 *** 0.12Foreign Sales 0.18 *** 0.19 *** 0.18 *** 0.04 0.14 *** 0.06Industry Segments 0.00 -0.01 * 0.00 -0.01 * -0.02 ** -0.01 -0.01 ** 0.01% Market Cap 2.02 -1.08 -0.70 -0.87 -0.55 -0.46 0.28 -1.22Intercept -0.49 1.56 ** 1.38 1.43 1.34 0.67 0.62 1.43 *
Observations 1,526 4,354 3,129 3,686 2,352 2,565 4,271 646Adjusted R-Squared 0.25 0.41 0.37 0.42 0.25 0.30 0.40 0.39