Embed Size (px)
Citation preview
International Conference on Solid Waste 2011 Moving Towards Sustainable Resource Management
Landfill Management
682 Proceedings of the International Conference on Solid Waste 2011- Moving Towards Sustainable Resource Management,
Hong Kong SAR, P.R. China, 2 – 6 May 2011
RECOVERABLE WASTE AND RESOURCES IN OLD LANDFILLS A. Bockreis *, J. Knapp
Unit of Environmental Engineering, University of Innsbruck, Austria * Corresponding author: [email protected], Tel: +43-512 507-6921
ABSTRACT Landfill mining is not a new approach but there are different reasons why it is done. This paper analyses the amounts and types of resources contained in German and Austrian landfills with a special focus on Tyrolean landfills. Based on available data a theoretical estimation of the potential of recoverable metals in Tyrolean landfills for future use as secondary raw materials is made. During 1945 and 2008 12.6 million m³ were landfilled in Tyrol mainly consisting of municipal and commercial solid waste as well as construction and bulky waste. Based on the composition of the municipal solid waste in Tyrol a relatively high amount of metals was estimated which could lead to a benefit when excavating these landfills for recycling. But the decision for landfill mining depends on the specific composition and circumstance of each single landfill and should be evaluated before.
Keywords: Landfill mining, Tyrolean landfills, Recoverable waste, Resources
Introduction
Basis for a modern solid waste management is the recovery of materials and energy from wastes. But landfilling solid wastes without prior recovery of materials and energy is still a conventional treatment option for residual waste in a lot of countries. An exception are European Countries, i.e. Austria and Germany, where landfilling of wastes without pre-treatment is forbidden since 2004 resp. 2005. Moreover, in Germany and Austria, there are still a lot of recyclables to be found in landfills, especially in the older ones. Combined with an expected shortage of many primary resources and thereby increasing prices for secondary raw materials the focus gets on the recyclables (e.g. metals) contained in landfills. The method of excavating and processing wastes from landfills – called landfill mining - is not a new approach and has already been described (for example [1-4]), and apart from the recovery of secondary materials and energy, there are other benefits of excavating and processing solid wastes from landfills, such as the elimination of an existing or potential contamination source, the conservation of landfill space, the reduction in landfill area, the reduction of post-closure costs and site redevelopment [1-3].
Materials and Methods
In principle, there is no general conclusion which potential of resources is to be expected in older landfills. The potential can only be determined site or landfill specific.
There are different approaches to determine the theoretical potential of resources contained in landfills. Based on this a projection for specific regions or countries can be made, cp. [1-5].
Basis for the calculation of the potential of resources in Tyrolean landfills were information on the composition of wastes obtained from sorting analyses and the total amount of landfilled waste.
Results and Discussion
Amounts and Compositions of Wastes Landfilled in Tyrol
In total, there are 648 former waste disposal sites registered in Tyrol. Most of them have been relatively small municipal waste disposal sites with an average volume of 10,000 to 50,000 m³ [1]. All of them have been closed until the beginning of 1993. 19 larger landfills for residual solid waste have been in operation in Tyrol between 1942 and 2008 with a total volume of 12,607,000 m³. 12 of them have been closed until 1994 and the remaining regional landfills have been closed for residual wastes until the end of 2008. The two largest Tyrolean landfills have a volume of 3.4 and 3 million m³.
Since 1998 information on waste landfilled in Tyrol is stored electronically by the Tyrolean Regional Government (Department of Environment, Division of Waste Management). Therefore, the amounts and compositions of the four largest Tyrolean landfills in operation between 1998 and 2008 have been analysed. Summing up the different fractions of all four landfills, it can be seen that the largest fraction considering all

Proceedings of the International Conference on Solid Waste 2011- Moving Towards Sustainable Resource Management,
Hong Kong SAR, P.R. China, 2 – 6 May 2011 683
landfills is “municipal solid waste and similar commercial wastes” with 1.36 million tons and 60%, followed by bulky waste with 274,000 tons and 12% and construction waste with 178,000 tons and 8%. [5]
For the oldest and second largest Tyrolean landfill (operated from 1942 to 1976 with a volume of around 3 million m³) - there are no detailed data about the landfilled wastes available. Only the general information that mainly municipal waste and bulky waste, but also sewage sludge, commercial and industrial waste, as well as construction waste and excavated soil were landfilled there. However, the composition of wastes in this landfill has been analysed in 1998 by the consulting company TBU within the process of assessing contaminated sites in Austria. The largest faction is the fraction of stones/inert material with 43%, followed by the fraction of material < 1 mm with 19%.
The comparison of the sorting analysis of the Tyrolean landfill with sorting analyses of other landfills demonstrates that the compositions of different landfills vary considerably depending for example on the type of landfilled waste, the time when it was landfilled, etc. These results match with findings of Rettenberger, who noticed that excavated wastes of a municipal waste landfill generally consist of 60-70 % fine material (< 40 mm), and the remaining part consists one half each of a light fraction (plastic, textiles, paper) and a heavy fraction (rubble, metal, wood, etc.) [1].
Potential of Resources Contained in Landfills in Austria and Germany
Regarding all landfills with its inventory, the estimated amount of landfilled wastes in Germany is 2,500 million tons [2]. Without considering the landfills in the former German Democratic Republic (GDR) the amount of resources in household waste and similar commercial waste including sewage sludge alone are [3]:
� Approximately 8 million TJ heating value = 2, 300 TWh energy content � Approximately 26 million tons ferrous scrap � Approximately 850,000 tons cupper scrap � Approximately 500,000 tons aluminium scrap � Approximately 650,000 tons phosphate.
With these resources contained in the German landfills the following amounts of the average German annual consumption of raw materials could be covered [3]:
� 58% of the primary energy � 124% of iron � 57% of copper � 22% of aluminium.
Based on an estimated amount of landfilled wastes of 158 million tons in Austria [4] there is a potential of resources of 3.31 million tons of metals assuming an average metal content of 2.1% (average composition of an investigation in Germany and Austria). The consumption of metals in Austria is increasing very rapidly and was in the range of 10 million tons in the year 2007 [5]. Thus the potential of resources regarding the metals in Austrian landfills is corresponding with a third of the consumption of metals in Austria in 2007.
In the federal state Tyrol, wastes comprising mainly of household waste, similar commercial waste, bulky and construction waste was landfilled in a landfill volume of approx. 13 million m³ during the time period of 1945 – 2008 [6]. Investigations on the composition of the Tyrolean waste have shown that the amount of metals is probably to be expected in the higher range of 3.75%. Based on this estimation there is a potential of resources of 0.25 up to 0.46 million tons for metals contained in Tyrolean landfills.
Conclusions
Considering the expected shortage of some resources in the near future the focus gets on the resources contained in landfills. The main requirement, when recovering resources from old landfills, is to take into account the economical as well as ecological aspects. The assessment of the potential of resources in Austrian and German landfills shows the percentage of the annual consumption for specific resources that can be covered with the materials contained in the landfills.
684 Proceedings of the International Conference on Solid Waste 2011- Moving Towards Sustainable Resource Management,
Hong Kong SAR, P.R. China, 2 – 6 May 2011
The assessment of Tyrolean landfills, based on literature study, interviews and analysis of data provided by the Tyrolean Regional Government, showed that there are no landfills with large mono charges or landfills, where mainly industrial residues have been disposed of. The main component of Tyrolean landfills is municipal waste with 60-80% followed by bulky waste with 12-15% and waste from construction sites with around 8%. The decision for excavating and processing the wastes from old landfills will always be a site specific decision depending on parameters such as included wastes, post-closure costs, danger of contamination, already installed liner system, demand for land, etc. For that reason selected Tyrolean landfills will be examined closer in further studies.
References [1] W. Hogland, M. Marques, and S. Nimmermark. 2004. Landfill mining and waste characterization: a
strategy for remediation of contaminated areas. Journal of Material Cycles and Waste Management. 6: 119-124.
[2] Bockreis, A. and J. Jager. 2009. Waste-economical reconstruction of old landfills, in SARDINIA.2009.
[3] G. Rettenberger. 2010. Deponierückbau: Technik, Wirtschaftlichkeit, Perspektiven. In Deponietechnik 2010. Hamburg: Verlag Abfall aktuell.
[4] G. Rettenberger, and G. Becker. 2010. Gewinnung von Wertstoffen aus Deponierückbau unter Einbeziehung der MBA-Technologie, in Internationale 8. ASA Abfalltage MBA-Technologie - Schaltstelle für Stoffströme und Energieeffizienz. Hannover. 331-348.
[5] J. Knapp, and A. Bockreis. 2010. Potential of Recoverable Wastes in Tyrolean Landfills, in ISWA World Congress 2010. ISWA International Solid Waste Association.
[6] S. Gäth, and J. Nispel. 2010. Ressourcenpotenzial von ausgewählten Hausmülldeponien in Deutschland. in DepoTech Konferenz. Leoben, Österreich: Eigenverlag, Montanuniversität Leoben, Institut für Nachhaltige Abfallwirtschaft und Entsorgungstechnik (IAE).
[7] J. Knapp and A. Bockreis. 2010. Rohstoffpotenziale in Tiroler Deponien. in DepoTech Konferenz. Leoben, Österreich: Eigenverlag, Montanuniversität Leoben, Institut für Nachhaltige Abfallwirtschaft und Entsorgungstechnik (IAE).
[8] M. Franke, M. Mocker, and M. Faulstich. 2010. Resource Potential of Landfill Mining – A National and Regional Evaluation. In ISWA World Congress 2010. Hamburg: ISWA International Solid Waste Association
[9] G. Rettenberger. 2010. Die Deponie als Ressourcenquelle. UmweltMagazin, 02: 40-42. [10] K. Wiemer, B. Bartsch, and H. Schmeisky. 2009. Deponien als Rohstofflagerstätten von morgen -
Ergebnisse einer hessenweiten Untersuchung. In Kasseler Abfallforum Bio- und Sekundärrohstoffverwertung IV.
[11] M. Reitmeier. Amt der Tiroler Landesregierung, Abteilung Umweltschutz, Referat Abfallwirtschaft. [12] Amt der Tiroler Landesregierung, Abteilung Umweltschutz, Referat Abfallwirtschaft. 2010. Daten
zur Deponierung mit Standortname, SNr, Spezifikation, Bezeichnung und Masse in t von 1998 bis 2008.
[13] M. Mocker, et al. 2009. Urban Mining - Rohstoffe der Zukunft. Müll und Abfall, (10): 492-501. [14] T. Patz, T., S. Giljum, and C. Manstein. 2010. Der österreichische Ressourceneffizienz Aktionsplan
(REAP). http://www.nachhaltigkeit.at/article/articleview/82975/1/25540 access 12.12.2010.

Proceedings of the International Conference on Solid Waste 2011- Moving Towards Sustainable Resource Management,
Hong Kong SAR, P.R. China, 2 – 6 May 2011 685
RESTORATION AND AFTERCARE OF CLOSED LANDFILLS IN HONG KONG J.K.F. Ng *, D.C.H. Fung, A.Y.W. Ng
Environmental Protection Department, Hong Kong Special Administrative Region Government, P.R. China * Corresponding author. Tel: +852 28721802, Fax: +852 25916662, E-mail: [email protected]
ABSTRACT There are thirteen old landfills in Hong Kong and they collectively occupy a total area of about 300 hectares. They were closed between 1977 and 1996. A restoration programme has been implemented by the Environmental Protection Department (EPD) of the Hong Kong Special Administrative Region Government (the Government) since 1996 to minimise their potential adverse impacts on the environment and to render them safe for beneficial use.
Restoration of a closed landfill involves mainly construction of a final capping system, a landfill gas management system and a leachate management system as well as slope stabilisation, landscaping and other ancillary engineering works. Restoration works of all these thirteen landfills were completed in a decade between 1997 and 2006 and the completed restoration facilities have been commissioned immediately after completion.
Due to continuous degradation of waste, the restored landfills will continue to produce landfill gas, leachate and differential settling for many years. Following the completion of the restoration facilities, aftercare works comprising operation and maintenance of the restoration facilities and environmental monitoring is required to ensure whether the sites are safe for afteruse development. Given the considerable restrictions on afteruse development, use of the sites predominately for recreational uses is a desirable option. Many of the restored landfills have been successfully developed into recreational facilities either by the Government or by national sports associations.
This paper outlines the landfill restoration programme in Hong Kong, the design of restoration works, the aftercare of the restored landfills as well as the afteruse facilities. It also aims to share Hong Kong’s experience on landfill restoration and afteruse with other countries that face the need to restore old landfills.
Keywords: Restoration, Aftercare, Afteruse, Closed landfills
686 Proceedings of the International Conference on Solid Waste 2011- Moving Towards Sustainable Resource Management,
Hong Kong SAR, P.R. China, 2 – 6 May 2011
ENRICHMENT OF AEROBIC AND ANAEROBIC AMMONIUM OXIDISING BACTERIA FROM MUNICIPAL SOLID WASTE AND LEACHATE
S. Sri Shalini 1*, K. Joseph 2 1Research Scholar, Centre for Environmental Studies, Anna University, Chennai, India
2Associate Professor, Centre for Environmental Studies, Anna University, Chennai, India *Corresponding author. Tel: 91-44-22301283, Fax: 091-44-22354717, E-mail: [email protected]
ABSTRACT Leachate from the municipal solid waste landfills contains high concentration of ammoniacal nitrogen. Ammoniacal nitrogen removal based on the combination of partial nitrification and anaerobic ammonium oxidation (anammox) process requires aerobic ammonium oxidising bacteria (AOB) and anaerobic ammonium oxidising bacteria (AnAOB). This study investigates the feasibility of enriching the AOB and AnAOB using fresh and mined municipal solid waste and leachate as seed. Batch experiments were carried out under aerobic and anaerobic condition with varying feed to seed ratio. The AOB and AnAOB activity was monitored by measuring the intermediates such as hydroxylamine and hydrazine along with ammoniacal nitrogen, nitrite nitrogen and nitrate nitrogen concentrations. The formation of the intermediates such as hydroxylamine and hydrazine and ammoniacal nitrogen transformation data confirmed the enrichment of the AOB and AnAOB.
Keywords: Landfill leachate, Ammoniacal nitrogen removal, Aerobic ammonium oxidizing bacteria, Anammox bacteria, Feed to seed
Introduction
Leachate generated from landfills contains high concentration of organics, ammoniacal nitrogen and toxic pollutants leached from the unsorted Municipal Solid Waste (MSW) containing high concentration of organic carbon (10–40% of TS) and nitrogen (1.0 and 4.0% of TS) [1]. The ammoniacal nitrogen in leachate (around 500-3000 mg/L) has to be removed due to its aquatic toxicity, high oxygen demand in receiving waters, impact on post-closure monitoring requirements. [2]. Several biological processes are available for the removal of ammoniacal nitrogen from leachate. The conventional process of nitrification involves the oxidation of ammoniacal nitrogen to nitrite by ammonium oxidising bacteria, followed by the oxidation of nitrite by nitrite-oxidising bacteria. The denitrification step reduces the nitrate or nitrite to nitrogen gas by denitrifying bacteria [3]. The conventional treatment processes require oxygen supply for nitrification and external carbon supplementation for denitrification [4]. It will also contribute to nitrous oxide emissions. The novel way to remove ammoniacal nitrogen from leachate is the combination of SHARON-ANAMMOX process. The Single reactor system for High activity Ammonia Removal Over Nitrite (SHARON) process is a partial nitrification process in which the oxidation of ammonia to nitrite over hydroxylamine (NH2OH) is carried out by aerobic ammonia-oxidizing bacteria (AOB) [5]. In the Anaerobic Ammonium Oxidation (ANAMMOX) process the ammonia is oxidised anaerobically using the nitrite produced in the previous SHARON process as electron acceptor as in Eq. (1) by anaerobic ammonium oxidising bacteria (AnAOB) like Candidatus Brocadia anammoxidans and Candidatus Kuenenia stuttgartiensis [6].
NH4++ 1.32NO2
- + 0.066 HCO3- + 0.13 H+ 1.02 N2+ 0.26NO3
-+ 0.066CH2O0.5N0.15+ 2.03H20 (1)
This combined process doesn’t require external carbon addition. It reduces the sludge generation, aeration requirements and emission of nitrous oxide [7, 8]. But, the application of this combined process is limited by the availability of AOB and AnAOB biomass. The purpose of this present study is to enrich AOB and AnAOB from the Fresh and Mined MSW and Landfill Leachate. This would make the application of SHARON-ANAMMOX process feasible with the availability of biomass.
Materials and Methods
Fresh mined MSW (2 to 3 years old), leachate and slurry (containing MSW and leachate) from a MSW dumpsite in Tamil Nadu, India, were used for the studies. Enrichment of AOB was carried out in four aerobic reactors (100 mL volume plastic containers with varying Feed to Seed ratio of 70/30 and 80/20 with 70 and 80 mL of enrichment medium as feed respectively, run in duplicates). The composition of enrichment medium used was as described by [9]. Four anaerobic reactors for enrichment of AnAOB was

Proceedings of the International Conference on Solid Waste 2011- Moving Towards Sustainable Resource Management,
Hong Kong SAR, P.R. China, 2 – 6 May 2011 687
setup using 100 mL glass bottles sealed with rubber and aluminium cork and covered with aluminium foil to avoid light interference. The Feed to Seed ratio was 60/40 [10] (60 mL of enrichment medium as feed) run in duplicates. The composition of the enrichment medium used was as described by [3]. The initial characteristics of the seed and the seed concentration in the reactors are given in the Table 1.
Table 1. Seed Characteristics
Seed COD mg/kg
Ammonia-N (mg/kg)
Nitrate-N (mg/kg)
Nitrite-N mg/kg
Seed concentration (g of TS) in aerobic reactors
Seed concentration (g of TS) in anaerobic reactors
Fresh MSW
10,000 238 230.2 0.11 70/30: 15.46 80/20: 13.35
60/40: 11.89
Mined MSW
6000 124 44.6 0.36 70/30: 24.78 80/20: 20.86
60/40: 13.89
Slurry 5000 2184 30.3 BDL 70/30: 29.27 80/20: 36.35
60/40: 25.71
Leachate 36,000 mg/L
354 mg/L
15.28 mg/L
3.23 mg/L
70/30: 30 mL 80/20: 20 mL
60/40: 40 mL
The batch cultures were maintained at neutral pH and mixing was done manually using a glass rod for aerobic reactors and shaking it upside down for anaerobic reactors once a day. 1 mL of sample was collected once in two days using syringe from the sampling port and replaced with enrichment medium addition. It was operated in fed batch mode for a period of 50 days. Nitrogen transformations were analysed in terms of ammoniacal nitrogen (distillation method), nitrite and nitrate (spectrophotometric method) [11], hydrazine and hydroxylamine (spectrophotometric method, [12, 13]). COD, MLVSS and MLSS estimation were carried out as per standard methods [11].
Results and Discussion
3.1 Enrichment of Aerobic Ammonium Oxidising Bacteria (AOB) from Municipal Solid Waste and Leachate
The important operational parameters for enriching AOB are pH, temperature, hydraulic retention time (HRT) and confirmation of the enrichment by analysing the intermediates of AOB such as hydroxylamine and hydrazine. The main competitor for AOB in substrate utilisation are Nitrite oxidising bacteria (NOB), if they are inhibited AOB can grow faster. The optimum pH for AOB to grow is around 7.7 to 8.2 and for NOB it is 7.2-7.6. The pH of the various reactors was: mined MSW - 7.8, fresh MSW – 8.3, slurry – 7.3 and leachate – 7. At temperature greater than 15ºC AOB can grow faster than NOB and around 25ºC, the AOB can out-compete NOB [14]. The temperature of the reactors was around 30ºC. The HRT of the reactors was around 2 d which was higher than the growth rate of NOB but lower than AOB [15]. The pH, temperature and HRT of the reactors loaded with MSW and leachate showed the optimum conditions for enrichment of AOBs. The variations in the ammoniacal nitrogen concentrations in the reactors during the enrichment of AOB are depicted in the Figure 1. The initial ammoniacal nitrogen concentrations in the reactors loaded with mined MSW (70/30 and 80/20) – 40 mg/L, fresh MSW (70/30) - 194 and (80/20) - 40 mg/L, slurry (70/30) – 47 and (80/20) – 40 mg/L and leachate (70/30) – 40 and (80/20) – 400 mg/L.
The entire ammoniacal nitrogen removal took place faster in reactors loaded with leachate (80/20) in 22 d and for fresh MSW and mined MSW (80/20) in 24 d, leachate and mined MSW (70/30) in 27 d, fresh waste 80/20 in 29 d, whereas it took 41 d for reactors loaded with slurry. The nitrite accumulation rate was calculated by partial nitritation efficiency (PNE) according to [16] and is given in the Figure 2. The maximum nitrite accumulation reached for reactors loaded with leachate on 7 d - 100% PNE, fresh MSW (80/20) on 13 d – 14% PNE, mined MSW on 13 d -35% PNE and slurry on 13 d -61% PNE.
The concentration of hydroxylamine and hydrazine which are intermediate compounds of AOBs in the reactors is given in the Table 2. Presence of hydroxylamine and hydrazine in the biomass [5] of all the

688 Proceedings of the International Conference on Solid Waste 2011- Moving Towards Sustainable Resource Management,
Hong Kong SAR, P.R. China, 2 – 6 May 2011
reactors loaded with fresh and mined MSW, leachate and slurry proved the enrichment of AOBs. Even though, the reactors loaded with fresh MSW - considered as good seed for enriching AOBs, had problems like growth of biomass on the sides of the reactor wall and higher evaporation even in reactors with slurry [8]. The MLSS concentration was higher in reactors with mined MSW. So, reactors with mined MSW were considered to be good seed for enrichment AOBs from MSW.
Figure 1. Variations of ammoniacal nitrogen concentrations during enrichment of AOB
Figure 2. Partial nitritation efficiency for aerobic enrichment of AOB reactors

Proceedings of the International Conference on Solid Waste 2011- Moving Towards Sustainable Resource Management,
Hong Kong SAR, P.R. China, 2 – 6 May 2011 689
3.2 Enrichment of Anaerobic Ammonium Oxidising Bacteria (AnAOB) from Municipal Solid Waste and Leachate
The optimum pH and temperature for the anammox process is around 7.0-8.0 and 30-37 ºC [6]. The pH of the reactors loaded with mined MSW-7.20, fresh MSW – 8.0, slurry- 7.70 and leachate-7.90. The temperature of all the rectors was around 30 ºC. The pH and temperature of the reactors showed optimum conditions for anammox to grow. The variations in the ammoniacal nitrogen, nitrite and nitrate nitrogen concentrations in the reactors loaded with fresh and mined MSW, slurry and leachate with 60/40 ratio during the enrichment of AnAOB is depicted in the Figure 3. The initial ammoniacal nitrogen concentrations in the reactors with fresh MSW is 311 mg/L, mined MSW is 199 mg/L, slurry is 1190 mg/L and leachate is 105 mg/L. The nitrogen transformations showed, initially the denitrifying bacterial activity due to presence of nitrate and utilisation of COD as source of electron donors. Similar trend is observed by [6]. The entire ammoniacal nitrogen concentration removal took place in reactors with mined MSW and leachate in 26 d. The increased ammoniacal nitrogen concentration for fresh MSW on 31 d may be due to decaying of waste. The changes in nitrogen concentrations can only be due to microbial activity as there was no nitrogen addition except fresh medium addition once in two days [17].The specific ammonium oxidation rate for reactors with fresh MSW is around 0.12 µg of NH4-N/mg of VSS on 9 d, mined MSW is 0.12 µg of NH-4N/mg of VSS on 31 d and slurry is 0.10 µg of NH4-N/mg of VSS on 31 d.This result is supported by the work done by [3].The maximum nitrate oxidation took place on 14 d for reactors with fresh MSW is 0.59 mg of NO3-N/d, slurry is 0.87 mg of NO3-N/d and leachate is 1.0 mg of NO3-N/d.
Table 2. The concentrations of Hydrazine and Hydroxylamine in aerobic reactors
Parameters Mined
MSW Fresh MSW
Slurry Leachate
Hydroxylaime (µM) 70/30: 0.16 80/20: 0.21
70/30: 0.75 80/20: 0.28
70/30:0.45 80/20: 0.73
70/30:0.03 80/20:0.05
Hydrazine (mg/L) 70/30: 0.09 80/20: 0.04
70/30: 0.20 80/20:
70/30: 0.23 80/20:
70/30: 0.09 80/20:
Figure 3. Variations of ammoniacal nitrogen, nitrite and nitrate during enrichment of AnAOB
690 Proceedings of the International Conference on Solid Waste 2011- Moving Towards Sustainable Resource Management,
Hong Kong SAR, P.R. China, 2 – 6 May 2011
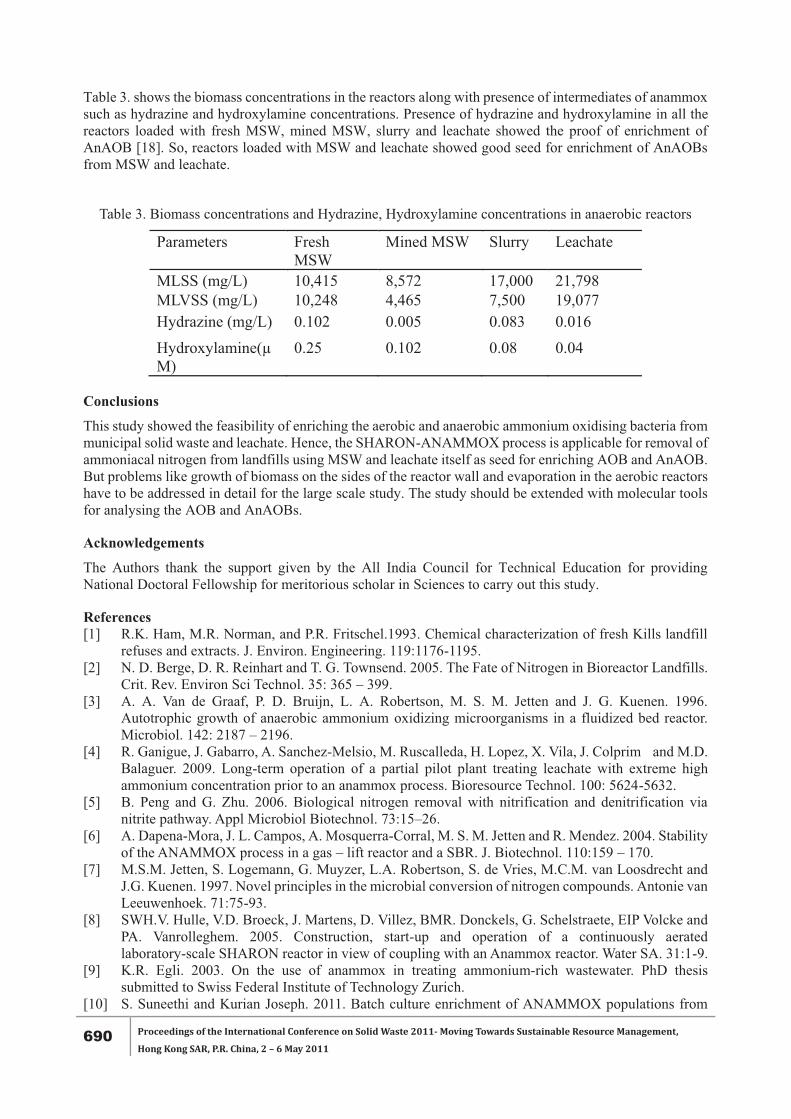
Table 3. shows the biomass concentrations in the reactors along with presence of intermediates of anammox such as hydrazine and hydroxylamine concentrations. Presence of hydrazine and hydroxylamine in all the reactors loaded with fresh MSW, mined MSW, slurry and leachate showed the proof of enrichment of AnAOB [18]. So, reactors loaded with MSW and leachate showed good seed for enrichment of AnAOBs from MSW and leachate.
Table 3. Biomass concentrations and Hydrazine, Hydroxylamine concentrations in anaerobic reactors
Parameters Fresh MSW
Mined MSW Slurry Leachate
MLSS (mg/L) 10,415 8,572 17,000 21,798 MLVSS (mg/L) 10,248 4,465 7,500 19,077 Hydrazine (mg/L) 0.102 0.005 0.083 0.016
Hydroxylamine(µM)
0.25 0.102 0.08 0.04
Conclusions
This study showed the feasibility of enriching the aerobic and anaerobic ammonium oxidising bacteria from municipal solid waste and leachate. Hence, the SHARON-ANAMMOX process is applicable for removal of ammoniacal nitrogen from landfills using MSW and leachate itself as seed for enriching AOB and AnAOB. But problems like growth of biomass on the sides of the reactor wall and evaporation in the aerobic reactors have to be addressed in detail for the large scale study. The study should be extended with molecular tools for analysing the AOB and AnAOBs.
Acknowledgements
The Authors thank the support given by the All India Council for Technical Education for providing National Doctoral Fellowship for meritorious scholar in Sciences to carry out this study.
References [1] R.K. Ham, M.R. Norman, and P.R. Fritschel.1993. Chemical characterization of fresh Kills landfill
refuses and extracts. J. Environ. Engineering. 119:1176-1195. [2] N. D. Berge, D. R. Reinhart and T. G. Townsend. 2005. The Fate of Nitrogen in Bioreactor Landfills.
Crit. Rev. Environ Sci Technol. 35: 365 – 399. [3] A. A. Van de Graaf, P. D. Bruijn, L. A. Robertson, M. S. M. Jetten and J. G. Kuenen. 1996.
Autotrophic growth of anaerobic ammonium oxidizing microorganisms in a fluidized bed reactor. Microbiol. 142: 2187 – 2196.
[4] R. Ganigue, J. Gabarro, A. Sanchez-Melsio, M. Ruscalleda, H. Lopez, X. Vila, J. Colprim and M.D. Balaguer. 2009. Long-term operation of a partial pilot plant treating leachate with extreme high ammonium concentration prior to an anammox process. Bioresource Technol. 100: 5624-5632.
[5] B. Peng and G. Zhu. 2006. Biological nitrogen removal with nitrification and denitrification via nitrite pathway. Appl Microbiol Biotechnol. 73:15–26.
[6] A. Dapena-Mora, J. L. Campos, A. Mosquerra-Corral, M. S. M. Jetten and R. Mendez. 2004. Stability of the ANAMMOX process in a gas – lift reactor and a SBR. J. Biotechnol. 110:159 – 170.
[7] M.S.M. Jetten, S. Logemann, G. Muyzer, L.A. Robertson, S. de Vries, M.C.M. van Loosdrecht and J.G. Kuenen. 1997. Novel principles in the microbial conversion of nitrogen compounds. Antonie van Leeuwenhoek. 71:75-93.
[8] SWH.V. Hulle, V.D. Broeck, J. Martens, D. Villez, BMR. Donckels, G. Schelstraete, EIP Volcke and PA. Vanrolleghem. 2005. Construction, start-up and operation of a continuously aerated laboratory-scale SHARON reactor in view of coupling with an Anammox reactor. Water SA. 31:1-9.
[9] K.R. Egli. 2003. On the use of anammox in treating ammonium-rich wastewater. PhD thesis submitted to Swiss Federal Institute of Technology Zurich.
[10] S. Suneethi and Kurian Joseph. 2011. Batch culture enrichment of ANAMMOX populations from

Proceedings of the International Conference on Solid Waste 2011- Moving Towards Sustainable Resource Management,
Hong Kong SAR, P.R. China, 2 – 6 May 2011 691
Anaerobic and Aerobic seed cultures. Bioresource. Technol. 102: 585 - 591 [11] APHA, 1998. Standard Methods for the Examination of Water and Wastewater, 20th ed. United Book
Press, USA. [12] G. W. Watt and J. D. Chrisp. 1952. A Spectrophotometric Method for the Determination of Hydrazine.
Anal. Chem. 24: 2006 – 2008. [13] D. S. Frear and R. C. Burrell. 1955. Spectrophotometric Method for Determining Hydroxylamine
Reductase Activity in Higher Plants. Anal. Chem. 27: 1664 – 1665. [14] D. Paredes, P. Kuschk, T.S.A Mbwette, F. Stange, R.A. Muller and H. Koser. 2007. New aspects of
microbial nitrogen transformations in the context of waste water treatment – A review. Eng. Life Sci. 7: 13 - 25
[15] D. Guven, O. Kutlu, G. Insel and S. Sozen. 2009. Model-based process analysis of partial nitrification efficiency under dynamic nitrogen loading. Bioprocess Biosyst Eng. 32: 655 - 661
[16] Z. Liang and J.X. Liu. 2007. Control factors of partial nitritation for landfill leachate treatment. J Environ Sci (China). 19: 523 - 529.
[17] T. Wang, H. Zhang, F. Yang, S. Liu, Z. Fu and H. Chen. 2009. Start up of the ANAMMOX process from the conventional activated sludge in a membrane bioreactor. Bioresource. Technol. 100: 2501 – 2506.
[18] N. Shivaraman and G. Shivaraman. 2003. ANAMMOX– A novel microbial process for ammonium removal. Curr. Sci. 84: 1507 – 1508.
692 Proceedings of the International Conference on Solid Waste 2011- Moving Towards Sustainable Resource Management,
Hong Kong SAR, P.R. China, 2 – 6 May 2011
EFFECTIVENESS OF DRAINAGE BLANKET FOR LEACHATE RECIRCULATION IN HETEROGENEOUS AND ANISOTROPIC MUNICIPAL SOLID WASTE
K.R. Reddy * , H.S. Kulkarni
University of Illinois at Chicago, Department of Civil and Materials Engineering, West Taylor Street, Chicago, Illinois 60607, U.S.A
* Corresponding author. Tel: (312) 996-4775 Fax: (312) 996-2426, E-mail: [email protected]
ABSTRACT The main objective of this paper is to examine the effect of heterogeneous and anisotropic municipal solid waste (MSW) on moisture distribution in a bioreactor landfill with drainage blanket (DB) as leachate recirculation system (LRS). Two-phase flow modeling was performed by representing relative permeabilities of leachate and landfill gas with van Genuchten function. Predicted saturation level, wetted area, pore water pressure, and outflow rate of leachate were found to be significantly different for homogeneous isotropic, heterogeneous isotropic, and heterogeneous anisotropic MSW conditions. It is recommended that the heterogeneous and anisotropic MSW conditions should be used in the design of DB for effective leachate distribution.
Keywords: Bioreactor landfill, Moisture distribution, Drainage blanket, Two-phase flow
Introduction
Bioreactor landfills, which involve leachate recirculation, are being increasingly considered to accelerate biodegradation of MSW in landfills [1-2]. Drainage blankets (DBs) are recently introduced as leachate recirculation systems (LRS) that are constructed during the waste filling operations, and they consist of a permeable layer spread over a large area with leachate injected into it using injection pipe(s). Since the MSW exists in unsaturated condition, distribution of injected leachate depends on the relative permeabilities of leachate and landfill gas. Moreover, MSW is heterogeneous and anisotropic, thus leachate distribution can be quite complex. The main purpose of this study is to determine the effects of heterogeneous and anisotropic unsaturated MSW on moisture distribution using DB as LRS. Three different MSW conditions; homogeneous isotropic (uniform hydraulic properties throughout the depth in the landfill), heterogeneous isotropic (varying the hydraulic properties with depth, but having isotropic distribution of hydraulic properties in each layer) and heterogeneous anisotropic (varying the hydraulic properties in horizontal and vertical direction in each layer), were modeled using a two-phase numerical model. The model results (saturation levels, pore water pressure distribution, wetted MSW area, and outflow rate computed in leachate collection and removal system (LCRS)) are compared for the three different MSW hydraulic conditions.
Mathematical Model
The two-phase flow in unsaturated MSW based on Darcy’s law can be described by the following two governing equations:
)( kkwwj
wr
wij
wi xgP
xkq �� �
��
�� (1)
)( kkggj
gr
g
wwij
gi xgP
xkq ��
��
���
�� (2)
The relative permeabilities are modeled using van Genuchten function as:
� �2/111 aae
be
wr SS ���� (3)
� � aae
ce
gr SS 2/111 ���� (4)
Where: q = flow of fluid; kij = saturated mobility coefficient, which is defined as ratio of intrinsic permeability to dynamic viscosity; κr = relative permeability for the fluid (function of saturation); μ=

Proceedings of the International Conference on Solid Waste 2011- Moving Towards Sustainable Resource Management,
Hong Kong SAR, P.R. China, 2 – 6 May 2011 693
dynamic viscosity; P = pore pressure; � = fluid density; g= gravity; a, b and c are constant parameters for van Genuchten function; Se = effective saturation and Sr = residual wetting fluid saturation.
For the purpose of this study, a bioreactor landfill model of 100m wide and 20m height is considered. LCRS is located at bottom of the landfill. A DB 60 m wide, 0.3 m thickness is placed at 5 m above LCRS and is located in center of the landfill cell (Fig. 1). A typical leachate injection rate of Qi = 26 m3/day is applied.
Figure 1. Landfill model with drainage blanket for leachate recirculation in MSW
Figure 2. Sauration isochrones in (a) homogeneous isotropic MSW; (b) heterogeneous isotropic MSW; (c)
heterogeneous anisotropic MSW and (d) MSW wetted area
Hydraulic properties of MSW include saturated hydraulic conductivity and the soil water characteristics curve (SWCC) parameters. Three different hydraulic waste conditions are assumed: (1) homogeneous and isotropic with saturated hydraulic conductivity (ksat) of 1x10⁻⁴ cm/s (2) heterogeneous and isotropic with ksat varying with depth (assumed that MSW is filled in ten layers (Fig. 1), each layer’s saturated hydraulic conductivity calculated based on the applied normal pressure per Reddy et al. [1]), and (3) heterogeneous and anisotropic with the vertical saturated hydraulic conductivity (kv) varying with depth as in the case of heterogeneous and isotropic case, but horizontal hydraulic conductivity is assumed ten times the kv in each

694 Proceedings of the International Conference on Solid Waste 2011- Moving Towards Sustainable Resource Management,
Hong Kong SAR, P.R. China, 2 – 6 May 2011
layer. The unsaturated hydraulic properties of MSW are adapted from Haydar and Khire [3]. All simulations are performed to assess leachate distribution until steady-state condition is reached or 4 weeks, whichever is less. Prior to these simulations, the model was validated based on the previous mathematical modeling results of Haydar and Khire [3] using a numerical model and assuming homogeneous and isotropic MSW.
Results
In case of homogeneous and isotropic MSW, leachate recirculation reached steady-state condition in 17 days. However, even though the leachate recirculation was continued for four weeks, steady state condition was not reached in heterogeneous and isotropic case or heterogeneous and anisotropic case. Leachate recirculation in these two cases was simulated for four weeks. Interestingly, because of heterogeneity of MSW, the injected leachate in the bottom layers increased the saturated area of MSW (Fig. 2d). The maximum saturation in all three MSW conditions was 100%. However, the evolution of the saturation contours was different in these three MSW conditions. Because of the lower permeability of MSW in the deep layers, the saturated area has increased due to lateral spreading of leachate (Fig. 2b and 2d). In case of heterogeneous and anisotropic MSW (kh = 10kv), it can be seen that the injected leachate has migrated in lateral direction more than in vertical downward direction. Therefore, the lateral wetted area has increased substantially in this case (Fig. 2c and 2d). The maximum pore water pressure developed in the landfill during the leachate recirculation is plotted in Fig. 3a. Evidently, the pore water pressure is as high as 205 kPa in case of homogeneous and isotropic case, and this value is observed only near the injection pipe in the DB, while at other locations it was significantly lower. The maximum pore water pressure in case of heterogeneous and isotropic case increased to 405 kPa which is 97% increase compared to homogeneous and isotropic case. This large increase in pore water pressure is due to the low permeability MSW in deep layers that has reduced pore sizes. On the contrary, in case of heterogeneous and anisotropic case, because of the anisotropy, the pore water pressure developed has reduced to 305 kPa (around 13% decrease compared to heterogeneous and isotropic case). Because of anisotropic property of MSW, the pore water pressure developed in the system has dissipated in the horizontal direction and thus the value of pore water pressure has reduced compared to heterogeneous and isotropic case. However, because of the heterogeneous MSW, increase of about 70% in the pore water pressure is observed compared to homogeneous and isotropic case.
Figure 3. (a) Maximum pore water pressure developed in landfill, and (b) Outflow rate in LCRS for
different MSW conditions
Outflow from the LCRS plotted in Fig. 3b shows that the steady-state flow has reached in 17 days in homogeneous and isotropic case. Steady state is defined as the condition when the inflow is equal to outflow. In homogeneous and isotropic case, the injected leachate has migrated downward and reached LCRS. The outflow at steady state condition in homogeneous and isotropic case is 24.6 m3/day/m. On the contrary, in case of heterogeneous and isotropic case, even though the leachate injection is continued for four weeks, the steady-state flow did not occur. Because of the low permeability MSW, less leachate is allowed to migrate towards the LCRS thus after four weeks of recirculation; the outflow rate computed at LCRS is 23.6
Proceedings of the International Conference on Solid Waste 2011- Moving Towards Sustainable Resource Management,
Hong Kong SAR, P.R. China, 2 – 6 May 2011 695
m3/day/m. In the case of heterogeneous and anisotropic case, because of the anisotropic MSW, the injected leachate has migrated laterally thus has reduced the outflow at LCRS, about 17.7 m3/day/m.
Conclusions
The effect of heterogeneous and anisotropic unsaturated MSW on moisture distribution using DB as LRS in bioreactor landfill is quantified. Steady-state flow condition is observed only in case of homogeneous and isotropic case; however, for heterogeneous and isotropic and heterogeneous and anisotropic cases, the steady-state flow condition was not attained even after continuous leachate recirculation for four weeks. Further, the results of saturation level, wetted area of MSW, pore water pressure developed, and outflow rate in LCRS demonstrate the significance of accounting for heterogeneous and anisotropic hydraulic characteristics of MSW in the design of DBs for effective leachate distribution.
References [1] Reddy, K.R., Hettiarachchi, H., Parakalla, N., Gangathulasi, J., Bogner, J. and Lagier, T. 2009.
Hydraulic conductivity of MSW in landfills, Journal of Environmental Engineering, 135 : 1-7. [2] Kulkarni, H.S. and Reddy, K.R. 2010. Modeling of moisture distribution under continuous and
intermittent leachate recirculation in bioreactor landfills. In Proc. 6th International Congress on Environmental Geotechnics, 2010, Delhi, India, p. 1718.
[3] Haydar, M.M., and Khire, M.V. 2007. “Leachate recirculation using permeable blankets in engineered landfills. J. Geotechnical and Geoenvironmental Engrg. 131: 837-847.
696 Proceedings of the International Conference on Solid Waste 2011- Moving Towards Sustainable Resource Management,
Hong Kong SAR, P.R. China, 2 – 6 May 2011
DEGRADABILITY BY ANAEROBIC DIGESTION OF LANDFILL LEACHATE AT BENOWO IN SURABAYA, INDONESIA
M. Kawai 1*, M. Kishi 2, I.F. Purwanti 3, N. Nagao 4, A. Slamet 3, J. Hermana 3, T. Toda 1
1 Graduate School of Engineering, Soka University, Japan 2 Environmental Studies, Soka University of America, SUA
3 Faculty of Engineering, Institut Teknologi Sepuluh Nopember, Indonesia 4 Institute of Bioscience, Universiti Putra Malaysia, Malaysia
* Corresponding author E-mail: [email protected], Tel & Fax: +81426914352
ABSTRACT The aims of this study are as follows: (1) to investigate seasonal physico-chemical characteristics of leachate from Benowo landfill, Indonesia, and (2) to evaluate the degradability of leachate in anaerobic digestion. Concentrations of chemicals except salinity in the leachate were under inhibition levels throughout the year. For anaerobic digestion, synthetic wastewater was used as a substrate at start up. After the start up, diluted leachate was fed to the reactor. Lastly, a substrate was changed to synthetic wastewater again. After switching from synthetic wastewater to leachate, COD removal efficiency was decreasing; 40% of COD removal efficiency was maintained constant. This indicated that the leachate from Benowo contained about 40% degradable substances. Although the concentration of ?? CH4 ratio 60% at start up, it decreased to 40% when the substrate reverted to synthetic wastewater again. This suggested that microorganism activity might not recover completely owing to the supply of leachate for a long period.
Keywords: Landfill leachate, Anaerobic digestion, Indonesia.
Introduction
Indonesia is in the monsoon region and the dissolution of solid waste combined with heavy rainfall produces a large quantity of polluted leachate [1]. Leachate should be treated to prevent contamination of water resources such as groundwater, river and sea [2].
In recent days, from the viewpoint of preventing global warming, anaerobic digestion has been receiving more attention because anaerobic digestion can be operated at relatively low cost and produces usable biogas [3]. Degradability of leachate by anaerobic digestion as low cost treatment should be evaluated to apply effective leachate treatment. However, leachate contains inhibition components of anaerobic digestion and these chemicals fluctuate seasonally [2].
The aim of this study was to investigate the seasonal physico-chemical characteristics of leachate and extract inhibition factors for anaerobic digestion. Furthermore, the degradability of leachate in anaerobic digestion processes was evaluated.
Materials and Methods
Benowo is the largest landfill in Surabaya City which is located in Java Island, Indonesia. In Benowo landfill, leachate goes through ditches, and is gathered in an artificial pond. Samples were collected twice a month at the artificial pond from December 2007 to December 2008. pH, COD and various ions were analyzed. Heavy metals were analyzed by Inductively Coupled Plasma (ICP).
The seed sludge to inoculate was collected from a Sewage Center of Yokohama City, Japan, where sewage sludge has been treated as substrate in an anaerobic digester. The leachate sample as substrate for anaerobic digestion was collected on June 2009 from Benowo landfill. The diluted leachate by 2,000-SCOD mg/L was used for the experiments. A UASB reactor with a working volume of 5L was used in this study. The reactor was installed in constant-temperature room (37±1oC) and substrate was supplied to the reactor by a peristaltic pump. At start up, the reactor was fed with synthetic substrate (Table 1). After start up, diluted leachate was fed to the reactor and the organic loading rate (OLR) was increased and then decreased in a stepwise manner. Lastly, the same synthetic substrate was fed to the reactor again. Treated water, sludge, and biogas samples were taken. TS, SCOD, and ammonium ions of the treated water were analyzed. Cell density of the sludge sample, and biogas production and composition were also measured.

Proceedings of the International Conference on Solid Waste 2011- Moving Towards Sustainable Resource Management,
Hong Kong SAR, P.R. China, 2 – 6 May 2011 697
Table 1. Operation parameters of continuous experiment of a UASB reactor
Results and Discussion
Chemical components of the leachate from Benowo and inhibition levels for anaerobic digestion are listed in Table 2. It is known that a substrate requires at least 2,000 mg-COD/L to be effective for anaerobic digestion [4]. As the average COD concentration of Benowo’s leachate was about 6,143 mg/L, it would be suitable for anaerobic digestion. Concentrations of chemicals except salinity in the leachate were under inhibition levels.
Table 2. Chemical components of leachate at Benowo and inhibition levels for anaerobic digestion
Substrate OLR influent(g COD/L/d)
Feed COD(mg/L)
HRT(day)
Current velocity(m/d)
0-16 Start-up 1 Synthetic 2.5 5000 2 0.35
17-23 Start-up 2 Synthetic 0.71 5000 7 0.1
24-34 OP1 Leachate 0.25 1770 7 0.1
35-64 OP2 Leachate 0.44 1770 4 0.18
65-72 OP3 Leachate 0.89 1770 2 0.35
73-91 OP4 Leachate 0.44 1770 4 0.18
92-108 OP5 Leachate 0.25 1770 7 0.1
109-180 OP6 Synthetic 0.71 5000 7 0.1
Operation period (days) Phase
Inhibition level forRange Average anaerobic digestion
<6.0 / >9.0 [4]
COD mg/L 2,621 - 16,832 6,143 <2,000 [4]
NH4+ mg/L 146 - 2,316 777 <4,000
Na+ mg/L 825 - 11,649 5,101 >9,500 [6]
Cl- mg/L 1,634 - 19,121 8,886 >16,000 [7]
Fe mg/L DL - 18 8.3 >100 [8]
Ni mg/L DL - 4.02 2.7 >40 [9]
Zn mg/L DL - 3.06 2.8 >64 [10]
Cr mg/L DL - 0.70 0.50 >13 [9]
Mn mg/L DL - 1.4 0.61 >5.6 [11]
Cu mg/L 0.31 - 1.8 1.1 >5.0 [10]
Pd mg/L DL - 0.83 0.51 >10 [10]
Cd mg/L 0.51 - 0.59 0.55 >46 [12]
pH 7.7 - 8.7 8.0
Unit
-
ChemicalsLeachate from the Benowo
Reference
[5]
698 Proceedings of the International Conference on Solid Waste 2011- Moving Towards Sustainable Resource Management,
Hong Kong SAR, P.R. China, 2 – 6 May 2011
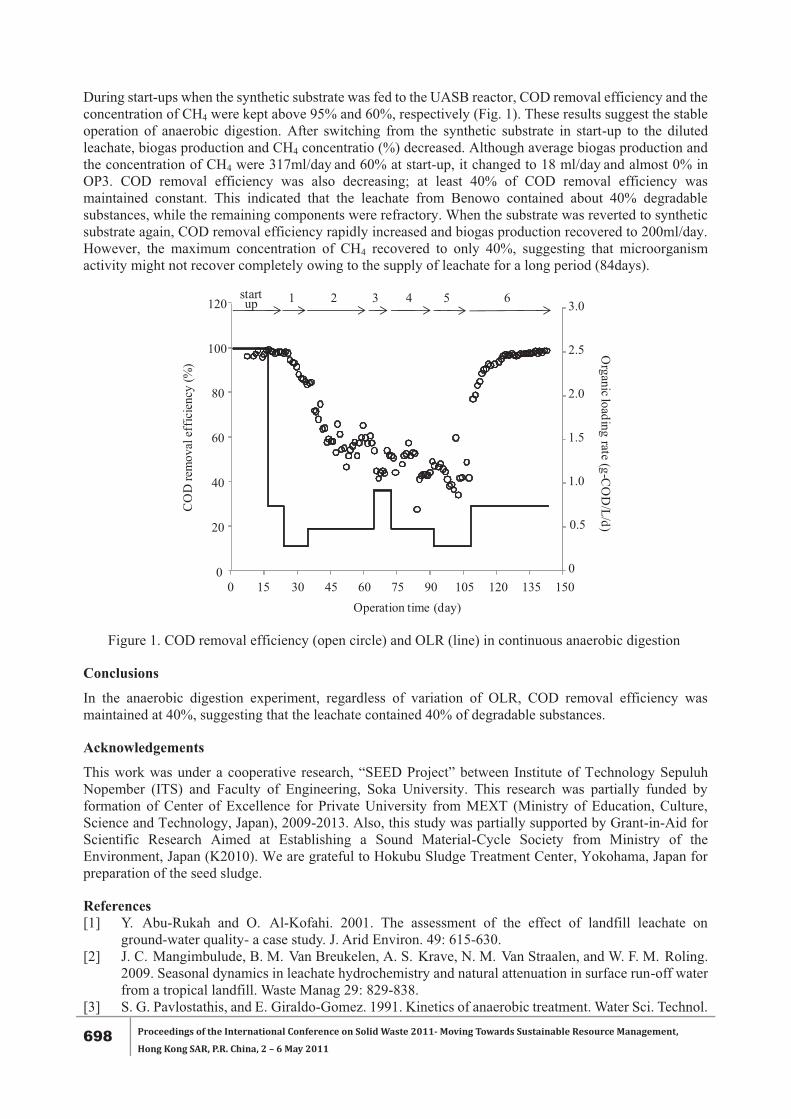
During start-ups when the synthetic substrate was fed to the UASB reactor, COD removal efficiency and the concentration of CH4 were kept above 95% and 60%, respectively (Fig. 1). These results suggest the stable operation of anaerobic digestion. After switching from the synthetic substrate in start-up to the diluted leachate, biogas production and CH4 concentratio (%) decreased. Although average biogas production and the concentration of CH4 were 317ml/day and 60% at start-up, it changed to 18 ml/day and almost 0% in OP3. COD removal efficiency was also decreasing; at least 40% of COD removal efficiency was maintained constant. This indicated that the leachate from Benowo contained about 40% degradable substances, while the remaining components were refractory. When the substrate was reverted to synthetic substrate again, COD removal efficiency rapidly increased and biogas production recovered to 200ml/day. However, the maximum concentration of CH4 recovered to only 40%, suggesting that microorganism activity might not recover completely owing to the supply of leachate for a long period (84days).
Figure 1. COD removal efficiency (open circle) and OLR (line) in continuous anaerobic digestion
Conclusions
In the anaerobic digestion experiment, regardless of variation of OLR, COD removal efficiency was maintained at 40%, suggesting that the leachate contained 40% of degradable substances.
Acknowledgements
This work was under a cooperative research, “SEED Project” between Institute of Technology Sepuluh Nopember (ITS) and Faculty of Engineering, Soka University. This research was partially funded by formation of Center of Excellence for Private University from MEXT (Ministry of Education, Culture, Science and Technology, Japan), 2009-2013. Also, this study was partially supported by Grant-in-Aid for Scientific Research Aimed at Establishing a Sound Material-Cycle Society from Ministry of the Environment, Japan (K2010). We are grateful to Hokubu Sludge Treatment Center, Yokohama, Japan for preparation of the seed sludge.
References [1] Y. Abu-Rukah and O. Al-Kofahi. 2001. The assessment of the effect of landfill leachate on
ground-water quality- a case study. J. Arid Environ. 49: 615-630. [2] J. C. Mangimbulude, B. M. Van Breukelen, A. S. Krave, N. M. Van Straalen, and W. F. M. Roling.
2009. Seasonal dynamics in leachate hydrochemistry and natural attenuation in surface run-off water from a tropical landfill. Waste Manag 29: 829-838.
[3] S. G. Pavlostathis, and E. Giraldo-Gomez. 1991. Kinetics of anaerobic treatment. Water Sci. Technol.
Operation time (day)0 15 30 45 60 75 90 105 120 135 150
0
20
40
60
80
100
120
CO
D re
mov
al e
ffic
ienc
y (%
)
0
0.5
1.0
1.5
2.0
2.5
3.0
Organic loading rate (g-C
OD
/L/d)
1 2 3 4 5startup 6

Proceedings of the International Conference on Solid Waste 2011- Moving Towards Sustainable Resource Management,
Hong Kong SAR, P.R. China, 2 – 6 May 2011 699
24: 35-59. [4] R. E. Speece. 1996. Anaerobic biotechnology for industrial wastewaters, Archae Press, Tennessee,
p.462. [5] X. Z. Li and Q. L. Zhao. 2001. Efficiency of biological treatment affected by high strength of
ammonium-nitrogen in leachate and chemical precipitation of ammonium-nitrogen as pretreatment. Chemosphere 44: 37-43.
[6] M. Soto, R. Mendez and J. M. Lema. 1993. Sodium inhibition and sulphate reduction in the anaerobic treatment of mussel processing wastewaters. J. Chem. Tech. Biotechnol. 58: 1-7.
[7] C. Y. Gomec, S. Gonuldinc, N. Elfem and I. Ozturk. 2005. Behavior of an up-flow anaerobic sludge bed (UASB) reactor at extreme salinity. Water Sci. Technol. 51: 115-120.
[8] D. J. Hoban and L. van den Berg. 1979. Effect if iron on acetic acid to methane during methanogenic fermentations. J. Appl. Bacteriol. 47: 153-159.
[9] Y. Sonoda and Y. Shizuko. 1977. Effects of heavy metal compounds, inorganic salts, hydrocarbon compounds and antibiotics in methane fermentation. Engineering of Enzyme 35: 22-29.
[10] C. R. Harrie, A. Scrivens, J. F. Rees and R. Sleat. 1990. The effect of heavy metals on the initiation of methanogenesis in MSW leachate. Environ Technol 11: 1169-1175.
[11] M. O. Ginter and A. M. Grobicki. 1997. Manganese removal mechanisms in a stirred UASB reactor. Water Res. 31: 1261-1268.
[12] C. Y. Lin and C. C. Chen. 1998. Effect of heavy metals on the methanogenic UASB granule. Water Res. 33: 409-416.
700 Proceedings of the International Conference on Solid Waste 2011- Moving Towards Sustainable Resource Management,
Hong Kong SAR, P.R. China, 2 – 6 May 2011
BIODEGRADATION OF ORGANICS IN LANDFILL LEACHATE BY IMMOBILIZED WHITE ROT FUNGUS, TRAMETES VERSICOLOR BCC 8725
J. Saetang, S. Babel *
School of Bio-Chemical Engineering and Technology, Sirindhorn International Institute of Technology, Thammasat University, Rangsit Campus, P.O Box 22, Pathum Thani 12121, Thailand
*Corresponding author. Tel. +66 2 986 9009 Ext. 2307, Fax +66 2 986 9009 Ext 2301, Email: [email protected]
ABSTRACT Immobilized Trametes versicolor BCC 8725 was used to evaluate the biodegradation potential for four different types of landfill leachates collected at different time periods and locations from a Nonthaburi landfill site of Thailand in batch experiments. The BOD/COD of leachate samples 1, 2, 3, and 4 was 0.43, 0.16, 0.36, and 0.6, respectively. The ammonia content in leachate 1, 2, 3, and 4 was 1542 mg/L, 182 mg/L, 216 mg/L, and 32 mg/L, respectively. Effects of carbon source (glucose as co-substrate), effects of ammonia and organic loading on color, BOD and COD removal, and reuse of immobilized fungus were investigated. It was found that fungus could remove 78% of color, reduce BOD by 68% and COD by 57% in leachate within 15 days at optimum conditions (glucose 3 g/L). Organic loading and ammonia were the factors that affected enzyme activity (laccase, manganese peroxidase, and lignin peroxidase) and degradation. When immobilized T. versicolor on polyurethane foam (PUF) was subjected to repeated use for treatment over the course of 3 cycles, the decolorization efficiency of the first and second cycle was very similar, whereas the third cycle was about 20% lower than the first cycle under similar conditions. The removal of color, BOD and COD obtained indicates the effective utilization of fungus for leachate treatment with high organic loading and varied leachate characteristics.
Keywords: Decolorization, Co-substrate, Landfill leachate, Trametes versicolor, Organic removal

Proceedings of the International Conference on Solid Waste 2011- Moving Towards Sustainable Resource Management,
Hong Kong SAR, P.R. China, 2 – 6 May 2011 701
DEVELOPING TOOLS AND RESOURCES FOR PROMOTING ENERGY RECOVERY FROM LANDFILLS
R. Goldstein 1*, B. Lloyd 2, A. Singleton 3 1*Team Leader, United States Environmental Protection Agency Landfill Methane Outreach Program,
(Mail Code 6207J) 1200 Pennsylvania Avenue, NW, Washington, DC USA 20460, [email protected].
2 Managing Director, Organic Waste Technologies, Hong Kong. Ltd. Pik Wan Road Junction of Lin Tak Road. Lam Tin, Kowloon, Hong Kong SAR, People’s Republic of China, [email protected]
3 Engineer. Eastern Research Group (ERG, Inc.), 1600 Perimeter Park Drive, Morrisville, NC USA 27560, [email protected]
ABSTRACT The Global Methane Initiative employs various tools and resources to promote opportunities for methane emissions reduction from international landfill biogas recovery; from site-specific technical and financial feasibility assessments, operational technical assistance and training, landfill databases, and country specific gas generation models. The Initiative is committed to providing the international solid waste industry with the data, tools, and skills needed to improve landfill gas recovery estimates and landfill operations to achieve cost-effective methane reductions from landfills.
Keywords: Methane, Landfills, Biogas, Renewable energy
Introduction
The Global Methane Initiative is an international partnership comprising 38 countries and the European Commission to promote cost-effective, near-term methane recovery and use as a clean energy source. Since 2005, the U.S. Environmental Protection Agency (US EPA) has supported the Initiative with efforts to identify, measure, and track landfill biogas project opportunities; develop the tools and provide technical expertise to perform site assessment and pre-feasibility studies; and prepare landfills for landfill biogas (LFG) energy recovery projects. This paper will discuss the tools provided by the Initiative to the international landfill biogas community.
Landfill Assessment Studies
Collectively, United States government agencies have prepared assessments for over 70 landfills in Argentina, Brazil, China, Colombia, Ecuador, India, Mexico, Peru, Poland, Republic of Korea, Russia, Thailand, Ukraine, and Vietnam. Additionally, US EPA has awarded grant funds for outside agencies to complete 16 additional site and technology assessments for a total of 87 assessments. These site reports include an assessment of technical and institutional factors about the landfill itself, estimates of recoverable LFG, energy recovery options, and preliminary cost estimates for the project. Landfill technical data included in the assessment consider waste quantity and waste stream characteristics, landfill design, and any existing LFG collection infrastructure. Landfill institutional data considered include operating conditions, waste management regulations and policies that could influence future site operations, site ownership, and existing contractual obligations for gas rights. Using these data and expertise in estimating landfill gas generation from international landfill sites, the assessments include an estimated potential for near-term LFG recovery. After LFG recovery is estimated the assessments compare the LFG recovery rates to various energy utilization options such as nearby industries or local electricity grids. As a final step in the assessment, preliminary costs of the project are provided for both the gas collection infrastructure and the energy recovery equipment. All the assessments are available on the Global Methane Initiative project website at http://www.globalmethane.org/projects/.
US EPA has completed assessments at 10 different landfills in China including one study and pumping trial at the Gaoantun landfill in Beijing. Further, it has sponsored two additional assessments and a detailed pumping trail at the Baishuitang landfill in Beihai through a grant awarded to the Environmental Sanitation Engineering Tech Research Center. The objective of the pumping trial was to assess the technical and economic feasibility of expanding existing LFG utilization projects in the case of Gaoantun, and assess whether the site is suitable for developing a new landfill gas energy project in the case of Baishuitang. These pumping trials also provided quantitative data on the sustainable volume and quality of the landfill gas

702 Proceedings of the International Conference on Solid Waste 2011- Moving Towards Sustainable Resource Management,
Hong Kong SAR, P.R. China, 2 – 6 May 2011
available, preliminary estimates of the radius of influence of gas wells installed at each of the sites, and provide data points to help calibrate the LFG modeling tools developed for China [1, 2]. Two additional assessments are underway at sites Xitianyang and Taoshugang landfills in China.
Country-Specific Landfill Gas Models
To improve the capacity for the international landfill assessment process and provide assistance to other project assessments conducted by other stakeholders in the international methane community, US EPA has developed seven country-specific LFG spreadsheet models for China, Colombia, Ecuador, Mexico, Philippines, Thailand, and Ukraine as well as a regional model for Central America.
Similar to the US EPA LandGEM model, all of these models use a first-order decay equation to estimate the rate of waste decomposition and gas generation. Each of these models also incorporates region or country-specific climate data. Additionally, each model has a set of tailored user inputs or a decision tree to guide the modeler through the process of selecting modeling parameters most appropriate for landfills within each country or region. For the three Asia models, the parameters for Methane Generation Rate (k) and Potential Methane Generation Capacity (L0) are derived from waste composition data and the International Panel on Climate Change (IPCC) 2006 Guidelines [3]. The default modeling parameters for each model have been adjusted using a variety of sources including data collected during the site visits on landfill conditions, waste streams, results of pumping trials, or active LFG collection systems depending on the data available. Each of the models estimates LFG generation and LFG collection after considering site-specific collection efficiency correction factors. All of the models produced for Asia include equivalent estimates of energy recovery and potential emission reductions of GHG based on the estimates of recoverable LFG. All models and user manuals are available on the website at: www.epa.gov/lmop/international/index.html.
The China LFG model has two unique attributes from the other country-specific models. First, since coal ash disposal is common at many landfills in China, and this ash is an inert waste stream, the model identifies whether or not the landfill serves a population that predominantly uses coal for heating and cooking purposes. In these locations, coal ash is often disposed of in the landfill, and the methane generation potential model constant is adjusted downward to reflect significant quantities of inert ash. Alternately, if more detailed data on waste composition is available to better estimate the amount of coal ash received at the landfill, the model allows users to enter detailed waste composition data and override the location-based coal ash assumptions. Second, given the large surface area of China, the locations in China are categorized according to various temperature “cold or hot” and precipitation “dry or wet” criteria. The definitions for each of these criteria are consistent with Table 3.4 in the IPCC 2006 Guidelines [3, 4].
International Landfill Database
Since the launch of the International Landfill Database (ILD) in 2008, the tool has expanded from approximately 200 landfills to over 740 landfills in 22 Global Methane Initiative Partner Countries and two other countries, Sri Lanka and South Africa. The ILD tracks landfill location and contact information, design characteristics, gas collection system information, waste characteristics and site operations, and it serves as a screening tool to identify new international LFG project opportunities. Figure 2 summarizes the landfills currently listed in the ILD according to Partner Country [5].

Proceedings of the International Conference on Solid Waste 2011- Moving Towards Sustainable Resource Management,
Hong Kong SAR, P.R. China, 2 – 6 May 2011 703
Landfills in the ILD can be searched and the contents of the ILD can be downloaded into a spreadsheet in order to allow a user to screen for landfills meeting certain criteria, or explore more in-depth information about a particular landfill.
The ILD also tracks international LFG flare and energy projects. Tracking international LFG projects allows project stakeholders to search for projects with similar characteristics and identify trends in project development activities. Figure 3 summarizes the projects currently listed in the ILD [5].
Results and Discussion
Out of the 87 assessments completed by the US government and associated grant recipients, nine of these sites have installed a flare or an energy recovery project at the site. Using data provided in the remaining 78 landfill assessment reports, US EPA estimates that there is the potential reduction of 5.5 million metric tons of CO2 equivalent (mtCO2e) in 2012 if all of these remaining projects were to be developed [1,6,7,8].
Figure 3. Number of LFG Projects Reported in the ILD
Of these sites, 11 of the landfills are in China and their estimated potential emission reductions are 587,000 mtCO2e in 2012 if projects were developed at these sites. The remaining two sites in China have recently
0
5
10
15
20
25
30
35
South Amer.China India SE AsiaCentral Amer. Africa
SE/East.…
Direct Thermal-Construction/Planned
Direct Thermal-Operational
Electricity-Construction/Planned
Electricity-Operational
Flare-Construction/Planned
Flare-Operational
704 Proceedings of the International Conference on Solid Waste 2011- Moving Towards Sustainable Resource Management,
Hong Kong SAR, P.R. China, 2 – 6 May 2011
expanded their LFG collection systems and utilization projects. The Gaoantun landfill added four enclosed flares and expanded their electric generating plant by adding a second 500 kilowatt (kW) reciprocating engine in June 2009, and are currently considering installation of additional (up to 3MW) generating capacity. Similarly, the Mentougou landfill installed a 65 kW microturbine in early 2009 to meet on-site power demand. Construction of a more comprehensive gas collection system is underway which will allow for expansion of the electricity project.
Conclusions
The suite of these tools and resources are provided to promote additional evaluation and pursuit of energy recovery at landfills in order to achieve reductions in methane emissions. These tools improve the estimates of LFG recovery potential within different regions of the world and provide examples of appropriate energy technology considerations for a wide variety of landfill sizes. In addition to the tools discussed in this paper US EPA is working with landfill owners and other Global Methane Initiative stakeholder to transfer capacity to use and interpret these tools into field work for LFG recovery. For example, US EPA recently held a training workshop on optimizing the performance of LFG collection systems at the Gaoantun Landfill in Beijing, China. The workshop included classroom presentations followed by an on-site demonstration and landfill tour. Over 40 delegates representing a range of stakeholders, including landfill operators, equipment manufacturers, carbon project developers, technology developers, and consulting engineers attended the event. US EPA has also sponsored LFG energy and LFG collection training workshops in Shenzen, Beijing, Shandong, and Chengdu through a series of grants awarded to California State University-Fullerton and the International City/County Management Association. Together, with the support of the project development community, these tools can help encourage investment in LFG projects to achieve near-term reductions in global methane emissions.
References [1] GC Environmental. 2010. Pump Test and Feasibility Study Report for the Baishuitang Landfill,
Beihai City, China. Available on-line at: http://www.globalmethane.org/Data/353_BeihaiLFGReport.pdf
[2] Organic Waste Technologies (H.K.) Ltd. 2007. Report on Pumping Trial and Pre-Feasibility Study for the Expansion of the Landfill Gas Utilization at the Gaoantun Landfill, Beijing City, China. Available on-line at: http://www.globalmethane.org/Data/353_BeihaiLFGReport.pdf (English); http://www.globalmethane.org/Data/GaoantunPumpTestPreFSvB1.chinese.pdf (Mandarin)
[3] IPCC. 2006. IPCC Guidelines for National Greenhouse Gas Inventories. Volume 5: Waste. Available on-line at: http://www.ipcc-nggip.iges.or.jp/public/2006gl/vol5.html
[4] US Environmental Protection Agency. 2009. China LFG Model and Users Manual. Available on-line at: http://www.epa.gov/lmop/international/tools.html#a02
[5] Global Methane Initiative. 2011. International Landfill Database. Available on-line at: http://www.globalmethane.org/tools-resources/tools.aspx#three
[6] US Environmental Protection Agency. 2010. U.S. Government’s Methane to Markets Partnership Accomplishments Report. Available on-line at: http://www.epa.gov/globalmethane/pdf/2010-accomplish-report/usg_fullreport_2010.pdf. Note: Recent data updates since release of the report were based on references [1, 6, 7].
[7] Haiyun Xu. 2011. Landfill Gas Potential Assessment Report: Lingshan Landfill Quingdao, China. Environmental Sanitation Engineering Technology Research Center. Available on-line at: http://www.globalmethane.org/Data/353_LINGSHANLFGreport.pdf
[8] Haiyun Xu. 2011. Landfill Gas Potential Assessment Report: Zhanjiang Landfill Quang Dong Province, China. Environmental Sanitation Engineering Technology Research Center. Available on-line at: http://www.globalmethane.org/Data/353_ZHANJIANGLFGreport.pdf

Proceedings of the International Conference on Solid Waste 2011- Moving Towards Sustainable Resource Management,
Hong Kong SAR, P.R. China, 2 – 6 May 2011 705
PROCESS FOR UPGRADING LANDFILL GAS TO PRODUCE CNG IN BEIJINGH. Zhou 1*, H. Jiang 1, W. Zhang 1, Q. Wu 1, G. Zhou 1, L. He 2, Y. Mao 2
1 College of Chemical Engineering, China University of Petroleum, Beijng, P.R.China 2 Beijing Environment Sanitation Engineering Group Co. Ltd
* Corresponding author. Tel: +86-10-89731979 Fax: +86-10-89731979, E-mail: [email protected]
ABSTRACT Anding landfill in Beijing was built in 1996. The first-stage project came into use in December of the same year, with a design height of 40 m, volume of 3.265 million m3 and daily capacity of 700 tons, and was closed in 2007. The second-stage project started later, and the daily capacity is 1400 ton household refuse. The improved intermittent anaerobic sanitation landfill technology is applied. Landfill gas is collected by horizontal cross pipes and vertical straight pipes. The quantity of landfill gas produced is 800Nm3/h. The gas is upgraded to produce compressed natural gas (CNG), which is used as vehicular fuel for sanitation trucks.
Fig.1 gives the schematic process of the landfill-gas- upgrading technology. The desulfuration section includes two absorption columns: the first one is loaded with SQ104 catalyst to remove H2S and carbonyl sulphide, part of carbon disulfide, disulphide and thiophene; the second one is loaded with SQ104 and SQ108 catalysts to remove carbon disulfide, disulphide and thiophene. The desulfuration catalysts can also remove silicon, silicide, chloride and ammonia. The de-oxidation section uses SQ410 catalyst, which contains noble metal. Propylene carbonate is applied to absorb CO2 in the decarburization section and regenerated in the actifier column. Pressure swing adsorption technology is used in the denitrification section.
Fig.1 Schematic process for upgrading landfill gas
After the upgrading process, the heat value of the landfill biogas gets over 31.4MJ/Nm3 (CH4 ≥88%, total sulphur ≤1ppm, CO2 ≤3%, O2 ≤0.5%). This application lowers the operating cost of the landfill, and reduces CH4 emission as green house gas, so that it has good economic and social benefits.
Keywords: Landfill gas, Upgrading, Desulfuration, Deoxidation, Decarburization, Denitrification
706 Proceedings of the International Conference on Solid Waste 2011- Moving Towards Sustainable Resource Management,
Hong Kong SAR, P.R. China, 2 – 6 May 2011
MITIGATION OF METHANE EMISSION FROM LANDFILL USING STABILIZED WASTES AS BIO-FILTRATION MATERIALS
C. Chiemchaisri *, W. Chiemchaisri, J. Boonchaiyuttasak 1 Department of Environmental Engineering/ National Center of Excellence for Environmental and
Hazardous Waste Management, Kasetsart University, Thailand * Corresponding author: E-mail: [email protected], Tel: +662-579 0730
ABSTRACT Stabilized solid wastes are utilized to mitigate methane emission from the landfill. Loose texture of plastic wastes encouraged air diffusion from the soil surface whereas fine organic fraction has good water holding capacity and nutrients to stimulate methane oxidation reaction. Biological methane oxidation capacity in stabilized waste layer was found to be up to 34.1 g/m3.day. Microbial activity test revealed that the stabilized organic wastes had higher specific methane oxidation rate than plastic wastes possibly due to its larger surface area for microbial attachment. Mixed plastic and fine organic waste matrix provided sufficient porosity for oxygen transfer and supported the growth of Methanotrophs throughout 0.8 m depth of waste layer. Fluorescent in-situ hybridization (FISH) analysis confirmed the presence of Methanotrophs and their population was found varied along waste depth.
Keywords: Greenhouse gas, Methane oxidation, Methanotrophs, Stabilized wastes
Introduction
Methane oxidation is a natural bacterial process which helps reducing methane emission from waste disposal activities [1]. In sanitary landfill, favorable environmental condition for methanotrophic bacteria such as optimum moisture (10-15%) and temperature (25-30oC), available nutrients through leachate irrigation and presence of vegetation [2,3,4] enhances methane oxidation reaction in cover soil. Loose structure of soil materials helps facilitating oxygen transfer and ensuring sufficient oxygen for microbial methane oxidation. Previous researches on methane oxidation at landfill cover soil were mainly focusing on its mechanisms and utilization of alternative landfill cover materials to enhance methanotrophic activities. Potential cover materials such as compost and biological-mechanical treated (MBT) wastes have been investigated and applied in real practice [3,5] but the utilization of stabilized solid wastes for such purpose is still limited. In many developing countries, open dumps have been primarily used and they are later upgraded to sanitary landfills. During the remediation process, the stabilized wastes leftover within the sites need to be managed by disposal or utilization in a proper manner. This research is aiming at the utilization of stabilized wastes as bio-filtration materials for reducing methane emission at newly developed sanitary landfills.
Materials and Methods
The columns of 0.15 m diameter and 1.0 m height were used. They were filled with actual stabilized wastes obtained from a dump site in Thailand. The solid wastes composed of 52.8% plastic wastes and 47.2% of fine fraction (stabilized organic wastes) and their chemical characteristics are shown in Table 1.
Table 1 Characteristics of stabilized solid wastes
Parameter Plastic wastes Stabilized organic wastes Mixed wastes
pH 7.18 7.88 7.07 Moisture (%) 2.03 5.22 4.657 Bulk density (kg/m3) 106.2 898.8 269.0 Porosity (%) 76.7 43.5 65.0 Volatile Solids (%) 29.0 47.0 35.0 Total Organic Carbon (g/kg) 630.07 854.53 773.13 Ammonium Nitrogen (mg/kg) 5.38 121.44 6.67 TKN (mg/kg) 390.9 2,389.8 965.7 Nitrate (mg/kg) 11.29 76.88 47.64 Total phosphorus (mg/kg) 140.8 1,394.5 428.4

Proceedings of the International Conference on Solid Waste 2011- Moving Towards Sustainable Resource Management,
Hong Kong SAR, P.R. China, 2 – 6 May 2011 707
Packing density of solid wastes was set at 270 kg/m3. The column were purged at the bottom with synthetic gas containing 60% methane and 40% carbon dioxide at different flow rates of 0.5, 1.0 and 1.5 ml/ min, equivalent to actual methane loading rate of 8.32, 26.36 and 51.28 g/m3.d respectively. These loading rates were set based on typical landfill gas emission rates from solid waste dump sites in Thailand.The experiment was continuously carried out over 187 days period. During the experiment, gas were sampled along the column depth and analyzed for its composition. Methane oxidation rate (MOR) was determined from MOR = Q [(CH4) in – (CH4) out]/V where Q = gas flow rate, (CH4)In and (CH4) out = inflow and outflow methane concentrations, V = volume of wastes. At the end of the experiment, solid waste samples from the top and bottom of column were separated into plastic and fine fraction and subjected to methanotrophic activity test [2]. The waste samples were also examined by Fluorescent In-situ Hybridization (FISH) technique using oligonucleotide probes shown in Table 2.
Table 2 Oligonucleotide probes used for Fluorescence In-Situ Hybridization (FISH) analysis [6]
Probe Target bacteria (%) Formamide Probe and Target sequence M γ 705 Methanotroph Type I 20 probe: 3’-CTAGACTTCCTTGTGGTC-5’
target: 5’-GAUCUGAAGGAACACCAG-3’ M γ 84 Methanotroph Type I
20 probe: 3’-AGCCCGCGACTGCTCACC-5’ target: 5’-UCGGGCGCUGACGAGUGG-3’
M α 450 Methanotroph Type II 20 probe: 3’-CTATTACTGCCATGGACCTA-5’
target:5’-GAUAAUGACGGUACCUGGAU-3’
Results and Discussion
Methane Oxidation Rate (MOR) in Column Experiment
Table 3 shows MOR in stabilized wastes (mixture of plastic and stabilized organic wastes) at various depths under different methane loading rate. It was found that MOR improved from 7.58 to 34.06 g/m3.d as methane loading rate was increased from 8.32 to 51.28 g/m3.d. As a result, methane elimination efficiencies were 66.42 -99.05%. MOR was found highest at the bottom of waste layer (65-80 cm depth) where methane gas was fed. At a low methane loading rate up to 26.36 g/m3.d , methane was almost eliminated. At high loading rate of 51.28 g/m3.d, methane was partially removed and active methane oxidation zone shifted up to a higher level. It is noted that high porosity in mixed wastes containing plastic and stabilized organic waste components helped facilitating oxygen supply for methane oxidation reaction through the whole depth of waste layer (0.8 m).
Table 3 Methane oxidation rate in stabilized wastes
Gas flow rate
(ml/min)
Methane loading rate (gCH4/m3.d)
Methane oxidation rate (MOR, gCH4/m3.d) Average
MOR (gCH4/m3.d)
Methane elimination efficiency
(%) 10–20
cm. 20–30
cm. 30–45
cm. 45–65
cm. 65–80
cm. 0.5 8.32 ND ND 1.68 5.48 10.36 7.58 91.11 1.0 26.36 ND ND 1.05 12.84 43.59 26.11 99.05 1.5 51.28 ND 2.03 18.95 25.40 151.1 34.06 66.42
ND: not detected
Methanotrophic Activities of Stabilized Wastes
Table 4 reveals that stabilized organic wastes with smaller particle size and higher specific surface area had higher methanotrophic activity than plastic wastes at upper part of waste layer (20-30 cm). Nevertheless, their activities in active zone (65-80 cm) are not different. These results suggested that methanotrophic organisms can also grow well not only on fine fraction with higher specific surface area and proper moisture

708 Proceedings of the International Conference on Solid Waste 2011- Moving Towards Sustainable Resource Management,
Hong Kong SAR, P.R. China, 2 – 6 May 2011
but also significantly on the surface of plastic wastes. CO2 production rate is also in agreement with methane consumption rate which confirms that methane was converted to CO2 by methane oxidation reaction.
Table 4 Methanotrophic activities of plastic and stabilized organic wastes (fine fraction)
Parameters @ 20 – 30 cm depth @ 65 – 80 cm depth
plastic fine fraction Plastic fine fraction MOR (μg/g.h) 11.47 15.40 13.11 13.14
CO2 production (μg/g. h) 30.78 42.91 38.64 34.04
mol CH4: mol CO2 0.72: 0.70 0.96: 0.98 0.82: 0.88 0.82: 0.77
Methanotrophic population in Stabilized Waste
Figure 1 shows that Methanotroph population on plastic wastes increased along the depth of waste layer whereas those on stabilized organic wastes remained relatively constant. There was not clear difference between Methanotroph type I and type II population. These observation confirms the results of methanotrophic activities that Methanotrophs grow well even on the surface of plastic wastes at the bottom of waste layer where methane is present at higher level.
Figure 1. Bacterial population on waste surface a) Methanotroph type I b) Methanotroph type II
Conclusions
This research reveals the possibility of utilizing stablized solid wastes as bio-filtration materials for mitigating methane emission from landfill. MOR up to 34.1 g/m3.d was obtained over long-term operation of 187 days. High porosity in stabilized wastes help facilitating oxygen supply for methanotrophic activities throughout the whole depth of 0.8 m.
References [1] M. Huber-Humer, J. Gebert and H. Hilger. 2008. Biotic systems to mitigate landfill methane
emissions. Waste Manage & Res., 26: 33-46. [2] W. Chiemchaisri, J.S.Wu and C. Visvanathan. 2001. Methanotrophic production of extracellular
polysaccharide in landfill cover soils Water Sci. & Tech.,43: 151-159. [3] N. Tanthachoon, C. Chiemchaisri, W. Chiemchaisri, S. Tudsri and S. Kumar. 2008. Methane
oxidation in compost-based landfill cover with vegetation during wet and dry conditions in the tropics. J. Air & Waste Manage. Assoc., 58: 603-612.
[4] C. Chiemchaisri, W. Chiemchaisri, K. Chittanukul, W. Soontornlerdwanich and N. Tanthachoon. 2010. Effect of leachate irrigation on methane oxidation in tropical landfill cover soil. J. Mater Cycles Waste Manage., 12: 161-168.
Proceedings of the International Conference on Solid Waste 2011- Moving Towards Sustainable Resource Management,
Hong Kong SAR, P.R. China, 2 – 6 May 2011 709
[5] J.K.M. Einola, K.A. Elina and J.A. Rintala. 2008. Mechanically-biologically treated municipal solid waste as a support medium for microbial methane oxidation to mitigate landfill greenhouse emissions. Waste Management, 28: 97-111.
[6] G. Eller, S. Stubner and P. Frenzel. 2001. Group-specific 16S rRNA targeted probes for the detection of type I and type II methanotrophs by fluorescence in situ hybridization. FEMS Microbiology Letters, 198: 91-97.

710 Proceedings of the International Conference on Solid Waste 2011- Moving Towards Sustainable Resource Management,
Hong Kong SAR, P.R. China, 2 – 6 May 2011
CLIMATE MITIGATION WITH APPROPRIATE SOIL COVER ON LANDFILLS: ONGOING CASE STUDIES IN THE VISAYAYS REGION, PHILIPPINES
J.G. Paul 1*, A. Lemke 2, K.F. Villanueva 3, E.T. Libradilla 3 1* AHT Group AG, GIZ-AHT SWM4LGUs Project, Iloilo City, Philippines 2 German International Cooperation, c/o Ormoc City, Leyte, Philippines
3 Local Government of Bais City, City Mayors Office, Bais City, Negros Oriental, Philippines * Corresponding author: E-mail: [email protected], Tel: +63-33-509 9788
ABSTRACT Climate change is considered as one of the greatest global challenges of the 21st century and hence becoming an important determinant of waste management approaches. The waste management sector contributes to anthropogenic greenhouse gas effects primarily through emissions of carbon dioxide, methane and nitrous oxide. In the Philippines, new regulations to enhance Solid Waste Management were provided with Republic Act 9003 in 2001. This law defines minimum standards for construction, operation and closure of landfills. Although certain statements regarding application of soil cover for landfill closure are made in the law, detailed technical prescriptions to reduce landfill emissions are lacking. Hence, a new closure method was developed and tested at two pilot sites to integrate GHG mitigation measures into landfill rehabilitation approaches. This method makes use of the "reactive barrier concept", whereby methane emissions are transformed into carbon dioxide by natural microbial processes while passing a soil cover. Results of this study indicate potentials for methane emission reduction up to 80 %.
Keywords: GHG emission reduction, Eco-efficient landfill cover, Low cost cover, Appropriate technology
Introduction
Waste disposal in uncontrolled dumpsites remains the most applied waste management practice in many developing countries. However, uncontrolled waste disposal poses various environmental hazards due to lack of barriers such as base liner system, waste compaction, soil cover, leachate and gas control. Related emissions trigger environmental impacts long after closure, whereas methane emissions contribute significantly to global warming. Landfill gas consists of up to 60 Vol.-% CH4 and 40-50 Vol.-% CO2 plus trace amounts of numerous chemical compounds [1]. CH4 is a more potent GHG and contributes 23-times more towards global warming than CO2. Waste disposal sites are the second largest source of anthropogenic GHG and count for 26% of all anthropogenic CH4 productions. As one option to reduce CH4 emissions from disposal facilities, the so called "reactive barrier concept" for dumpsite closure is applied at two pilot sites in Ormoc City, Leyte Island and Bais City, Negros Island. This paper describes the new closure approach and summarizes envisioned targets, methods and experiences made with tests at these 2 pilot sites.
Materials, Methods and Concept of “Reactive Barriers”
The new closure approach for landfill rehabilitation is based on the concept of a "reactive barrier concept". This method may be most applicable in smaller dumpsites, where gas collection is hardly feasible due to technically and economically reasons. However, there are also further possible applications of the reactive barrier cover [2]:
� joint application with gas collection to capture escaping methane emissions, � emission reduction during the start phase of operating a new landfill, � emission reduction in older sanitary landfills, that are past their peak of gas production, � emission reduction at sanitary landfills, where pretreated waste is disposed.
The principle behind the reactive barrier cover is that specific soil bacteria are capable to consume CH4 by natural microbial processes while passing through eco-efficient cover strata. These methanotrophic bacteria, also called methanotrophs, are diverse and ubiquitous in the environment and develop naturally where both CH4 and O2 are available at the same time, for example at the boundary of aerobic and anaerobic regions in wetlands, rice paddies and peat bogs. The process of biological CH4 oxidation is possible because methanotrophs are able to convert CH4 and oxidize it into CO2 by their metabolism. Some CH4 is not oxidized but assimilated into biomass. In general, microbiological CH4 oxidation depends on various parameters such as: temperature, pH, moisture, O2 concentration, nutrients, as well as soil characteristics

Proceedings of the International Conference on Solid Waste 2011- Moving Towards Sustainable Resource Management,
Hong Kong SAR, P.R. China, 2 – 6 May 2011 711
and composition. Methanotrophs have a wide pH-tolerance range, from 4 to 9. Though methanotrophs can live in a wide temperature spectrum, their optimal range varies from 20 C - 37 C [4].
Microbial growth in general depends on availability of nutrients, foremost nitrogen, phosphate, potassium and organic matter [4]. However, the probably most important parameter that influences soil bacteria and their living conditions is moisture content of the supporting medium. Furthermore, permeability, soil compaction and porosity control pore gas exchange and availability of O2 [2].
Results and Discussion
Development of a Modified Landfill Cover
The newly proposed landfill cover system was designed based on research of Martienssen et al [4], which tested options for low-cost approaches and appropriate technologies for the closure of smaller dumpsites with the aim to reduce CH4 emissions more efficiently. In their studies a combined substrate of sandy soil and compost performed as most efficient and reached an efficiency of up to 90% CH4 elimination. The cover system performing best was a combination of a drainage layer (10cm), overlain by a soil layer (70cm) and a top humus-vegetation layer (30cm). Hence, the top cover for the test sites in Ormoc City (1.7 hectare) and Bais City (3.5 hectare) was modified as shown in Figure 1.
Mapping GHG Emissions
To identify “hot spots” of GHG emission at site, a landfill gas mapping was conducted with a mobile gas probe. For the GHG mapping a SR2-DO system from SEWERIN was used to measure CH4 and CO2 concentrations in the test area. First measurements were conducted in August 2010 to get baseline data on GHG generation at the waste disposal sites and to identify hotspots. Pipes (metal, 1inch) were dug into the waste at 0.60 meters depth in a raster of 10 x 10 meters. The pipes were sealed with tape on the top to avoid air infiltration. Following, CH4, CO2 and CO2 concentrations were measured using the SR2-DO device (compare figure 2). The used device is a mobile multiple gas detector which was especially designed to determine the composition of bio- and landfill gas. The Ormoc City dumpsite was used for more than 20 years to dispose municipal solid waste without any compaction and soil covering. This site comprises 1.7 hectare of uncontrolled waste disposal. In Bais City, a clay lined landfill was implemented in 2003, whereas the first landfill cell that covers 0.3 hectare is filled in the meantime. This landfill cell contains a waste volume of approximately 26,000 m3 up to a height of 8 m, whereas waste compaction with regular soil coverage produced an in situ density of 0.75 m3/ton [5]. During several gas mapping events, highest CH4 concentrations were identified at the central area of the Ormoc dumpsite with CH4 values of 5-6 Vol.-%

712 Proceedings of the International Conference on Solid Waste 2011- Moving Towards Sustainable Resource Management,
Hong Kong SAR, P.R. China, 2 – 6 May 2011
0.6 m below surface. In the Bais City landfill, much higher CH4 concentrations were detected in 4-5 years old fill units with highest CH4 values of 32 Vol.-% 0.6 m below surface.
Testing Local Materials as Eco-efficient Landfill Cover
As already discussed, the selection of an adequate bearing substrate is essential for optimal microbial activity and thus, for CH4 reduction. In Ormoc and Bais several mixtures of locally available soils and residues from agriculture were tested such as: a) mix of compost and alluvial soil in ratio 10:90, b) pure alluvial soil excavated from a local river bed, and c) mix of mud press with alluvial soil in ratio 10:90. Further potential materials for soil cover testing are bagasse, a byproduct of sugar production like mud press and in Ormoc City additionally ashes and sludge as residues from a local ethanol production facility as well as silt as byproduct from a gravel crushing plant. Further testing of mixtures of these available, low cost materials could assist to identify best suited technical and economic options for soil cover adjustment. From the first GHG measurements in a 3x3m test plot at the Bais City landfill CH4 concentrations from 11 Vol.-% within the waste body (1.3m below surface) were reduced to 2.1 Vol.-% CH4 0.2m below surface. These results need to be verified through further measurements.
Conclusions
GHG mapping conducted at two landfills in the Visayas region revealed that these waste disposal sites produce significant methane emissions several years after disposal. Hence a new closure method was tested which makes use of the "reactive barrier concept". This approach allows to transform methane emissions into carbon dioxide by natural microbial processes within the soil cover. Results of this study indicate GHG emission reductions in the magnitude of up to 80 %. Likewise, cost reductions for landfill rehabilitation could be expected if locally available, soil-like residues from agriculture would be utilized as low cost construction materials. The proposed closure approach could easily be replicated by other municipalities. If the still operating >1,200 open dumps in the Philippines would apply the proposed closure method, significant GHG emission reductions could be availed off as proposed by the Kyoto Protocol.
References [1] Chanton, J. K., Powelson, D. K., & Green, R. B. 2009. Methane Oxidation in Landfill Cover Soils, is
a 10% Default Value Reasonable? Journal of Environmental Quality, 38:654-663. [2] Huber-Humer, M., Geber, J., & Hilger, H. 2008. Biotic Systems to mitigate landfill methane
emissions. - Waste Management and Research, 26:33-46. [3] Lemke, A. Et al.2011. Cimate Mitigation through eco-efficient dumpsite closure, expereicnes from
Ormo City, Philippines. Proceedings WasteSafe Conference, Khulna, Bangladesh, Februar 2011. [4] Martienssen, M., Kaiser, A., Schirmer, M., Graf, W., Kutschke, S., Schulze, R., et al. 2009. Efficiency
of methane oxidizing landfill covers in Saxony-Anhalt. - Muellmagazin Journal. [5] Paul, J. at al 2009. Experiences with the establishment and operation of a Waste Management Center
in Bais City, Philippines; Proceedings Sardinia Conference, October 2009, Italy.

Proceedings of the International Conference on Solid Waste 2011- Moving Towards Sustainable Resource Management,
Hong Kong SAR, P.R. China, 2 – 6 May 2011 713
LANDFILL SITE SELECTION FOR MUNICIPAL SOLID WASTE DISPOSAL USING REMOTE SENSING AND GIS TECHNIQUE FOR BHOPAL CITY, M.P., INDIA
D.K. Tripathi 1*, J.P. Shukla 2, A. Awasthi 3 1Research Fellow, International Institute of Waste Management, Bhopal India
2Scientist, Advance Materials and Processes Research Institute, CSIR, Bhopal India 3Prof. School of Environmental Biology, Awadhesh Pratap Singh University Rewa M.P. India
*corresponding author. E-mail:[email protected], [email protected], Mob: 09755104410
ABSTRACT The landfill site selection is an extremely different task to accomplish because the process depends on different factors and regulations. Bhopal has been exploring another alternate site for landfill because existing dumping site (Bhanpur) is inadequate and not safer for the surrounding biota. A landfill specific area is required which is socio-economically and environmentally, viable which further difficulty is for the municipal planners. The aim of this study is to identify the suitable locations of landfill site for MSW disposal based on prescribed norms by the regulatory agency evaluating various factors related to site selection, and to describe the landfill location criteria. The data generated and used for the study includes different topographic maps, layers and imageries. After evaluating of the site, it was found that the six sites found have different priority status.
Keywords: Remote sensing, Geographic Information system, Municipal solid waste, Landfill
Introduction
India ranked the world’s eighth largest economy and arguably tenth most industrialized nation, during the past few years of economic liberalization has, witnessed a major rise in industrial production. [1]. Rapid urbanization leads solid waste management problem to municipalities and decreases the resources and toxic waste indiscriminately [2]. There has been a significant increase in solid waste generation in India over the years from 100 gm per person per day in small towns to 500 grams per persons per day in large towns [3]. Presently most of the municipal solid waste in India is being disposed unscientifically. The most common problems associated with improper management of solid waste include disease transmission, fire hazards, odor nuisance, water pollution, aesthetic nuisance and economic losses [4]. Remote sensing and Geographic Information System (GIS) is one of the excellent tools for inventory and analysis of environment and its resources, owing to its unique ability of providing the synoptic view of a large area of the earth’s surfaces and its capacity of repetitive coverage [5]. The use of GIS in selection process will reduce time and boost up the capacity. The present study intend to find out a suitable site for the disposal of urban solid waste generated from bhopal municipality and surrounding areas with the help of Remote sensing and GIS techniques.
Materials and Methods
The research was carried out in Bhopal district, capital city of the state of Madhya Pradesh, located in the central part of country India. Bhopal has a population in 2001 census of 14, 36,822. The BMC is divided into 66 wards out of 14 Zones. The study methodology includes collection of information of existing waste management practices and preparing database for waste situations of the study area along with analysis of the present waste scenario. The results obtained from the database were interpreted to identify the study variables and the new technology RS and GIS to be used, so as to try and implement such technology in the site selection, urban planning, and other various application. The material used for purpose of study related to the RS and GIS application comprises of base map of the study area, Survey of India Topo sheet on 1:50,000 scale namely 55E/7, 55E/8, 55E/11, 55E/12 and satellite data and Arc map 9.2, ERDAS software were used for analysis purpose. The imagery was downloaded from the Maryland University GLCF site [6]. A variety of thematic maps has been prepared namely land use, land cover, BMC boundary, changes of land use and land cover, Geology, Geomorphology, Ground water potential, Hydrology and Lineament etc.
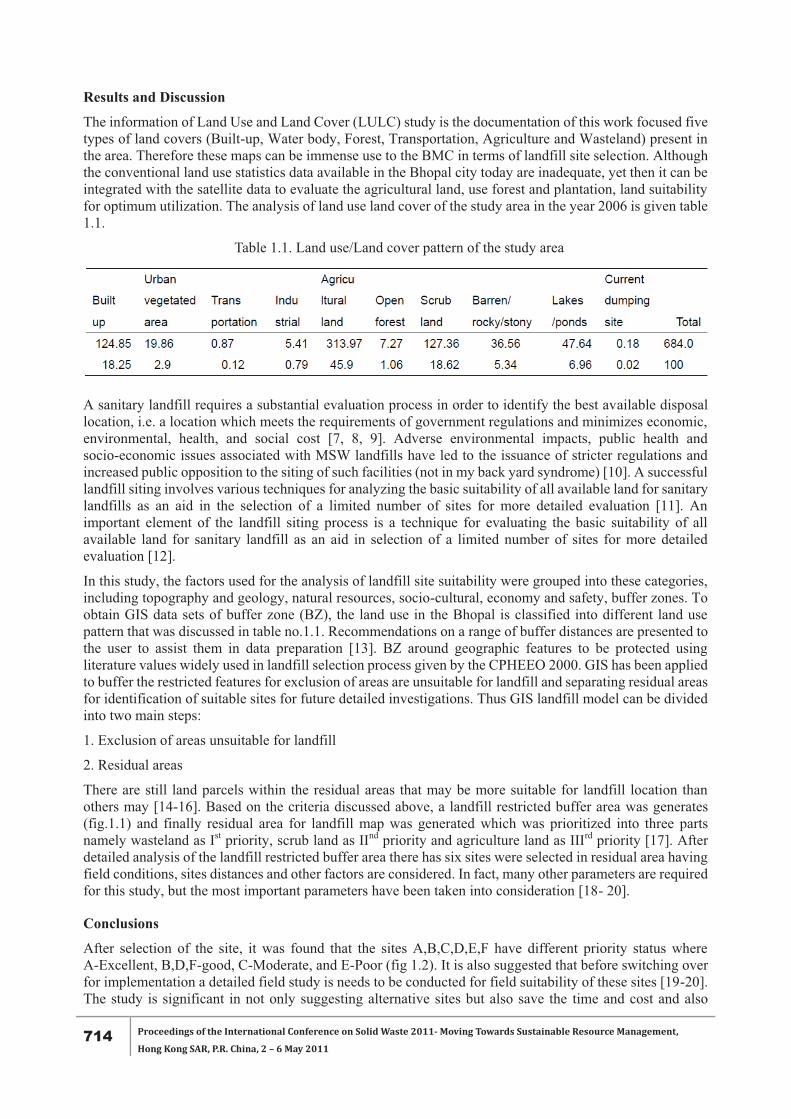
714 Proceedings of the International Conference on Solid Waste 2011- Moving Towards Sustainable Resource Management,
Hong Kong SAR, P.R. China, 2 – 6 May 2011
Results and Discussion
The information of Land Use and Land Cover (LULC) study is the documentation of this work focused five types of land covers (Built-up, Water body, Forest, Transportation, Agriculture and Wasteland) present in the area. Therefore these maps can be immense use to the BMC in terms of landfill site selection. Although the conventional land use statistics data available in the Bhopal city today are inadequate, yet then it can be integrated with the satellite data to evaluate the agricultural land, use forest and plantation, land suitability for optimum utilization. The analysis of land use land cover of the study area in the year 2006 is given table 1.1.
Table 1.1. Land use/Land cover pattern of the study area
A sanitary landfill requires a substantial evaluation process in order to identify the best available disposal location, i.e. a location which meets the requirements of government regulations and minimizes economic, environmental, health, and social cost [7, 8, 9]. Adverse environmental impacts, public health and socio-economic issues associated with MSW landfills have led to the issuance of stricter regulations and increased public opposition to the siting of such facilities (not in my back yard syndrome) [10]. A successful landfill siting involves various techniques for analyzing the basic suitability of all available land for sanitary landfills as an aid in the selection of a limited number of sites for more detailed evaluation [11]. An important element of the landfill siting process is a technique for evaluating the basic suitability of all available land for sanitary landfill as an aid in selection of a limited number of sites for more detailed evaluation [12].
In this study, the factors used for the analysis of landfill site suitability were grouped into these categories, including topography and geology, natural resources, socio-cultural, economy and safety, buffer zones. To obtain GIS data sets of buffer zone (BZ), the land use in the Bhopal is classified into different land use pattern that was discussed in table no.1.1. Recommendations on a range of buffer distances are presented to the user to assist them in data preparation [13]. BZ around geographic features to be protected using literature values widely used in landfill selection process given by the CPHEEO 2000. GIS has been applied to buffer the restricted features for exclusion of areas are unsuitable for landfill and separating residual areas for identification of suitable sites for future detailed investigations. Thus GIS landfill model can be divided into two main steps:
1. Exclusion of areas unsuitable for landfill
2. Residual areas
There are still land parcels within the residual areas that may be more suitable for landfill location than others may [14-16]. Based on the criteria discussed above, a landfill restricted buffer area was generates (fig.1.1) and finally residual area for landfill map was generated which was prioritized into three parts namely wasteland as Ist priority, scrub land as IInd priority and agriculture land as IIIrd priority [17]. After detailed analysis of the landfill restricted buffer area there has six sites were selected in residual area having field conditions, sites distances and other factors are considered. In fact, many other parameters are required for this study, but the most important parameters have been taken into consideration [18- 20].
Conclusions
After selection of the site, it was found that the sites A,B,C,D,E,F have different priority status where A-Excellent, B,D,F-good, C-Moderate, and E-Poor (fig 1.2). It is also suggested that before switching over for implementation a detailed field study is needs to be conducted for field suitability of these sites [19-20]. The study is significant in not only suggesting alternative sites but also save the time and cost and also

Proceedings of the International Conference on Solid Waste 2011- Moving Towards Sustainable Resource Management,
Hong Kong SAR, P.R. China, 2 – 6 May 2011 715
limiting the target area. Though GIS based methodology is highly sophisticated, developed or standard one but its success depends on the proper and careful application of it [21-22]. Thus with the use of these technologies management of municipal waste will no longer be a problem for city administrators [23].
References [1] Anindya Sen, (1997) Industry: Coping with new challenges, In India Development Report, 1997
Edited by Kirit S Parikh. Oxford University Press, Delhi pp124. [2] Allen AR, Dillon AM, O’Brien M., (1997), Approaches to Landfill Site Selection in Ireland,
Engineering Geology and the Environment. Balkema, Rotterdam pp 1569-1574. [3] Akolkar. AB., (2005) Status of Solid Waste Management in India, Implementation Status of
Municipal Solid Wastes, Management and Handling Rules 2000, Central Pollution Control Board, New Delhi.
[4] Rahman M., A. Hoque (2007), Site suitability analysis for solid waste disposal using GIS: A case study on KCC area. The Journal of Geo-Environment 6:72-86.
[5] Nishanth.T , Prakash M.N , Vijith.H (2010) Suitable site determination for urban solid waste disposal using GIS and Remote sensing techniques in Kottayam Municipality, India International Journal of Geomatics and Geosciences, volume 1, No 2.
[6] Sara Ojeda Benitez, Gabriela Lozano-Olvera, Raúl Adalberto Morelos, Carolina Armijo de Vega (2008), Mathematical modeling to predict residential solid waste generation Waste Management S7-S13.
[7] www.Landcover.org [8] Siddiqui, M.Z., J.W. Everett and B.E. Vieux, (1996) Landfill siting using geographic information
systems: a demonstration, Journal of Environmental Engineering 122;515-523. [9] Hasan Rashedul Mohammad, Tetsuo Kidokoro, and Islam Syed Ataharul (2009) Landfill demand and
allocation for municipal solid waste disposal in Dhaka city-an assessment in a GIS environment Journal of Civil Engineering (IEB), 37 :133-149.
[10] Ham, (1993) R.K. Ham, Overview and implications of US sanitary landfill practice, Air and Waste 43: 178–190.
[11] Lane, W. N. & McDonald, R. R. (1993) Land suitability analysis: landfill siting (ASCE) journal of Environmental Engineering, 109:50-61.
[12] McKechnie, R., Simpson-Lewis, W. & Neimanis, V. (1983) Sanitary Landfills and their Impact on Land in Stress on Land in Canada. Ottawa: Environment Canada, 34-91.
[13] CPHEEO (2000), Manual on Municipal Solid Waste management, pp.219-227 New Delhi, India. [14] Palnitkar, S. (2002) Manual of Solid Waste Management, AIILSG, Mumbai, pp. 9. [15] Valerie Cummins, Vicki O’Donnell, Alistair Allen, Joe Donnelly, Sotirios Koukoulas (2005), A New
approach to Landfill Site Selection in Ireland using GIS Technology, Environment Research Institute, University College Cork, Ireland.
[16] Tchobanoglous H. Theisen and S.A. (1993) Vigil, Integrated Solid Waste Management, Engineering

716 Proceedings of the International Conference on Solid Waste 2011- Moving Towards Sustainable Resource Management,
Hong Kong SAR, P.R. China, 2 – 6 May 2011
Principles and Management Issues, McGraw-Hill, NewYork, USA (1993) p. 377. [17] Ogra, A. (2003) Logistic Management and Spatial Planning for Solid Waste Management Systems
using Geographical Information System, Map Asia, India. [18] Lombardi M., Bellorini, N. (1996), Information and Decision Support System with GIS Technology:
Landfill Siting in Botkyrka, Research Thesis, Royal Institute of Technology. [19] Basak Sener M. Lu¨ tfi Su¨ zen Vedat Doyuran (2005) Landfill Site Selection by Using Geographic
Information Systems, Springer-Verlag, 376–388. [20] Sehnaz, Sener Erhan Sener, Remzi Karagüzel (2010) Solid waste disposal site selection with GIS and
AHP methodology: a case study in Senirkent-Uluborlu (Isparta) Basin, Turkey Springer Science. [21] Landfills deconstructed technology, management and experiences toxics link August (1998). [22] Rahman, M.M. and Subudhi, A.P., (2002) Site Suitability Analysis for Satellite Town of Chandigarh,
Plan Plus 01(01), 16-28 India. [23] Tripathi D.K., Singh S.P., Shukla J.P. (2010) Rag Pickers: An analysis of weaker section of the urban
area of Bhopal city, book chapter New Royal Book Co. ISBN: 978-93-80685-19-9

Proceedings of the International Conference on Solid Waste 2011- Moving Towards Sustainable Resource Management,
Hong Kong SAR, P.R. China, 2 – 6 May 2011 717
WASTE STABILIZATION AND POLLUTION REDUCTION IN SEMI-AEROBIC LANDFILL OPERATED UNDER NATURAL VENTILATION
C. Chiemchaisri 1*, W. Chiemchaisri 1, N. Sutthasil 1, K. Wangyao 2, K. Endo 3, M. Yamada 3
1 Department of Environmental Engineering, Faculty of Engineering, Kasetsart University, Thailand 2 King Mongkut’s University of Technology Thonburi, Thailand
3 National Institute for Environmental Studies, Japan * Corresponding author: E-mail: [email protected], Tel: +662-579 0730
ABSTRACT Leachate quality and methane emission from pilot-scale lysimeters operated under semi-aerobic and anaerobic conditions were monitored for 480 days. Two semi-aerobic lysimeters were filled with non-compacted and compacted municipal solid wastes whereas two anaerobic lysimeters containing compacted wastes were operated with leachate storage at 50% and 100% of waste layer height respectively. It was found that BOD in leachate from semi-aerobic lysimeters was reduced to less than 10% of its original value within 60 days, significantly shorter than 180-210 days observed in anaerobic lysimeters. Nitrogen concentration in leachate from semi-aerobic lysimeter could be reduced by 90% whereas no significant removal was observed in anaerobic lysimeters. In term of gas emission, non-compacted semi-aerobic lysimeter had much lower methane emission rate of 3.18 g/m2/d comparing to anaerobic landfill (83.29 g/m2/d). Nevertheless, semi-aerobic lysimeter with waste compaction has similar performance to anaerobic lysimeter.
Keywords: Biodegradation, Landfill gas emission, Leachate, Semi-aerobic
Introduction
Semi-aerobic landfill technology for improvement of disposal of municipal solid wastes (MSW) in Thailand, was investigated by lysimeter experiments. Semi-aerobic landfill system was originated by the Fukuoka City and Fukuoka University, Japan [1]. It allows convective air flows into the waste body through the leachate drainage pipes and gas venting pipes [2] and it lead to subsequent improvement of waste stabilization and leachate qualities due to the enhancement of the aerobic microbial activities in the waste body [3,4]. In this study, the performance of semi-aerobic landfill in terms of degradation of waste, leachate quality and greenhouse gas (GHG) emission under tropical climatic condition was investigated and compared to those of conventional anaerobic landfill. Carbon balance and methane to carbon dioxide ratio under semi-aerobic landfill condition and their potential GHG migration was determined.
Materials and Methods
Pilot-scale solid waste lysimeters (0.9 m diameter, 2.7 m height) were filled with simulated municipal solid wastes (MSW). The wastes composed of 20.0% food wastes, 19.0% paper, 19.0% plastic, 17.0% vinyl, 6.0% wood, 19.0% glass, representing typical unsorted municipal solid waste composition in Thailand. Two lysimeters were operated under semi-aerobic condition by providing air ventilation pipe above leachate drainage pipe, one of them was prepared without waste compaction (Sm I, 730 kg wastes, compaction density=640 kg/m3)and the other with compaction (Sm II, 740 kg wastes, 740 kg/m3). Two well compacted anaerobic solid waste lysimeters were operated with leachate level at 50% (An I, 740 kg wastes, 740 kg/m3) and 100% (An II, 740 kg wastes, 740 kg/m3) of height of waste layer respectively. The schematic of lysimeters and their operating conditions are shown in Figure 1.
Rainwater was discharged into the lysimeters from rainfall collection pans having 70% of lysimeter footprint area. During the experimental period, waste settlement, temperature and moisture of waste layer, leachate quantity and characteristics, and surface methane emission were monitored. For methane emission determination, close flux chamber was placed at the top of lysimeter and increasing rate of methane concentration in the chamber was determined by gas chromatography analyses.
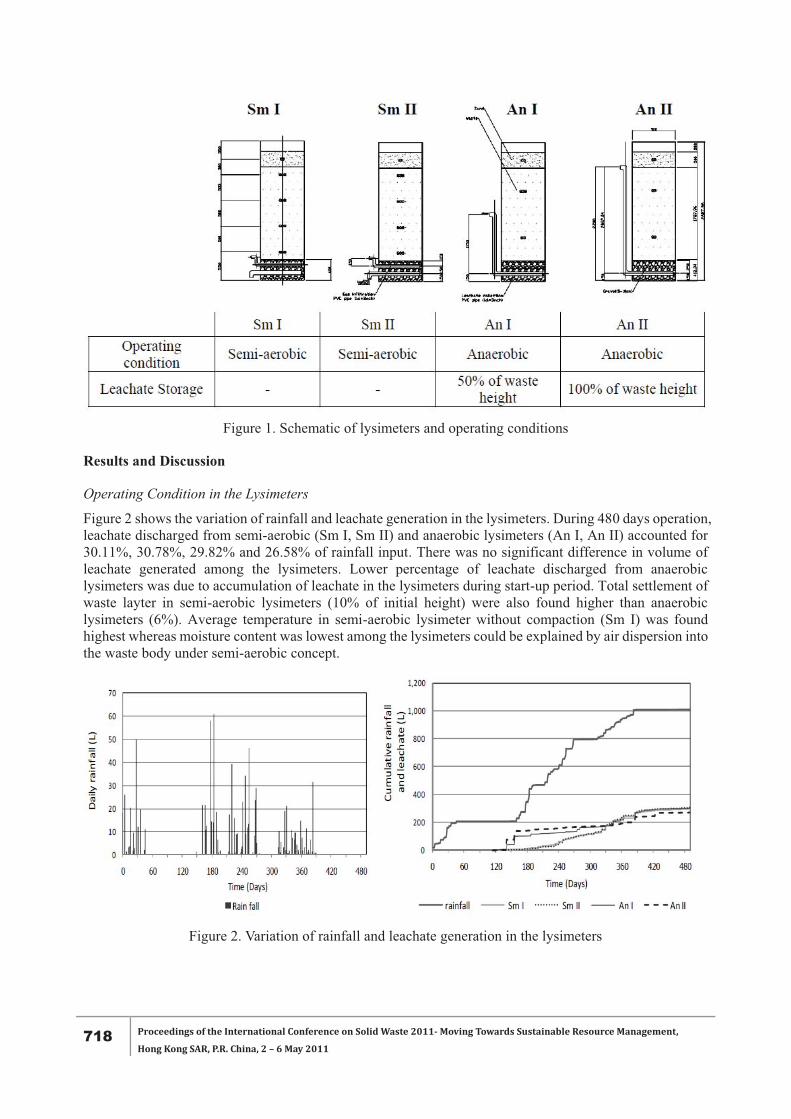
718 Proceedings of the International Conference on Solid Waste 2011- Moving Towards Sustainable Resource Management,
Hong Kong SAR, P.R. China, 2 – 6 May 2011
Figure 1. Schematic of lysimeters and operating conditions
Results and Discussion
Operating Condition in the Lysimeters
Figure 2 shows the variation of rainfall and leachate generation in the lysimeters. During 480 days operation, leachate discharged from semi-aerobic (Sm I, Sm II) and anaerobic lysimeters (An I, An II) accounted for 30.11%, 30.78%, 29.82% and 26.58% of rainfall input. There was no significant difference in volume of leachate generated among the lysimeters. Lower percentage of leachate discharged from anaerobic lysimeters was due to accumulation of leachate in the lysimeters during start-up period. Total settlement of waste layter in semi-aerobic lysimeters (10% of initial height) were also found higher than anaerobic lysimeters (6%). Average temperature in semi-aerobic lysimeter without compaction (Sm I) was found highest whereas moisture content was lowest among the lysimeters could be explained by air dispersion into the waste body under semi-aerobic concept.
Figure 2. Variation of rainfall and leachate generation in the lysimeters

Proceedings of the International Conference on Solid Waste 2011- Moving Towards Sustainable Resource Management,
Hong Kong SAR, P.R. China, 2 – 6 May 2011 719
Leachate Characteristics
Figure 3 shows leachate characteristics drained from the lysimeters. Leachate from anaerobic and semi-aerobic lysimeters with waste compaction (An I, An II, Sm II) was initially acidic and became neutral afterwards. Neutral condition was always maintained in semi-aerobic lysimeter with lower waste density. BOD in leachate were correspondingly high under acidic condition and significantly reduced afterwards. Time required for 90% reduction of organic concentration in leachate was only 60 days in semi-aerobic lysimeter (Sm I), much shorter than 180-210 days for the others. TKN were sharply increased after a lag time of about 60 days. Afterwards, they were maintained relatively constant in anaerobic lysimeters but gradually reduced under semi-aerobic condition. Presence of nitrate in leachate from semi-aerobic lysimeters suggests that nitrification reaction was responsible for the TKN reduction.
Methane Emission
Variation in gas emission rates are shown in Figure 4. Methane emission were 7.5-189.7 mg/kg wastes/d in anaerobic lysimeters with average emission rate of 62.7 mg/kg wastes/d. In semi-aerobic lysimeter, the emission was mostly less than 20 g/m2/d except few events after heavy rainfall. Average emission was 2.77 mg/kg wastes/d, more than 95% reduction from anaerobic condition. Significant reduction in methane emission could be achieved in semi-aerobic lysimeter operated under tropical rainfall event.
Figure 3. Chemical characteristics of leachate from the lysimeters

720 Proceedings of the International Conference on Solid Waste 2011- Moving Towards Sustainable Resource Management,
Hong Kong SAR, P.R. China, 2 – 6 May 2011
Figure 4. Daily variation and cumulative methane emissions from the lysimeters
Conclusions
Semi-aerobic landfill helped reducing leachate pollution comparing to anaerobic landfill. More than 90% of organic reduction in leachate could be achieved within 60 days. Ammonia nitrogen in leachate also reduced up to 90% through nitrification reaction. Nevertheless, waste compaction should be properly controlled to facilitate air flow into waste body. Average methane emission from semi-aerobic lysimeter was 2.77 mg/kg wastes/d, much lower than 62.7 mg/kg wastes/d observed in anaerobic landfill.
References [1] L.C. Theng, Y. Matsufuji. and M.N. Hassan. 2005. Implementation of the semi-aerobic landfill
system (Fukuoka method) in developing countries: A Malaysia cost analysis. Waste Management. 25: 702-711.
[2] H.J. Kim, H.Yoshida, T. Masuto, Y. Tojo and T. Matsuo. 2010. Air and landfill gas movement through passive gas vents installed in closed landfills. Waste Manage. 30: 465-472.
[3] Q. Huang, Y. Yang, X. Pang and Q. Wang. 2008. Evolution on qualities of leachate and landfill gas in the semi-aerobic landfill. J. Environ. Sci. 20: 499-504.
[4] S. Q. Aziz, H.A. Aziz, M.S. Yusoff, M.J.K. Bashir and M. Umar. 2010. Leachate characterization in semi-aerobic and anaerobic sanitary landfills: A comparative study. J. Environ. Manage. 91: 2608-2614.

Proceedings of the International Conference on Solid Waste 2011- Moving Towards Sustainable Resource Management,
Hong Kong SAR, P.R. China, 2 – 6 May 2011 721
MITIGATION OF GHG EMISSIONS THROUGH SEMI-AEROBIC LANDFILL METHOD
K. Wangyao 1*, M. Yamada 2, K. Endo 2, T. Ishigaki 2, C. Chiemchaisri 3, N. Sutthasil 3, S. Towprayoon 1
1King Mongkut's University of Technology Thonburi, Bangkok, Thailand 2 National Institute for Environmental Studies (NIES), Ibaraki, Japan
3 Kasetsart University, Bangkok, Thailand * Corresponding author. E-mail: [email protected], Tel: +66-2-4708309 #4152
ABSTRACT The semi-aerobic concept has been applied at the Laemchabang landfill, Chonburi, Thailand. The test cells in this site include parallelogram shaped (42 x 46 m) anaerobic and semi-aerobic cells. The municipal solid waste (MSW) was filled to a height of 3.5 m, and covered by 0.5 m of sandy loam in both the cells. About 4,000 tons of MSW were placed at each cell. The CH4 and CO2 emission measurements were conducted by using closed flux chamber technique for one year after waste was placed. It was found that the CH4 emissions at the semi-aerobic test cell were lower than from anaerobic cell by about 2.5 times. Whereas the total greenhouse gas (GHG) emission in terms of CO2-equivalent at the semi-aerobic test cell was lower than from anaerobic cell by about 2.4 times. From these preliminary results, it can be concluded that the semi-aerobic method can reduce significant greenhouse gas emissions over the period of operation compared to the anaerobic method.
Keywords: Semi-aerobic landfill, Municipal solid waste, Fukuoka method, Landfill gas emission
Introduction
Thailand is a developing country in the Asian region, with rapid urbanization, economic development and growth of population. This has led to problems of municipal solid waste (MSW) management and disposal handling [1]. The increasing MSW generation along with the high fraction of organic waste and a common disposal of open dumping is the current scenario in many areas which lack any precautionary environmental and health measures [2]. There is a need to implement “sustainable sanitary landfill concept” in the near future, to not only overcome local technological and financial constraints, but also for reducing local and global pollution in term of CH4 and leachates. The landfill site should play a role not only as a dumping site but also as a purifying site to quickly stabilize the waste [3]. One good candidate is the semi-aerobic type landfill (Fukuoka method) which was developed more than 20 years ago at Fukuoka University. It is a proven technology, practically tested in many places in Japan and in a few developing countries such as Malaysia, Iran and China but it is not widely known to many countries around the world [4]. The schematic of this system is shown in Figure 1.
Many studies have shown that the semi-aerobic method does not only accelerate the landfill stabilization process, reduces concentration of organic contaminants in leachate and reduces the quantity of LFG, but also could reduce ammonia concentration in leachate [5, 6]. Despite its wide application in developed countries like in Japan with successful outcome, many questions still remain, on its application in developing countries. Therefore, the research and development of appropriate landfill operation for Thailand has been established at Laemchabang landfill, Chonburi, Thailand. The main objective of this study is to find out the applicability of semi-aerobic landfill technology for municipal solid waste under a tropical climate in Thailand.
Materials and Methods
The test cells in this site include anaerobic and semi-aerobic cells that were constructed in parallelogram shape (42 x 46 m). In the semi-aerobic cell (SM), the design and construction was as per the Japanese standard. Two ventilation pipes and leachate collection pipes that are covered by crushed stone were constructed. However, in the anaerobic cell (AN), the design was as that of traditional landfill concept. The municipal solid waste was filled from October 2009 to November 2009 to a height of 3.5 m and covered with 0.5 m of sandy loam. Total waste in place was 3,942 and 4,098 tons in SM and AN. The sensors and sampling ports were installed at two levels (+2.00 and +3.00 m from the ground) including 18 temperature probes, 8 moisture sensors, 4 gas sampling ports, and 4 leachate extraction pans in each test cell.

722 Proceedings of the International Conference on Solid Waste 2011- Moving Towards Sustainable Resource Management,
Hong Kong SAR, P.R. China, 2 – 6 May 2011
Figure 1. Concept of semi-aerobic landfill
GHG emission rates from the landfill site surface in this study were determined using the static chamber technique. CH4 concentration in the chamber was measured by a Laser Methane Detector (LMD) - Anritsu SA3C15A (Anritsu Corporation) in 1 second intervals for 5 minute. CO2 concentration was measured by SenseAir (SenseAir Co., Ltd.) in 0.5 minute interval for 5 minute. The chambers used in this study were constructed with � 0.20 m PVC pipe, 1.00 m in height and with an acrylic cap at the top of the chamber. To protect against air intrusion, the chambers were sealed to the ground by placing wet soil around the outside rim. In this study, the Surfer software (Golden Software, Inc.) was used to analyze the geospatial distribution with the Kriging model.
Results and Discussion
One month after waste was placed; the sampling and investigation was started. The total CH4 emissions is shown in figure 2. The results show that CH4 can be found since the waste was placed only one month at both of AN and SM. In this study, 15 November 2009 is set as day zero. In earlier investigations, the results show that the CH4 emissions at AN are higher than SM by about 1.5-7 times. Obviously ssignificant reduction in CH4 emissions can be obtained in SM. The results from the first year showed that CH4 emission rates varied between 377.7 and 1011.8 kg/d in AN and between 15.8 and 106.9 kg/d in SM. In this study, the waste tipping finished at the beginning of dry season, the trend of CH4 generation increases from December 2009 to January 2010, and then drops in February 2010. The decrease might be due to the inadequate moisture content in waste body which retards the degradation activity in the waste body both in SM and AN. However, there were some out of season rainfall during March and April 2010. The results confirmed that increasing moisture content boosts the biological reactions. The CH4 emissions increased by about 3 times in April 2010 when compared to February 2010 and about 4 times in June 2010 when compared to April 2010. After that the CH4 emissions were dropped again due to reduction in rainfall.
The field results for CO2 emission rates varied between 648.1 and 1468.4 kg/d in AN and between 244.2 and 430.2 kg/d in SM. In most earlier investigations, the results show that the CO2 emission rate at AN are higher than SM by about 1.2-3.3 times. The CO2 emission rates at AN decreased from the beginning. In contrast, the rates fluctuated in SM. In order to investigate the performace of semi-aerobic landfill method in term of GHG reduction, the emissions of CH4 from AN and SM had been converted to CO2 equivalent (CO2eq) by multiplying with its global warming potential (GWP) of 21. After that GHG emission calculated by adding it to the CO2 emissions at every data set. The accumulation of GHG emissions is shown in Figure 3. The GHG reduction performance can be evaluated by using the ratio between the accumulation of GHG emission at AN and SM at each specific period. The results show that this decreased from 4.1 times at Day

Proceedings of the International Conference on Solid Waste 2011- Moving Towards Sustainable Resource Management,
Hong Kong SAR, P.R. China, 2 – 6 May 2011 723
30 to 2.4 times at Day 381. When roughly calculated from the results of 1 year period, the GHG emission from SM was only 41% compared to AN. This is an obvious benefit of semi-aerobic landfill method in term of GHG emission reduction.
Figure 2. The total CH4 and CO2 emissions (kg/d)
Figure 3. Accumulation of GHG emissions (t-CO2eq)
Conclusions
From these preliminary results, it can be observed that the semi-aerobic method can reduce significant GHG emissions during the period of operation and afterwards compared to the anaerobic method. Methane was significantly reduced by about 1.5-7 times since the beginning of the first testing year. Even in the wet season during which rain can stimulate biodegradation in the waste body, methane emissions from the semi-aerobic landfill were lower than the anaerobic landfill. After 1 year of testing, it was found that the GHG emissions at the semi-aerobic test cell were lower than the anaerobic cell by about 2.4 times. The results suggest that this method can be applied to the new small and medium scale landfills where landfill gas utilization is not feasible. Moreover, this method is a convenient and practicable method for developing countries with economic constraints and high organic matter in waste stream.
References [1] Thailand Environment Monitor. 2003. A joint publication of the Pollution Control Department (PCD)
of Thailand’s Ministry of Natural Resources and Environment (MoNRE), the World Bank, the United States-Asia Environmental Partnership (USAEP), and Japan Bank for International cooperation (JBIC).
[2] Chiemchaisri, C., Juanga, J.P., Visvanathan, C. 2007. Municipal solid waste management in Thailand and disposal emission inventory. Environmental Monitoring and Assessment, 135:13-20.
[3] Matsufuji, Y., Tanaka, A., Hanashima, M., Matsugu, H. 1997. Purification mechanism by activated

724 Proceedings of the International Conference on Solid Waste 2011- Moving Towards Sustainable Resource Management,
Hong Kong SAR, P.R. China, 2 – 6 May 2011
cover soil and a new landfill system. Proceedings Sardinia 97, Sixth International Landfill Symposium S. Margherita di Pula, Cagliari, Italy; 13-17 October 1997.
[4] Chong, T.L., Matsufuji, Y., Hassan, M.N. 2005. Implementation of the semi-aerobic landfill system (Fukuoka method) in developing countries: A Malaysia cost analysis, Waste Management, 25:702-711.
[5] Huang, Q.F., Wang, Q., Yang, Y., Dong, L. 2005. Influence of landfill structure on leachate characteristics. Proceedings Sardinia 2005, Tenth International Waste Management and Landfill Symposium, S. Margherita di Pula, Cagliari, Italy; 3-7 October 2007.
[6] Matsufuji, Y., Tachifuji, A., Matsugu, H. 2005. Biodegradation process of municipal solid waste by semiaerobic landfill type. Proceedings Sardinia 2005, Tenth International Waste Management and Landfill Symposium, S. Margherita di Pula, Cagliari, Italy; 3-7 October 2007.

Proceedings of the International Conference on Solid Waste 2011- Moving Towards Sustainable Resource Management,
Hong Kong SAR, P.R. China, 2 – 6 May 2011 725
UNFOLDING AN OPEN DUMP UNDER WATER USING GIS TOOL IN MANDAUE CITY, CEBU, THE PHILIPPINES
E.P. Crucio
Environment Department, Graduate School,Miriam College Foundation, Philippines E-mail: [email protected], Tel. 6332.5162407
ABSTRACT The Ecological Solid Waste Management Act of 2000 or RA 9003 is almost eleven years old since its enactment by Congress in 2001. There are only two main purposes of the law which is to protect the environment and public health. This paper aims to investigate whether the site and location of the present open dump in Barangay Umapad, Mandaue City sits on the land over the four decades of its existence. The study will be utilizing key informant interview and baseline data assessment of the various agencies involved in the problem such as University of San Carlos Water Resource Center (USC WRC) and the local government of Mandaue City. The expected results will show how the site of the open dump evolved through the years since its establishment.
Keywords: GIS, Open dump, Reclaimed land, Local government unit, Barangay
Introduction
Mandaue City is located in the coastal plains of Cebu Province as shown in Figure 1. It is bounded on the north by the Municipality of Consolacion, on the east by the Mactan Channel, on the southwest by Barangay Banilad (Cebu City), on the northwest by Barangay Talamban (Cebu City) and on the south by Cebu North Reclamation. About 40 percent of Cebu’s export companies are found in Mandaue. Mandaue City became a chartered city on June 21, 1969. It is a highly urbanized and industrialized city which is home to about 10,000 industrial and commercial establishments. It is home to two major ports, Pier 7 Gothong and Pier 8 Shuttle. Population of Mandaue City is 317, 575.
Barangay Umapad has a total population of 10,436 (recent census) and a land area of 76 has. It hosts the open dumpsite. It is surrounded by open areas and former fishponds and saltbeds on the south. Around 2.5 to 3.0 kilometers south from the city center, the dump site is located. The existing dump is located near the Butuanon River and near the coastline. There are around 100 households directly depend on waste picking at the dump site. The Umapad open dump has been in existence for four (4) decades now. Around 560,000 cubic meter mixed waste deposited in that dump since its operation. It is about 5 hectares. According to the City Profile 2009, the total volume of garbage disposed is 195 tons per day. It also places the total volume of waste being composted to 80 tons and being recycled and reused to 70 tons.
This paper will have relevance as to possible groundwater contamination because of the presence of the open dump in Barangay Umapad in Mandaue. Baseline data assessment and key informant interview will be used as one of the few methods to prove the hypothesis.
Materials and Methods
Google map was utilized to get the global positioning system (GPS) points in the absence of a gadget. After the securing the visual map, next thing was to get the print out of base map containing wells and location of dump site. Then it was scanned it to get an electronic copy. Using excel format and dbase IV, the excel files are converted. The process flow enumerates the details of the procedure. Maps used are from USC WRC, NAMRIA, the national government’s mapping agency and Google map. The process flow followed the sequence below.
� Secured a base map from USC WRC. � Secured an Excel data on water wells � Got the GPS points of the dump site through Google Map � Encoded in .xls format the GPS points + wells � Converted it to .dBASE IV format � Themes added using nationaldataset which features database based on NAMRIA
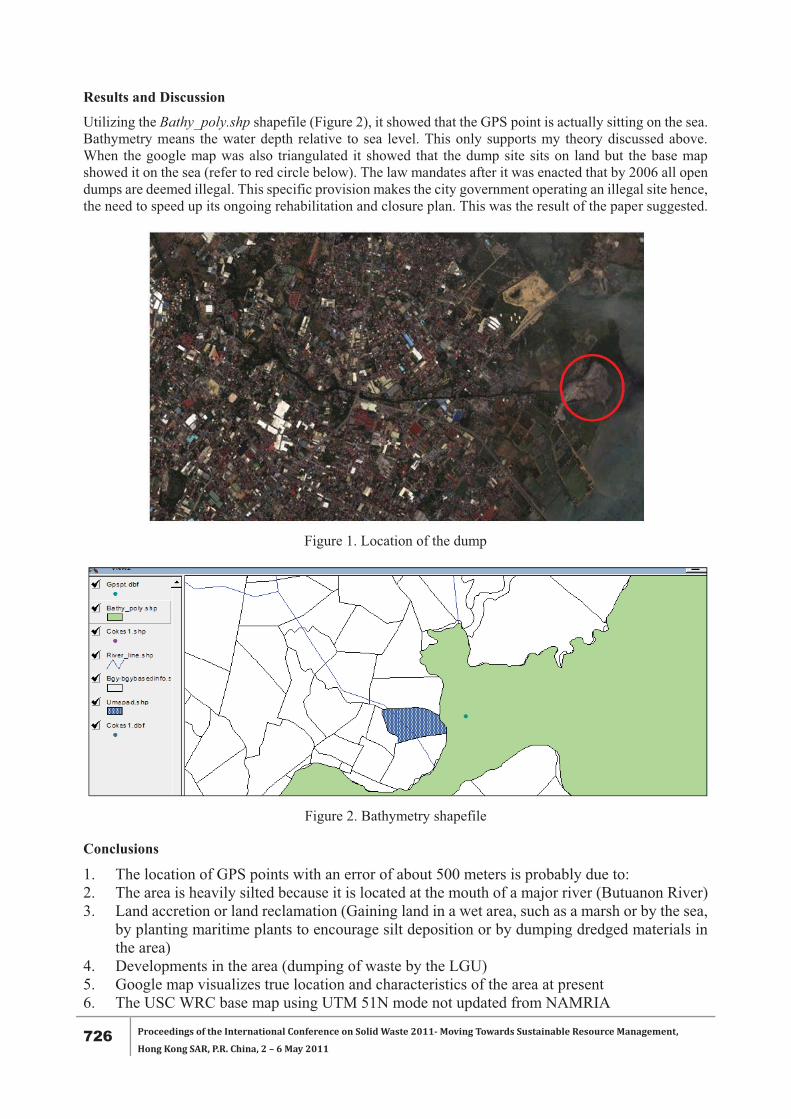
726 Proceedings of the International Conference on Solid Waste 2011- Moving Towards Sustainable Resource Management,
Hong Kong SAR, P.R. China, 2 – 6 May 2011
Results and Discussion
Utilizing the Bathy_poly.shp shapefile (Figure 2), it showed that the GPS point is actually sitting on the sea. Bathymetry means the water depth relative to sea level. This only supports my theory discussed above. When the google map was also triangulated it showed that the dump site sits on land but the base map showed it on the sea (refer to red circle below). The law mandates after it was enacted that by 2006 all open dumps are deemed illegal. This specific provision makes the city government operating an illegal site hence, the need to speed up its ongoing rehabilitation and closure plan. This was the result of the paper suggested.
Figure 1. Location of the dump
Figure 2. Bathymetry shapefile
Conclusions
1. The location of GPS points with an error of about 500 meters is probably due to: 2. The area is heavily silted because it is located at the mouth of a major river (Butuanon River) 3. Land accretion or land reclamation (Gaining land in a wet area, such as a marsh or by the sea,
by planting maritime plants to encourage silt deposition or by dumping dredged materials in the area)
4. Developments in the area (dumping of waste by the LGU) 5. Google map visualizes true location and characteristics of the area at present 6. The USC WRC base map using UTM 51N mode not updated from NAMRIA

Proceedings of the International Conference on Solid Waste 2011- Moving Towards Sustainable Resource Management,
Hong Kong SAR, P.R. China, 2 – 6 May 2011 727
7. The reference point of google and WRC does not jibe 8. The location of the GPS points in the mangrove area (refer to google map of the site) seemed
to suggest a partial reclamation at the side of the mangroves and judging from the history of the area, it was formerly a fishpond site and saltbed area
9. The coastline is originally based on NAMRIA couldn’t explain the true location of the open dump
10. Google map is based on recent and modern satellite installation in the space and the USC WRC map is based on NAMRIA, thus, there is a need to harmonize the database so that uniform or standardized base maps are utilized to avoid inconsistencies.
11. The city government should expedite the closure and rehabilitation plan since it is already shown that the site is illegal and outside the siting criteria of a proper disposal facility.
Figure 3. Triangulation: 8+ kilometers distance to Punta Engano in Mactan Island
Acknowledgements
I would like to acknowledge the persons instrumental in assisting me in this paper. To Mr. Teofilo Remedio of USC WRC; Engr. Mario Almocera of UP Cebu Natural Science Department; Ms Annie Diola, Faculty member of USC Biology and GIS 200 lecturer; Mr. Lito Commendador of SWM Unit EMB/DENR-7 for accompanying me in the survey; Institutions which have also inspired and supported this paper in some ways are Miriam College, DENR-EMB-7, and the Hong Kong Baptist University through Prof. Jonathan Wong for the scholarship grant awarded to the corresponding author.
References [1] Bolstad P. 2005. GIS Fundamentals: a first text on geographic information systems. 2nd ed. Minnesota.
Eider Press. [2] Ecological Solid Waste Management Act of 2000 or Republic Act 9003. Philippine Congress. [3] http://www.unep.or.jp/ietc/GPWM/data/T2/WP6_I_InstitutionalFramework_Mandaue.pdf
(accessed on March 25, 2011) [4] Jaque, D. 2010. Mandaue City Umapad Dump Site Closure Plan. Hydronet Consultants, Cebu City.