Embed Size (px)
Citation preview
International comparisons of unemployment indicators
Seven unemployment indicators for I989 reveal major labor market d@erences among North America, Europe, and Japan; Sweden and Japan have the largest increases in unemployment when part-time work for economic reasons and discouragement with the labor market are taken into account
Constance Sorrentino F or a long time now, international compari- sons of labor markets have focused on the unemployment rate, which gives an impor-
tant, but incomplete, indication of how well labor markets are functioning from country to country. The unemployment rate is a convenient and well- known concept; however, too exclusive a focus on this single measure may distort our view of the economies of other developed nations in compari- son with that of the United States.
Thus far, the Bureau of Labor Statistics’ ap- proach to international labor market comparisons has been limited largely to analyzing unemploy- ment rates adjusted to the usually cited U.S. con- cept and to providing periodic data and analysis of other labor market indicators, such as employ- ment, employment-to-population ratios, and labor force participation rates, to help round out the pic- ture.’ international unemployment figures are regularly presented in terms of age and sex, but not according to the many other dimensions of un- employment and underemployment. Additional statistics are needed for a balanced interpretation of comparative labor market conditions.
Constance Sorrentino is an economist in the Division of Foreign Labor Statistics, Bureau of Labor
Statistics.
Since 1976, the Bureau has published altema- tive unemployment measures for the United States known as U-l through U-7.? The presentation of these measures recognizes that no single unem- ployment definition can serve all the purposes for
which such data are needed. Under this frame- work, U-5 is the official, usually cited. U.S. unem- ployment rate, while U-l through U-4 narrow in on certain “more serious” types of unemployment. such as joblessness of long duration and persons who have lost their jobs (as opposed to new en- trants and reentrants into the labor force and job leavers). U-6 and U-7 portray broader concepts of unemployment than does U-5, bringing into consideration two additional elements of under- utilization of labor: persons working part time for economic reasons and discouraged workers.
This article introduces a set of measures com- parable to U-l through U-7 for eight foreign countries for 1989. The United States, Canada. Ja- pan, five major European Community countries. and Sweden are covered. The data for Germany relate to the former West Germany only and ex- clude the eastern regions of the country.
A slight modification was made in the defini- tion of U-l to enhance international comparabil- ity. Otherwise, the framework used here is the same as that derived for U-l through U-7 from the Current Population Survey. Data were available to calculate all of the indicators. except U-7 for Germany.
For the United States. U-l through U-7 repre- sents a progression from low to successively higher unemployment rates. This is not necessarily

Alternative Unemployment Indicators
the case for the other countries. For instance, un- employment of long duration (U-l) is higher than unemployment due to job loss (U-2) in most of the other countries studied. In addition, the broader rates (U-6 and U-7) show important dif- ferences in international relationships that are not evident in international comparisons of the con- ventional measure (U-5). For example, Sweden and Japan, the countries with the lowest U-5 rates, have the largest proportionate increases in unem- ployment as measured by U-7. Indeed, the Japa- nese rate, including persons working part time for economic reasons and discouraged workers, was less than 1 percentage point below the comparably defined U.S. rate. Labor slack in Japan is reflected more in underemployment and discouragement than in actual unemployment, probably for institu- tional and cultural reasons.
While Sweden had a large proportionate in- crease of U-7 over U-5, the rate was still very low, compared with the same measure for other countries. For Sweden, where active labor mar- ket programs remove a significant number of persons from the ranks of the unemployed, a fur- ther measure beyond U-7 is needed to cap- ture the impact of this phenomenon on the job- less rate. A section of this article presents infor- mation on the Swedish situation, because it is important to an understanding of that country’s low unemployment rates.
The article presents an international compari- son of U-1 through U-7 for 1989 in eight coun- tries and for February 1990 in Japan. The year 1989 was a year of relatively low or average un- employment (for the 1980’s) for most of these countries. Data for February 1989 were available for Japan, but were not used, because of unusual circumstances that took place during the survey week. (See the appendix.) Japanese unemploy- ment was marginally lower in 1990 than in 1989. Annual average 1989 data are used for the United States, Canada, and Sweden; the figures for the European Community countries are taken from surveys conducted in the spring of that year.
The U-5 figures for Japan and the European Community countries are very close to the annual average, and therefore, the other measures can probably be viewed as good indicators for the en- tire year. For France and Italy, 1989 was a year of relatively high unemployment, and this affects the international rankings because of the cyclical di- mension to the indicators studied. To the extent that countries are in different phases of the busi- ness cycle, the comparisons for only 1 year will be affected to some degree. However, the main rela- tionships among the various indicators are quite similar to those in an earlier study for the year 1984, when all of the countries were in or just coming out of a recession.’
Under a program that began in the early 1960’s, the Bureau has published foreign unem- ployment rates adjusted to U.S. concepts. This ar- ticle represents an extension of the methods em- ployed in that longstanding program. An appendix describes the data sources, methods of adjust- ment, and limitations associated with some of the adjustments.
Seven indicators
The box on this page shows the definitions of the seven alternative unemployment indicators. The sequence U-l through U-7 illustrates a range of unemployment measures, going from a very nar- row to a very broad view. Other unemployment indicators could have been chosen instead. The ones included were originally chosen “because they are representative of differing bodies of opinion about the meaning and measurement of unemployment; because they are meaningful and useful measures in their own right; and be- cause they can generally be ranked along a scale from low to high.‘” A short description of each indicator and the rationale behind it follows.
Alternative unemployment indicators
U-l Long-duration unemployment rate: Per- sons unemployed 13 weeks or longer, as a percent of the civilian labor force.
U-2 Job loser rate: Job losers, as a percent of the civilian labor force.
U-3 Adult unemployment rate: Unemployed persons aged 25 and over, as a percent of the civilian labor force aged 25 and over.
U4 Full-time unemployment rate: Unem- ployed full-time jobseekers, as a percent of the full-time labor force.
U-5 Conventional unemployment rate: Total unemployed, as a percent of the civilian labor force.
U-6 Rate encompassing persons working part-time for economic reasons: Total full-time jobseekers, plus half of the part-time jobseekers, plus half of the to- tal number of persons working part time for economic reasons, as a percent of the civilian labor force, less half of the part- time labor force.
U-7 Rate adding discouraged workers: U-6 plus discouraged workers in the numera- tor and denominator.
4 Monthly Labor Review March 1993
U-f. U-l has been redefined slightly for com- parative purposes. In the published figures per- taining to the United States, it represented persons unemployed I5 weeks or longer, as a percent of the civilian labor force. However, most other countries break their categories denoting duration of unemployment at 3 months ( I3 weeks), rather than I5 weeks. Because U.S. data are available (in unpublished form) for durations of a single week, these data were used to modify the U-l measure for the United States to conform with the defini- tion citing I3 weeks or longer as the breakpoint. This modification makes only a slight difference in the U-l rate for the United States, increasing it from I. I percent to I.2 percent in 1989.
sons on temporary layoff and persons waiting to start a new job are not required to seek work in the past 4 weeks, a necessary condition for clas- sification as unemployed. U-5 can be viewed as the base series from which each of the other six measures is constructed, through addition or subtraction of various labor force and unem- ployment components.
U-5 is a consensus definition. It simply re- quires that, with two exceptions, jobseeking take place in the past 4 weeks. U-5 has had widespread support from various study groups and has under- gone little change over the years.5
U-5 follows the general guidelines for measur-
U-l excludes unemployment of a short-term, job-changing nature. The rationale behind U-l is the belief that the impact of joblessness is more severe the longer it lasts, because presumably, shorter periods of unemployment can be with- stood through unemployment compensation and savings.
U-2. The second series, U-2, is the number of persons who have lost their last jobs, as a percent of the civilian labor force. This measure focuses on experienced workers, for whom the loss of a job may lead to a significant loss of income. Un- employment resulting from reentry into the labor force, entering the labor force for the first time, and leaving a job ate excluded from this series.
ing unemployment recommended by the Intema- tional Labour Office. Most other countries now also follow these general guidelines, with occa- sional modifications for specific national circum- stances. The guidelines are not specific on some points, allowing for interpretations to fit national needs. For instance, the Office recommends that jobseeking in a “specified recent period” occur for classification as unemployed. Most countries, in- cluding the United States, have set that period at 4 weeks.
U-6. The first of the two rates that are broader
U-3. This series was originally defined as the number of heads of household that were unem- ployed, as a percent of all heads of household in the civilian labor force. However, the Bureau no longer publishes data in terms of heads of house- hold, because of the increasing difficulty of identi- fying such a person in a household in which both husband and wife work. Consequently, U-3 has been reformulated to cover adult unemployed per- sons, defined as persons 25 years of age and over, as a percent of the civilian labor force in that age group. This measure is designed to focus on workers who have completed their basic educa- tion and generally have a serious commitment to the labor market.
than U-5. U-6 includes the number of unem- ployed persons seeking full-time work, plus one- half of the number of unemployed persons seeking part-time work and one-half of the number of those involuntarily on part-time schedules for eco- nomic reasons. The denominator for this rate is the civilian labor force, less half the part-time labor force. The reasoning behind this formulation is that involuntary part-time workers should be counted as at least partially unemployed: simi- larly, unemployed persons seeking only part-time work should be given just half the weight of unem- ployed persons seeking full-time jobs, because their employed counterparts work, on average, only about half of a full workweek. This indicator moves from the activity-based concept of the labor force used in all the earlier indicators to a “time lost” type of concept.
U-7. The second of the two rates that are broad- er than U-5, U-7 is the same as U-6, except that the number of discouraged workers is added to both the numerator and denominator. Discouraged workers are defined as persons who are jobless and want work, but are not looking for work be- cause they believe that they cannot find it. This is the broadest measure and is designed to be the most inclusive.
Ud. U4 is the number of unemployed persons seeking full-time jobs, as a percent of all those in the full-time labor force (including all those em- ployed part time for economic reasons). The idea in this case is that full-time workers are more strongly attached to the labor force than are part- time workers.
U-5. The official, usually cited, unemploy- Overall results ment rate represents the total number of persons not working, but available for and seeking work, Table I shows the seven indicators for the United as a percent of the civilian labor force. Only per- States and eight foreign countries for 1989 (Febru-
Monthly Labor Review March 1993 5
Alternative Unemployment Indicators
ary 1990 for Japan). Table 2 shows each indicator in each country in terms of its ratio to the conven- tional measure, U-5, in that country; this is a con- venient means of comparing the various rates both within and among countries. In each table, figures are shown for both sexes, men, and women. Data were available to calculate all rates for all coun- tries, except that U-7 could not be calculated for Germany because no data on discouraged workers were available.
Table 2 highlights some of the international differences in labor markets that are not ex- pressed in the conventional unemployment rate. Only in the two North American countries did U-l through U-7 represent a progression from low to successively higher unemployment rates. Only in these two countries and Sweden was the job loser measure (U-2) higher than the long- duration measure (U-l). In Italy, U-l was higher than U-3, the measure of adult unem- ployment, while in France, U-l and U-3 were identical. In Japan, Germany, and the Nether- lands, U-3 was higher than U4, the full-time
the United Kingdom, U4 was higher than the conventional unemployment rate, U-5. In Swe- den, U4 and U-5 were identical. Most of these relationships were also observed in the 1984 study.
Sweden had, by far, the largest proportionate increases in unemployment, as measured by U-6. The Swedish rate was more than double the U-5 rate, whereas the increases for the other countries were much smaller. For example, the U-6 rate was 36 percent higher than the U-5 rate in the United States and was only 3 percent higher in Germany. Japan had the largest proportionate increase from u-6 to u-7.
Chart I illustrates the increase from the con- ventional rate to the most comprehensive rate, U-7, in eight of the countries studied (exclud- ing Germany). In Sweden, U-7 was almost triple U-5, although it was still low in comparison with U-7 in other countries. Japan’s U-7 rate was more than three times the U-5 rate, but Japan still ranked second lowest among the countries stud- ied. However, the Japanese U-7 rate drew much
unemployment rat& and in France, Italy, and closer to the U.S. rate.
Table 1. Alternative unemployment Indicators, U-l to U-7, nine countries, 1989’
[In percent]
European Community Indicator United States Canada Japan Sweden
France Germany Italy Netherlands United Kingdom
Both sexes
U-l . . . . . . 1.2 Xi 1.1 0.5 8.1 4.6 7.3 6.9 5.2 u-2 . . . . . . 2.4 .4 .7 4.1 1.7 .6 1.1 1.5
E . . . . . . . . u-5 . . . . . .
4.0 4.9 6.6 7.4 1.7 1.6 1 1.4 .o 10.4 8.1 5.8 5.3 4.3 8.0 7.6 6.6 8.0 5.3 7.5 2.2 1.4 9.7 5.8 7.8 i:: 7.4
E . . . . . . . . . . . . 7.2 7.9 9.5 9.9 27.2 2.8 3.4 3.8 10.9 11.1 6.0 (7 10.0 15.8 11.8 12.6 8.7 9.3
Malt
U-l . . . . . . ::i 3.1 1.1 .6 6.0 3.7 5.1 5.5 5.9 U-2 . . . . . . 4.4 .5 .6 3.6 1.6 .6 1.2 2.0
. . . . . . 3.9 6.1 1.3 1 .o 6.1 4.5 2.9 5.7 6.7
ii . . . . . . . . . . . . 4.8
2: 7.3
7.0 7.3 1.6 1.9 1.3 1.4 7.9 7.4 4.6 4.6 5.5 5.4 6.4 6.9 7.9 7.7
E :::::: 8.6 8.2 23.8 2.2 2.1 2.4 8.1 8.1 4.8 (7 10.0 7.1 8.2 8.5 8.3 8.8
woman
E . . . . . . 1.0 1.8 3.1 3.2 1.2 u-3 :.:... 4.2 7.3 2::
.5 .7 1.1
u-4 . . . . . . 5.1 7.9 ::i 1.4 u-5 . . . . . . 5.4 7.9 1.5
. . . . . . 7.9 11.1 3.7 2 U-7 . 8.7 11.7 212.3
’ February 1990 for Japan. 2 Midpoint of range of estimates. 3 Not available.
NOTE: U-l, long-term unemployment rate; U-2, job loser rate; U-3, adult unemployment rate; W. full-time unemployment rate; U-5, conventional
10.7 4.8 6.0 1.9 11.4 .6 9.0 1.1 4.4 .9 10.6 7.9 7.0 11.1 6.5 14.5 6.8 13.2 7.9 8.1 12.6 7.5 12.0 11.9 7.1 14.9 8.2 15.8 19.1 9.4 15.3 (‘1 26.1 20.7 9.9
measure; U-6, rate encompassing persons working part time for economic reasons: U-7, U-6 plus discouraged workers. (See box on page 4.)
SOURCE: Compiled by Bureau of Labor Statistics from labor force surveys for each country.
6 Monthly Labor Review March 1993
Table 2. Alternative unemployment indicators as a ratio of the conventional measure (U-5), nine countries, 1989’
[U5 = loo]
Indkcator
Both sexes
European Community United States Canada Japsn Swedsn ’
France Germany blY Netherlands United Kingdom
U-l ...... 23 U-2 ...... 45 2
50 36 04 79 94 70 10 50 42 29 ii
E ............ iz ii 77 71 84 100 5: iz 89 73 100 107 91 103 76 108
U-5 ...... 100 100 100 100 100 100 100 100
E ............ 136 127 127 :z 112 103 128 134 118 149 132 2327 271 114 (9 203 143 126
Men
U-l ...... 27 42 58 43 80 94 80 U-2 ...... 56 60 43 ill 35 z U-3 ...... 75
ii ii 71 82 98 iJl i: 07
u-4 ...... 92 84 93 107 100 102 93 103 U-5.. .... 100 100 100 100 100 100 100 100 100 u-6.. .... 131 112 116 150 109 104 131 119 108 U-7.. .... 140 118 Qoo 171 109 (7 185 123 114
women
U-l ...... ii
39 43 33 85 95 76 62 U-2 ...... 41 7 47 38 z 5 9 13 U-3 ...... 70 92 71 73 84 105 50 93 92 u-4 94 100 61 93 115 91 110 66 114 ...... U-5.. 100 100 100 100 100 100 100 100 100 .... u-6 132 161 132 ...... 146 141 132 340 116 109 U-7 ...... 161 148 2439 373 121 VI 216 174 139
1 February 1990 for Japan. unemployment rate; U-4, full-time unemployment rate; U-5, conventional z Midpoint of range of eslimates. measure; U-6, rate encompassing persons working part time for economic 3 Not available. reasons; U-7, U-6 plus discouraged workers. (See box on page 4.)
NOTE: U-l, long-term unemployment rate; U-2, job loser rate; U-3, adult SOURCE: Table I.
Italy also experienced a large increase in its ships to U-5 for both men and women. U-7 rate, but the rise was not as great as the in- crease in U-7 for Japan or Sweden, because Italy’s U-5 rate was much higher than Japan’s and Sweden’s. In Italy, U-7 was twice as high as the conventional rate and ranked highest among the countries studied.
With some differences in degree, the foregoing relationships held for both men and women. (See table 2.) For the narrower indicators, U-l through U-4, the differences between the rates for men and women in relation to U-5 were not large. Women tended to have lower U-l rates, com- pared with U-5, than did men in those countries that were not members of the European Commu- nity. Within the Community, except for the United Kingdom, the differences between U-l and U-5 were about the same for men as for women. In all of the countries studied except Sweden, the job loser rate (U-2) was more favorable for women than for men, compared with U-5. With few ex- ceptions, adult unemployment (U-3) and full-time unemployment (U-4) rates had similar relation-
In every country studied, unemployment, as measured by U-6 and U-7, increased to a greater extent for women than it did for men, and in Swe- den and Japan in particular, the difference was very large. (See table 2.) In Sweden, the U-7 rate increased nearly twofold for men, but almost four- fold for women, over the U-5 rate. In Japan, U-7 for men was double their U-5 rate, but for women, it was more than 4 times as great as U-5.
Table 3 ranks the nine countries examined in terms of each of the seven indicators, from lowest (best) to highest (worst). Sweden’s labor market outperformed the others with regard to every indi- cator except for U-2, the job loser rate, where Ja- pan and Italy barely displaced Sweden with the lowest rates, and U-6, where Japan also outranked Sweden.
The United States ranked from second to fourth best in every indicator except job losers (U-2). At 2.4 percent of the civilian labor force, this rate was relatively high. Only Canada’s and France’s U-2 rates were higher.
Monthly Labor Review March 1993 7
Alternative Unemployment Indicators
France had the highest rates for U-1 through in 1989 was above their averages for the 1980’s. U-5. This was partly because 1989 was a year of The following tabulation presents the 1989 U-5 high unemployment in France, but a year of low or rate (February 1990 for Japan) and the average average unemployment in most of the other coun- U-5 rate for the decade for each of the countries tries studied. In the 1984 investigation, France studied, with the ranking of each country in paren- typically placed in the middle of the ranking for theses after each rate (for Sweden, Germany, Italy, each indicator. The Netherlands had the highest and the Netherlands, the average for the 1980’s is U-6 rate, while Italy had, by far, the highest U-7 an estimated annual average, adjusted for breaks in rate. the series):
The rankings changed somewhat by sex. (See table 3.) The most significant change was for Japanese women, who experienced a very large increase in their U-7 rate. Ranking best among all the countries studied in their figure for U-6, Japa- nese women fell behind women in four other countries when discouraged workers were added.
1989 Average for
1980’S
Canadian men displaced French men with the highest U-2 rate, and British men had higher U-3 and U-5 rates than did French men. Italian women had the highest incidence of long-duration unem- ployment (U-l), whereas the rate for Italian men was toward the middle of the rankings. Dutch women had the highest rates of adult unemploy- ment (U-3) and also the highest rate including persons who worked part time for economic rea- sons (I-J+.
The following sections of this article take a more indepth look at each of the seven indicators and the reasons behind the international differ- ences noted. The discussion begins with U-5, be- cause it is the rate from which all of the others are derived.
Conventional measure (U-5)
United States . . . . . . 5.3 (3) 7.3 (5) Canada. . . . . . . . . . 7.5 (6) 7.8 (6) Japan . . . . . . . . . . . . 2.2 (2) 2.5 (2) Sweden . . . . . . . . . 1.4 (I) 2.1 (1)
European Community: France . . . . . . . . . . . 9.7 (9) 9.2 (7) Germany . . . . . . . . 5.8 (4) 5.8 (3) Italy . . . . . . . . . . . . . 7.8 (7) 7.0 (4) Netherlands . . . . . . . 8.8 (8) 9.9 (8) United Kingdom . . . 7.4 (5) 10.1 (9)
Four countries-Canada, Japan, Sweden, and the Netherlands-ranked the same in 1989 as they did for the entire decade, and Germany’s 1989 ranking was only slightly changed from its decade-long average. The United States and the United Kingdom had improved rankings in 1989 over their average for the decade. The United Kingdom had the highest U-5 rate, on average, for the 1980’s, while France and Italy fared worse under the 1989 rankings than they did for the decade.
Among the countries studied, Sweden and Japan had the lowest unemployment rates (between 1 and 3 percent), in terms of persons who were with- out work, seeking work, and currently available for work. The United States placed in the next tier of the range, along with Germany, with a rate he- tween 5 and 6 percent. Canada, Italy, and the United Kingdom followed. with rates between 7 and 8 percent. The Netherlands recorded a rate of almost 9 percent, while France was at the high end of the spectrum, with a jobless rate of 9.7 percent.
International differences in unemployment rates, as conventionally defined, have been ad- dressed in numerous studies. In a 1978 bulletin, the Bureau found explanations for these differ- ences in such factors as cyclical trends, labor force growth and composition, labor migrations, sea- sonality, income maintenance arrangements (for example, unemployment insurance), labor market programs, the transition from school to work, and legal, cultural, and social considerations.”
Compared with the average for the 1980’s. the year 1989 was one of exceptionally low unem- ployment for the United States, Sweden, and the United Kingdom. That year, the official U.S. job- less rate stood at 5.3 percent, while the average for the decade was 2 percentage points higher. Canada and the Netherlands had somewhat lower unemployment rates in 1989, compared with their averages for the decade, but the differences were small. Japan’s February 1990 rate used in these comparisons was a bit below that country’s 1980’s average. For Germany, the 1989 unemployment rate was virtually the same as the average for the decade, while in France and Italy, unemployment
Long-duration unemployment (U-l)
Long-duration unemployment was much more prevalent in the European Community countries than in Sweden and the non-European countries studied. The situation persisted throughout the 1980’s in the European Community countries, while in North America and Sweden, the inci- dence of such unemployment remained rela- tively low. In the five European Community countries, U-1, unemployment of 3 months or longer, was higher than U-2, the job loser rate. This was also the case in Japan, but there, both rates were very low in comparison with Europe.
8 Monthly Labor Review March I993
In contrast, U-l was significantly lower than U-2 in the United States and Canada and slightly lower in Sweden.
The following tabulation shows U-l (13 weeks or over), along with two additional meas- ures of unemployment duration: unemployment rates for durations of 6 months or longer and 1 year or longer.
13 weeks 6 months 12 months
or over or over or over
United States . . . 1.2 0.5 0.3 Canada.. . . . . . . 3.1 1.6 .6 Japan . . . . . . . . . 1.1 .8 .3 Sweden . . , . . . . .5 .3 .l
European Community: France . . . . . . . . 8.1 6.6 4.7 Germany . . . . . . 4.6 3.8 2.8 Italy . . . . . . . . . . 7.3 6.7 5.6
At the two much longer durations, unemploy- ment virtually disappeared in the United States and the other non-European Community coun- tries, but it remained fairly visible in the five Euro- pean Community nations, particularly in France, the Netherlands, and Italy. It is noteworthy that, although the conventional unemployment rate, U-5, was significantly higher in the United States than in Japan, the latter country had proportionally more of its labor force unemployed 6 months or longer.
North American workers tend to move into and out of employment and unemployment, whereas European joblessness tends to reflect a much larger group of long-term unemployed. In North America, most people have relatively short spells of unemployment, frequently interspersed with periods of employment or of inactive labor force
Netherlands .... 6.9 5.7 4.3 status. In fact, if we compare the group of people United Kingdom 5.2 4.2 3.0 who were unemployed in a given month with the
Table 3. Rankings of nine countries from lowest to highest rate in 1989, by alternative unemployment indicators’
Rank u-l u-2 u-3 w u-6 u-6 lb7
1 ....... Sweden 0.5 Japan 0.4 Sweden 1.0 Sweden 1.4 Sweden 1.4 Japan 2.6 Sweden 3.0 2 ....... Japan 1.1 Italy .6 Japan 1.7 Japan 1.6 Japan 2.2 Sweden 3.4 Japan 7.2
3 ....... U.S. 1.2 Sweden .7 U.S. 4.0 U.S. 4.9 U.S. 5.3 Germany 6.0 U.S. 7.9 4 ....... Canada 3.1 Netherlands 1.1 Italy 4.3 Germany 5.3 Germany 5.8 U.S. 7.2 U.K. 9.3
5 ....... Germany 4.6 U.K. 1.5 Germany 5.8 Netherlands 6.9 U.K. 7.4 U.K. 6.7 Canada 9.9 6 ....... U.K. 5.2 Germany 1.7 Canada* 6.6 Canada 7.4 Canada 7.5 Canada 9.5 France 11.1
7 ....... Netherlands 6.9 U.S. 2.4 U.K.Z 6.6 Italy 2 6.0 Italy 7.6 Italy 10.0 Netherlands 12.6
6 ....... Italy 7.3 Canada 3.9 Netherlands 7.6 U.K.2 6.0 Netherlands 6.6 France 10.9 Italy 15.8
9 ....... France 6.1 France 4.1 France 8.1 France 10.4 France 9.7 Netherlands 11.8 - -
Men
Sweden : ::::::: Japan
.6 Japan .5 Sweden 1.0 Sweden 1.3 Sweden 1.4 Sweden 2.1 Sweden 2.4
1.1 Sweden2 .6 Japan 1.3 Japan 1.6 Japan 1.9 Japan 2.2 Japan 3.6
3 ....... U.S. 1.4 Italy z .6 Italy 2.9 Germany 4.6 Germany 4.6 Germany 4.8 U.S. 7.3
4 ....... Canada 3.1 Netherlands 1.2 U.S. 3.9 U.S. 4.8 U.S. 5.2 U.S. 6.8 France 8.1
5 ....... Germany 3.7 Germany 1.6 Germany 4.5 Italy 6.5 Italy 5.4 Italy 7.1 Netherlands 8.5 6 ....... Italy 5.1 U.K. 2.0 Netherlands 5.7 Netherlands 6.4 Netherlands 6.9 France 8.1 Canada 8.6
7 ....... Netherlands 5.5 U.S. 2.9 Canada2 6.1 Canada 7.0 Canada 7.3 Canada2 8.2 U.K. 8.8
6 ....... U.K. 5.9 France 3.6 Franc& 6.1 U.K.2 7.9 France 7.4 Netherlands2 8.2 Italy 10.0
9 ....... France 6.0 Canada 4.4 U.K. 6.7 Fran& 7.9 U.K. 7.7 U.K. 8.3 - -
Women
1 ....... Sweden .5 Japan .2 Sweden 1.1 Sweden 1.4 Sweden 1.5 Japan 3.7 Sweden 5.6
2 ....... U.S. 1.0 Italy .6 Japan 2.0 Japan 1.7 Japan 2.8 Sweden 5.1 U.S. 8.7
3 ....... Japan 1.2 Sweden .7 U.S. 4.2 U.S. 5.1 U.S. 5.4 U.S. 7.9 U.K. 9.9 4 ....... Canada 3.1 U.K. .9 U.K. 6.5 Germany 6.6 U.K. 7.1 Germany 8.2 Canada 11.7
5 ....... U.K. 4.4 Netherlands 1 .I Italy 7.0 Canada2 7.9 Germany 7.5 U.K. 9.4 Japan 12.3
6 ....... Germany 6.0 U.S. 1.8 Canada 7.3 Netherlands* 7.9 Canada 7.9 Canada 11.1 France 15.3 7 ....... Netherlands 9.0 Germany 1.9 Germany 7.9 U.K. 6.1 Netherlands I 1.9 France 14.9 Netherlands 20.7 6 ....... France 10.7 Canada 3.2 France 10.6 Italy 13.2 Italy 12.0 Italy 15.8 Italy 28.1
9 ....... Italy 11.4 France 4.8 Netherlands 11 .I France 14.5 France 12.6 Netherlands 19.1 -
’ February 1990 for Japan. 2 Tied in rank.
NOTE: U.S. = United States; U.K. = United Kingdom. Dash indicates no data available to rank Germany.
&JRCE: Tablel.
Monthly Labor Review March 1993 9
Alternative Unempldpment Indicators
Chart 1. Comparison of U-5 and U-7 unemployment Indicators, by country, 1989
United States
Canada
Japan’
Sweden
France
Raly
Netherlands
United Kingdom
I I I I I I I I 1
0 5 10 15 20
’ February 1990 data. Percent
NOTE: U-5 is conventional unemptoyment rata. U-7 is unemployment rate encompassing persons working pan time tar economic reasons and discouraged workers.
group unemployed in the following month, we find that, during normal times in the United States, only about half are still unemployed. a quarter have found jobs, and the remaining quarter have left the labor force entirely. By contrast, European countries have much lower levels of labor market flows than does North America.’ These differ- ences in labor market dynamics show up in the comparative data on duration of unemployment.
High levels of unemployment benefits payable for long periods of time allow workers to remain
unemployed longer while seeking work. European Community countries have mote generous benefit systems than most other countries. However, the degree to which these systems influence unem- ployment duration is unclear, due to diFficulties in measuring the phenomenon both within and across countries.
Many unemployed people are not eligible for benefits at all or are not eligible up to the maxi- mum duration, because they have an insufftcient employment record. Further, it is difficult to
IO Monthiy Labor Reldew March 1993
choose an appropriate measure of the generosity of benefits, as benefits can vary with time and family situations. A study by the Organisation for Economic Co-operation and Development using summary indicators that take some account of these complicating factors found some positive, but weak, correlation between benefit replace- ment rates over the long term and the incidence of long-duration unemployment.x
Long-duration unemployment feeds on itself, eventually becoming a “long-term unemployment trap.‘V In other words, the average rate at which people leave unemployment to become employed tends to decrease with the duration of the unem- ployment spell. For example, in France, 48 per- cent of persons unemployed between 12 and I8 months, but only 22 percent of persons unem- ployed for more than 3 years, found a job within the 18 months after a survey that took place in November 1986.“’ It is often suggested that such declines reflect a loss of employment-related skills, as well as discrimination against long-term unemployed persons by employers.
Sweden has an extensive system of labor mar- ket programs to assist the unemployed. Employ- ment Office personnel are instructed to put pres- sure on unemployed persons to avail themselves actively of job opportunities or labor market train- ing. As a result, in many cases, they become em- ployed or leave the labor force to take training be- fore their duration of unemployment becomes lengthy.” Thus, unemployment, which is low any- way in Sweden, becomes virtually nil at durations of 6 months or longer.
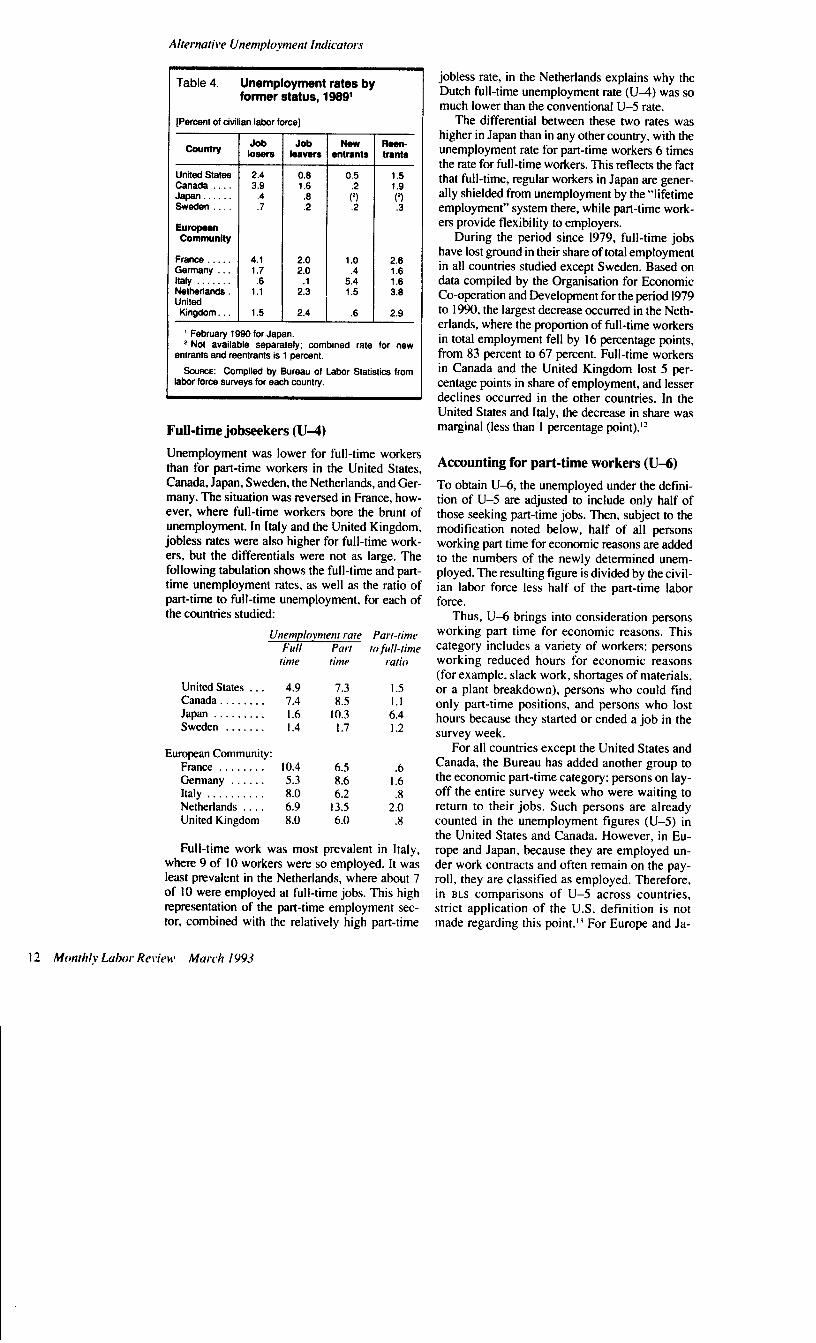
Job losers (U-2)
Unemployed persons can be classified into four categories based on their former employment sta- tus: job losers, job leavers, new entrants into the labor force, and reentrants into the labor force. Table 4 shows each of these four groups as a per- cent of the civilian labor force. U-2 focuses on job losers.
European Community: France . . . . . . . . . . . 19.7 Germany . . . . . . . . . 5.7 Italy. . . . . . . . . . . . . 25.4 Netherlands . . . . . . . 13.5 United Kingdom . . . 10.4
U-2 rates were relatively low in Europe and Ja- pan, compared with North America. This reflects the greater level of job security and protection for regular workers in Europe and Japan. Italy was an extreme case, with virtually no job loser unem- ployment, but a very high proportion of unem- ployment associated with new entrants into the la- bor market. Among the European Community countries studied, only France had a pattern simi- lar to North America’s, with job losers bearing the brunt of unemployment among the four categories listed. But it should be noted that 1989 was a year of high unemployment in France, and job losses are highly cyclical. The discussion below of U-6, the measure that includes those employed only
Because of the low youth-adult unemployment differential in Germany, that country’s U-3 and U-5 unemployment rates were virtually identical, whereas in all the other countries studied, U-3 was significantly lower than the official U-5 rate. (See table 2.) Italy’s U-3 measure was particularly low, because youth unemployment there was about 6 times higher than adult unemployment. Indeed, virtually all of Italian unemployment is among persons under age 25, a phenomenon re- lated to the job loser-new entrant difference for Italy. New entrants into the labor force tend to be young persons, and adults with established jobs tend to be shielded from unemployment in Italy, although they may be subject to underemploy- ment in the form of reduced hours. (See the discus- sion of U-6 below.)
part time for economic reasons, presents some in- formation on the nature of employment in Europe, whereby regular workers are shielded from unem- ployment, while workers on temporary, fixed- contract, or other nonstandard jobs are the job los- ers.
Among the four groups categorized by former employment status, job losers made up the highest proportion of the labor force in the United States and Canada. They were also the most significant among the jobless in Sweden, where all unem- ployment rates were very low. By contrast, job leavers were the largest category in Germany. Rounding out the picture, new entrants in Italy and reentrants in the Netherlands and the United King- dom constituted the highest proportions of the jobless in the labor force in those countries.
Adult unemployment (U-3)
Adult unemployment, as reflected in U-3, was lower than youth unemployment in every country studied except Germany, where a strong appren- ticeship system shields many youth from unem- ployment. In all of the other countries, there was a significant youth-adult differential, as shown in the following tabulation:
Ratio, Youth Adult youth to
rate rate adult
United States ...... 10.9 4.0 2.7 Canada .......... 11.3 6.6 1.7 Japan ............ 6.4 1.7 3.8 Sweden .......... 3.7 1.0 3.7
8.1 5.8 4.3 7.6 6.6
2.4 1.0 5.9 1.8 1.6
Monthly Labor Review March 1993 11
Alternative Unemployment Indicators
Table 4. Unemployment rates by former status, 1999’
[Percent of civilian labor force]
County Job Job New Rsen- IOSWS leavers entrants Wants
United States 2.4 0.6 0.5 1.5 Canada 3.9 1.6 1.9 Japan.. .4 Sweden .7 :2”
ij 3
Europesn Community
France..... 4.1 2.0 1 .o 2.6 Germany . . 1.7 2.0 1.6 Italy . . . . .6 5:: 1.6 Netherlands 1.1 2:: 1.5 3.6 United
Kingdom. 1.5 2.4 .6 2.9
’ February 1996 for Japan. z Not available separately; combined rate for new
entrants and reentrants is 1 percent.
SOURCE: Compiled by Bureau of Labor Statistics from labor force surveys for each country.
Full-time jobseekers (U-4)
Unemployment was lower for full-time workers than for part-time workers in the United States, Canada, Japan, Sweden, the Netherlands, and Ger- many. The situation was reversed in France, how- ever, where full-time workers bore the brunt of unemployment. In Italy and the United Kingdom, jobless rates were also higher for full-time work- ers, but the differentials were not as large. The following tabulation shows the full-time and part- time unemployment rates, as well as the ratio of part-time to full-time unemployment, for each of the countries studied:
Unempkymenr rare Part-time
Full Part to full-time time time ratio
United States ... 4.9 7.3 1.5 Canada ........ 7.4 8.5 1.1 Japan ......... 1.6 10.3 6.4 Sweden ....... 1.4 1.7 1.2
European Community: France . . . . . . . . 10.4 6.5 .6 Germany . . . . . . 5.3 8.6 1.6
Italy . . . . . . . . . . 8.0 6.2 .8 Netherlands . . . . 6.9 13.5 2.0
United Kingdom 8.0 6.0 3
Full-time work was most prevalent in Italy, where 9 of 10 workers were so employed. It was least prevalent in the Netherlands, where about 7 of IO were employed at full-time jobs. This high representation of the part-time employment sec- tor, combined with the relatively high part-time
jobless rate, in the Netherlands explains why the Dutch full-time unemployment rate (Ua) was so much lower than the conventional U-5 rate.
The differential between these two rates was higher in Japan than in any other country, with the unemployment rate for part-time workers 6 times the rate for full-time workers. This reflects the fact that full-time, regular workers in Japan are gener- ally shielded from unemployment by the “lifetime employment” system there, while part-time work- ers provide flexibility to employers.
During the period since 1979, full-time jobs have lost ground in their share of total employment in all countries studied except Sweden. Based on data compiled by the Organisation for Economic Co-operation and Development for the period 1979 to 1990, the largest decrease occurred in the Neth- erlands, where the proportion of full-time workers in total employment fell by 16 percentage points, from 83 percent to 67 percent. Full-time workers in Canada and the United Kingdom lost 5 per- centage points in share of employment, and lesser declines occurred in the other countries. In the United States and Italy, the decrease in share was marginal (less than I percentage point).”
Accounting for part-time workers (U4)
To obtain U-6, the unemployed under the defini- tion of U-5 ate adjusted to include only half of those seeking part-time jobs. Then, subject to the modification noted below, half of all persons working part time for economic reasons are added to the numbers of the newly determined unem- ployed. The resulting figure is divided by the civil- ian labor force less half of the part-time labor force.
Thus, U-6 brings into consideration persons working part time for economic reasons. This category includes a variety of workers: persons working reduced hours for economic reasons (for example, slack work, shortages of materials, or a plant breakdown), persons who could find only part-time positions, and persons who lost hours because they started or ended a job in the survey week.
For all countries except the United States and Canada, the Bureau has added another group to the economic part-time category: persons on lay- off the entire survey week who were waiting to return to their jobs. Such persons are already counted in the unemployment figures (U-5) in the United States and Canada. However, in Eu- rope and Japan, because they are employed un- der work contracts and often remain on the pay- roll, they are classified as employed. Therefore, in BLS comparisons of U-5 across countries, strict application of the U.S. definition is not made regarding this point.‘j For Europe and Ja-
12 Monthly Labor Re\dcnv Much 1993

pan, persons on layoff the entire week have been added to U-6, rather than U-5. Because they worked no hours at all during the week, they are given full weight instead of half weight in the calculation of U-6. Except for Italy, the numbers of such persons were very small.
Table 5 shows a breakdown of the category of those working part time for economic reasons into subcategories and indicates the total of all persons in these subcategories, for comparison with the conventional unemployment figure for each coun- try. Working part time for economic reasons was proportionally highest in Sweden, accounting for about 70 percent of the sum of the unemployed and those working part time for economic reasons. In the United States and Japan, the proportion was approximately 43 percent. The Netherlands had a similar proportion. However, the other European Community countries had lower proportions than did those countries outside the Community; the figures varied from about 13 percent in Germany and France to 30 percent in Italy.
Because of these differences, the U.S. UA rate increased more in relation to U-5 than the simi- larly defined rates for the European Community countries. In the Community, only the Nether-
lands and Italy approached the magnitude of in- crease recorded by the United States in this regard. France and the United Kingdom had much smaller increases from U-5 to U-6, and Ger- many’s rate hardly increased at all. (See table 2.) On the other hand, Sweden’s U-6 rate was greatly increased over U-5, as labor slack was channeled much more into underemployment than into unemployment.
In the European Community countries, par- ticularly France, the employment situation was improving in the spring of 1989. Thus, employers were increasing the hours of their workers, and fewer were working part time for economic rea- sons than did the year before. This partly explains the smaller increases in U-6 over U-5 for these countries. If a different year had been chosen for the analysis, U-6 might have shown a somewhat greater increase over U-5. Similarly, Japan’s Feb- ruary 1990 U-6 figure of 2.8 percent was lower than in some of the years in the 1980’s.
In Western Europe and Japan, employers have traditionally tried to maintain their work forces by making use of “short-time schedules,” whereby hours at work are reduced, to spread available jobs among a larger number of persons. Legal re-
Table 5. Part-time workers for economic reasons, nine countries, 1989’
[Numbers in thousands]
Europssn Communtty QmwY United States Canada Japan Sweden .
France Germany Italy Nathetiandr United Kingdom
Total working part time for economic reasons . 4,693 506 970 153 381 247 739 417 503
Reasons for working part time: Reduced hours*. 2,360 86 240 17 21 15 110 16 30 Zero hours. . 0 0 40 11 II 5 100 11 18 Could find only
part-time work3 2,233 420 690 125 321 215 430 366 407 Job starts and stops’. , , , , 300 0 0 0 26 12 11 4 48
Total U-5 unemployed . . 6,528 1.018 1,360 66 2,316 1,658 1,752 579 2,126
Total working part time for economic reasons and unemployed 11,421 1,524 2,330 219 2,697 1,905 2,491 996 2,629 Percent working part time
for economic reasons . 42.0 33.2 41.6 69.9 14.1 13.0 29.7 41.9 19.1 Percent unemployed . . 57.2 66.8 50.4 30.1 85.9 07.0 70.3 56.1 80.9
Civilian labor force . 123,869 13,503 60,950 4,604 23,810 20,747 22,561 6,564 28.608
Percent of labor force: Working part time for
economic reasons 4.0 3.7 1.6 3.3 0.9 3.3 6.4 1.8 Percent unemployed . 5.3 7.5 2.2 1.4 i:; 5.8 7.0 0.0 7.4
I February 1990 for Japan. that persons working part time involuntarily dti not seak more work. z Except for Canada, persons working fewer than 35 hours a week for 1 Included in “reduced hours” for Canada and Sweden. For Japan, some
economic reasons. For Canada, persons working fewer than 30 hours a are included in “reduced hours,” and an unknown number (probably small) week. are excluded altogether from the figures on part-time workers for economic
3 France has no direct measure for this category. The figure shown is a reasons. proxy representing the number of part-time workers who worked their usual SOURCE: Compiled by Bureau of Labor Statistics from labor force hours and sought more work. This understates the true number to the extent surveys for each country.
Monthly Labor Review March 1993 13
Alternative Unemployment Indkators
straints on layoffs, as well as cultural mores, in Europe and Japan have made worksharing a more attractive option than in the United States. For many years, worksharing in European countries has also been encouraged by statutory unemploy- ment insurance or assistance schemes that contain provisions covering payments for partial unem- ployment. Japan introduced such payments in 1975. By contrast, in the United States and Canada, workers whose hours are cut receive no compensation, except for some workers in a few U.S. States, such as California.”
Nonetheless, U.S. employers do resort to re- ducing employee hours to a significant extent: in 1989, when unemployment averaged 6.5 million, there were an additional 2.4 million workers on reduced hours for economic reasons. They repre- sented almost half of all persons working part time for economic reasons, with the remainder consti- tuting chiefly persons who could find only part- time jobs. (See table 5.)
In Canada, Japan, Sweden, and Western Eu- rope, the bulk of those working part time for eco- nomic reasons was persons who could find only part-time work; those on reduced hours (or zero hours) for economic reasons were a much smaller category, accounting for from 6 to 8 percent of all persons working part time for economic reasons in France, Germany, and the Netherlands to about 10 to 13 percent in Sweden and the United Kingdom, 17 percent in Canada, 30 percent in Japan, and 40 percent in Italy.
It may be in the employer’s interest to resort to layoffs rather than a reduction in hours, because fringe benefits cost more under a worksharing sys- tem. There are few, if any, such costs associated with workers who are let go, especially if they are on temporary work contracts or other nonstand- ard forms of employment, which proliferated in Europe during the 1980’s. The recent dramatic growth in the use of “contingent” workers (part- time, temporary, and subcontracted personnel) is a widespread phenomenon that heralds a changing pattern of employment in Europe and helps to ex- plain the disparity in U6 rates between Europe and North America.ls
A recent study provides a guide to the growth of nonstandard employment in Western Europe.‘(’ The report indicates that employment relation- ships have changed substantially and diversified considerably in Europe since the late 1970’s. Work forces have become more flexible, with more workers employed on fixed-term contracts, on temporary work contracts (through temporary agencies), and in part-time work and other non- standard forms of work. Although also growing in the United States in the last decade, such flexibil- ity of the work force was already well established in the Nation prior to the 1980’s.
In some countries-notably, France-there has been a large increase in the numbers of workers on fixed-term contracts and workers employed by temporary employment agencies. Employers there are not restrained by legal requirements from let- ting such workers go. While “regular” part-time workers who work a substantial number of hours weekly appear to have secure jobs, part-time em- ployment of a few hours per week offers little or no job security. Therefore, employers have turned more toward the preceding forms of labor flexibil- ity, while probably resorting less to reducing the hours of permanent workers, during economic downturns.
Another factor in the move toward nonstandard forms of employment in Western Europe was the unusually high unemployment that occurred there during the late 1970’s and early 1980’s. Many workers became more disposed to accept atypical employment as an alternative to unemployment. At the same time, national governments, in at- tempts to decrease unemployment levels and stimulate job growth, tended to remove or modify employment legislation regulating the use of non- standard forms of employment. Also, the weak- ened position of trade unions made them less able to resist the spread of these forms of work.” Fi- nally, the widespread decline of employment in manufacturing and the expansion of the service sector have played their part in the growth of atypi- cal employment, as temporary workers and work- ers willing to do other nonstandard forms of em- ployment are more common in the service sector.
Some national data are available separately for two of the major classes of nonstandard work: temporary work contracts under which the worker is employed by an agency and fixed-term contracts between employer and employee for a definite period of time. Temporary work contracts became well established in France, the Netherlands, and the United Kingdom during the 1980’s. In France, the annual number of such contracts doubled, from 2 million to 4 million, between 1979 and 1987.18 The 1987 figure was equivalent to almost 200,000 full-time jobs; by 1989, the full-time equivalent had risen to 280,000, about 1.5 percent of all full- time jobs in France.‘Y Temporary contracts also expanded significantly in Germany, especially at the end of the 1980’s. In the Netherlands, the number of workers on temporary work contracts rose steadily, from 25,000 in 1982 to more than 90,000 in 1988.“’ By contrast, temporary work contracts were practically nonexistent in Italy and Sweden, where profit-making employment place- ment agencies are banned by legislation.*’
Fixed-term contracts, concluded directly be- tween the employer and the employee, rose very sharply in France, almost doubling between 1985 and 1989, and accounting for 3.4 percent of all
14 Monthly Labor Review March 1993
employees in the latter year. Lesser increases oc- curred in Germany, Italy, and the United King- dom since 1985, but each of these countries had more than 5 percent of its employees under fixed- term contracts by 1989.** In Germany, the 1985 Employment Promotion Act made it easier for companies to take on new workers through fixed- term contracts. A study of the Act suggests that fixed-term contracts accounted for almost 50 per- cent of new hires in 1986.*’
There is evidence that in France and Ger- many, persons on fixed-term contracts were in- creasingly becoming unemployed. In France, fixed-term and temporary work contracts to- gether accounted for 47 percent of all new cases of unemployment in 1987, compared with 31 percent in 1979, the increase being entirely at- tributable to the rise in the number of fixed-term contracts.24 Similarly, a study shows that in Ger- many in 1987, 18 percent of persons whose fixed-term contracts ended became unem- ployed, with the proportion rising steadily dur- ing the 1980’s. 25 In contrast, some fixed-term contracts are renewed for another fixed term, while others are converted to a permanent con- tract at the end of the employment term.
Thus, in at least some of the European Com- munity countries, higher unemployment in the 1980’s was associated with employers resorting less to placing workers on reduced hours and more to letting atypical workers go. As temporary and fixed-contract workers flowed into unemploy- ment or moved out of the labor force, regular workers under contract were shielded both from losing their jobs and from losing hours of work.
Including discouraged workers (U-7)
U-7 is the most comprehensive rate in the BLS se-
ries, bringing into consideration not only those working part time for economic reasons, but also discouraged workers. Discouraged workers are defined as persons without work who want a job, but who are not looking for work because they be- lieve that their search will be unsuccessful. They are discouraged from seeking a job either because they believe that no jobs are available or because they believe that they do not have the requisite qualifications to obtain a job. They can be consid- ered part of the “hidden” labor supply, but they are not included in the labor force, as conventionally measured.26
Determining the number of discouraged work- ers involves subjective phenomena. Results are quite sensitive to the questions posed. Intercoun- try comparisons should be viewed with caution because the methods and the questions asked vary from country to country.
In the U.S. survey, persons who are neither
employed nor counted as unemployed are asked whether they want a regular job now. Those who answer “yes” or “maybe, it depends” are asked why they are not looking for work. Those who re- spond that they believe no work is available or that they could not find any work are classified as dis- couraged due to job market factors. Those who re- spond that they lacked the necessary schooling, training, or skills, that employers thought they were too old or too young, or that they had a per- sonal handicap (such as a language problem) am classified as discouraged due to personal factors. The sum of both groups-the one citing job mar- ket factors and the other citing personal factors- represents the total of discouraged workers. There is no actual test of whether the discouraged worker is currently available for work, but the fact that the person responds that he or she wants a job now would indicate the person’s availabil- ity for work. As discussed in the appendix, other countries have different questions and methods of determining the number of discouraged work- ers, and these differences have an unknown ef- fect on the comparisons.
The inclusion of discouraged workers brought the largest increases, by far, in the U-7 rates for Italy and Japan. Some comments are necessary, however, to promote understanding of the data for these two countries and the reasons for the large increases shown. Although the appendix discusses comparability issues in some detail, it is important to note here that the discouraged worker concepts for Japan and.Italy ate somewhat more broadly defined than those for the other countries.
For both Japan and Italy, the Bureau has added persons to the discouraged workers count who may not necessarily be discouraged, according to the preceding definition; nevertheless, they have been included in U-7 because they stand some- where between unemployment and discourage- ment. In this way, U-7 for Japan and Italy pro- vides a more comprehensive coverage of labor slack than does U-5, from which these individuals have been left out.
For Japan, 2 million persons responded in the February 1990 special survey that they were avail- able for work, but were not seeking it because there was “no prospect of finding a job.” These individuals would have made up 3.2 percent of the labor force, had they been in it. They are clearly discouraged in the sense of the foregoing defini- tion. Another 1.2 million were not seeking work for the same reason, but they either could not take up, or were undecided about taking up, a job now. An unknown portion of this group would also come within the scope of the U.S. definition of a discouraged worker, because the U.S. method in- cludes persons who respond “maybe” as to whether they want a job now.
Monthly Labor Review March I993 15
Alternative Unemployment Indicators
There is also a third group in Japan: those re- ported as unemployed in the Japanese survey, but who did not seek work in the past month. These persons, amounting to 360,000 in Febru- ary 1990, were excluded from U-5. They were not asked any questions as to why they were not seeking work. because they were already classi- fied as unemployed in the survey. (Only persons not in the labor force were asked the questions that led to the response “no prospect of finding a job.“) Thus, some of them may have been truly discouraged, but others may have simply been awaiting the results of previous job applications. The Bureau’s compromise solution for calculat- ing U-7 for Japan was to take the midpoint be- tween the definitely discouraged (2 million) and the broader count including the two additional groups (3.6 million). In the analysis that follows, the midpoint figure is presented, along with the figure derived from the narrow definition of discouraged workers, which encompasses only the 2 million persons clearly identified as discouraged.
For Italy, the total number of persons re- ported as not seeking work because they be- lieved that no jobs were available was 621,000 in 1989. To this number, the Bureau has added 833,000 persons who said they were seeking work, but who did not take any active steps in the past 30 days. These individuals were ex- cluded from U-5 under the U.S. definition, which requires active seeking of work in the past 4 weeks. Some may well have been discouraged, but many were also simply awaiting the re- sponse to previous job applications or were reg- istered at an Employment Office but had not checked on their prospects within the past month. The Italian survey classifies all of these persons as unemployed. Again, under U.S. defi- nitions, they were somewhere between unem- ployed and discouraged, and the Bureau has chosen to add them to the U-7 figure. Because of this distinction, similar to that for Japan, the Italian data that follow are also presented in terms of the narrow definition of discouraged workers, so that the impact of the distinction may be assessed.
With the preceding considerations in mind, the proportion of discouraged workers in the labor force varied widely across counties. (Recall that no data were available for Germany.) The follow- ing tabulation shows the proportion of discour- aged workers as a percent of the labor force plus the number of discouraged workers and the pro- portion of unemployed persons as a percent of the labor force (the proportion of discouraged work- ers according to the narrow definition of the term is given for Japan and Italy in parentheses after the figure derived from the broader definition):
Discouraged Unemployed
United States. . . . . 0.7 5.3 Canada . . . . . . . . .5 7.5 Japan.. . . . . . . . . 4.4 (3.2) 2.2 Sweden . . . . . . . . . .4 1.4
European Community: France . . . . . . . . . . .2 9.7 Italy . . . . . . . . . . . 6.1 (2.7) 7.8 Netherlands. . . . . . .7 8.8 United Kingdom . . .5 7.4
Whether a narrow or broad definition is used, Japan and Italy were the countries with the largest contingents of discouraged workers. In Italy, dis- couraged workers accounted for about 6 percent of the work force plus discouraged workers, but the figure would have been only 2.7 percent on the narrow definition. In Japan, 4.4 percent of the combined work force plus discouraged workers were discouraged, or 3.2 percent narrowly de- fined. No other country had a proportion of dis- couraged workers above 1 percent.
France, with only 0.2 percent of its work force in the discouraged category, had the smallest pro- portion. However, France just began measuring discouraged workers in 1990, and the figure for that year has been used here to estimate the 1989 proportions. Because of the newness of France in this field, it is better not to make much of its low figure, especially in view of the country’s high jobless rate, as conventionally defined.
The United States and the Netherlands had 0.7 percent of their work forces in the discouraged group. Canada, Sweden, and the United Kingdom were a bit lower still. Another way to view the fig- ures is to look at them in terms of the percent distri- bution of the sum of workers who are discouraged and workers who are unemployed, as shown in the following tabulation (the proportion of discour- aged workers according to the narrow definition of the term is given for Japan and Italy in parentheses after the figure derived from the broader defini- tion):
Discouraged Unemployed
United States. . . . . 12 88 Canada . . . . . . . . . 6 94 Japan........... 67 W) 33 Gw Sweden.. . . . . . . . 21 79
European Community: France. . . . . . . . . . 2 98 Italy . . . . . . . . . . . 45 (26) 55 (74) Netherlands. . . . . . 8 92 United Kingdom. . 7 93
In this comparison, Japan and Italy also had higher proportions of discouraged workers than the rest of the countries had. However, Sweden
I6 Monthly Labor Review March I993
emerged as a country with high discouragement, compared with its very low level of unemploy- ment. The United States still maintained a much lower proportion of discouraged workers than Sweden, Japan, or Italy.
In all of the countries studied, U-7 rates were significantly higher for women than for men. (See table 1.) The increase from U-5 to U-7 was also larger for women. This result is consistent with much research which shows that unemployed women are more likely to leave the labor force than arc unemployed men.27
At 12.3 percent, Japan’s U-7 rate for women was particularly high, given that country’s U-5 measure of only 2.8 percent for women. The large contingent of discouraged Japanese women re- flects the high numbers of women who are tempo- rary or casual workers and who withdraw from the labor force, rather than becoming unemployed when they lose their jobs. Because of these non- regular women workers, Japanese employers have flexibility in their work force during economic downturns, enabling regular workers, predomi- nantly men, in large Japanese enterprises to be vir- tually assured of employment until they retire, un- der Japan’s “lifetime employment” system.
Adding labor market programs in Sweden
Sweden is generally regarded as the pioneer of so- called active labor market policies. These policies are highly developed and provide a comprehen- sive system of institutions for retraining and’relief work for the unemployed. They also provide for sheltered workshops and other aids for the handi- capped. Most other countries also have job train- ing or job creation programs, but relative expendi- tures on such programs and the numbers of people involved are far lower than in Sweden.28
Sweden is unique in that it has deliberately em- ployed its adult training programs as an economic instrument for countercyclical purposes, expand- ing them rapidly whenever demand slackens. Thus, the training courses in Sweden are used as a form of public works for the unemployed, as well as a means of upgrading the skills of the labor force. They have been an important factor in hold- ing Swedish unemployment rates down.29
A special unemployment rate can be con- structed to take into account Sweden’s labor mar- ket measures, which absorb a substantial number of potentially unemployed persons. In 1989, when the unemployed in Sweden totaled 66,000, there were, on average, more than 145,000 persons in the labor market programs. Without these pro- grams, most of these individuals would probably have been either unemployed or discouraged workers who had withdrawn from the labor force. Sweden’s U-5 rate of 1.4 percent in 1989 would
have tripled to 4.5 percent if all of these persons had been unemployed. Adding these people to the U-7 rate would have increased it from 3.8 percent to 7.3 percent in 1989. Still, even a figure of 7.3 percent in 1989 would have ranked Sweden virtu- ally tied with Japan for the lowest among the countries studied, but the rate would have been much closer to the U.S. U-7 rate of 7.9 percent.
Other aspects of unemployment
Unemployment figures are used by many persons for different purposes. The U-5 figure is used most frequently to assess current conditions in the labor market; that is, it serves as a cyclical indica- tor of the relationship between the supply of and the demand for labor. As such, it involves no value judgments regarding a person’s relative need for work.
Judgments as to what constitutes hardship vary greatly, from the very narrow to the quite broad. As a group, U-l through U-7 provides insights into some aspects of economic hardship (unem- ployment of long duration, for example), but does not contain a complete indicator of the phenom- enon. Indeed, the definition of hardship itself var- ies greatly among different analysts.-m Some view it in terms of the adequacy of the three basic ele- ments-food, clothing, and shelter-while others consider it in terms of relative standing in the dis- tribution of income. Hardship can take the form of working full time, but at a substandard wage. Any measure of employment and earnings inadequacy is subject to judgments as to what an adequate in- come level is.3’ Labor force surveys are generally not designed to measure economic hardship spe- cifically. Special studies of income adequacy and poverty levels are required to measure the phe- nomenon, and such investigations am beyond the scope of this article.
Broader measures of underutilization of avail- able labor resources could also encompass a vari- ety of situations not covered by U-6 and U-7. Public policies can cushion the U-5 unemploy- ment rate by diverting labor slack into channels other than overt unemployment, part-time work, or discouragement with the labor market. The case of Sweden is a prime example. The Swedish pro- grams encourage people to withdraw from the la- bor force and enter training programs, or they pro- vide jobs for people who otherwise would have been unemployed. In addition, countries may have policies to promote early retirement, to retain young people in education and training, or to en- courage ill unemployed workers to apply for dis- ability benefits.
Nearly all European countries instituted early retirement schemes during the 1970’s, usually as a means of combating rapidly rising unemployment
Monthly Labor Review March 1993 17
Alternative Unemployment Indicators
by making jobs available to younger persons.“? Prolonging regular training periods has been used in Germany, while absorbing a portion of the un- employed through disability-related schemes is important in the Netherlands.“” Government poli- cies toward foreign labor migrations also have an impact on unemployment rates. Except for the Swedish labor market programs, it is difficult to quantify the effects of these many different gov- ernment actions on the labor market.
Underutilization can also appear as “dis- guised” underemployment. A member of the la- bor force may be at work, but may be used so ineffectually, that he or she contributes little to the value of national output. Unlike involuntary part-time workers, these persons do not suffer from reduced hours. Rather, they are a form of “labor hoarding” by an employer who judges it more productive to let them come to “work,” in- stead of dismissing them. In Japan, disguised un- deremployment occurs for cultural reasons: em- ployers feel paternalistic toward their regular workers and keep them on the full-time payroll, even if there is not enough work to do. Such dis- guised underemployment is recognized by the International Labour Office as falling beyond conventional statistical measurement..w
Conclusion
The series U-l through U-7 of alternative unem- ployment indicators takes the focus away from a single measure of unemployment to a more bal-
Footnotes
anced view of international labor market compari- sons. For 1989, these indicators revealed signiti- cant differences among countries that would not be evident if one examined just U-5, the conven- tional unemployment rate. Among the varying definitions of unemployment, joblessness of long duration was found to be much more prevalent in Europe than in North America, but North America was seen to have more job losers, reflecting the lower level of job security in the United States and Canada, compared with Europe and Japan. When the definition was broadened, Sweden and Japan, the countries with the lowest U-5 rates, incurred the largest proportionate increases, with the Japa- nese U-7 rate approaching the comparably de- fined U.S. rate. In these two countries, labor slack moved much more into involuntary part time em- ployment and discouragement with the labor mar- ket than into open unemployment. If Sweden’s ac- tive labor market programs had not been in effect, that country’s U-7 rate might also have ah- proached the U.S. level.
One limitation to this study is that the data pre- sented are for only I year, 1989 (1990 for Japan). Since the indicators have large cyclical compo- nents, the international relationships may change, depending on the phase of the business cycle in each country. The Bureau intends to create a data base of the indicators U-l through U-7 back to 1983 and also to update the figures to cover more current years, so that the changing international relationships may be studied over a wide span of time. E
ACKNOWLEDGMENTS: The author thanks Neil Bain, Geoffrey Thomas, and Michel Skaliotis, of the Statistical Office of the European Communities, for providing expert advice and many unpublished tabulations from the Communities’ labor force surveys. Thanks also go to the following persons in na- tional statistical offices, for providing special tabulations and expert interpretation of their data:-Jdhn E. Bregger, Paul Flaim, and John F. Stinson. Jr., of the U.S. Bureau of Labor Statistics; Doreen Duchesne and Ernest Akyeampong, of Sta- tistics Canada: Bernard Grais, of the French National Insti- tute of Statistics and Economic Studies; Hannelore Poschl, of the German Federal Statistical Office; Sten Johansson, Direc- tor General, and Anita Olofsson, of Statistics Sweden: and Grazia Arangio-Ruiz, of the Italian Central Statistical Office.
’ For example, see Joyanna Moy, “An analysis of unem- ployment and other labor market indicators in IO countries,” Month/J Lcr/mr RQI+W, April 1988. pp. 39-50.
‘The framework embodying U-l through U-7 was intro-
duced in Julius Shiskin, “Employment and unemployment: the doughnut or the hole?” Month/y L&or Re~&w, February 1976. pp. 3-10. Since that time, the seven indicators for the United States have been published each month in Table A-7 of the news release. .&mplr>wne~r Siruarion.
1 See Constance Sorrentino, “The Uses of the European
Community Labor Force Surveys for International Unem-
ployment Comparisons,” in Statistical Office of the European Communities, The Community Labom Force Survey in the 1990s. proceedings of a seminar held in Luxembourg, October 1987(iuxemboGg: Office for Official Publications of the Eurooean Communities. 19881. cm. 171-97. Some refine-
~~,.rr
ments to the adjustments used in that study have been made in the current article, but these have little effect on the basic rela- tionships shown for 1984.
’ Shiskin, “Employment and unemployment,” pp. 4-5.
5 The definition of U-5 was most recently reviewed by the National Commission on Employment and Unemployment Statistics (Levitan Commission). See U.S. Department of La- bor, Finul Reporr oj’the Secrerury oj’Luhor on rhe Recommen- dutions of rhe National Commission on Employment ond Unempkyment Statistits (Washington, Department of Labor, October I98 I ). This report is summarized in Robert L. Stein, “National Commission recommends changes in labor force statistics,” Man/h/y L&or Review’, April 1980, pp. I l-2 I.
’ Inrernutionul Compurisons of Unemploymenr. Bulletin 1979 (Bureau ot Labor Statistics, 1978). Chapter 5, pp. 48-68.
’ Janet L. Norwood, “Labor market contrasts: United States and Europe,” Month/y Lobor Re\*iew, August 1983, pp. 3-7.
” Organisation for Economic Co-operation and Develop- ment, Employment Our/oak, July I99 I. pp. 204-8.
’ Organisation for Economic Co-operation and Develop- ment, Employent Outlook, July 1983, p. 63.
18 Monthly Labor Review March 1993
1’1 Organisation for Economic Co-operation and Develop- ment, Employment Outlook, July 1991, p. 206.
I’ Ibid.. p. 222.
I2 Ibid.. p. 46.
I1 For further information on the statistical treatment of laid-off workers, see Joyanna Moy and Constance Sor- rentino, “Unemployment, labor force trends, and layoff prac- tices in IO countries,” Monfh/y Labor Review. December 1981. pp. 3-13, especially pp. 8-l I.
I’ Moy and Sorrentino, “Practices in IO countries,” p. 9.
I( For a study of this phenomenon in the United States, see Richard S. Belous, The Contingent Economy: The Growth of the Temporury. Part-time and Subcontracted Workfarce (Washington, National Planning Association, 1989.)
I6 Industrial Relations Services, Non-standard forms of employment in Europe, Report No. 3 (London, European In- dustrial Relations Review, 1990). See also Organisation for Economic Co-operation and Development, Employment Our/oak, July I99 I. pp. 44-53.
I7 For a discussion of trends in union membership in major industrial countries, see Clara Chang and Constance Sorrentino, “Union membership statistics in I2 countries,” Monthly Labor Review, December 1991, pp. 46-53.
Ix See Organisation for Economic Co-operation and De- velopment, Employment Outlaok, July 199 I, p. 48.
IV Industrial Relations Services, Non-srandard forms of
employmenr, pp. 44-45.
II Organisation for Economic Co-operation and Develop- ment, Employment Outlook, July I99 I, p. 48.
x Ibid., p. 218.
IL Industrial Relations Services, Non-standard forms qf employment. p. 28.
*j Income Data Services, European Report, No. 301, Nov. 3, 1987, p. III.
?’ Organisation for Economic Co-operation and Develop- ment, Employment Outlook, July 1991, p. 5 I.
?) /bid.
26 There have been periodic debates in the United States about whether discouraged workers should be explicitly in- cluded in the count of the unemployed. For example, see Na- tional Commission on Employment and Unemployment Statistics, Concepts and Data Needs. Counting rhe Labor Farce, Appendix. Volume I (Washington, U.S. Government Printing Office, 1979). pp. 193-244.
?’ Organization for Economic Co-operation and Develop- ment, Employment Outlook, September 1987, p. 144.
zn According to figures collected by the Organisation for Economic Co-operation and Development, Sweden spends I .58 percent of its gross domestic product on active labor market programs; by contrast, Germany spends I .02 percent and the United States 0.25 percent of gross domestic product on such programs. See Organisation for Economic Co-opera- tion and Development, Employment Outlook, July 1991, pp. 237-49.
2v International Comparisons of Unemployment, pp. 33- 34. See also Guy Standing, Unemployment and lahour mar- ketflesihility: Sweden (Geneva, International Labour Office, l988), pp. 97-124.
.x’ See Shiskin, “Employment and unemployment,” p. 4.
>’ For a discussion of an index of employment and earn- ings inadequacy termed the “subemployment” measure, see Sar Levitan and R. Taggart, “Employment and earnings inad- equacy: A measure of welfare.” Monthly Labor- Review, Oc- tober 1973, pp. 19-27.
32 Inrernational Comparisons of Unemployment, p. 60.
‘j See Chris de Neubourg, Unemployment. Lahour Slack and L&our Market Accounting: Theory, Measurement and Policy (Groningen, the Netherlands, Rijksuniversiteit, 1987). p. 89.
u De Neubourg, Unemploymenr, p. 85.
APPENDIX: Sources, methods, and definitions
The usefulness of the measures U-l through U-7 for international comparisons depends upon the compara- bility of data collection methods and concepts across countries. National definitions of unemployment and the labor force vary, and adjustments must sometimes be made to enhance international comparability. Since 1962, the Bureau of Labor Statistics has conducted an ongoing program in which foreign unemployment sta- tistics are adjusted to approximate U.S. concepts.’ Un- til this study was begun, these adjustments related mainly to U-5, the conventional unemployment rate. Detailed information on the methods of adjustment have been published in a BLS bulletin,* subsequent supplements to this bulletin, and articles in the Month/y
Labor Review.
An initial international comparison of alternative unemployment indicators was prepared for the Statisti- cal Office of the European Communities in 1987.2 This study presented comparisons of U-l through U-7 among and within nine European Community coun- tries, the United States, Canada, and Japan for 1984. Sweden and the Netherlands were not coveted, and the methods of adjustment were not as refined as in the cur- rent study. In addition, some work has been published on comparisons of U-6 and U-7 between the United States and Japan.4
Data sources. All of the data used in this article are derived from labor force surveys. Annual average data obtained from monthly surveys are used for the United States, Canada, and Sweden. For Japan, the data are from a special labor force survey conducted in Febtu- ary 1990. This survey was used to construct the altema- tive indicators because it provides much more detailed information on the status of the labor force than the regular monthly surveys do. A February 1989 survey was available for Japan, but the data were not used here because the Emperor’s funeral was held during the week of the survey. This caused unusual fluctuations in the 1989 data on persons working reduced hours, as well as in measures of the part-time and full-time labor force. Accordingly, to present a more typical set of in- dicators for Japan, the February 1990 survey was used instead.
The figures for the European Community countries were obtained from the Community Labour Force Sur- veys conducted in the spring of 1989. The Statistical Office of the European Communities (EUROSTAT) over- sees, compiles, and publishes the Community sur- veys.
The spring European Community surveys are good indicators of annual averages for the year 1989, at least for the conventional U-S rate. For Japan, February is
Monthly Labor Review March 1993 19
Alternative Unemployment Indicators
associated with some seasonality, because March is the end of both the school year and the fiscal year. A great deal of Japan’s job turnover occurs in March and April, but some begins to take place in February, slightly el- evating the conventional unemployment rate for that month, in comparison with the annual average. For Ja- pan, some components of U-l through U-7 may be slightly overstated because February data, rather than annual data, had to be used. In particular, the youth un- employment rates, analyzed in comparison with the adult rates given by U-4, are probably overstated.
Although the European Community surveys are subject to common concepts and definitions, there is no common survey questionnaire, and the wording and ordering of questions vary from country to country. The Community’s linguistic and cultural diversity would pose problems for any standard questionnaire. Therefore, there are some differences in the surveys across countries; however, the differences are mini- mized by close cooperation between the various na- tional statistical offices and EUROSTAT.
Some adjustments were made by the Bureau to the Community labor force survey data for greater compa- rability with U.S. concepts. Most of these adjustments were minor, such as excluding from the labor force ca- reer military personnel living in private households. However, for Italy, the Bureau has made some signifi- cant adjustments to the ELIROSTAT figures on unem- ployment, employees working part time for economic reasons, and discouraged workers, for better compara- bility with U.S. definitions. These adjustments are summarized below.
The following discussion recapitulates the major points relating to U-5, the conventional definition of unemployment, because it is the base rate from which the other six indicators are derived by additions or sub- tractions of various groups. The main issues relating to these six indicators are then presented. A more detailed account of the discrepancies among the definitions used by each country and the adjustments made to account for these differences is available upon request.
The conventional definition (U-5). In this article, U-5 represents unemployment as a percent of the ci- vilian labor force. Therefore, career military person- nel have been omitted from the labor force in the countries that include them, that is, most of the Euro- pean countries and Japan.
The International Labour Office definition of un- employment, as amended in 1982, sets three separate criteria for classification as unemployed. With certain exceptions, unemployed persons must be (I) without work; (2) currently available for work during the refer- ence period; and (3) seeking work, that is, must have taken specific steps in quest of a job during a specified recent period. Exceptions to (3) are allowed for persons waiting to begin a new job and for some persons on temporary layoff, namely, those with a strong attach- ment to their former jobs (as indicated by a specific re- call date or continued receipt of wages or a salary); those with a weak attachment to their job are to be clas- sified as unemployed.
The U.S. and Canadian surveys follow the Intema- tional Labour Office guidelines on unemployment, and both use 4 weeks as the specified period of jobseeking
required for classification as unemployed. Sweden changed to a standard of 4 weeks also, in 1987.
The European Community surveys follow the first International Labour Office criterion; however, differ- ences in the EUROSTAT interpretation of the second and third criteria cause the surveys to diverge somewhat from the International Labour Office definition.
As regards the second criterion, relating to current availability, the European Community surveys require that an unemployed person be able to start work within 2 weeks of the reference week. This is not in strict ac- cord with the International Labour Office guidelines, which require availability specifically during the refer- ence period.
Concerning the third criterion, which requires that the individual seek work during a specified recent pe- riod, EUROSTAT uses the 4-week specification in the Eu- ropean Community surveys. However, EUROSTAT al- lows four exceptions beyond the two permitted under the International Labour Office guidelines. The follow- ing persons are counted as unemployed, without any inquiry into their job search in the previous 4 weeks:
I. Persons registered or claiming benefits at an of- ficial employment exchange;
2. Persons on a register at a private employment of- fice;
3. Persons awaiting the results of a competition for recruitment in the public sector;
4. Persons seeking self-employment.
No adjustment was made to the EUROSTAT surveys to account for these divergences, except for Italy; there- fore, the unemployment figures for the European Community countries are overstated somewhat in com- parison with the corresponding figures for the non- European Community countries. The overstatement is believed to be minor in all cases except Italy, where a substantial number of persons reported as unemployed do not take active steps to find work within the previous month. This is because the Italian system does not re- quire monthly appearance at the employment office. Registrations may remain valid for a period of about 60 days, or even longer in some provinces in which there is a shortage of personnel in the employment offices. Also, in Italy, numerous individuals spend a consider- able amount of time awaiting the results of public sec- tor recruitment competitions.’
EUROSTAT’S reported Italian unemployment rate of I I. I percent in April 1989 has been adjusted downward to 7.8 percent for closer comparability with U.S. con- cepts. The adjustment is based upon detailed data on the time of the last job search from the Italian national sur- vey for April 1989. These data indicate that about one- third of those reported as unemployed did not seek work in the previous 30 days. These “inactive unem- ployed” have been treated as discouraged workers and allocated to U-7.
Sweden diverges from the International Labour Of- fice in its treatment of full-time students seeking part- time jobs during the school term. Such students, even if currently available for work, are classified as not in the labor force. An adjustment has been made in this article to include them among the unemployed. Because data on these students ate not readily available every year, the Bureau has not made this adjustment to the Swedish
20 Monthly L.ahor Review March 1993

figures in its regular unemployment comparisons pro- gram. In any event, the effect is very small: the 1989 Swedish unemployment rate (U-5) was increased from I .3 percent to I .4 percent by adding 5,000 students to the unemployed and to the labor force.
Japan’s regular monthly survey questionnaire dif- fers greatly from both the EUROSTAT survey and other Western models. Current availability in the reference week is required, but no job search period, such as “the past 4 weeks,” is specified. The Bureau has used the results of a special survey conducted in February 1990 to adjust the Japanese figures as closely as possible to the U.S. definition. Adjustments were made to omit persons who did not actively seek work in the previous 4 weeks and to include persons who were not working and who actively sought work in the previous 4 weeks, but who were not classified as unemployed. Although each of these adjustments is quite large, on balance, they tend to cancel each other for both sexes combined. However, male unemployment rates are overstated and female rates understated by the regular survey.h
Persons on temporary layoff who are awaiting re- call to their jobs are classified as unemployed in the United States and Canada. European and Japanese lay- off practices are quite different in nature from those in North America; therefore, strict application of the U.S. definition has not been made on this point. In general, persons on layoff are classified as employed in Europe and Japan, because they are employed under work con- tracts. They regard themselves as having a job, they of- ten remain on the payroll, and they are virtually certain to be recalled to their jobs. In Europe and Japan, em- ployers tend to adopt the practice of reducing workers’ hours, rather than laying off workers outright. How- ever, there are a small number of persons whose layoffs take the form of zero hours worked during the’refer- ence week.’ For Europe and Japan, these workers are included in U-6 as persons working part time for eco- nomic reasons. In the calculation of U-6, they are given full weight, whereas those working reduced hours ate given half weight.
Trearment of unknowns. Nonresponse to a survey question is a source of nonsampling error. Some coun- tries compensate for nonresponses by deriving a suit- able response based on other information collected in the survey, such as information on respondents with similar characteristics. In the U.S. Current Population Survey, all nonresponses are handled in this fashion, and no groups of unknowns are reported in the data used in this analysis. In the other countries examined, however, some data elements contain a reported group of unknowns. In some cases, these were due to nonre- sponses; in other cases, certain groups were not asked the relevant questions. For example, the data on U-I for most of the European Community countries and Sweden include some nonresponses to the question on duration of unemployment; on the other hand, persons seeking self-employment were not asked whether they sought full-time or part-time work. In general, these unknowns (usually a small number) have been distrib- uted by the Bureau according to the proportions de- rived from the respondents. There may be some error associated with this method, but it should have virtu- ally no impact on the comparisons.
As mentioned earlier, the overall EUROSTAT unem- ployment data for Italy include a significant number of “inactive” jobseekers whom the Bureau excludes from U-5 for comparability with U.S. definitions. EUROSTAT
was able to provide the Bureau with unpublished distri- butions of data for Italy that included persons who re- ported that they had sought work in the previous 30 days. However, there were a significant number of un- knowns, amounting to 20 percent of the unemployed (after adjustment), who were unaccounted for by the EUROSTAT figures. Most were persons seeking self-em- ployment, an unusually large group in Italy. They were not questioned about when they engaged in their last job search, even though the International Labor Office guidelines state that such persons should be actively seeking a job, engaging in such actions as looking for a place of business or equipment, arranging financing, and applying for business licenses. These unknowns were allocated among U-l through U-7 according to the EUROSTAT distributions relating to persons who sought work in the past 30 days.
For Japan, data on duration of unemployment and job losers are available only for the reported, rather than adjusted, number of unemployed persons. The Bureau has allocated the adjusted number of unem- ployed to categories of duration and of former status according to the proportions derived from those re- ported as unemployed. To the extent that this group is not representative of the distribution of the adjusted number of unemployed, there will be an error associ- ated with the technique. Because Japanese unemploy- ment is so low, any such error would not significantly affect the rankings of U-l and U-2.
Pro.rie.~. In a few instances, data am not reported for the exact grouping desired, and proxies have been used in their place. For example, France has no direct meas- ure of persons working part time because they could not find full-time work. The proxy used is the number of part-time workers who worked their usual hours and sought more work. This proxy understates the true number to the extent that persons working part time in- voluntarily did not seek more work.
Full-time and part-time employment. Full-time em- ployment is a component in the calculations of IJA, U-6, and U-7. In the United States, full-time employ- ment includes the following categories: (I) persons who worked 35 hours or more during the survey week; (2) persons who worked fewer than 35 hours for other than economic reasons (for example, because they were on vacation or were ill), but who usually worked 35 hours or more; (3) persons who were not at work, but who usually worked 35 hours or more; and (4) persons who worked fewer than 35 hours for economic reasons, re- gardless of their usual status. The rationale for includ- ing the last group among those employed full time is that although they are working part time, presumably, they desire full-time work. Those working part time consist of all persons who worked fewer than 35 hours and who usually work fewer than 35 hours for noneconomic reasons.
In the European Community countries, Canada, and Sweden, data on part-time and full-time employment are reported according to whether the individual usu-
Monthly Labor Review March 1993 21
Alternative Unemployment Indic~ators
ally worked part-time or full-time. Therefore, persons who worked part time for economic reasons and who usually work part time are included among part-time workers. An adjustment is made to include these per- sons in the full-time labor force, for comparability with the U.S. concept.
The European Community surveys do not specify a cutoff in the number of hours worked to be classified as a full-time versus a part-time employee. Rather, full- time or part-time status is recorded according to the respondent’s own designation. To provide data that conform more closely to U.S. concepts, the figures have been adjusted to a 35-hour cutoff, based on pub- lished information on distributions of hours.
Canada diverges from the practices used in other countries with regard to who counts as a full-time worker. In Canada, a full-time employee is a person who usually works 30 or more hours per week, or a person who usually works fewer than 30 hours per week, but considers him- or herself to be employed full time. (An airline pilot would be in the latter category.) A part-time employee would then be anyone else who usually works fewer than 30 hours per week. No ad- justment was made to increase Canada’s cutoff to 35 hours. However, Statistics Canada provided unpub- lished data on the number of full-time workers usually working fewer than 30 hours, and these persons have been reclassified as part-time workers.
Persons working part time for economic reasons. The number of persons in this category enters into the cal- culations of U-4, U-6, and U-7. In the United States, the following reasons are regarded as economic rea- sons: (I) slack work; (2) material shortages or repairs to plant and equipment; (3) started a new job during the week; (4) terminated a job during the week; (5) could only find part-time work. Data for other countries could usually be found in a similar form. As indicated earlier, in all countries except the United States and Canada, persons on full layoff and, therefore, working zero hours for economic reasons are included among persons working part time for economic reasons. In the calculation of U-6, the persons on zero hours are given full rather than half weight, because they did no work at all in the reference week. Such persons are included in U-5 in the United States and Canada as persons on temporary layoff.
Data for the European Community countries, Canada, and Sweden are published in terms of persons working reduced hours, regardless of the total number of hours worked. Therefore, some persons who worked reduced hours, but still worked 35 hours or more (30 hours or more in Canada), are included in the original data as persons working part time for economic rea- sons. The Bureau obtained unpublished tabulations from EUROSTAT, Statistics Canada, and Statistics Swe- den in order to omit such persons from the count of those working part time for economic reasons.
For Germany, the number of persons working re- duced or zero hours (20,000) for economic reasons (as defined in this study) seems low, compared with ad- ministrative data on kurzarbeiter, or workers receiving short-term compensation. In April 1989, the month of the European Community survey, there were 200,000 kurzarheiter. However, this is the cumulative total of
all persons receiving short-term compensation over the course of the month; therefore, it should be higher than a figure for I survey week. Furthermore, the kurzarbeiter include persons working more than 35 hours who were on reduced hours, and they also in- clude persons on reduced hours due to labor disputes and bad weather, which are not regarded as economic reasons in this study.
The Italian Statistical Office informed the Bureau that persons working part time for economic reasons might respond to the relevant survey question in either of two ways listed on the survey questionnaire: reduced economic activity of the firm for technical or economic reasons; or lack of work opportunities, seasonal slack, and the like. The difference between these two replies is not always clear to the respondents. Those responding in the manner of the second response were not included in the EUROSTAT tabulations of persons on slack work. The Bureau has adjusted the EUROSTAT data upward, based on the Italian Statistical Office’s recommenda- tion to include them. Their inclusion raises the propor- tion of the labor force in Italy working part time foreco- nomic reasons from 2.6 percent to 3.3 percent.
Discouraged workers. U-7 brings into consideration the number of discouraged workers. In the United States, these are persons who want a job now, but are not looking because they believe that they would be un- successful if they did look for a job.
Measuring the number of discouraged workers is a difficult task because it involves the measurement of subjective phenomena-specifically, one’s desire for work and one’s perceptions of the chances of finding a job. These are essentially states of mind, rather than cri- teria that can be objectively determined. Measuring dis- couraged workers is very sensitive to the wording of the questions and the degree of probing involved in the in- terview.
The United States, Canada, and Sweden all have concepts signifying discouragement with the labor market. Japan and the European Community countries do not. However, in both the Japanese special survey and the European Community survey, questions are asked of persons who are not in the labor force as to why they are not seeking work, and a figure for discour- aged workers can be estimated from these responses. For the European Community countries, 1989 data on discouraged workers are not available for France and Germany. Data for France were collected in 1990 and are used to estimate a figure for 1989. Germany is ex- cluded altogether from the analysis of U-7.
In the United States and Canada, there is more pre- cision to the questioning concerning discouragement with the labor market than there is in the other countries studied. In the U.S. Current Population Survey, the questioning procedure is careful to determine first whether the person wants a job now; those who respond “yes” or “maybe, it depends” are then asked why they are not looking for work. Respondents are never asked directly whether they believe that they can find work, and their current availability for work is not tested.
With regard to discouraged workers, Canada has the stipulation that they must have looked for work in the past 6 months, and their current availability for work is tested. Therefore, the Canadian method is more restric-
22 Monthly Labor Review March 1993
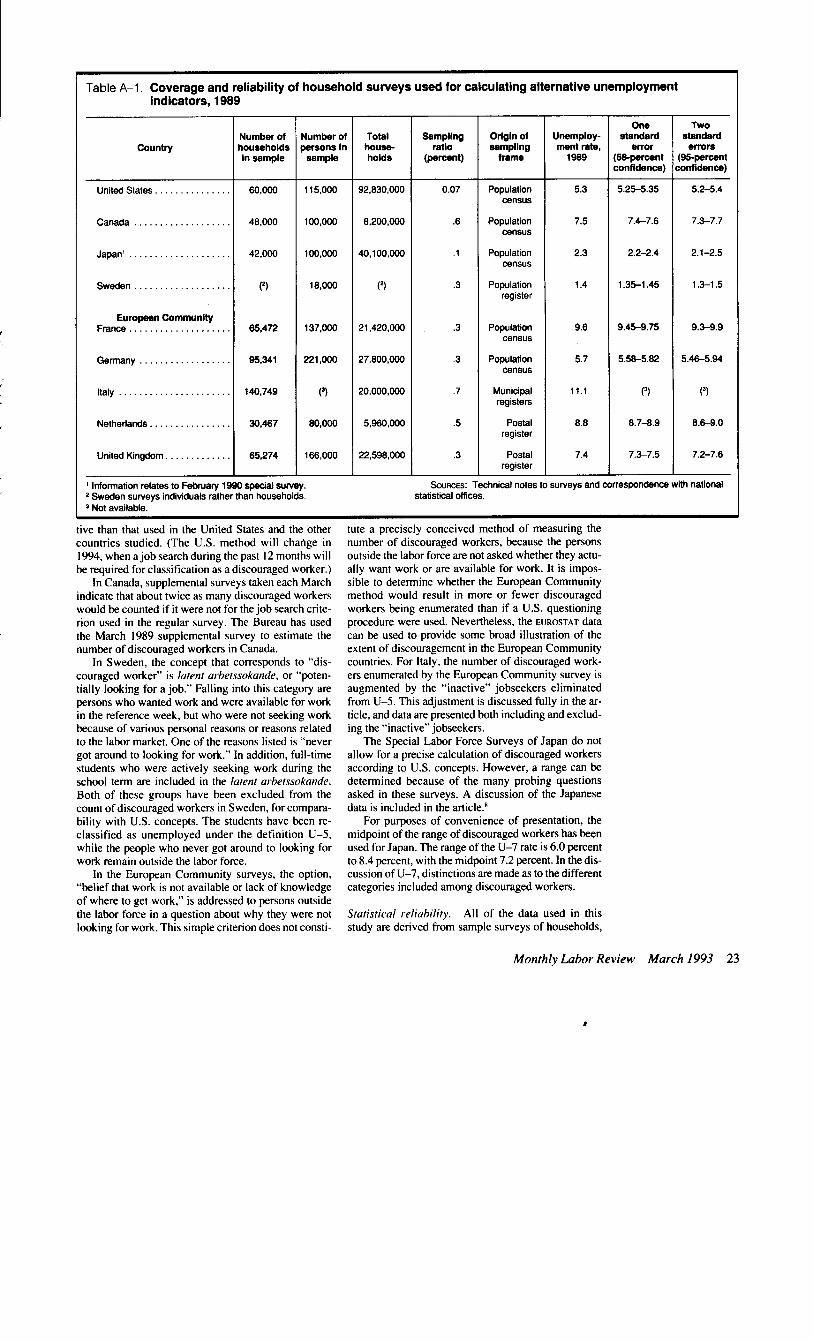
Table A-l, Coverage and reliability of household surveys used for calculating alternative unemployment indicators, 1989
Country
One Two Number of Number of Total Sampling Origin of Unempioy- standard standard households persons in house- ratio sampling ment rate, error errors in sample sample holds (percent) freme 1989 (69qercent (9~psrcent
confidence) confidence)
United States. . . . 60,000 115,ooa 92,830,ooo 0.07 Population 5.3 5.25-5.35 5.2-5.4 census
Canada . . . . . . . . . . . . . . . . . . . 48,000 100,000 8,200,OOO .6 Population 7.5 7.4-7.8 7.3-7.7 census
Japan’ . . . . . . . . . . . . . . . . . . . . 42.000 100,000 40,100,ooo .l Population 2.3 2.2-2.4 2.1-2.5 census
Sweden . . . . . . . (*) 18,000 (7 .3 Population register
1.4 1.36-I .45 1.3-l .5
European Community France . . . . . . . . . . . . . . . . . . . . 65,472 137,000 21,420,OOO .3 Population 9.6 9.45-9.75 9.3-9.9
census
Germany . . . . . . . . . . . . . . . . . . 96,341 221,000 27,800,000 .3 Population 5.7 5.58-5.82 5.46-5.94 census
Italy . . . . . . . . . . . . . . . 146,749 V) 20,000,000 .7 Municipal 11.1 PI (7 registers
Netherlands . . . . . . . . . 30.467 80,000 5,960,OOo .5 Postal register
8.8 8.7-8.9 8.6-9.0
United Kingdom. . . . . . . . . . 65,274 166,000 22,598,OOO .3 Postal 7.4 7.3-7.5 7.2-7.6 register
1 information relates to February 1990 special survey. z Sweden surveys individuals rather than households. 3 Not available.
SOURCES: Technical notes to surveys and correspondence with national statistical offices.
tive than that used in the United States and the other countries studied. (The U.S. method will change in 1994, when a job search during the past I2 months will be required for classification as a discouraged worker.)
In Canada, supplemental surveys taken each March indicate that about twice as many discouraged workers would be counted if it were not for the job search crite- rion used in the regular survey. The Bureau has used the March 1989 supplemental survey to estimate the number of discouraged workers in Canada.
In Sweden, the concept that corresponds to “dis- couraged worker” is latent arbetssokande, or “poten- tially looking for a job.” Falling into this category are persons who wanted work and were available for work in the reference week, but who were not seeking work because of various personal reasons or reasons related to the labor market. One of the reasons listed is “never got around to looking for work.” In addition, full-time students who were actively seeking work during the school term are included in the latent arhetssokande.
Both of these groups have been excluded from the count of discouraged workers in Sweden, for compara- bility with U.S. concepts. The students have been re- classified as unemployed under the definition U-5, while the people who never got around to looking for work remain outside the labor force.
In the European Community surveys, the option, “belief that work is not available or lack of knowledge of where to get work,” is addressed to persons outside the labor force in a question about why they were not looking for work. This simple criterion does not consti-
tute a precisely conceived method ot measunng the number of discouraged workers, because the persons outside the labor force are not asked whether they actu- ally want work or are available for work. It is impos- sible to determine whether the European Community method would result in more or fewer discouraged workers being enumerated than if a U.S. questioning procedure were used. Nevertheless, the EUROSTAT data can be used to provide some broad illustration of the extent of discouragement in the European Community countries. For Italy, the number of discouraged work- ers enumerated by the European Community survey is augmented by the “inactive” jobseekers eliminated from U-5. This adjustment is discussed fully in the ar- ticle, and data are presented both including and exclud- ing the “inactive” jobseekers.
The Special Labor Force Surveys of Japan do not allow for a precise calculation of discouraged workers according to U.S. concepts. However, a range can be determined because of the many probing questions asked in these surveys. A discussion of the Japanese data is included in the article.”
For purposes of convenience of presentation, the midpoint of the range of discouraged workers has been used for Japan. The range of the U-7 rate is 6.0 percent to 8.4 percent, with the midpoint 7.2 percent. In the dis- cussion of U-7, distinctions are made as to the different categories included among discouraged workers.
Statistical reliability. All of the data used in this study are derived from sample surveys of households,
Monthly Labor Review March 1993 23
Alternative Unemployment Indicators
except for Sweden, which surveys individuals. Two types of error are possible in an estimate based on a sample survey: nonsampling error and sampling error. Nonsampling errors arise in surveys from many differ- ent sources and may occur at almost every phase of the survey operation. For example, interviewers may mis- understand instructions, respondents may make errors in answering questions, the answers may be entered in- correctly on the questionnaires, and errors may be in- troduced in the processing and tabulation of the data. All countries attempt to minimize such errors by care- ful design of questionnaires, intensive training and su- pervision of interviewers, and a thorough control of the processing system. Countries may also conduct peri- odic special studies, such as reinterviews of portions of the sample population. In general, the more personal and more subjective an inquiry is, the more likely it is to contain nonsampling errors and the larger those er- rors will be. Thus, data on discouraged workers would be highly subject to nonsampling error.
Sampling error refers to the error arising from tak- ing a sample, rather than surveying the entire popula- tion of interest. In terms of sampling errors, the data used in this article for the United States, Canada, Swe- den, and Japan are highly reliable, with small estimated standard errors. For Canada and Sweden, a few data elements that were obtained from unpublished tabula- tions may be less reliable because of their small size. Nonetheless, even if they had a high sampling error, a small number would not affect the results of the calcu-
Footnotes to the appendix
lations in a significant way. For the five European Community countries, all published data and virtually all of the unpublished data used in this study were within the statistical confidence limits established by EUROSTAT for reliable data.
Table A-l shows the significant aspects of cover- age and reliability of the labor force surveys used in the current study. The European Community countries have much higher sampling ratios (ratios of the number of households surveyed to total households) because they conduct yearly surveys, whereas the U.S. Current Population Survey is conducted every month, with a smaller sample size relative to total households. The range of the published unemployment rate at one stan- dard error (68percent confidence level) and two stan- dard errors (95percent confidence level) is also shown. At two standard errors, there is a 95percent chance that the true value of the estimate falls within the range given. These standard errors relate only to U-5. Differ- ent, and perhaps larger, standard errors could be associ- ated with the other measures. For example, there would be a larger standard error associated with data on dis- couraged workers for the United States because such data are obtained from only one-fourth of the sample.
Because of the possibility of sampling and non-sam- pling errors, very small intercountry differences (that is, a few tenths of a percentage point) in the alternative unemployment rates analyzed in this article should be discounted. However, largerdifferences can be regarded as accurate indicators of international disparities.
’ See Robert J. Myers and John H. Chandler, “lntema- tional Comparisons of Unemployment,” Month/y f&or Re- ,iew, August 1962, pp. 857-64.
z Internurionul Compurisons of Unemployment. Bulletin 1979 (Bureau of Labor Statistics, 1978).
’ Constance Sorrentino, “The Uses of the European Com- munity Labor Force Surveys for International Unemploy- ment Comparisons,” The Community L&our Force Surwy in rhe /99Os, proceedings of a seminar held in Luxembourg, October 1987 (Luxembourg: Office for Official Publications of the European Communities, 1988). pp. 171-97.
’ See the following Monthly Labor Review articles by Constance Sorrentino: “Japan’s low unemployment: an in- depth analysis,” March 1984, pp. 18-27; “Japanese unem- ployment: BLS updates its analysis,” June 1987, pp. 47-53; and “Adjusted Japanese unemployment rate remains below 3
percent in 1987-88.” June 1989, pp. 36-38. Updates of and some revisions to these articles will appear in a forthcoming issue of the Review.
( For a further discussion of this point, see Chapter 5 of Organisation for Economic Co-operation and Development, Employmenr Outlook, September 1987. pp. 125-l 38.
h For further information on the adjustments, see Sorrentino. “Japan’s low unemployment.”
’ Joyanna Moy and Constance Sorrentino discuss the sta- tistical treatment of layoffs in more detail in “Unemployment, labor force trends, and layoff practices in IO countries,” Mm/h/y k&r Review. December I98 I, pp. 3-l 3, especially pp. 8-l I.
’ A more detailed description of the Japanese data on dis- couraged workers is in the appendix to Sorrentino, “Japanese unemployment.”
24 Monthly L.&or Review March 1993