Embed Size (px)
Citation preview

Matti Kyrö
InternatIonal comparIsons of some features of fInnIsh educatIon and traInIng

1
International comparisons
International comparisons of some features of Finnish education and training
The education system X
The objective of the Finnish education system is to provide everyone with equal opportunities
for education and training. The success of a nation is built on a well-educated population. The
education system does not have any dead ends. All study tracks are open from pre-primary edu-
cation through to higher education according to every individual’s own abilities. Consequently,
after completing an education or training programme, every citizen can in principle always move
on to a higher level of education. An essential aspect of safeguarding equality is to provide sup-
port for those with special needs.
Education is financed almost completely through public funding. There are few private educa-
tional institutions and even those are part of the formal education system, receiving state subsi-
dies on the same grounds as municipal institutions.
Pre-primary education is intended for six-year-olds and it may be provided either as part of day
care or at school. Parents are free to choose whether to enrol their children in pre-primary edu-
cation, but providers of pre-primary education, that is, local authorities, are required to offer the
opportunity to all six-year-olds living within the municipality. In practical terms, almost all six-
year-olds receive pre-primary education. Pre-primary education is provided free of charge for the
children’s parents.
Finland has nine-year compulsory education starting at the age of seven. This basic education is
provided by comprehensive schools which increasingly have a single structure, that is, no divi-
sion into primary or lower secondary education. There is no ability grouping and each age group
is taught as a whole. Virtually the entire age group also completes basic education.
Basic education is generally provided in Finland by local authorities (municipalities); only 61
comprehensive schools were private in 2007, while another 30 were maintained by the State.
After finishing their nine years in basic education, pupils still have the opportunity to participate
in additional basic education for another year. In 2007, this opportunity was taken up by 1,300
pupils.

2
International comparisons
Figure 8.1 The Finnish education system
DOCTORAL DEGREES
LICENTIATE DEGREES
MASTER’S DEGREESPOLYTECHNIC MASTER’S DEGREES
Work experience
Work experience
Duration in years
1– 9
11–
31–
34–
5
Specialist vocational
qualifications
Further vocational
qualifications
BACHELOR’S DEGREESUniversities
MATRICULATION EXAMINATIONGeneral upper secondary schools
Pre-primary education, 6 year olds
Additional basic education
POLYTECHNIC BACHELOR’S DEGREESPolytechnics
VOCATIONAL QUALIFICATIONSVocational institutions and apprenticeship training
BASIC EDUCATION (comprehensive schools) 7–16 year olds
In 2000 there were just under 3,200 comprehensive schools in Finland, with a total of 561,000
pupils. Nearly 56,700 children started first grade, while 66,500 pupils were awarded basic educa-
tion certificates in the spring of 2008.

3
International comparisons
When they finish their basic education, young people have two options for continuing their stud-
ies: general upper secondary education or upper secondary vocational education and training
(VET). The aim is for as many young people as possible to move on to upper secondary level.
Every comprehensive school leaver can apply for upper secondary studies through the national
joint application system. This contributes to ensuring that 95 per cent of basic education leavers
continue their studies immediately on completion of basic education. In 2008, 51 and 42 per cent
of comprehensive school leavers moved on to upper secondary school and vocational education
and training, respectively, while 2% continued their studies in voluntary additional basic educa-
tion.
Upper secondary schools provide general education, which is organised in courses instead of
year classes, allowing students themselves to choose their courses. The nominal duration of gen-
eral upper secondary education is three years. In 2008 just under 14 per cent of the age group
finishing upper secondary school spent more than three years completing their general upper
secondary education. The final upper secondary school examination is the national matricula-
tion examination. the total number of students was 114,200. In 2007 32,600 students passed the
matriculation examination.
Similar to upper secondary school studies, upper secondary vocational education and training
lasts three years and provides eligibility to apply to higher education institutions. Even though
the proportion of basic education leavers opting for vocational studies is smaller when compared
with upper secondary school entrants, the total number of students starting vocational education
and training is higher than the total number of upper secondary school entrants. This is due to the
fact that those starting vocational studies come from several age groups, whereas upper second-
ary school studies are generally pursued immediately after comprehensive school.
In 2008 a total of 275,500 students were studying in vocational education and training provided
in educational institutions or as apprenticeship training. Of these students 70 per cent were in
initial (upper secondary) vocational education and 30% in education preparing for further and
specialist qualifications.
Higher education is provided in Finland by universities and polytechnics, also known as universi-
ties of applied sciences. The total number of university students in 2008 was 164,100, with 19,600
being new entrants. The total number of graduates was 38,200, which was considerably higher
than in the previous year. The exceptionally high number of graduates was due to the degree
reform carried out during 2008, which made universities encourage older students to complete
their studies. Female students accounted for 56 per cent of university entrants and for an even
higher proportion (64%) of graduates. In the same year, the number of students enrolled in pro-
fessionally oriented polytechnics was 133,300, with 36,600 of them being new students. A total
of 21,000 students completed a degree in that year. Female students accounted for 56 per cent of
polytechnic entrants and 64 per cent of graduates.
There is a wide variety of options for adult education and training in Finland. Adults are offered
both qualification-oriented education and training and studies relating to leisure interests. Com-
petence-based qualifications are a way of demonstrating vocational skills through competence
tests regardless of how these were acquired – the competence required in competence tests can
be obtained through work, interests and studies alike.
4
International comparisons
In 2008 a total of 18,000 qualifications were completed within the competence-based qualifica-
tions system, comprising 6,700 upper secondary vocational qualifications, 9,400 further qualifica-
tions and 1,800 specialist qualifications. The net number of students – in some cases, students
may have participated in several courses – in liberal adult education, at summer universities, adult
education centres, folk high schools, sports institutes and study centres was 1,022,900 in 2008.
Highly educated population as a resource X
Differences in the level of education between age groups are quite pronounced in Finland.
While 90 per cent of the 25–34 age group have completed a post-compulsory qualification, the
equivalent proportion for those aged 55 to 64 is 66 per cent. The entire Finnish population aged
between 25 and 64 is slightly better educated than the OECD average. The proportion of higher
education graduates is close to the top OECD countries: the only countries where the proportion
of higher education graduates is clearly higher are Canada, the United States and New Zealand.
At the same time, however, almost a fifth of the working-age population have only completed
compulsory education, while the equivalent proportion in countries such as the Czech Republic
and Slovakia is 10 per cent or less. The number of people without any post-compulsory schooling
is, nevertheless, decreasing rapidly. In 2008, about 40 per cent of the 60–64 age group did not
have any post-compulsory qualifications, while the equivalent proportion in the 55–59 age group,
for example, only accounted for about 30 per cent.
One fifth of the entire adult population (those aged 25–64) have completed a university or poly-
technic degree (ISCED 5A and 6). However, the proportion of people with a higher education
degree is still growing, as the proportion among those aged 25–34 is already one third.
Figure 8.2 Educational attainment: adult population (2008).
Distribution of the 25–64 -year-old population, by highest level of education attained.
0
10
20
30
40
50
60
70
80
90
100%
Primary and lower secondary education Upper secondary education Post-secondary non-tertiary education Tertiary education
Portu
gal
Turke
yMe
xico
Spain Italy
Gree
ceCh
ileIre
land
Austr
alia
Belgi
umIce
land
Franc
eOE
CD av
erage
Nethe
rland
sLu
xemb
ourg
Denm
arkNe
w Ze
aland
Korea
Hung
aryNo
rway
Finlan
dAu
stria
Swed
enGe
rman
yCa
nada
Unite
d King
dom
Polan
dUn
ited S
tates
Switz
erlan
dSlo
vak R
epub
licCz
ech R
epub
lic
Source: OECD, Education at a Glance 2010

5
International comparisons
Universities apply the so-called numerus clausus principle, which means that not all applicants
are admitted to the programme of their choice. This, combined with universal national service
for men, explains the slow transition to higher education in international terms: Finns start their
higher education studies at a later age than their peers in many other countries. More than 80 per
cent of young Japanese people have already enrolled at higher education institutions at a time
when not even one fifth of Finns have started their studies.
The median age of entrants to higher education in Finland is 21.4 years, while the figure for Ja-
pan, Belgium and South Korea is less than 19. Then again, the median age in Iceland, Sweden
and Denmark is more than 22 years. Over 40 per cent of students completing upper secondary
school start studying at a higher education institution immediately after their upper secondary
studies. One fifth of Finnish higher education entrants will only start their studies after their 26th
birthday.
Figure 8.3 Age distribution of new entrants (2008) to higher education (ISCED 5A)
15
20
25
30
35
20th percentile 50th percentile 80th percentile
Japa
n
Belgi
um
Korea
Spain
Irelan
d
Unite
d Stat
es
Unite
d King
dom
Italy
Nethe
rland
s
Eston
ia
Polan
d
Hung
ary
Polan
d
Czec
h rep
ublic
New
Zeala
nd
Austr
alia
Norw
ay
Austr
ia
Germ
any
Finlan
d
Switz
erlan
d
Denm
ark
Swed
en
Icelan
d
Source: OECD, Education at a Glance 2010
Education and employmentFinland’s most important resource to guarantee welfare is the high level of competence of the
population. This is why it is considered important to ensure that no-one is left without an educa-
tion. Less than 4 per cent of young Finns aged between 15 and 29 are neither studying nor at
work. The proportion is clearly smaller than in countries such as the UK, France and Germany,
on the one hand, but higher than, say, in the Netherlands, Denmark and Norway, on the other.
The proportion of those outside both employment and education is highest among the 20–24 age
group. This is partially due to the fact that not all applicants are admitted to the higher education
programme of their choice on completion of their upper secondary studies.

6
International comparisons
In Finland, women are in the majority at all levels of education with the exception of basic edu-
cation, that is, primary and lower secondary levels. Accordingly, the proportion of women aged
15 to 29 not in education and unemployed is slightly lower than the corresponding proportion
among men, even though the employment rate is lower among women than among men.
Figure 8.4 Percentage of the cohort population not in education and unemployed (2008), age group 15–29, all levels of education.
0
2
4
6
8
10
12
%
Males Females
Nethe
rland
s
Norw
ay
Denm
ark
Eston
ia
Switz
erlan
d
Czec
h Rep
ublic
Mexic
o
Austr
alia
Finlan
d
Austr
ia
Swed
en
Polan
d
Cana
da
Belgi
um
Unite
d Stat
es
Hung
ary
Unite
d King
dom
Italy
Germ
any
Gree
ce
Franc
e
Spain
Turke
ySource: OECD, Education at a Glance 2010
In international terms, young Finns spend a long time in education. In 2008, 43 per cent of people
aged 20 to 29 were in education, whereas the OECD average for this age group was 25 per cent.
Denmark and Iceland were the only other countries with 35 per cent or more of young people
in that age group enrolled in education.
Educational expenditure at a reasonable levelIn Finland provision within the formal education system is mostly financed through public fund-
ing. All education providers, both municipal and private bodies, receive state subsidies on the
same grounds. The majority of providers of basic and upper secondary education are local au-
thorities or joint municipal authorities, while the number of private schools is quite small. Educa-
tion and training provided by public institutions is free of charge for students and their parents at
all levels of education from pre-primary to higher education.
The total educational expenditure for 2007 in Finland accounted for 5.6 per cent of the GDP,
which is more or less the same as the OECD average (5.7%). In 1995, the GDP percentage was
clearly higher (6.3%). At the time, Finland was undergoing a period of deep recession and the
GDP had been dropping for several years, but policy-makers had still tried to exercise more re-

7
International comparisons
straint in curtailing educational expenditure compared with other expenditure. That was a period
when the level of Finland’s educational expenditure was close to the highest expenditure in the
OECD, that is, that of Canada (6.7%). In 2007 Finland was far behind the country with the highest
relative educational expenditure i.e. Iceland, where its GDP percentage was 7.8 per cent.
Figure 8.5 Expenditure on educational institutions as a percentage of GDP (1995, 2000, 2007), total all levels of education
0
1
2
3
4
5
6
7
8
9%
1995 2000 2007
Italy
Czec
h Rep
ublic
Spain
Japa
n
Hung
ary
Eston
ia
Austr
alia
Polan
d
Austr
ia
Norw
ay
Switz
erlan
d
Nethe
rland
s
Finlan
d
Unite
d King
dom
Germ
any
Franc
e
Cana
da
Swed
en
Denm
ark
Unite
d Stat
es
Icelan
d
Source: Education at a Glance 2010, OECD
When compared internationally, educational expenditure is highest in Finland at lower secondary
and higher education levels, where Finland’s expenditure exceeds the OECD average. Neverthe-
less, at 13,550 US dollars per student (incl. R&D expenditure), expenditure on higher education,
for example, was exactly half the amount spent on higher education in the United States.
The main part of educational expenditure is made up of payroll expenses. In Finland, education
at the lower secondary level of basic education is provided by subject teachers and the average
class size is relatively small, less than 20 pupils. In other words, there are about ten pupils to each
lower secondary teacher, which means that expenditure is higher when compared with primary
level, where all subjects are generally taught by a single class teacher.
Higher education expenditure per student reflects, first and foremost, the education policy deci-
sion to invest in a high level of competence. Investments focus on university and polytechnic
R&D activities in particular; the proportion of expenditure per student in these areas is clearly
above the OECD average.

8
International comparisons
Figure 8.6 Annual expenditure on educational institutions per student for all services in Finland and OECD average (2007) In equivalent US$ converted using PPPs for GDP, by level of education , based on full-time equivalents
0
2 000
4 000
6 000
8 000
10 000
12 000
14 000
16 000
Finland OECD average * Including research and development work
Pre-primary Lower secondaryPrimary Upper secondary All tertiary* Primary to tertiary
Source: OECD, Education at a Glance 2010
Teaching and teachers X
In Poland, the number of instruction hours specified in the basic education curriculum is the low-
est of all OECD countries. Polish 7–14-year-olds receive 4,715 compulsory hours of instruction,
while the OECD average is 6,777 hours. At 5,750 hours, Finland ranks third lowest behind Poland
and Estonia. The highest number of compulsory hours of instruction within the OECD can be
found in Italy with 8,300 hours. In Finland, the minimum number of lesson hours is determined
in the Government Decree on the distribution of lesson hours. The minimum lesson hours deter-
mined in the Government Decree for each subject or subject group comprise the education that
every child is entitled to receive. However, education providers – mostly local authorities – usu-
ally provide more instruction than required by the Government Decree.
Also teachers’ teaching duties in Finland are among the lowest in the OECD. Greece and Poland
are the only countries with lower amounts of teaching time. While the annual teaching hours
for lower secondary teachers in the United States and Mexico totalled more than 1,000 hours in
2008, the figure for Greece, Poland and Finland remained under 600 hours, being only just over
400 hours in Greece.

9
International comparisons
Figure 8.7 Compulsory and intended instruction time in public institutions (2008) Average number of hours per year of total instruction time in the curriculum for 7–8, 9–11 and 12–14-year-olds
Netherlands
Australia
Italy
France
Ireland
England
Spain
Iceland
Denmark
Austria
Greece
Japan
Germany
Sweden
Norway
Korea
Russia
Estonia
Finland
Hungary
Poland
0 500 1 000 1 500 2000 2 500 3 000
Age 7–8 Age 9–11 Age 12–14
Source: Education at a Glance 2010, OECD
Class teachers provide instruction in grades 1–6 of basic education that is at primary level and
have the highest number of teaching hours, totalling 677 hours per year. This is one of the low-
est figures among OECD countries. In grades 7–9 of basic education, that is, at lower secondary
level, instruction is provided by subject teachers, whose annual teaching hours are less than that,
totalling 592 hours. South Korea is the only OECD country where teachers have fewer teaching
hours. US lower secondary teachers, in turn, have almost double the number of teaching hours
of their Finnish colleagues.
Among general education teachers, upper secondary school teachers have the lowest number of
teaching hours, 550 per year. However, this is clearly more when compared with their Danish
counterparts, whose annual teaching hours amount to less than 400. South Korean and Japanese
lower secondary teachers in general education also have less than 500 teaching hours. However,
the number of teaching hours does not reflect the teachers’ total workload. In addition to teach-
ing, teachers also participate in joint planning of teaching and naturally spend time planning and
preparing their own classes.

10
International comparisons
Finnish comprehensive school classes are smaller than the OECD average. The smaller average
class size can largely be attributed to the fact that there are plenty of small schools in Finland’s
sparsely populated areas. Just over a quarter of all comprehensive schools have less than 50
pupils. The average class size for grades 1–6 of basic education is 19.8 pupils, while the OECD
average is 21.6 pupils. In grades 7–9, the average class size is 20.1 pupils in Finland, while the
OECD average is 23.9 pupils.
Figure 8.8 Average class size by level of education (2008)
0
5
10
15
20
25
30
35
40
Primary education Lower secondary education
Russi
a
Icelan
d
Luxe
mbou
rg
Denm
ark
Finlan
d
Unite
d King
dom
Italy
Eston
ia
Gree
ce
Slova
k Rep
ublic
Portu
gal
Czec
h Rep
ublic
Hung
ary
Unite
d Stat
es
Polan
d
Austr
ia
Austr
alia
OECD
avera
ge
Franc
e
Spain
Germ
any
Chile
Japa
n
Korea
Source: OECD, Education at a Glance 2010
In terms of pay Finnish teachers are ranked at the OECD average level when compared using
purchasing power parity (PPP). The starting salary of Finnish primary education class teachers is
more than triple the amount paid to teachers in Poland, but only two thirds of a German teacher’s
salary.
Finnish teachers’ salary development over the course of their careers is fairly positive when com-
pared with their counterparts in other countries. A Finnish teacher’s salary improves by 63 per
cent from the starting salary to the top of the pay scale, whereas the corresponding change in
South Korea may even be as high as 177 per cent.
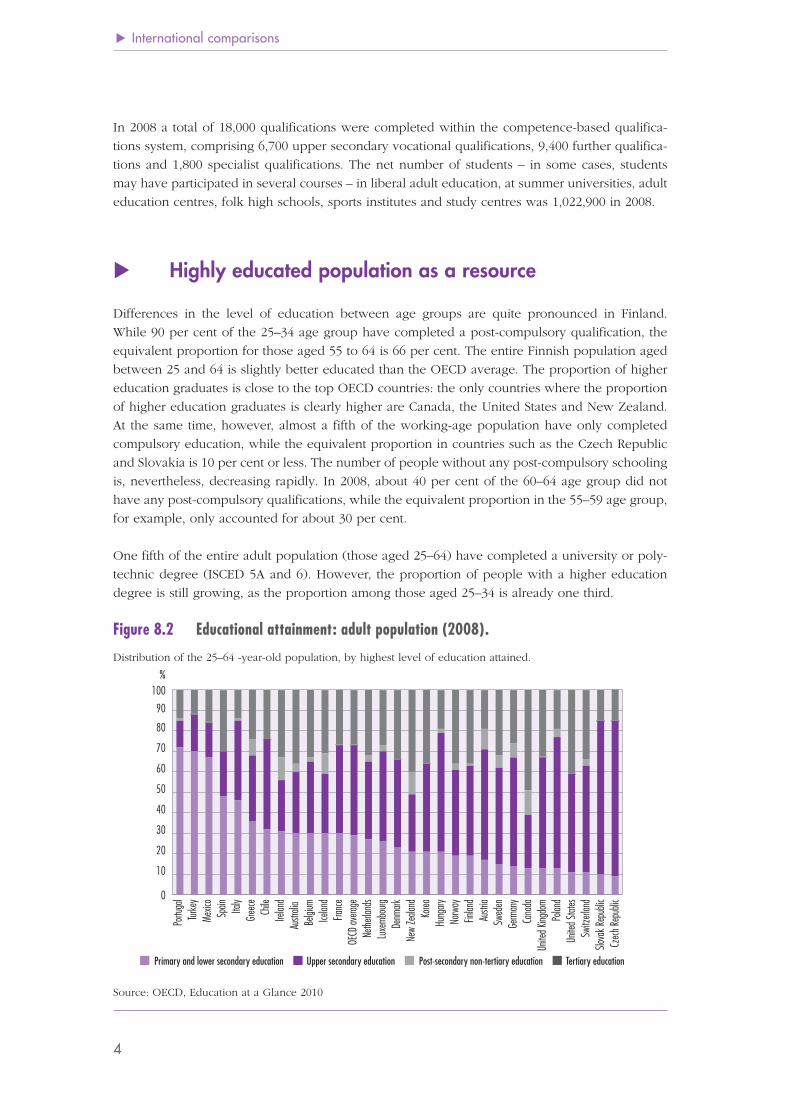
Vocational education and training is popular X
In Finland upper secondary level is divided into general upper secondary education and voca-
tional education and training. Both types of education last three years and provide eligibility to
apply for higher education. In recent years, vocational education and training has become more
popular. In 1998, 35 per cent and 54 per cent of those leaving basic education moved immediately
11
International comparisons
to vocational education and training and upper secondary school, respectively, while another
3 per cent continued in voluntary additional basic education and 8 per cent did not continue to
the next level immediately after finishing basic education. In 2008 altogether 42 and 51 per cent
of those finishing basic education moved on to vocational education and training and upper sec-
ondary school, respectively, while 2 per cent continued in voluntary additional basic education
and 5 per cent did not continue their studies immediately.
In international terms, the number of vocational students in proportion to those in general educa-
tion is high in Finland. Two thirds of upper secondary students are in vocational programmes,
whereas the proportion in Japan, for example, is only one quarter.
Figure 8.9 Upper secondary enrolment patterns (2008)
0
10
20
30
40
50
60
70
80
90
100%
General Vocational
Austr
ia
Czec
h Rep
ublic
Slova
k Rep
ublic
Finlan
d
Luxe
mbou
rg
Austr
alia
Italy
Germ
any
Denm
ark
Russi
a
Polan
d
Franc
e
Spain Chile
Icelan
d
Eston
ia
Unite
d King
dom
Gree
ce
Portu
gal
Korea
Hung
ary
Japa
n
Source: OECD, Education at a Glance 2010
Finnish women receive more education than men X
In international terms, Finns participate in formal education very actively. Boys are in the major-
ity at comprehensive school, because virtually all children go to comprehensive school and there
are always more boys than girls within the young population. Women account for 57 per cent of
upper secondary school students, 51 per cent of students on all types of upper secondary and fur-
ther vocational programmes and 55 per cent of all polytechnic students. Of all university students,
53 per cent are women, accounting for 55 per cent at Bachelor level, a slight minority or 49.5 per
cent at Master level, and 53 per cent in postgraduate (third-cycle) higher education.
Finnish women’s high level of education is also visible in the comparisons of the population’s
level of education. South Korea, Slovakia and the Czech Republic are the only OECD countries

12
International comparisons
where the proportion of women with post-compulsory qualifications is higher than in Finland,
when examining the 25–34 age group. In 2008 nearly 92 per cent of women had completed a
post-compulsory qualification in Finland, whereas the figure for men was 88 per cent.
Figure 8.10 Population (25–34 year-olds) with at least upper secondary education (2008)
0
10
20
30
40
50
60
70
80
90
100%
Males Females
Turke
yMe
xico
Portu
gal
Spain
Icelan
dIta
lyUn
ited K
ingdo
mLu
xemb
ourg
Gree
ceNe
w Ze
aland
OECD
avera
geAu
strali
aFra
nce
Nethe
rland
sCh
ileGe
rman
yBe
lgium
Austr
iaHu
ngary
Denm
arkNo
rway
Eston
iaIre
land
Switz
erlan
dUn
ited S
tates
Swed
enFin
land
Polan
dCz
ech R
epub
licCa
nada
Slova
k Rep
ublic
Korea
Source: OECD, Education at a Glance 2010
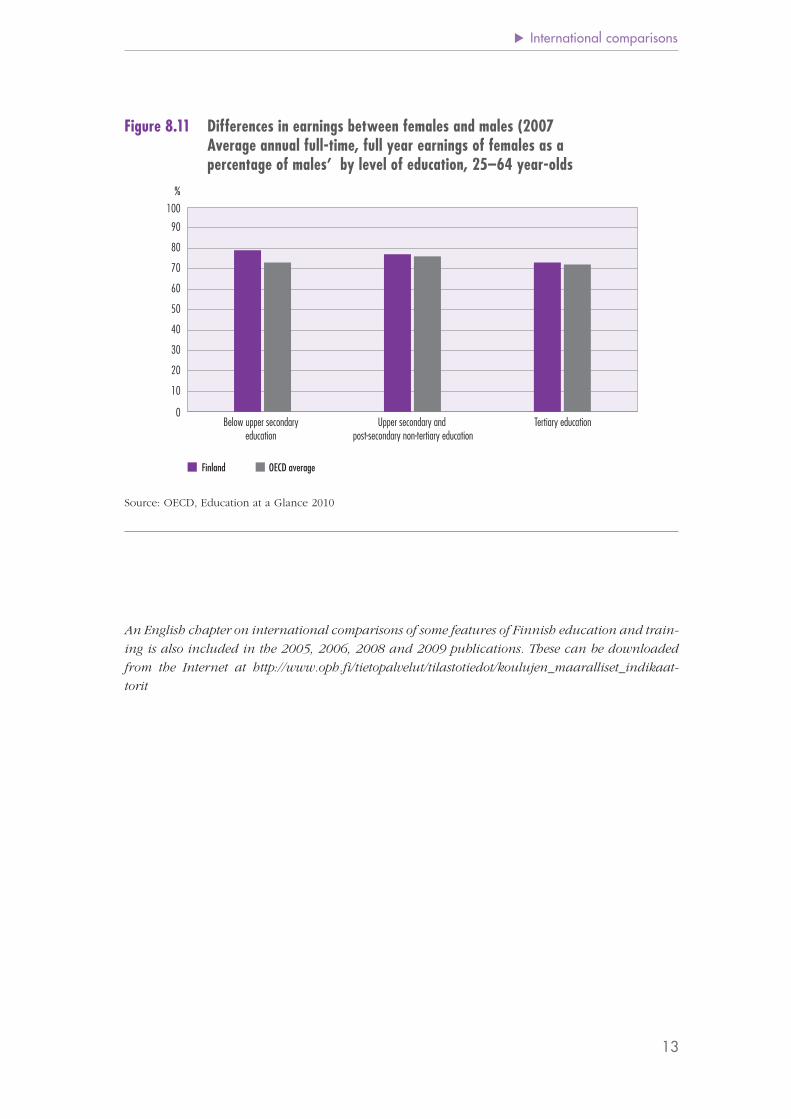
The higher education level of Finnish women cannot, however, be seen in their pay levels when
compared with men. The higher the level of education women have, the more their pay falls be-
hind that of men. On average, women’s pay accounted for 79 per cent of men’s pay among those
without any post-compulsory schooling, while the figures for those with upper secondary certifi-
cates and higher education degrees were 77 and 73 per cent of men’s pay level, respectively.
13
International comparisons
Figure 8.11 Differences in earnings between females and males (2007 Average annual full-time, full year earnings of females as a percentage of males’ by level of education, 25–64 year-olds
0
10
20
30
40
50
60
70
80
90
%
100
Finland OECD average
Below upper secondary education
Upper secondary and post-secondary non-tertiary education
Tertiary education
Source: OECD, Education at a Glance 2010
An English chapter on international comparisons of some features of Finnish education and train-
ing is also included in the 2005, 2006, 2008 and 2009 publications. These can be downloaded
from the Internet at http://www.oph.fi/tietopalvelut/tilastotiedot/koulujen_maaralliset_indikaat-
torit
14
International comparisons