Embed Size (px)
Citation preview


Occasional Paper No. 10
International Comparisons ofGovernment Expenditure
Alan A. Tait and Peter S. Heller
International Monetary FundWashington, D.C.
April 1982

International Standard Serial Number: ISSN 0251-6365
Price: US$5.00(US$3.00 to university faculty members,
libraries, and students)
Address orders to:External Relations Department, Attention Publications
International Monetary Fund, Washington, D.C. 20431

This page intentionally left blank

Contents
iii
I.
II.
III.
IV.
V.
Introduction and Some Conclusions
Conceptual Issues
Determinants of Shares in Gross Domestic Product of FunctionalExpenditure Categories
IntroductionGeneral Public ServicesDefenseEducationHealthSocial Security and WelfareHealth, Social Security, and Welfare CombinedHousingAgricultureEconomic Services: Mining, Manufacturing, and
ConstructionEconomic Services: Electricity, Natural Gas, Steam, and WaterEconomic Services: Roads, Other Transport, and Communications
Determinants of Shares in Gross Domestic Product ofEconomic Expenditure Categories
IntroductionGoods and Services
Wages and SalariesGoods and Services Other Than WagesTotal Goods and Services
Interest PaymentsSubsidies and Other Current TransfersTotal Current ExpenditureCapital AssetsCapital TransfersTotal Capital
Balance in Expenditure Composition
1
6
9
19
26
Tables in Text1. International Expenditure Comparison Index, 1977: Functional Categories
of Expenditure 22. International Expenditure Comparison Index, 1977: Economic Categories
of Expenditure 43. Determinants of Functional Expenditure Categories as Share of Gross
Domestic Product 10
PagePrefatory Note v

CONTENTS
Page
4. Ranking of Countries by International Expenditure Comparison Index,1977: Functional Expenditure 12
5. IEC Indices for Health and Social Security in Selected Countries WhereMedical and Social Security Systems Partly Overlap 16
6. Determinants of Economic Categories of Expenditure as Share of GrossDomestic Product 19
7. Determinants of Economic Categories of Expenditure as Share of GrossDomestic Product Using Disaggregated Categories of Expenditure onEconomic Services 20
8. Ranking of Countries by International Expenditure Comparison Index,1977: Economic Expenditure 22
9. Measures of Balance in Composition of Public Expenditure on anEconomic Basis 27
iv
Appendix Tables10. Share of Functional Expenditures in Gross Domestic Product, 1977 2811. Functional Expenditures as Percentage of Total Expenditure, 1977 3012. Share of Economic Expenditures in Gross Domestic Product, 1977 3213. Economic Expenditures as Percentage of Total Expenditure, 1977 3414. Variables Used in Estimating Equations: 1977 or Latest Available Year 3615. Variables Used in Estimating Expenditure Equations: 1977 or Latest
Available Year 38

Prefatory Note
This study was prepared by Alan A. Tait, Deputy Director, GovernmentExpenditure Analysis Division, Fiscal Affairs Department, and Peter S. Heller,Assistant Chief of the above Division.
The opinions expressed are those of the authors and do not necessarily representthe views of the Fund.
V

This page intentionally left blank

I Introduction and Some Conclusions1
Many studies on international tax comparisons havebeen undertaken since the early 1970s.2 While controver-sial, such studies have facilitated more subtle compari-sons of a country's tax performance than would beafforded by focusing on its simple tax ratio. This paperprovides a comparable framework for comparisons ofboth functional and economic expenditure patterns ofcountries having similar economic and demographicpositions. It also provides an implicit technologicalnorm for predicting the economic characteristics of acountry's expenditure pattern, based on its choice ofpriorities for functional expenditures.
For example, Table 1 shows the international expendi-ture comparison index for comparing the functionalcategories of government expenditure. Use of this indexallows us to conclude, tentatively, that the FrenchGovernment spends a little more than might be expectedon education (9 per cent more) but perhaps 20 per centmore than expected on health and social security, where-as the Egyptian Government spends twice as much asexpected on education, the United Kingdom 50 per centmore than expected, but Greece 30 per cent less. Analternative way to look at government expenditure is todivide it into the so-called economic categories; Table 2shows the indices for the economic classification ofexpenditures. This table indicates that the Governmentof Mali spends some 79 per cent more than might beexpected on government wages and salaries and Greecespends twice as much as expected, while Korea spends 55per cent less than predicted.
In a paper of this sort, no brief summary of results ispossible; the tables just referred to and the detailed dis-cussions in Sections III, IV, and V present the results.However, five general conclusions are worth making.
First, many international cross-section studies ofgovernment revenue and expenditures use per capitaincome as a proxy for most of the underlying demo-
1The authors would like to acknowledge the research assistance ren-dered by Ms. Tarja Papavassiliou and Ms. Erika Kaufman.
2See Alan A. Tait, Wilfrid L. M. Gratz, and Barry J. Eichengreen,"International Comparisons of Taxation for Selected DevelopingCountries, 1972-76," Staff Papers, Vol. 26, No. 1 (March 1979),pp. 123-56.
graphic, social, and economic differences,3 yet it is strik-ing how uncertain per capita income is as an explanatoryvariable. This poor performance of per capita incomecompared with other variables suggests the importanceof searching for the more robust, underlying, basic vari-ables as is done in this paper.
Second, it is encouraging to note how plausible themodeled relationships are; it is also reassuring to see howmost of the expenditure indices for individual countriesreflect general knowledge concerning those countries'performances and attitudes (for example, on defense,health, and social welfare).
Third, the technical coefficients of functional catego-ries that determine economic categories of expenditure(see Tables 2, 6, and 7) are powerful and suggestive.
Fourth, there appears to be no clear support for thehypothesis that the majority of governments spend ex-cessive amounts on wages relative to amounts spent ongoods and services; some countries do appear to over-spend on wages relative to other goods and services—some do not. However, a clear bias is evident towardgreater-than-expected current expenditure relative tocapital expenditure in Africa and in industrial countries;the same regions spend more than expected on subsidiesrelative to wages. The reverse patterns emerge in LatinAmerica.
Finally, without a doubt, this exercise provides many"departure points" for discussions and assessments ofgovernment expenditure policies in individual countries.
Three conceptual points should be stated at the outset.First, there is a distinction between the international taxcomparison index (hereinafter referred to as the ITCindex) and the international expenditure comparisonindex (hereinafter referred to as the IEC index). Themeasurement of tax effort is helped by the fact thatgovernments, to finance their operations in a sustainableand noninflationary way, must transfer private sectorresource claims to the public sector using whatever "taxhandles" they find at their disposal. Expressed in thesebasic terms, it is clear that in their tax collection efforts
3For example, Richard A. Musgrave, Fiscal Systems (New Havenand London, Yale University Press, 1969), pp. 110-24.
1

Social Health, Housing Agriculture, Mining, Electricity, Transpor-Year General Security Social and Forestry, Manufac- Natural tation and
of Public and Security, and Community and turing, and Gas, and Communi-Country Data Service Defense Education Health Welfare Welfare Amenities Fisheries Construction Water cations
Argentina 1977 400 112 34 13 57 45 31 16 400 118 109Australia 2 96 71 130 111 69 85 38 63 ... ... 72Austria 1977 142 50 68 100 95 97 130 59 74 400* 142Bahamas 1975 109 9 105 120 34 81 8 40 ... ... ...Bahrain 1977 ... ... ... 119 ... ... ... ... 16 ... ...
Bangladesh 1977 42 12 49 106 345 93 ... 93 9 2 293Barbados 1977 113 6 139 89 63 81 185 171 ... 135 145Belgium 1977 64 71 132 87 119 111 68 29 138 400* 171Bolivia 1977 82 82 78 67 14 35 40 22 18 54 78Botswana 1977 121 48 163 150 12 112 279 136 ... 126 ...
Burma 1977 79 225 62 57 39 45 215 138 28 ... 78Burundi 1977 71 145 122 ... 211 113 ... 107Cameroon 1976 180 83 78 63 250 129 1 66 204 45 126Canada 2 155 68 109 126 113 119 117 126 ... ... 231Chad 1977 97 400 109 43 19 32 18 125 12 2 44
Chile 1977 151 74 105 115 228 183 121 64 2 9 63Costa Rica 1977 59 24 98 43 210 135 30 35 3 5 152Cyprus 1977 142 145 61 64 67 62 218 79 16 55 33Denmark 1976 116 78 66 104 99 98 50 127 89 400* 34Dominican Rep. 1977 71 36 46 93 127 106 278 96 199 83 52
Ecuador 1977 62 98 85 63 7 34 ... 75 ... 26 ...Egypt 1977 67 68 211 107 187 163 342 132 19 91 47El Salvador 1977 77 25 83 93 96 93 79 65 1 25 113Ethiopia 1977 60 82 80 125 225 138 21 85 27 48 151Fiji 1977 160 17 114 146 306 154 82 114 83 83 79
Finland 1977 77 78 124 121 76 90 70 231 170 42 127France 1977 77 75 109 121 119 120 93 45 135 37 19Gambia, The 1977 200 ... 99 211 49 119 48 225 ... 119 ...Germany, Fed. Rep. 2 64 114 92 118 97 101 89 51 ... ... 188Ghana 1977 76 ... 132 94 75 87 ... 95 53 3 93
Greece 1977 83 325 71 69 83 82 64 121 46 19 103Grenada 1977 29 139 105 189 34 87 43 95 386 ... ...Guatemala 1977 60 55 ... 55 73 65 34 28Honduras 1976 130 54 89 180 108 159 93 28 29 ... ...Iceland 1977 124 ... 75 135 41 70 106 233 ... ... ...
Iran 1977 36 185 80 120 38 49 197 84 85 142 71Ireland 1977 ... ... 40 ... 68 51 10 ... ... ... ...Israel 1977 30 390 130 79 153 137 44 48 72 46 39Italy 1977 109 39 108 147 104 120 73 100 400 ... 190Jamaica 1977 73 16 130 144 25 56 151 196 19 60 87
Japan 2 ... ... 85 75 50 60 122 204 14 ... 88Jordan 1975 111 308 175 198 142 152 100 197 400 355 240Kenya 1977 73 89 104 123 400* 138 28 94 43 231 115Korea 1977 65 244 89 23 30 26 15 54 10 46 33Kuwait 1977 98 91 59 73 29 44 272 3 207 94 ...
Lesotho 1974 171 ... 148 88 111 103 323 187 ... 65 ...Liberia 1977 188 31 122 148 33 100 110 101 9 4 115Luxembourg 1977 102 28 77 19 163 127 43 96 ... 10 ...Madagascar 1973 103 30 103 106 400 237 14 119 22 19 93Malawi 1977 80 63 87 57 121 78 14 114 8 34 71
Malaysia 1977 105 131 137 137 62 106 5 64 1 15 53Mali 1976 111 149 132 99 260 145 ... 60 141 36 42Malta 1977 102 29 94 86 125 121 143 135 202 365 154Mauritius 1977 141 5 118 166 181 171 104 360 14 70 50Mexico 1977 43 13 82 52 217 142 ... 163 ... 400 57
Morocco 1977 208 128 163 99 295 178 152 ... ... ... ...Nepal 1977 43 98 38 400* 400 96 20 92 ... 252 ...Netherlands 1977 150 73 156 132 163 157 111New Zealand 1977 71 30 109 129 114 124 28 148 ... ... ...Nicaragua 1976 62 45 65 46 400 212 269 68 31 20 ...
Niger 1977 142 46 160 109 400 394 3 56 110 68 116Norway 1977 62 121 120 92 82 84 309 227 123 27 118Oman 1974 ... ... ... 270 ... ... ... 25 162 ... ...
2
Table 1. International Expenditure Comparison Index, 1977: Functional Categories of Expenditure1
I • INTRODUCTION AND SOME CONCLUSIONS

Introduction and Some Conclusions
* Asterisk denotes that this particular IEC index should be treated with care as actual expenditures were extremely small and predicted expendituresnegative—see text for explanation.
1 As the text explains in more detail, this index represents the actual expenditure/gross domestic product (GDP) ratio as a percentage of thepredicted expenditure/ GDP ratio.
2 1973-75.
all governments have a similiar objective. There appearto be few substantial alternative approaches to the prob-lem of financing expenditure that would not be capturedin one form or another by the ITC index. The construc-tion of an expenditure index, however, poses more com-plex problems, first, because government expendituresare directed at many objectives and, second, becausemany of these objectives can be achieved by the use ofpolicy instruments other than government expenditure,for example, tax expenditures, price controls, tariffs,import restrictions. It may be possible to design indicesfor particular broad objectives (functional expenditureindices) but these single objective indices will be difficultto interpret unless steps can also be devised to takeaccount of the different policy instrument mixes chosenby individual governments in the sample. (The mostobvious example is the interchangeability of government
expenditures and tax expenditures.)Second, it is not intended that this paper should make
normative judgments as to the appropriateness of acountry's functional expenditure priorities. The economicoptimality of a given amount of spending on defense oreducation may be open to question in a cost-benefitsense. It is also questionable whether the objectives for asector are being realized in a cost-effective manner, giventhe level of expenditure. Yet, ultimately, the publicexpenditure budget reflects the social and economicpriorities of a country's government and, presumably, ofits population; thus, it is difficult to state that a countryis spending too much or too little on a particular type ofexpenditure.
Third, the measures proposed in this paper areindications—possible starting places—for discussion.After all, if a country is spending, say, twice as much as
3
Table 1 (concluded). International Expenditure Comparison Index, 1977: Functional Categories of Expenditure1
Social Health, Housing Agriculture, Mining, Electricity, Transpor-Year General Security Social and Forestry, Manufac- Natural tation and
of Public and Security, and Community and turing, and Gas, and Communi-Country Data Service Defense Education Health Welfare Welfare Amenities Fisheries Construction Water cations
Pakistan 1977 39 164 15 23 27 24 169 31 46 102 117Panama 1977 139 ... 116 264 273 254 49 81 99 99 88
Papua New Guinea 1977 110 43 133 160 15 148 186 121 116 101 176Paraguay 1977 67 51 31 20 140 75 27 24 12 ... 151Peru 1977 91 65 111 74 2 35 75 125 ... 203 ...Philippines 1976 79 103 52 50 117 60 30 96 166 400 198Portugal 1977 140 251 74 91 81 79 84 51 95 210 ...
Rwanda 1977 62 131 58 48 400 400* 7 39 43 83 267Senegal 1975 112 70 97 66 57 67 55 37 ... 42 10Sierra Leone 1978 123 57 102 114 26 63 49 56 12 109 54Singapore 1977 195 139 93 50 7 30 114 8 2 1 52Somalia 1977 160 176 167 164 400 305 400 210 224 ... 55
Spain 1977 53 42 47 61 93 86 41 73 41 4 53Sri Lanka 1977 58 27 101 82 400 301 38 106 22 ... ...Sudan 1977 30 93 39 27 56 44 3 174 2 ... 106Suriname 1976 247 ... 116 ... 167 192 113 76 97 ... 92Swaziland 1977 123 48 132 116 16 101 176 160 ... 400 ...
Sweden 1977 94 85 154 127 123 122 86 94 240 400 58Syrian Arab Rep. 1977 19 218 78 30 122 87 159 130 400* 254 115Tanzania 1977 95 114 106 138 400 188 81 135 286 171 93Thailand 1977 38 155 88 55 400 183 72 78 20 400 115Tunisia 1977 61 26 179 151 139 141 63 178 78 ... 114
Turkey 1977 69 97 97 36 19 25 57 36 312 270 181United Arab Emirates 1977 176 150 ... ... ... ... 33 ... 1 ... ...United Kingdom 1977 99 112 152 110 66 79 265 95 131 400 112United States 2 51 318 85 71 78 76 64 18 ... ... 19Upper Volta 1973 82 218 85 67 32 50 24 11 31 ... 55
Uruguay 1978 232 72 57 55 139 113 8 32 32 107 75Venezuela 1977 60 33 119 67 77 78 151 248 141 155 107Yemen Arab Rep. 1977 111 400 40 55 ... 23 ... 14 2 ... 84Yugoslavia 1977 31 400 ... 157 103 128 ... 19Zambia 1977 172 ... 157 169 10 144 105 231 84 90 133
Mean 103 110 100 103 131 112 103 100 95 134 101
Standard deviation 57 101 38 60 116 67 113 68 112 138 50

Table 2. International Expenditure Comparison Index, 1977: Economic Categories of Expenditure1
Year Goods Wages Other Acquisitionof Current and and Goods and Capital of Capital Capital
Country Data Expenditure Services Salaries Services Interest Subsidies Expenditure Assets Transfers
Argentina 1977 92 56 ... ... 225 115 114 95 83Australia 1977 105 118 ... ... 118 94 164 314 ...Austria 1977 96 78 65 140 55 113 99 46 107Bahamas 1976 90 111 116 137 89 36 82 ... ...Bahrain 1977 85 83 ... 87 14 51 129 151 ...
Barbados 1977 99 117 98 175 186 48 83 80 83Belgium 1977 95 64 87 100 155 108 71 87 78Bolivia 1977 80 86 87 57 29 127 81 72 66Botswana 1977 93 85 89 99 145 122 116 139 49Burma 1977 94 ... ... ... ... ... 67 ... ...
Cameroon 1976 88 101 97 103 27 64 172 132 80Canada 1977 107 108 ... ... 228 76 32 57 ...Chad 1976 98 ... ... ... ... ... 81 ... ...Chile 1977 100 105 107 70 158 97 84 116 8Costa Rica 1977 79 99 93 252 162 56 133 219 68
Cyprus 1977 112 136 148 100 94 88 91 122 96Dominican Rep. 1976 73 68 84 42 22 151 90 123 111Egypt 1977 160 118 116 120 188 219 99 69 192El Salvador 1977 76 70 ... ... 24 226 102 77 122Ethiopia 1977 137 150 138 171 70 80 78 90 5
Fiji 1977 93 104 88 123 147 46 96 96 60Finland 1977 96 108 ... ... 35 90 62 115France 1977 83 58 89 86 26 110 84 323 97Gambia, The 1977 143 123 92 139 68 143 98 87 3Germany, Fed. Rep. 1977 102 127 ... ... 60 89 99 392 ...
Greece 1977 89 145 212 107 70 26 96 117 39Grenada 1977 94 112 116 112 45 53 33 ... ...Guatemala 1977 74 69 71 52 63 130 127 55 307Honduras 1976 67 96 91 106 41 21 213 125 325Iceland 1977 96 69 106 60 81 133 84 50 171
Iran 1976 110 102 124 83 18 140 125 190 21Israel 1977 101 101 80 113 181 98 53 50 250Italy 1975 88 43 63 31 172 122 68 39 114Jamaica 1977 124 102 98 128 337 160 92 96 104Japan 1977 ... ... ... ... ... ... 72 ... ...
Jordan 1975 95 100 ... ... 45 77 114 122 92Kenya 1977 95 90 95 100 125 143 89 93 ...Korea 1977 83 74 45 97 47 173 140 96 155Kuwait 1977 117 103 131 123 ... 136 85 70 ...Lesotho 1974 ... ... 88 ... ... ... 92 82 ...
Liberia 1977 114 115 128 88 65 174 181 124 ...Luxembourg 1977 103 96 142 179 142 92 66 60 57Madagascar 1973 111 107 137 76 33 147 94 92 8Malawi 1977 114 96 63 138 204 218 137 143 84Malaysia 1977 90 96 113 75 150 98 223 115 224
Mali 1976 92 118 179 59 6 101 87 55 ...Malta 1977 106 137 135 142 68 73 60 105 ...Mauritius 1977 115 94 105 62 173 146 90 63 95Mexico 1977 79 77 72 93 364 53 ... 97 53Morocco 1977 82 88 112 46 108 67 227 173 13
Netherlands 1977 92 47 66 61 56 127 114 ... 193Nicaragua 1976 72 90 76 107 113 33 122 146 199Niger 1977 108 106 90 162 191 164 113 65 400Norway 1977 112 96 ... ... 139 118 17 35 ...Oman 1974 ... 100 76 ... 16 ... 152 ... 117
Pakistan 1977 115 87 ... ... 142 400 73 94 2Panama 1977 103 119 119 138 200 60 90 53 107Papua New Guinea 1977 135 147 ... ... 193 55 36 36 52Paraguay 1977 85 97 77 104 37 72 151 148 49Peru 1977 94 79 ... ... 199 145 100 96 95
Philippines 1976 103 84 64 82 65 317 37 ... ...Rwanda 1977 84 82 88 83 12 228 98 113 ...Senegal 1975 109 130 128 144 32 132 103 51 400
4
I • INTRODUCTION AND SOME CONCLUSIONS

Introduction and Some Conclusions
1 As the text explains in more detail, this index represents the actual expenditure/ GDP ratio as a percentage of the predicted expenditure/ GDP ratio.
might be expected (given its population structure, urban-ization rates, economic structure) on education, it prob-ably has a good sui generis reason, but policymakersshould at least focus on the question and realize thatsuch expenditure, although it may be justified, is un-usual. It is not proposed that the expenditure indicespresented in this paper should replace detailed countrystudies as a basis for actual expenditure decisions, butmerely that they should provoke further analysis anddiscussion.
Section II discusses some further conceptual issuesthat arise in such an analysis and reviews the methodol-ogy used in this paper. (Readers interested only in theresults could skip this section.) Sections III and IV dis-cuss the results on a functional and economic basis,respectively. Section V discusses the balance in expendi-ture composition between wages and other goods andservices, wages relative to subsidies, and goods and ser-vices relative to subsidies. The basic data appear in theAppendix.
Table 2 (concluded). International Expenditure Comparison Index, 1977: Economic Categories of Expenditure1
5
Year Goods Wages Other Acquisitionof Current and and Goods and Capital of Capital Capital
Country Data Expenditure Services Salaries Services Interest Subsidies Expenditure Assets Transfers
Sierra Leone 1978 123 126 84 179 117 140 79 ... ...Singapore 1977 90 108 88 111 127 29 121 187 3
Somalia 1977 112 ... ... ... ... ... 73 ... ...Spain 1977 91 116 125 127 28 77 143 195 94Sri Lanka 1977 102 81 79 84 306 109 170 128 230Sudan 1977 149 78 39 113 400 400 92 130 ...Suriname 1976 115 147 141 121 20 50 141 107 5
Swaziland 1977 94 105 114 103 18 68 106 122 ...Sweden 1977 113 157 ... ... 89 89 145 400 ...Switzerland 1977 139 152 ... ... 119 111 232 ... ...Tanzania 1977 112 104 101 113 135 109 82 46 328Thailand 1977 83 86 62 149 93 98 121 185 336
Tunisia 1977 82 79 84 81 114 88 136 131 225Turkey 1977 100 69 78 45 130 183 63 84 22United Arab Emirates 1977 69 ... ... ... ... ... 400 ... ...United Kingdom 1976 93 73 65 104 114 124 34 62 61United States 1977 103 138 ... ... 101 77 212 400 ...
Upper Volta 1977 96 102 74 19 53 115 71 13 319Uruguay 1978 92 105 99 73 30 89 94 87 12Venezuela 1977 92 82 98 55 125 76 125 41 391Yemen Arab Rep. 1977 ... 112 190 ... 8Zambia 1977 ... .. 111 ... ... ... 60 37 ...
II Conceptual Issues
One can make hypotheses about the identity of thefactors that are likely to influence spending in a givenfunctional sector, and the significance of such factorscan be empirically tested. Six groups of factors can beidentified: (1) demographic influences, (2) sociologicalconcerns, (3) the structure of the economy, (4) the levelof economic development, (5) technological factors, and(6) environmental factors.
Demographic influences are likely to be principalunderlying determinants of the demand for services. Thelarger the share of school-age groups in the populationthe greater the likely demand for education; the higherthe percentage of elderly people in the population thegreater the demand for medical care and perhaps moreelaborate public mechanisms for old-age support. Otherdemographic variables, such as life expectancy, popula-tion growth, share of population in urban areas, andinfant or child mortality rates, may imply the existenceof a core underlying demand for certain types of services.Sociological concerns may explain whether there is ademand for the public sector to provide certain services;for example, the need for a social security mechanism isgreater where extended family arrangements have brokendown.
The sectoral structure of an economy may play a keyrole in shaping priorities for public expenditure. A dom-inant agricultural sector may require certain forms ofpublic expenditure on agriculture to complement or ser-vice private sector activities. It might also be supposedthat at low levels of development, the desire to changethe structure of the economy may stimulate publicexpenditure in sectors that are not currently dominantelements in total output.
Technological factors influence the cost of realizingexpenditure objectives. For example, the lower thedesired pupil-to-teacher ratio the higher the cost of real-izing a given percentage of enrollment for the popula-tion. Environmental factors may influence both the costof providing services and the likely magnitude of theunderlying demand; for example, poor access to cleanwater may imply a significant demand for investment toprovide drinking water as well as the likely need formedical services because of the effects of contaminatedwater supplies.
These variables all focus on the major factors underly-
ing the demand for public services. Yet, clearly, the levelof real per capita income is the ultimate constraint onhow much, in total, of that demand can be satisfied. Inthe typical low-income country, the recent high popula-tion growth rates have produced a population structurewith a relatively high percentage in the school-agegroups, which should imply a very high share of educa-tional expenditure in total output. Yet the very lowincomes may constrain government revenue so as to vir-tually preclude full enrollment even in primary schools,let alone in secondary schools. The quality of educationwill also fall short of that available in the higher-incomecountries. Thus, in analyzing the determinants of theshare in gross domestic product (GDP) of public spend-ing on a sector, the level of development (as measured byper capita GDP) seems to place a fundamental limit onpossible spending in many sectors. It may also influencethe likely balance in spending between the economic sec-tors, which are oriented toward stimulating current pro-ductivity and capital accumulation, and the social andadministrative sectors, which aim at providing currentconsumption. It can be added, furthermore, that, whileper capita income constitutes a constraint that limits thetotal provision of goods and services to satisfy a coun-try's need, it does not necessarily reflect the degree andthe proportion in which these goods and services areprovided by the public sector as opposed to the privatesector. The division between the public and private sec-tors may reflect institutional and political considerationsas well as the government's capacity to obtain resources(through taxation) to finance these expenditures.
At a general level it may be hypothesized that thetypes of goods and services purchased by governmentexpenditure—the so-called economic categories of ex-penditure—are significantly influenced by sectoral prior-ities. In any sector there may be a wide range of services,each potentially produced by a host of different technol-ogies. Yet, on balance, the mix of labor, current con-sumption of other goods and services, and capital goodsis likely to be different for each functional sector, so thatthe economic mix of expenditure will be largely deter-mined by the functional mix. For example, a high shareof spending on education is likely to imply a high shareof spending on wages and salaries and perhaps on goodsand services; similarly, a strong correlation might be
6

Conceptual Issues
expected between the share of spending on economicsectors and public capital formation. In developing pre-dictive norms for appraising the share of spending ondifferent economic categories of expenditure, the func-tional spending priorities are thus assumed to be theprimary determinants.4
Sections III and IV describe the precise specificationsused to explain the shares in total output associated withpublic expenditure on different sectors and differenteconomic inputs. The equations are then used to predicta "norm" for spending on a sector or on a specific type ofexpenditure in a given country. The norm simply reflectswhat a country would be expected to spend on a sector,given the country's economic, social, and demographiccharacteristics and given the actual expenditure of thelarge number of countries, both developed and develop-ing, in the sample. In effect, the norm is defined accor-ding to how a large number of countries actually spendtheir funds, without regard to any external judgmentabout the optimality of this spending.
For any country, the ratio of actual to predictedexpenditure ratios is computed and taken as an index forthe purposes of international expenditure comparison—the IEC index. For example,
A high value of the IEC index (e.g., above unity) for afunctional expenditure category simply indicates that acountry is spending more than would be predicted, givenits economic and social characteristics (or in an IECindex for an economic input, given the structure of itsfunctional expenditure). It does not indicate the actualshare in GDP of a given category of expenditure; a coun-try with a low IEC index (e.g., less than unity) may,nevertheless, be spending a higher share of GDP on acategory of expenditure than a country with a high IECindex. For reference purposes, Appendix Tables 10 and12 provide the actual functional and economic expendi-ture shares in GDP, and Appendix Tables 11 and 13show the shares as a percentage of total governmentexpenditure and net lending. By dividing the IEC indicesfor a country into these actual shares, the predictedshares may be calculated and expressed as a percentage.
The sources of the deviation of an IEC index fromunity for a given country cannot be directly inferredfrom the results and may represent a conscious policychoice by the authorities to attach a different emphasisto a sector than is attached by its peer countries. An
upper limit has been placed on the value of the IECindex. It is quite possible that the econometrically pre-dicted values of the expenditure share in GDP may be avery small, or even a negative, number. As the IEC indexequals the ratio of the actual to predicted shares, thisratio can lead to either a negative index value or to anexceptionally large value. Both simply indicate that acountry is spending far more than would be expected. Inboth, a maximum value of 400 has been arbitrarily at-tached to the IEC index. Where an IEC index number isassociated with a negative value and where the actualgovernment expenditure is extremely small (under 0.1per cent of GDP), the value assigned is shown as 400,although, in fact, it might be more appropriate to give avalue of 100; after all, the actual expenditure is extremelysmall and the predicted expenditure is so small as to benegative, therefore, it could be maintained that actual isclose to predicted, i.e., 100. However, in practice, in theseven cases where this happened (out of about 2,000indices), the reader is signaled by an asterisk to treat theIEC number with care.
The data for the dependent variables for this cross-country study have been drawn from the most recentvolume of the Government Finance Statistics Yearbook,published by the International Monetary Fund.5 Up to93 countries have been included in this study, generallyusing 1977 as the base year for comparison. Expenditurehas been disaggregated into the following functional andeconomic categories:
Functional Expenditures
General public servicesDefense
Education
Health, social security, andwelfare
HealthSocial security and welfare
Housing and communityamenities
Agriculture, forestry, fishing,and hunting
Mining, manufacturing, andconstruction
Electricity, gas, steam, andwater
Roads, other transportation,and communications
Economic Expenditures
Current expenditureExpenditure on goods and
servicesWages and salariesOther purchases of goods
and services
Interest payments
Subsidies and other currenttransfers
Capital expenditure
Acquisition of fixed capitalassets
Capital transfers
4It should be noted that all functional relationships have been esti-mated to include and exclude net lending (domestic and foreign); nosignificant difference in ranking occurred. The regressions in this paperhave been estimated with net lending omitted.
5International Monetary Fund, Government Finance StatisticsYearbook, Vol. 4 (1980); hereinafter referred to as the GFS Yearbook.When data are unavailable for 1977, the next nearest available year hasbeen used (see Table 4).
IEChealth
7

II • CONCEPTUAL ISSUES
The choice of independent variables was greatly influ-enced by the availability of data. The principal data setswere taken from the International Monetary Fund'sInternational Financial Statistics (IFS) and the WorldBank's World Tables.6 Several data problems were en-countered. First, in calculating the share in GDP ofexpenditure, an adjustment in GDP was necessary wherethe fiscal year in the government accounts differed fromthe calendar year. For example, where the fiscal year1977 ended on June 30, 1977, the use of GDP forcalendar year 1977 could seriously underestimate theshare of expenditure in total GDP, particularly if thecountry had experienced significant inflation during1977. In such a case, a measure of the average of GDP in1976 and 1977 was used. Second, in estimating per capitaincome, some obvious instances occurred where the useof a clearly overvalued nominal exchange rate yieldedper capita income estimates that did not accuratelyreflect the relative income in a given country. As theIBRD World Tables also give estimates of per capitaincome for 1977, where these proved significantly differ-ent from the estimates derived from strict use of thenominal exchange rate, the IBRD estimates were used.
Third, the disaggregated public expenditure data inthe GFS Yearbook relate to the consolidated centralgovernment accounts. In some countries the role of pro-vincial and local governments is quite prominent, par-ticularly in the provision of certain government services,notably education. Inclusion of central governmentspending alone would yield an excessively understatedpicture of the expenditure policies of such countries. In arecent study, the Organization for Economic Coopera-tion and Development (OECD) provided data on theshare of total general government expenditure in GDPby functional categories for 1973-75. These shares havebeen used instead of the data in the GFS Yearbook forthe following countries: Australia, the Federal Republicof Germany (hereinafter referred to as Germany), Can-
ada, the United States, and Japan. On an economicclassification, some data on the general governmentexpenditure of these countries are available from theOECD.7 Other important countries (for example, India,Nigeria, and Brazil) were omitted because no compara-ble data were available.
Fourth, for some countries, the GFS Yearbook classi-fication of expenditure obscures the ultimate intent ofthe expenditure. For example, block grants to localitiesin the United Kingdom are legally not earmarked for anyparticular sector and thus are included in the GFS Year-book under "other expenditure." The OECD statisticsindicate that much of this expenditure is, in fact, directedtoward education, community services, roads, and hous-ing.8 Similarly, it is often difficult to distinguish expendi-ture on health from expenditure on social security (as inCosta Rica). When such problems are obviously distor-tive, an attempt has been made to reclassify expenditurein the appropriate functional expenditure categories byusing country or OECD sources of information. In spec-ifying the model, one equation has also been estimatedto predict the sum of health and social security expendi-ture in order to capture any obvious example ofmisclassification.
Finally, all the equations were estimated by using theleast-squares method. Multicollinearity was tested inevery case and variables exhibiting major multicollinear-ity were rejected. In specifying the equations, multiplica-tive dummies were used to test whether there might bediscontinuities in the effects of individual independentvariables according to per capita income. Alternativeamounts of per capita income were tested as the break-point for such discontinuities, and it was observed that,where significant at all, a per capita income of US$1,750seemed to yield the lowest sum of squared residuals forthe equations. In general, such multiplicative dummiesappeared statistically significant only in the equationsexplaining the functional expenditure shares.
6International Bank for Reconstruction and Development (IBRD),World Tables, 1980 (Baltimore, The Johns Hopkins University Press,1980).
7Organization for Economic Cooperation and Development,National Accounts of OECD Countries, 1960-78, Vol. 2 (Paris, 1980).
8Organization for Economic Cooperation and Development, PublicExpenditure Trends (Paris, 1978).
8

III Determinants of Shares in Gross Domestic Product ofFunctional Expenditure Categories
Introduction
This section discusses the specification of the equa-tions to predict the shares in GDP of each category offunctional expenditure. The econometric results appearin Table 3. Table 1 shows the value of the IEC index.Table 4 ranks the countries by the value of their IECindex; a low ranking indicates a relatively low IECindex—namely, a low expenditure share relative to whatwould have been predicted for the country.
General Public Services
This functional category covers financial administra-tion, external affairs (including international aid), plan-ning, statistics, and other aspects of general administra-tion. It also covers justice, police, public order, andsafety. A believer in "Wagner's" law9 might expect thatthe share in GDP of such expenditure would rise withper capita income; in fact, no statistically significantrelationship was found. The only variable significant atthe 1 per cent level was the share in GDP of total public
-expenditure; thus, the larger the share of government, ingeneral, the larger would be the general expenses of run-ning government. At the same time, there is some evi-dence of economies of scale in the operation of thegovernment and in the provision of judicial services; asthe public sector grows, these costs do decline slightly asa proportion of total expenditure. The elasticity of pub-lic administration expenditure was found to be approx-imately 0.88.
The next most significant variable is the percentage ofpopulation in urban areas; apparently, as countriesbecome more urbanized, the share in total output ofgeneral public administration expenditure decreases,suggesting some economies of scale. On the other hand,the larger the proportionate size of the young population(14 years old and younger) the higher this share is likelyto be. This emphasis on the young population might bethought to be simply a proxy for nondevelopment(developing countries tend to have much larger propor-
9 A. T. Peacock and J. Wiseman, The Growth of Public Expenditurein the United Kingdom (London, Oxford University Press, 1961).
tions of their population in the younger age groups).However, the insignificance of per capita income asestimated in the relationship suggests this is not so andthat the size of the younger population must be taken asa significant variable in its own right.
Across countries there tends to be a low standarddeviation in the value of the IEC index for this expendi-ture category. Countries such as Argentina, The Gam-bia, Morocco, Suriname, and Uruguay seem to spendmore than might be expected on general administrationas a share of GDP (for example, IEC indices are signifi-cantly higher than 100), while the United Kingdom andAustralia appear to spend as much as might be pre-dicted. Mexico, the United States and Yugoslavia haveIEC indices much lower than 100. (Does this suggest thatthere is less "fat" in the operation of the U.S. Govern-ment than is currently argued?) There is some tendencyfor Latin American, Asian, and industrial countries tospend less than would be expected on general publicservices and for African countries to spend more thanwould be expected.
Defense
This category includes all defense expenditures exceptthose for military pensions, which are included undersocial security and welfare (see p. 15). Again, it mighthave been expected that the share of defense expenditurein GDP would be closely associated with per capitaincome but the relationship does not prove significant.The same variables as those influencing general adminis-trative expenses proved to be significant for defense. Themost striking difference is that, whereas urbanizationhad a negative impact on the share in GDP of generaladministrative expenditure, for defense there was a posi-tive relationship. Defense expenditure, according tothese relationships, could be expected to be higher in amore urbanized country, with a larger proportion ofchildren of 14 years and younger and a larger publicsector (net of defense spending).
While numerous influences not tested in this study(and, indeed, impossible to test) must influence defensespending, and while the low correlation coefficient sug-gests a large amount of "unexplained" defense expendi-
9

III • DETERMINANTS OF SHARES IN GDP OF FUNCTIONAL EXPENDITURE CATEGORIES
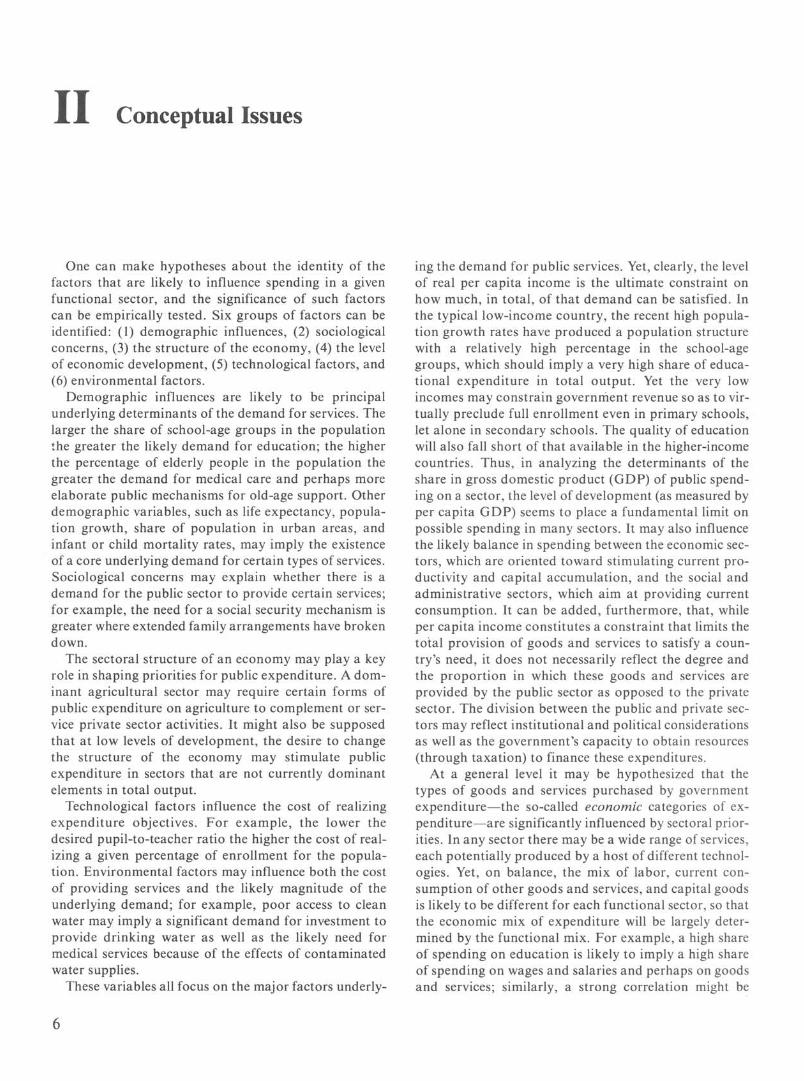
Table 3. Determinants of Functional Expenditure Categories as Share of Gross Domestic Product
(All expenditure categories as a percentage share of GDP)
Constant -0.59 -7.00** 3.18* 1.31** -4.76** -3.89** 0.28 0.47 0.83* 0.66 4.80**(-0.30) (-2.27) (1.85) (3.48) (-3.93) (-2.93) (1.45) (1.17) (1.94) (1.61) (4.49)
Income per capita(PCI) (in thousandsof dollars) 0.01 — 0.25* 0.41* 0.09 -0.03 0.01
(0.13) (-0.01) (1.78) (2.60) (1.53) (-0.58) (-1.40)Income per capita,
countries withPCI < $1,750(in thousands ofU.S. dollars) -0.04 2.11** 0.82**
(-0.32) (2.92) (2.67)Income per capita,
countries withPCI > $1,750(in thousands ofU.S. dollars) 0.20** -0.01**
(2.65) (2.68)Percentage of popu-
lation, aged 14 andunder 0.07* 0.16** 0.03
(1.82) (2.71) (0.81)Percentage of popu-
lation, over age 65 0.12** 0.84** 1.02**(2.28) (7.26) (8.01)
Infant mortalityrate 0.07 0.06
(1.71) (1.37)Share of labor
force inagriculture 0.02**
(3.80)Share of labor
force inindustry 0.13** 0.14**
(3.12) (2.87)Share of popu-
lation inurban areas -0.03** 0.05** -0.03**
(-2.28) (2.25) (-2.28)In countrieswith PCI < $1,750
(-0.48)In countrieswith PCI > $1,750 0.02**
(2.11)Enrollment rate,
primary schools 0.01*(1.56)
Enrollment rate,secondary schools,countries withPCI < $1,750 -0.02
(-1.39)Enrollment rate,
secondary schools,countries withPCI > $1,750 0.02**
(2.09)Pupil-teacher ratio,
primary schools -0.04*(-1.88)
Access to cleanwater supplies
In countries withPCI < $1,750 — 0.02**
(-0.20) (3.20)In countries with
PCI > $1,750 0.02** -0.01**(2.97) (2.78)
Mining, Electri-Health, Manu- city,
General Social Social Housing Agri- factur- Natural Transpor-Public Security Security, and culture, ing, and Gas, and tation andSer- and and Community Forestry, Con- Water Communi-vices Defense Education Health Welfare Welfare Amenities Fisheries struction Supply cations
10
Education
Table 3 (concluded). Determinants of Functional Expenditure Categories as Share of Gross Domestic Product
(All expenditure categories as a percentage share of GDP)
GeneralPublic
Ser-vices Defense Education
SocialSecurity
andWelfare
Health,Social
Security,and
Welfare
Housingand
CommunityAmenities
Agri-culture,Forestry,Fisheries
Mining,Manu-factur-
ing, andCon-
struction
Electri-city,
NaturalGas, and
WaterSupply
Transpor-tation andCommuni-
cations
Population perhospital bed
In countries withPCI < $ 1,750
In countries withPCI > $1,750
Population growth ratein urban areas
In countries withPCI < $1,750
In countries withPCI > $1,750
Share of total publicexpenditure in GDP
Share of total publicexpenditure (net ofdefense)
Share of manufacturingsector in GDP
In countries withPCI < $1,750
In countries withPCI > $1,750
Share of other manu-factured goods andfuel exports intotal exports
Share of agriculturein GDP
R2
(N)
-0.26*(-1.84)
-2.50*(-1.76)
0.12**(5.62)
0.10**(2.48)
-0.04*(-1.87)
0.32(91)
0.15(84)
0.28(90)
0.62(91)
0.80(91)
0.84(92)
0.21(86)
0.17(90)
0.02**(3.04)
0.16(72)
(0.07)
0.48**(5.22)
-0.05**(-2.75)
*(1.80)
0.44(66)
0.19**(2.33)
-0.07**(-2.24)
-0.01*(1.71)
-0.08**(-3.76)
0.23(69)
* Significant at a 10 per cent level.** Significant at a 5 per cent level.t-statistics are in parentheses.
ture, the significant variables mentioned above are inter-esting.10 It seems reasonable to consider that urbanizedsocieties must spend more on defense and are willing todo so. Likewise, it is reasonable to expect that manyauthorities who are prepared to run a large public sectorare also likely to accept the idea that a substantial part ofthe national budget should be spent on defense.
The country ranking confirms the expected evalua-tions. Sweden, the Philippines, Kenya, Tanzania, Ger-
10Concentration on only one functional expenditure for a singlecountry, e.g., defense in the United Kingdom, can yield more subtleand much better estimated equations. See R. P. Smith, "The Demandfor Military Expenditure," Economic Journal, Vol. 90, No. 360(December 1980), pp. 811-20.
many, and the United Kingdom were spending roughlywhat could be expected in 1977 on defense and Mauri-tius, Barbados, and Mexico were spending much lessthan might be expected. The high figures for the UnitedStates, Pakistan, Portugal, Iran, Korea, Israel, theYemen Arab Republic, and Chad reflect these individualcountries' preocupation with defense in the 1970s.
Education
It is to be expected that government expenditure oneducation as a percentage of GDP would be moststrongly correlated with the proportion of the popula-tion in the age group affected by schooling. The largest
11
Health

III • DETERMINANTS OF SHARES IN GDP OF FUNCTIONAL EXPENDITURE CATEGORIES
Table 4. Ranking of Countries by International Expenditure Comparison Index, 1977: Functional Expenditure
Social Health, Housing Mining, Electricity, Transpor-Year General Security Social and Agriculture, Manufac- Natural tation andof Public and Security, Community Forestry, turing, and Gas, and Communi-
Country Data Services Defense Education Health Welfare Welfare Amenities and Fisheries Construction Water cations
Argentina 1977 91 55 3 1 26 12 22 5 69 43 40Australia 1 48 37 71 55 33 35 25 30 ... ... 24Austria 1977 73 26 19 48 43 44 65 28 40 58* 54Bahamas 1976 57 3 50 62 18 32 7 20 ... ... ... ...Bahrain 1977 ... ... ... 60 ... ... ... ... 20 ... ...
Bangladesh 1977 9 4 10 50 81 41 ... 45 11 3 69Barbados 1977 63 2 78 40 29 31 73 76 ... 46 55Belgium 1977 24 36 72 38 54 52 41 13 54 58* 60Bolivia 1977 43 45 25 27 6 8 27 8 21 26 26Botswana 1977 65 24 85 78 5 53 82 71 ... 45 ...
Burma 1977 39 75 16 20 21 13 76 72 28 ... 27Burundi 1977 31 66 67 ... 72 54 ... 57 ... ... ...Cameroon 1976 84 46 26 24 76 65 2 34 62 22 51Canada 1 78 34 55 67 51 57 62 65 ... ... 66Chad 1977 49 82 58 10 9 6 13 64 16 2 9
Chile 1977 77 40 52 57 75 82 63 31 8 8 21Costa Rica 1977 15 8 44 9 71 66 21 16 9 7 58Cyprus 1977 74 65 15 25 31 20 77 40 19 27 4Denmark 1976 64 42 18 49 46 45 35 66 45 58* 6Dominican Rep. 1977 30 18 8 44 60 50 81 52 60 32 13
Ecuador 1977 20 53 32 23 2 7 ... 37 ... 15 ...Egypt 1977 27 33 90 52 70 79 85 68 22 36 10El Salvador 1977 38 9 30 43 44 42 46 33 44 14 42Ethiopia 1977 16 44 27 66 74 69 15 43 27 25 57Fiji 1977 79 7 60 75 80 76 48 58 42 34 28
Finland 1977 37 43 68 63 36 40 42 86 59 20 52France 1977 36 41 56 64 55 59 52 21 53 19 3Gambia, The 1977 87 ... 45 88 23 56 32 84 ... 44 ...Germany, Fed. Rep. 1 25 57 39 59 45 47 51 23 ... ... 63Ghana 1977 35 ... 73 45 35 39 ... 49 38 4 36
Greece 1977 44 80 20 30 41 33 40 62 36 12 37Grenada 1977 2 63 51 86 19 38 30 48 68 ... ...Guatemala 1977 17 29 ... 17 34 22 24 12 ... ... ...Honduras 1976 69 28 38 85 49 78 53 11 29 ... ...Iceland 1977 68 ... 22 71 22 24 57 88 ... ... ...
Iran 1977 6 72 28 61 20 14 75 42 44 47 22Ireland 1977 ... ... 6 ... 32 16 9 ... ... ... ... ...Israel 1977 3 81 69 35 65 67 31 22 39 23 7Italy 1977 56 19 54 76 48 58 44 54 69 ... 64Jamaica 1977 33 6 70 74 11 17 68 80 23 28 30
Japan 1 ... ... 33 34 23 18 64 82 18 ... 31Jordan 1975 60 78 88 87 64 75 54 81 69 56 67Kenya 1977 34 48 49 65 82* 68 19 47 35 52 46Korea 1977 26 76 37 5 15 4 12 25 13 24 5Kuwait 1977 50 49 14 32 14 11 80 1 63 37 ...
Lesotho 1974 81 ... 79 39 50 49 84 79 ... 29 ...Liberia 1977 85 16 66 77 17 46 58 55 12 6 44Luxembourg 1977 52 12 23 2 66 63 29 53 ... 9 ...Madagascar 1973 55 14 48 51 82* 87 10 60 25 11 35Malawi 1977 41 31 35 21 56 27 11 59 10 17 23
Malaysia 1977 54 61 77 72 28 51 5 32 2 10 15Mali 1976 59 67 75 46 77 73 1 29 55 18 8Malta 1977 53 13 41 37 59 60 66 70 61 57 59Mauritius 1977 72 1 63 83 69 80 55 90 17 31 11Mexico 1977 11 5 29 15 73 71 ... 75 ... 58 19
Morocco 1977 88 60 86 47 79 81 69 ... ... ... ...Nepal 1977 10 52 4 91 82 * 43 14 44 ... 53 ...Netherlands 1977 76 39 82 70 67 77 59 ... ... ... ...New Zealand 1977 32 15 57 69 52 62 18 73 ... ... ...Nicaragua 1976 22 22 17 11 82 86 79 35 30 13 ...
Niger 1977 75 23 84 53 82 91 4 27 49 30 48Norway 1977 21 59 65 42 40 34 83 85 51 16 50Oman 1974 ... ... ... 90 ... ... ... 10 57 ... ...
1212

Education
* Asterisk denotes that this particular ranking should be treated with care as actual expenditures were extremely small and predicted expendituresnegative—see text for explanation.
1 1973-75.
groups attending school fall in the age group 14 yearsand under, followed by secondary school and universitypopulations. Unfortunately, the population breakdownavailable for the large sample of countries enabled onlythe under 15 age group to be included; over 15 years, thepopulation span included the active workers through age65, negating any explanatory power of the secondaryschool and university groups.
An alternative measure of the effective demand foreducation would be the enrollment rates of the primaryand secondary school age populations, respectively. Thehigher the enrollment rate is, ceteris paribus, the higherthe expenditure share on education should be. Techno-logical factors also influence the level of spending oneducation. The higher the pupil-teacher ratio is at theprimary or secondary school level the lower would be theexpected share of education spending in total output.
Finally, it might be expected that the costs of educating awidely scattered agricultural population might be higherthan the costs of educating an urban, highly concen-trated school population, although this factor clearlydepends on the costs of urban school development, thequality of rural education programs versus urban educa-tion programs, and the costs of urban universities. Ex-penditure on education might also be expected to in-crease with per capita income, but this influence couldweaken in countries with high per capita income, wherethe private sector might take over some of the govern-ment's responsibility for expenditure on education.
Per capita income proved to be a highly significantdeterminant of the share in GDP of public expenditureon education, mainly at incomes below US$1,750. Incountries with a low per capita income, it is evident thata greater need exists for expenditure on education, but a
13
Table 4 (concluded). Ranking of Countries by International Expenditure Comparison Index, 1977:Functional Expenditure
Social Health, Housing Mining, Electricity, Transpor-Year General Security Social a nd Agriculture, Manufac- Natural tation and
of Public and Security, Community Forestry, turing, and Gas, and Communi-Country Data Services Defense Education Health Welfare Welfare Amenities and Fisheries Construction Water cations
Pakistan 1977 8 70 1 4 13 2 71 14 37 40 49Panama 1977 70 . . . 61 89 78 88 33 41 48 38 32
Papua New Guinea 1977 58 21 76 81 7 74 74 61 50 39 61Paraguay 1977 28 27 2 3 63 25 17 9 15 . . . 56Peru 1977 45 32 59 33 1 9 45 63 . . . 50 ...Philippines 1976 40 54 11 14 53 19 20 51 58 58 65Portugal 1977 71 77 21 41 39 30 49 24 46 51 ...
Rwanda 1977 23 62 13 12 82 92 6 19 34 33 68Senegal 1975 62 35 42 26 27 23 36 18 1 21 1Sierra Leone 1978 67 30 47 56 12 21 34 26 14 42 16Singapore 1977 86 64 40 13 3 5 61 2 6 1 ... 12Somalia 1977 80 71 87 82 82 90 86 83 64 . . . 18
Spain 1977 13 20 9 22 42 36 28 36 33 5 14Sri Lanka 1977 14 11 46 36 82 89 26 56 26 ...Sudan 1977 4 50 5 6 25 10 3 77 7 . . . 38Suriname 1976 90 . . . 62 . . . 68 85 60 38 47 . . . 33Swaziland 1977 66 25 74 58 8 48 72 74 . . . 58 ...
Sweden 1977 46 47 81 68 58 61 50 46 65 58 20Syrian Arab Rep. 1977 1 74 24 7 57 37 70 67 69 54 45Tanzania 1977 47 58 53 73 82 84 47 69 66 49 34Thailand 1977 7 69 36 19 82 83 43 39 24 58 47Tunisia 1977 19 10 89 79 61 70 38 78 41 . . . 43
Turkey 1977 29 51 43 8 10 3 37 17 67 55 62United Arab Emirates 1977 83 68 . . . . . . . . . . . . 23 . . . 3 ... ...United Kingdom 1977 51 56 80 54 30 29 78 50 52 58* 41United States 1 12 79 34 31 38 26 39 6 . . . . . . 2Upper Volta 1973 42 73 31 29 16 15 16 3 31 . . . 17
Uruguay 1978 89 38 12 16 62 55 8 15 32 41 25Venezuela 1977 18 17 64 28 37 28 67 89 56 48 39Yemen Arab Rep. 1977 61 82 7 18 . . . 1 . . . 4 5 . . . 29Yugoslavia 1977 5 82 . . . 80 47 64 . . . 7 ... ... ...Zambia 1977 82 . . . 83 84 4 72 56 87 43 35 53
Number of countriesin column 91 84 90 91 91 92 86 90 72 66 69
III • DETERMINANTS OF SHARES IN GDP OF FUNCTIONAL EXPENDITURE CATEGORIES
breaking point is reached when per capita income risesto US$1,750. Further increases in per capita income tendnot to lead to as great an increase in government expen-diture on education as for incomes below US$1,750,probably because expenditure on education by the pri-vate sector increases to take over part of the burden orbecause "basic" education needs are satisfied and otherpriorities (economic and social) take precedence.
Another variable that was highly significant was theenrollment rate in secondary schools for those countrieswhere per capita income was over US$1,750. A positivecorrelation between the primary school enrollment rateand the share of educational expenditure is also evidentfor these countries. This tends to bear out the observa-tion that expenditure on education by government isbelieved to be important for basic primary education forlow-income countries but that this attitude changeswhen per capita income is over US$1,750 and moreimportance is attached to secondary school enrollment.
Although government expenditure on education ispositively correlated with the proportion of the popula-tion in the primary school age bracket, the relationship isnot statistically significant. In effect, a large share inGDP of expenditure on education will not dependsimply on a large number of potential students. It isparticularly interesting that government expenditure oneducation is negatively correlated with the pupil-teacherratio and with the percentage of the population in urbancenters (significant at the 5 per cent level). However, thesignificant negative correlation with urbanization sug-gests a stronger explanatory power than might be ex-pected for the hypothesis that it will cost the governmentmore to educate a rural population than an urban one.
It is interesting to note that the spread between pre-dicted and observed results for education expenditure isthe smallest of all the functional categories, suggesting agreater unanimity and consensus among countries inrelation to government expenditure on education. TheGovernments of the United Kingdom and the Nether-lands appear to spend about 50 per cent more thanexpected, while that of the United States spends about15 per cent less than expected. These results reflect themajor differences between the three countries in theirdegree of state involvement in the education sector, no-tably universities; the United States relies far more onthe private sector at this level of education (Table 1).Many Middle Eastern and North African countries seemto spend more than might be expected on education butthese countries can be contrasted with their neighbors,Sudan and the Yemen Arab Republic. On balance, twothirds of the African countries spend more than wouldbe predicted; two thirds of the Latin American countriesand all of the European developing countries (Turkey,Cyprus, Greece, Malta, and Portugal) spend less thanexpected (i.e., have an IEC index of less than 100).
Health
This category includes government expenditure ongeneral administration, regulation, and research forhealth; on hospitals, medical and dental centers, andclinics; on population control, immunization, and inocu-lation; and on blood donor services. It also covers thereimbursement for services of individual doctors, den-tists, and paramedics under insurance schemes for indi-vidual health services outside hospitals and clinics. Itexcludes expenditures that would fall under social secur-ity and welfare (see p. 15).
The share in GDP of government expenditure onhealth might be expected to be positively correlated withfactors suggesting a high basic demand for medical care,such as high infant mortality rates,11 a large populationunder 15 and over 65, a low life expectancy rate, a highbirth and population growth rate, and poor access toclean water supplies. The higher the quality of care (forwhich high ratios of hospital beds, nurses, and doctorsper unit of population are used as proxies) the higherwould be medical expenditure. While it would also bedesirable to capture the effect of any unusual country-specific disease (such as schistosomiasis, onchocerciasis,or trypanosomiasis in some of the African countries), itwas impossible to collect sufficient data in this study fora significant sample of countries to test any such rela-tionship. Finally, medical care could be expected toincrease as per capita income increased.
In fact, few of these variables were significant and over60 per cent of government expenditure on health wasexplained by the proportion of the population aged 65and over (significant at the 2 1/2 per cent level) and bythe ratio of population to hospital beds. Access to cleanwater supplies was very significant where per capitaincome exceeded US$1,750. In principle, one mightexpect poor access to clean water supplies to be asso-ciated with ill health and, thus, with a greater demandfor medical care. The reverse relationship in the resultssuggests that access to clean water supplies may be aproxy for the overall level of economic development.Indeed, there is some correlation between the index ofclean water and per capita income (R = 0.75 in the sam-ple as a whole, and R = 0.86 for countries with per capitaincome in excess of US$1,750). This possible multicollin-earity may also explain why per capita income proves tobe an insignificant explanatory variable.
It is interesting to note that, while the proportion ofpopulation over 65 is a strongly significant factor, thevariables relating to the portion of the population under15 years, the infant mortality rate, and the birth ratewere all statistically insignificant (results not shown).
11A low infant mortality rate could, of course, reflect the effective-ness of high public health expenditures.
14

Health, Social Security, and Welfare Combined
Again, the obvious presence of a potential demand for asector's services does not necessarily indicate that theservices will be forthcoming. There is a statistically sig-nificant but weak positive quantitative relationship be-tween the per capita ratio of hospital beds and the shareof health expenditure at low incomes; the quantitativerelationship becomes far stronger at per capita incomeover US$1,750, probably reflecting a greater preoccupa-tion with the quality of medical care at higher incomes.
As with education, there is also a fairly tight bunchingof IEC index values in the health sector, with a lowstandard deviation for the index. In terms of countryrankings, most of the industrial European countriesappear to spend more on health than might be expected,given their population structures, their water supplies,and their provision of hospital beds. However, it isnoteworthy that government expenditure on health inthe United States and Japan is some 25-30 per cent lessthan might be expected and that the developing coun-tries in Europe have IEC indices less than 100. The U.S.and Japanese results again arise from the prominence ofthe private sector in the provision of medical care inthese countries. As was true for education, two thirds ofthe Latin American countries spend less on health thanwould be expected; however, this may reflect only aproblem in statistical classification. The indices of somecountries with strikingly low IEC indices for health—such as Luxembourg, Argentina, Costa Rica, Paraguay,the Syrian Arab Republic, Sudan, and Nicaragua—maybe misleading in their implications if account is taken ofthe share of their expenditure on social security (seebelow).
Social Security and Welfare
This category includes expenditure on social security;sickness, old age, and disability payments; and paymentsunder contributory and noncontributory schemes; andunderfunded and unfunded pension and disability plansfor government employees (civil or military). It alsoincludes unemployment, family, maternity, and childallowances, as well as any other public assistance. Wel-fare services include care of the elderly, disabled, men-tally defective, and children.
The variables selected explain about 80 per cent of theshare in GDP of government expenditure on socialsecurity and welfare. Government spending on this func-tion would be expected to be strongly associated with thenumber of elderly people in the total population; indeed,this variable is significant at the 1 per cent level. Theother variable that is strongly correlated with socialsecurity and welfare expenditure is the proportion of thelabor force in industry; as the labor force in manufactur-ing expands, so does government responsibility for
unemployment pay and for sickness and injury benefits.It might also be supposed that, as per capita incomerises, private sector insurance might assume moreresponsibility for social security and welfare. Thishypothesis is borne out in the results. Similarly, it couldbe expected that the proportion of population under 15,life expectancy, and the various medical variables mightbe significant; in fact, none of these was found to beparticularly significant and only the infant mortality rateis included as an explanatory variable.
The German Government appears to spend on healthabout what would be expected, but, interestingly, theUnited Kingdom, often considered to be a "welfarestate," spends some 34 per cent less than would beexpected. While the U.K. Government is involved in theprovision of many social or welfare services, it spendsless on these than many other countries, in terms of thelevel of benefits per recipient and in the quality of ser-vices provided. Nicaragua and Tanzania appear to spendsubstantially more than would be expected, given thestructure of their population and their per capita income.Most OECD member countries cluster around 90-120per cent of expected government expenditure on socialsecurity and welfare.
Health, Social Security, and Welfare Combined
These categories were combined to test whether theexplanatory power of the variables improved because ofoverlap and possibly poor distinction between the cate-gories of "health" and "social security" expenditure. Asnoted above, some countries, particularly in Latin Amer-ica, have difficulty in accurately distinguishing items ofhealth and social security expenditure; this may have ledto the extremely high IEC indices for social security andthe extremely low indices for health, which can be seenin Table 5. The index for the combined functional cate-gories may be more representative of their expenditurepatterns.
The proportion of the population over 65 and percapita income were both explanatory variables signifi-cant at the 1 per cent level. The percentage of the laborforce in industry was also significant at the 5 per centlevel. As the population over 65 increased, as the percen-tage of the labor force in manufacturing expanded, asincome per capita rose, and as the infant mortality rateincreased, expenditure on health and social securitycould be expected to be higher.
Again, expenditures on health, social security, andwelfare by the Governments of Ireland, Japan, theUnited States, the United Kingdom, Norway, and Aus-tralia appear to be lower than would be expected on thebasis of their population and per capita income, whereascorresponding expenditure by Germany appears to be
15

III • DETERMINANTS OF SHARES IN GDP OF FUNCTIONAL EXPENDITURE CATEGORIES
Table 5. IEC Indices for Health and Social Security in Selected Countries Where Medical and Social Security SystemsPartly Overlap
Country
ParaguaySyrian Arab RepublicUruguayCosta RicaNicaragua
approximately what would be expected. The expendi-tures of the Governments of France, Sweden, Italy, NewZealand, Mexico, Israel, Egypt, and the Netherlands allappear to be higher than expected.
Housing
Government expenditure in this area covers the provi-sion of housing and of housing payments tied to theincome level of the recipient; it also includes rent subsi-dies, some home purchase subsidies (exclusive of taxexpenditures), and any administrative costs.
As expected, the most significant explanatory varia-bles were those relating to urbanization and per capitaincome (significant at the 5 per cent and 1 per cent levels,respectively). However, the importance of these varia-bles depends on the amount of per capita income. Nomatter how urbanized the country is, the share in GDPof government expenditure on housing increases as percapita income rises to US$1,750. Once this figure isreached, ceteris paribus, an increase in per capita incomealone does not trigger further public sector housinginvolvement. (In some cases, this may reflect the increas-ing involvement of the private sector's constructionindustry.) Once per capita income rises above US$1,750,the degree of government involvement then becomessensitive to the extent of urbanization. Increasing urban-ization triggers further increases in the share in GDP ofgovernment housing expenditure.
This seems to indicate that in countries with a low percapita income, the government cannot enter into thebudgetary expense of open-ended subsidies for housingeven in large urban areas. The authorities are much morelikely to attempt to control this element by controls onrents and licenses to build. However, as per capitaincome rises and more urbanization occurs, the pressurefor public housing increases and government expendi-ture on publicly subsidized housing becomes stronglyidentified with urbanization.
The standard deviation of the IEC index is extremelyhigh for this functional expenditure category. Uruguay'sspending on housing is 92 per cent less than expected,whereas Somalia spends far more than expected (2 per
cent of GDP rather than the predicted 0.25 per cent). Itmay be noted that the United States spends 36 per centless than expected, France and Germany have IEC in-dices closer to unity, and the United Kingdom is farabove (two and a half times as much) what might bepredicted. In general, African, Latin American, andindustrial countries appear to spend less than might beexpected.
Agriculture
This covers the provision of agricultural services andfinancial support programs for farm prices and incomesthrough market intervention subsidies and price sup-ports, and forestry and inland and ocean fishing pro-grams, as well as research in all the sectors just mentioned.
Government expenditure on agriculture might beexpected to be a function of the importance of the sectorin the economy, as proxied by its share of the laborforce, and might also be expected to be dependent on thetype of land associated with different amounts of rain-fall. Unfortunately, insufficient information for a numberof countries makes it impossible to include the qualityand extent of arable land as an explanatory variable.However, expenditure on agriculture might also beexpected to have some functional relationship to agricul-tural exports or, indeed, a negative relationship to non-food agricultural exports as a percentage of total exports.Tests were made in the study to include such variables,but it was found that the only significant variables werethe percentage of the labor force employed in agriculture(significant at the 1 per cent level) and per capita income,both with a positive impact on the share of government.This is not surprising. These forces, however, work inopposite directions for some countries. For example,many European countries have a high per capita incomethat suggests increased spending by government on agri-culture, but this is offset by the rapidly shrinking laborforce in agriculture, which is a more powerful factor inreducing the impetus for governments to spend on agri-culture rather than on other competing claims.
The ranking of countries by their government expen-diture on agriculture confirms this outline. Some of the
16
Combined HealthHealth Social Security and Social Security
19.8 139.9 75.329.7 122.1 86.654.5 139.4 113.542.7 210.0 135.146.3 400.0 212.0

Economic Services
countries with IEC indices close to 100—the UnitedKingdom, which spends 95 per cent of what might beexpected on agriculture, and Italy, which spends exactlywhat is expected—have higher per capita incomes andsmaller contracting agricultural labor forces, where thesetwo offsetting circumstances produce almost preciselythe expected expenditures.12 However, a country likeMauritius, which has a large agricultural labor force anda low per capita income, spends over three times morethan might be expected on agriculture, and indeed muchthe same is true of countries like Finland, Iceland,Japan, and Norway, all of which spend more than twiceas much as might be expected—probably to assist thefishing activities of these countries. It is interesting tonote that advanced countries that depend on agriculturefor a major contribution to their balance of payments(for example, Denmark and New Zealand) are wellabove the mean. It is equally striking, on the contrary,that governments such as those of the United States andArgentina spend so much less than expected.
In general, governments in African countries seem tospend as much or more than might be expected on agri-culture, Asian countries somewhat less, and Latin Amer-ican countries significantly less.
Economic Services: Mining, Manufacturing,and Construction
This functional category includes expenditure for thepromotion, regulation, research, subsidization, and otherassistance to the mining, natural resources, manufactur-ing, and nonhousing construction sectors. It also includesinvestment grants to these sectors.
Government contributions to mining and manufactur-ing are strongly correlated (significant at the 1 per centlevel) with the share of exports of other manufacturedgoods and fuel in total exports but negatively correlatedwith the percentage share in GDP of manufacturing.Again, it is interesting to note that per capita incomedoes not prove to be a significant determinant of theshare of such expenditure. Basically, as one wouldexpect, the more industrially developed the country isthe less likely it is to subsidize industry (under the limita-tions of the General Agreement on Tariffs and Trade andlimitations on export credit guarantees). At the sametime those countries committed to exporting manufac-tured products are likely to spend government revenueon attempting to help both mining and manufacturing.
12It should be noted that European Economic Community agricul-tural subsidies that do not move through the consolidated nationalgovernment budgets (for example, adjusted artificial agriculturalexchange rates) will not be included in these functional categories.
Out of a sample of 72 countries in all, only 24 actuallyspend more government money than might be predictedon subsidizing mining and manufacturing. What is, per-haps, most interesting is the number of highly industrial-ized countries that apparently spend more than might beexpected: Norway, 23 per cent; the United Kingdom, 31per cent; Belgium, 38 per cent; France, 35 per cent;Sweden, 140 per cent; and Italy, over 300 per cent more.On the whole, Asian, Latin American, and Africancountries spend less than might be expected on subsidiz-ing and supporting industry.
Economic Services: Electricity, Natural Gas,Steam, and Water
This category encompasses expenditure for the pro-motion, regulation, research, subsidization, and provi-sion of investment grants for production, transmission,and distribution of electricity, natural gas, or steam. Itdoes not include the mining of natural gas, which isclassified under mining. This category also includesexpenditure on the regulation, purification, and distribu-tion of clean water for general use (not for irrigation).
The most straightforward hypothesis is that govern-ment expenditure in this category will rise with per cap-ita income, the urbanization of society, the growth ofmanufacturing, and increased access to clean watersupplies. Interestingly, per capita income was negativelyand very weakly associated with expenditure on utilities,but significant variables at the 1 per cent level wereurban population growth, changes in the percentage ofGDP related to manufacturing, and access to cleanwater supplies.
Urban population growth was positively associatedwith this government expenditure, but only at per capitaincomes over US$1,750. On the other hand, the share inGDP of government expenditure on energy and waterdeclines as the role of the manufacturing sector increasesfor countries with a per capita income below US$1,750;for countries with incomes above this amount, the sharein GDP of manufacturing is no longer statisticallyimportant. This initial negative relationship appearscontrary to what would be expected, because increasedpublic expenditure on electricity, steam, and gas mightbe expected as manufacturing increases. One possibleexplanation is that as the manufacturing base of thecountry expands, the energy supply industry becomesmore profitable and the required transfers from govern-ment to these utilities on both current and capitalaccount become less. Presumably, industry generatessufficient income to compensate utilities commerciallyand to enable them to operate with smaller governmen-tal subsidies or with none at all. Similarly, in agricultur-ally oriented countries, the government is usually moreactively involved in providing water for rural households.
17

III • DETERMINANTS OF SHARES IN GDP OF FUNCTIONAL EXPENDITURE CATEGORIES
The index of access to clean water supplies has astrong positive explanatory power for countries with percapita income below US$1,750; for countries with ahigher per capita income, there is a negative relationshipbetween access to clean water supplies and the share inGDP of government expenditure on water and energy.This probably reflects two influences: first, that at verylow per capita income increased government expendi-ture leads to a rapid increase in access to clean water, butfor countries with more than US$1,750 per capitaincome, increases in government expenditure on thisoverall category might improve electricity, steam, andgas more than water supply; second, at higher per capitaincome, charges for water, electricity, and gas reduce thenecessary government subsidy for provision of theseservices.
The governments of countries like Egypt and Pakistanappear to be spending just about as much as would beexpected on these services, given their own particularcombinations of urbanization, manufacturing base, andpopulation access to water supply. However, it is strik-ing how governments such as those of Korea, Singapore,and Bangladesh appear to spend minimal amounts onthe provision of these services,13 whereas, as might beexpected, some developing countries in the process ofindustrialization appear to spend a great deal more on
13 Presumably, utilities in these countries charge rates that negate theneed for recourse to budget financing.
energy and water provision (for example, Mexico, thePhilippines, Thailand, and Turkey). Sweden certainlyseems to be in an anomalous position but its high expen-diture level probably reflects the large capital investmentassociated with its nuclear energy program.
Economic Services: Roads, Other Transport,and Communications
This category includes expenditure on roads, railways,other transportation, and communications. Governmentexpenditure on transport and communications could beexpected to increase as per capita income rises and asurbanization increases; it could also be expected to riseas exports increase (to transport both industrial andagricultural goods to railways and harbors). In fact, oneof the strongest associations of expenditure on these ser-vices (significant at the 5 per cent level) is with thegrowth in urban areas. Government expenditure ontransport and communications was weakly associatedwith the share in total exports of other manufacturedgoods and fuel and negatively with the shares in GDP ofmanufacturing and agriculture. While such expenditurecan be expected to rise with per capita GDP, the rela-tionship is statistically insignificant.
In terms of country ranking, Ghana and Tanzaniaseem to spend close to what might be expected, but Tur-key, Canada, and Italy spend approximately twice asmuch.
18

IV Determinants of Shares in Gross Domestic Product ofEconomic Expenditure Categories
Introduction
This section analyzes the determinants of the shares ofalternative economic categories of public expenditure asa share of GDP. The principal approach in specifyingthe equations is to assume that a specific technologicalbias exists in respect of the provision of different func-tional expenditure categories and that the relative impor-tance of these functional categories in a given countrywill determine the relative importance of the differenteconomic categories of expenditure used to realize theseobjectives.
Table 6 provides the basic econometric results used forcalculating the IEC indices; to maximize the size of thesample of countries, these equations use the aggregatefunctional category of expenditure on economic services.To obtain a clearer picture of the relative impact ofspending on the different economic services subsectors—
transport, electricity and water, agriculture, and miningand manufacturing—equations have been estimated byusing these more disaggregated variables (Table 7).
Table 2 provides the IEC index, and Table 8 rankscountries by the value of the IEC index (as Table 4 doesfor the functional expenditure shares).
Goods and Services
Wages and Salaries
This expenditure category covers all payments in cashbefore the deduction of withholding taxes, social secur-ity payments, or pension fund contributions. It does notinclude income in kind such as the value of food, cloth-ing, or lodging provided free of charge or below marketprices; such income in kind is included under "Goodsand Services Other Than Wages" (see p. 21).
Table 6. Determinants of Economic
All Dependent Variables as Share of GDP
Constant
General public services expenditure/GDP
Defense expenditure/GDP
Education expenditure/GDP
Health expenditure/GDP
Social security and welfare expenditure/GDP
Economic services expenditure/GDP
Income per capita (in thousands ofU.S. dollars)
Share of labor force in agriculture
R2
(N)
Categories of Expenditure as Share of
Current Expenditure
Goods and services
Wagesand
salaries(1)
5.69**(4.60)
0.74**(4.33)
0.22**(2.48)
-0.42**(-2.68)-0.04**
(-2.76)0.42(65)
Othergoods and
services(2)
1.31*(1.69)0.23**
(2.08)0.68**
(9.43)-0.44**
(-2.29)0.71**
(3.03)-0.07
(-1.08)0.26**
(2.96)
-0.15(-1.11)
0.67(61)
(l) + (2)(3)
3.57**(3.08)
0.63**(5.83)0.72**
(2.51)1.01**
(2.51)
0.46**(3.66)
-0.07(0.39)
0.62(78)
Interestpayments
(4)
0.72**(2.22)
0.18**(5.18)
0.33**(2.85)
-0.10*(-2.46)
0.03(0.51)
0.38(77)
Gross Domestic Product
Subsidiesand
transfers(5)
-2.07**(-2.31)
0.38**(3.10)0.76**
(3.75)
1.12**(12.64)
0.30*(1.90)
0.88(76)
(l) + (2)+ (4) + (5)
(6)
2.75**(2.56)
1.25**(10.43)
1.85**(6.24)
1.61**(3.82)1.09**
(10.60)
0.01(0.09)
0.91(80)
Capital Expenditure
Acquisitionof capital
assets(7)
-0.42(-0.48)
0.58**(4.47)
-0.27(-1.29)
-0.07(-0.93)
0.65**(6.67)
—(0.02)
0.64(72)
Capitaltransfers
(8)
2.16**(2.74)
-0.07(-1.37)
0.20**(3.13)
-0.18(-1.47)-0.03**
(-2.88)0.22(62)
(7)+ (8)(9)
-0.62(-0.81)
1.02**(2.97)0.98**
(10.01)
-0.19**(2.03)
0.65(83)
* Significant at a 10 per cent level.** Significant at a 5 per cent level.t-statistics are in parentheses.
19

IV • DETERMINANTS OF SHARES IN GDP OF ECONOMIC EXPENDITURE CATEGORIES
Table 7. Determinants of Economic Categories of Expenditure as Share of Gross Domestic Product Using Disaggre-gated Categories of Expenditure on Economic Services
All Dependent Variables as Share of GDP
Constant
General public services expenditure/ GDP
Defense expenditure/GDP
Education expenditure/GDP
Health expenditure/GDP
Social security expenditure/GDP
Housing and community amenities expenditure/GDP
Economic services expenditure
Agriculture, forestry, and fisheries expenditure/GDP
Manufacturing, mining, and construction expenditure/ GDP
Electricity, natural gas, and water expenditure/GDP
Transport and communications expenditure/GDP
Income per capita (in thousands of U.S. dollars)
Share of labor force in agriculture
R2
(N)* Significant at the 10 per cent level.** Significant at the 5 per cent level.t-statistics are in parentheses.
Wages andSalaries
(1)
6.26**(4.90)
0.80**(4.22)
0.28(1.01)0.68**
(2.13)
-0.51**(-2.73)
0.04**(-2.70)
0.44(59)
Goods andServices
(2)
3.61**(3.03)
0.73**(6.32)1.04**
(3.38)0.90**
(1.95)
0.70(1.58)1.0**
(1.96)
-0.25(-1.08)
0.66(66)
InterestPayments
(3)
0.87**(3.74)
0.25**(6.73)
-0.54**(-2.41)-0.38**
(-2.35)
0.16**(2.73)
0.53(56)
Acquisitionof capital
assets(4)
-0.22(-0.26)
0.55**(4.13)
-0.05(-0.24)
0.01(0.14)
1.82**(5.67)0.75**
(3.47)-0.22
(-1.03)
0.71(57)
Capital Expenditure
Capitaltransfers
(5)
2.11**(2.55)
-0.07(-1.26)
0.79**(3.59)1.57**
(4.36)
-0.50**(-2.44)-0.08
(-0.50)-0.03**
(-2.64)0.49(51)
Capitalexpenditure
(4)+ (5)
0.83(1.11)
0.79**(2.16)
0.49*(1.81)1.12*
(1.91)2.45**
(5.89)0.81**
(2.64)-0.32**
(-2.27)
0.82(58)
Wages and salaries are a substantial part of allgovernment payments, as is evident from the significantconstant term in the estimation. As might be expected,government expenditure on education is a significantexplanatory variable. Most countries find that teachers'salaries are an important, and often controversial, com-ponent of government expenditure.
Less obvious, but clearly important, is governmentexpenditure on economic services. When the latter isdisaggregated by sector, expenditure on mining andmanufacturing as a percentage of GDP prove to be sig-nificant at the 5 per cent level (Table 7). It seems proba-ble that the staffing costs of administering and monitor-ing the numerous public sector schemes associated withmining and manufacturing can impose significant costson government in terms of wages and salaries. The othereconomic subsectors—electricity, agriculture, water, andtransport—do not appear to be important determinantsof wage and salary expenditure. Equally interesting,expenditures on health and on public administration as ashare of GDP did not prove to be very significant influ-ences on the shares of wages and salaries.
It is interesting to note that per capita income is nega-tively related and significant. That is, as per capita
income rises, it can be expected that government wagesand salaries as a proportion of GDP will fall. Presum-ably, in developing countries government employeesform a significant part of the income earners and henceof GDP, but as the country develops, the relative impor-tance of direct government provision of services, andthus the government's role as an employer, falls andother types of expenditure (e.g., transfers) become moreimportant. Appendix Table 13 shows that generally theratio of government wage expenditure in total expendi-ture is relatively higher in poorer countries.14
In testing the impact of a country's economic structureon public wage and salary expenditure, the proportionof the labor force in agriculture proves to be negativelycorrelated with government expenditure on wages andsalaries (significant at the 5 per cent level) which is to beexpected. In effect, across countries at a given level ofdevelopment, those with a large labor-intensive agricul-
14 Many developing countries, particularly in Africa, use governmentemployment as a substitute for unemployment relief; as developmentoccurs, this form of hidden welfare payment affects government wagesand salaries less and less.
20
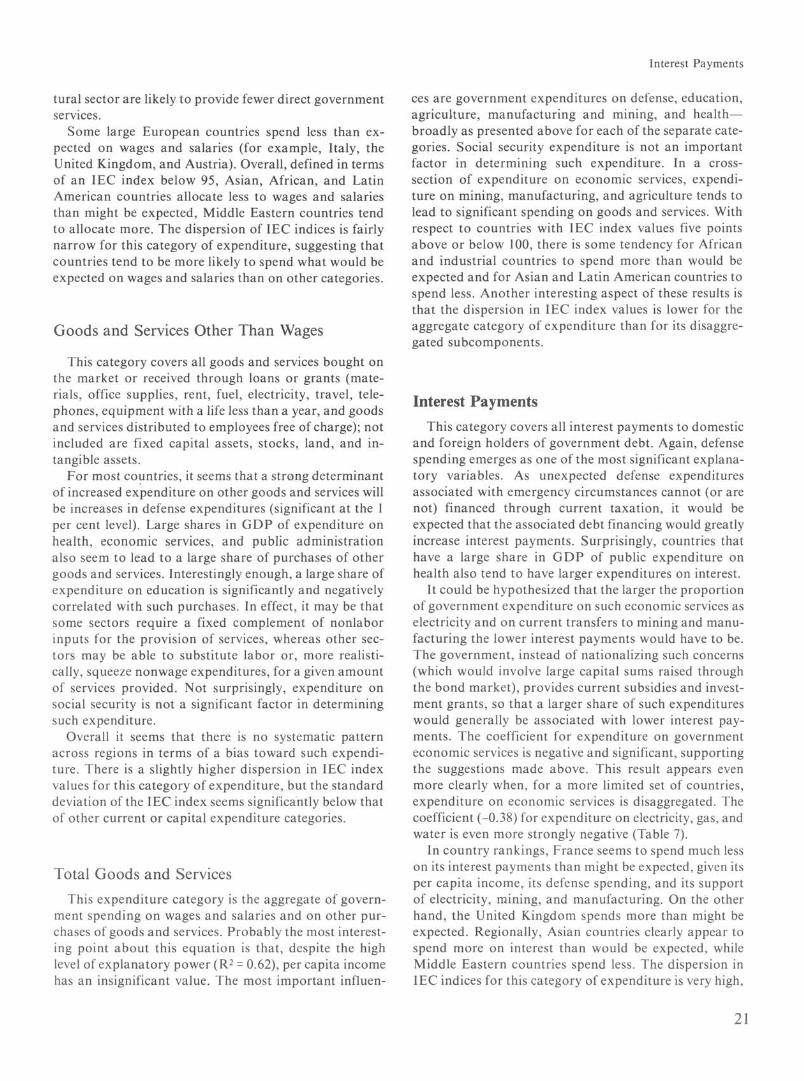
Interest Payments
tural sector are likely to provide fewer direct governmentservices.
Some large European countries spend less than ex-pected on wages and salaries (for example, Italy, theUnited Kingdom, and Austria). Overall, defined in termsof an IEC index below 95, Asian, African, and LatinAmerican countries allocate less to wages and salariesthan might be expected, Middle Eastern countries tendto allocate more. The dispersion of IEC indices is fairlynarrow for this category of expenditure, suggesting thatcountries tend to be more likely to spend what would beexpected on wages and salaries than on other categories.
Goods and Services Other Than Wages
This category covers all goods and services bought onthe market or received through loans or grants (mate-rials, office supplies, rent, fuel, electricity, travel, tele-phones, equipment with a life less than a year, and goodsand services distributed to employees free of charge); notincluded are fixed capital assets, stocks, land, and in-tangible assets.
For most countries, it seems that a strong determinantof increased expenditure on other goods and services willbe increases in defense expenditures (significant at the 1per cent level). Large shares in GDP of expenditure onhealth, economic services, and public administrationalso seem to lead to a large share of purchases of othergoods and services. Interestingly enough, a large share ofexpenditure on education is significantly and negativelycorrelated with such purchases. In effect, it may be thatsome sectors require a fixed complement of nonlaborinputs for the provision of services, whereas other sec-tors may be able to substitute labor or, more realisti-cally, squeeze nonwage expenditures, for a given amountof services provided. Not surprisingly, expenditure onsocial security is not a significant factor in determiningsuch expenditure.
Overall it seems that there is no systematic patternacross regions in terms of a bias toward such expendi-ture. There is a slightly higher dispersion in IEC indexvalues for this category of expenditure, but the standarddeviation of the IEC index seems significantly below thatof other current or capital expenditure categories.
Total Goods and ServicesThis expenditure category is the aggregate of govern-
ment spending on wages and salaries and on other pur-chases of goods and services. Probably the most interest-ing point about this equation is that, despite the highlevel of explanatory power (R2 = 0.62), per capita incomehas an insignificant value. The most important influen-
ces are government expenditures on defense, education,agriculture, manufacturing and mining, and health—broadly as presented above for each of the separate cate-gories. Social security expenditure is not an importantfactor in determining such expenditure. In a cross-section of expenditure on economic services, expendi-ture on mining, manufacturing, and agriculture tends tolead to significant spending on goods and services. Withrespect to countries with IEC index values five pointsabove or below 100, there is some tendency for Africanand industrial countries to spend more than would beexpected and for Asian and Latin American countries tospend less. Another interesting aspect of these results isthat the dispersion in IEC index values is lower for theaggregate category of expenditure than for its disaggre-gated subcomponents.
Interest Payments
This category covers all interest payments to domesticand foreign holders of government debt. Again, defensespending emerges as one of the most significant explana-tory variables. As unexpected defense expendituresassociated with emergency circumstances cannot (or arenot) financed through current taxation, it would beexpected that the associated debt financing would greatlyincrease interest payments. Surprisingly, countries thathave a large share in GDP of public expenditure onhealth also tend to have larger expenditures on interest.
It could be hypothesized that the larger the proportionof government expenditure on such economic services aselectricity and on current transfers to mining and manu-facturing the lower interest payments would have to be.The government, instead of nationalizing such concerns(which would involve large capital sums raised throughthe bond market), provides current subsidies and invest-ment grants, so that a larger share of such expenditureswould generally be associated with lower interest pay-ments. The coefficient for expenditure on governmenteconomic services is negative and significant, supportingthe suggestions made above. This result appears evenmore clearly when, for a more limited set of countries,expenditure on economic services is disaggregated. Thecoefficient (-0.38) for expenditure on electricity, gas, andwater is even more strongly negative (Table 7).
In country rankings, France seems to spend much lesson its interest payments than might be expected, given itsper capita income, its defense spending, and its supportof electricity, mining, and manufacturing. On the otherhand, the United Kingdom spends more than might beexpected. Regionally, Asian countries clearly appear tospend more on interest than would be expected, whileMiddle Eastern countries spend less. The dispersion inIEC indices for this category of expenditure is very high,
21

IV • DETERMINANTS OF SHARES IN GDP OF ECONOMIC EXPENDITURE CATEGORIES
Table 8. Ranking
Country
ArgentinaAustraliaAustriaBahamasBahrain
BarbadosBelgiumBoliviaBotswanaBurma
CameroonCanadaChadChileCosta Rica
CyprusDominican Rep.EgyptEl SalvadorEthiopia
FijiFinlandFranceGambia, TheGermany, Fed. Rep.
GreeceGrenadaGuatemalaHondurasIceland
IranIsraelItalyJamaicaJapan
JordanKenyaKoreaKuwaitLesotho
LiberiaLuxembourgMadagascarMalawiMalaysia
MaliMaltaMauritiusMexicoMorocco
NetherlandsNicaraguaNigerNorwayOman
PakistanPanamaPapua New GuineaParaguayPeru
of Countries by
Yearof
Data
19771977197719761977
19771977197719771977
19761977197619771977
19771976197719771977
19771977197719771977
19771977197719761977
19761977197519771977
19751977197719771974
19771977197319771977
19761977197719771977
19771976197719771974
19771977197719771977
International Expenditure
CurrentExpenditure
2555432217
45389
3235
19574447
8
654
806
76
3142127849
203451
40
60481874
. . .
37391472
...
6754616823
295671
710
273
5864
. . .
6952751633
Goodsand
Services
362145621
615
2423
...
4155
...4937
706
631076
47534
6668
7357
831
7
4340
142
...
38281245
...
5934523332
6471301327
229513539
2665753617
Wagesand
Salaries
.... . .
849
...
37222329
...
35......
4333
621950
...59
27
2832
...
6548103142
52185
36......
342
5625
5461584
46
6357411145
91330
...14
...51
...15
...
Comparison
OtherGoods and
Services
...
...534923
5930
827
...
31......
l362
283
43...
58
45...
2252
...
36396
3510
1942
248
...
...292646
...
2460165115
9541225
5
113757
...
...
...50
...34
...
Index,
Interest
724625374
65591456
...
1273
...6061
399
661034
5718113127
3321282035
6646275
...
224823
...
...
3055177158
132637641
26426753
5
5470681969
1977: Economic Expenditure
Subsidies
463344
59
7395149
...
1521
...3413
2664717225
631425930
21053
155
57354865
...
24606756
...
6832637036
3819621116
524
6647
...
7514121861
CapitalExpenditure
5474482564
2615225713
762
232865
3635465020
4210274547
433
637929
617
143817
5632683039
7712416780
319
34
81
556053
173
1833
57249
Acquisitionof Capital
Assets
34688
...61
24292257
...
5615
...4567
4950202330
3743692870
46
l35210
6595
36...
4732352125
5116315844
1440183962
...59192
...
33123
6038
CapitalTransfers
31...
41......
30282619
...
29......
1327
3742484510
24
389
...
18
'555747
16544339
...
331
461
...
123123251
1...
362215
495061
44
740212035
22

Subsidies and Other Current Transfers
Table 8 (concluded).Economic Expenditure
Country
PhilippinesRwandaSenegalSierra LeoneSingapore
SomaliaSpainSri LankaSudanSuriname
SwazilandSwedenSwitzerlandTanzaniaThailand
TunisiaTurkeyUnited Arab EmiratesUnited KingdomUnited States
Upper VoltaUruguayVenezuelaYemen Arab Rep.Zambia
Number of countriesin column
Ranking of
Yearof
Data
19761977197519781977
19771977197719771976
19771977197719771977
19771977197719761977
19771978197719771977
Countries
CurrentExpenditure
5115597321
6224507970
3666776313
1146
23053
412826
...
...
78
by International Expenditure
Goodsand
Services
2219696754
...60181574
4878774625
169
...1172
44502058
...
80
Wagesand
Salaries
624552126
...53171
60
47...
403
2016
...7
...
1239386444
65
OtherGoods and
Services
1820556138
...47214044
32......
4156
174
...33
...1
147
...
...
62
Interest
293
164550
...137477
8
736475238
4451
...4340
241549
2...
77
Comparison Index,
Subsidies
747354583
...'224075
8
1728434137
2769
...5023
452920
...
...
83
CapitalExpenditure
644512159
1970753769
5271822458
6611834
78
164062
8
...76
1977:
Acquisitionof Capital
Assets
...4211
...64
...66535441
4871
...7
63
5526
1771
1276
...4
...72
CapitalTransfers
...
...61
...8
...3453
111
1......
5859
5217
...25
...
561460
...
...
...62
suggesting possibly that time plays such an importantrole in determining eventual annual interest paymentsunique to each country that cross-section analysis is notappropriate for this functional category.
Subsidies and Other Current Transfers
Subsidies include all transfers on current account toprivate industries and grants to public enterprises foroffsetting operating losses stemming from governmentaction. Other current transfers include transfers to otherlevels of government for current purposes, grants to pri-vate nonprofit institutions, and, most important, cashtransfers to households (including payments for socialsecurity, unemployment benefits, family allowances, civilservice pensions, and scholarships).
Such expenditure should be associated with theexpansion of social services and welfare (for example,social security, welfare, and education), as society ismore capable of subsidizing the provision of such ser-vices or providing transfers made to improve incomedistribution. It might also be expected that the expan-sion of both a modern agricultural sector and a manu-facturing sector would lead to subsidies (although insofaras these sectors proved efficient and profitable, subsidieswould become unnecessary).
The result is that almost 88 per cent of governmentexpenditure on subsidies and transfers as a share ofGDP is explained by the proportion in GDP of govern-ment expenditure spent on social services, education,defense, and per capita income. Health expenditure isnot significant. Per capita income, although positivelycorrelated, is only significant at the 6 per cent level. Asmentioned above, expenditures on social security andeducation might be expected to be important, but ex-penditure on defense as a powerful explanatory variableis somewhat surprising. Perhaps the industries that areneeded to ensure domestic defense require industrialsubsidies (for example, for steel and shipbuilding) orlarge defense expenditures might require complementaryinputs at subsidized prices (transport, energy).
In the country rankings, it is surprising that Mexicoseems to offer almost 50 per cent less in subsidies thanmight be expected, although this is possibly explained byaid to industries in other ways, such as tax concessions,and much the same may be true of the United States. Atthe same time, it would not be expected that the UnitedKingdom spends some 24 per cent more than predictedon subsidies, Korea 73 per cent more, the Philippinesand Egypt more than twice as much, and Sudan andPakistan over four times as much. Equally interesting,African countries tend to spend far more than expected
23

IV • DETERMINANTS OF SHARES IN GDP OF ECONOMIC EXPENDITURE CATEGORIES
on subsidies and transfers, but it is not known whichsector is benefited most—the urban or the rural. Morethan half of the Latin American countries spend lessthan expected. Although the predictive power of theequation is high, the dispersion of IEC index values isalso high.
Total Current Expenditure
This expenditure category represents the aggregate ofthe categories discussed above, that is, expenditure onwages and other goods and services, interest, subsidies,and transfers. Countries that allocate a large share ofGDP to public expenditure on defense and social ser-vices (health, education, and social security) rely on cur-rent expenditure as the main instrument for realizingthese objectives.
The dispersion of IEC index values is the lowest of allthe economic variables. Almost all the Latin Americancountries and two thirds of the Asian countries spend farless on current expenditure than would have been pre-dicted; conversely, most of the African countries spendmore than expected.
Capital Assets
This category covers the acquisition of new and exist-ing durable goods (with a normal life in excess of oneyear) but excludes all military goods. Two key areas offunctional expenditure give rise to the purchase of capi-tal assets: expenditure on economic services and on gen-eral public administration. The higher the share in GDPof expenditure on general public services (police, generaladministration, the judiciary, legislature) the higher isgovernment investment (significant at the 1 per centlevel). This is similarly true for expenditure on economicservices, with the key subsectors being public expendi-ture on utilities and transport (Table 7). Other key func-tional categories, such as health, education, or socialsecurity, prove to be unimportant as factors explainingthe share in GDP of public capital investment. Theamount of per capita income is not an important factorin determining whether public sector investment is animportant share of GDP.
A problem with the capital investment variable is thata figure for any one year can be misleading. It is in thenature of government acquisitions of capital assets thatthey are made sporadically; governments change andwith them the prevailing views on the role of governmentownership of capital. Thus, the low actual ranking of theUnited Kingdom, compared with what might be expectedgiven that nation's size of public administration and itsexpenditure on utilities and roads, is misleading anddoes not reflect the substantial capital investment already
made by the Government of the United Kingdom in the1950s and 1960s. Similarly, the high figure for Swedenmight be predicted, but that for Spain may simplyrepresent a catching up after years of a deliberately con-tained government investment in capital projects.Finally, across regions, a slight majority of Africancountries tends to spend less than expected on capitalinvestment.
Capital Transfers
Capital transfers are unrequited payments to help therecipients (other branches of government, public enter-prises, or the private sector) to buy capital assets or tocompensate for loss, damage, or some extraordinaryproblem. To some extent, they could be viewed as areciprocal of the acquisition by the State of capitalassets. Such transfers could be expected to be associatedpositively with the growth of a modern agricultural sec-tor and the mining and manufacturing sectors. To theextent that the central government is involved directly incapital acquisition, such transfers would need to be less.
The key functional expenditure determining the sharein GDP spent on public capital transfers is expenditureon economic services. Within this, the principal eco-nomic subsectors are government spending on roads,agriculture, and mining and manufacturing. Expendi-ture on capital transfers is positively related to theamount the government spends on agriculture as a pro-portion of GDP (significant at the 5 per cent level) butnegatively correlated with the proportion of the laborforce in agriculture, suggesting that the smaller the laborforce and the more modern the agricultural sector themore likely it is that government expenditure may takethe form of capital transfers. Such transfers enable thesmaller agricultural labor force to use more modernequipment and to improve its capital stock for process-ing and storage and allow it to be protected from theeffects of natural disasters. Much the same appears truefor the mining and manufacturing sectors.
The negative coefficients for defense expenditure andgovernment expenditure on roads tend to suggest thatsuch spending preempts government allocation for capi-tal transfers. Per capita income does prove to be mod-estly significant for this variable; the negative coefficientsuggests that, again, with higher per capita incomes theneed for government expenditures on capital transfers isreduced.
In the country-rankings, it is surprising that a countrysuch as the Netherlands spends almost twice what mightbe expected, given the relative importance of its agricul-tural, mining, and manufacturing sectors. However, thismay be explained by the sporadic nature of capital trans-actions, although capital transfers—often made under
24

entitlement programs—would be expected to be lessresponsive to major fluctuations than purchases of capi-tal assets directly by government. Across regions, coun-tries in Africa and Latin America tend to spend less thanwould be expected on capital transfers.
The dispersion in IEC index values is the highest forthis type of expenditure; only 4 of the 62 countries in thesample have IEC values between 95 and 105 (Table 3).
Total Capital
This category is the aggregate of government expendi-ture on the acquisition of capital assets and capitaltransfers. Expenditures on the more capital-oriented
Total Capital
functional categories—economic services, housing, andcommunity amenities—prove to be the most importantdeterminants of the share in GDP of public capitalexpenditure. When the economic services category isdisaggregated, it is found that expenditure on electricity,gas, and water, on mining and manufacturing, on roads,and on agriculture gives rise to a significant amount ofcapital expenditure (Table 7).
Across regions, the key imbalance appears in Africaand in the industrial countries, where a significantmajority of countries seem to spend less on capitalexpenditure than expected. Perhaps because of theimportance of the members of the Organization of Pe-troleum Exporting Countries, the Middle Eastern coun-tries spend more on capital expenditure than expected.
25

V Balance in Expenditure Composition
From a policy perspective, it is often argued thatcountries tend to economize on nonwage forms of cur-rent expenditure, particularly when faced with a budge-tary squeeze. Excessive current spending relative to capi-tal expenditure is also inveighed against. If these hypo-theses were true, the expectation would be that countrieswould exhibit higher IEC indices for wages relative totheir indices for other purchases of goods and services—and, similarly, for current expenditure relative to capitalexpenditure.
Despite the danger of interpreting a cross-sectionstudy as a time series, it was thought worthwhile to testthe above hypothesis. The following measure was calcu-lated (Table 9). The ratio is shown as:
Actual share in GDPof purchases of othergoods and services
If B1 is more than unity, it suggests a tendency towardoveremphasis on other goods and services relative towages, compared with what might have been predicted.15
A set of other comparable B measures have been testedas well:
15One could, of course, observe a country with B1 < 0 and still findthat its share of wages in GDP exceeds what might have beenpredicted!
representing, if B is greater than unity, a tendency tooveremphasis on current expenditure relative to capitalexpenditure (B2), wages relative to subsidies (B3), andgoods and services relative to subsidies (B4).
The cross-country patterns were revealing. Focusingon the countries where B1 is more than 1.05 or less than0.95, the study found that the wage imbalance hypothe-sis cannot be confirmed. With the exception of the Asianregion, half the countries appear to overspend on wages,while the remaining half overspend on other purchasesof goods and services. Only in the Asian region is there aclear bias toward overemphasis on purchases of othergoods and services relative to wages; it was found that, inthis region, B1> 1.05 in more than three fourths of thecountries.
Examining next the relative balance of current andcapital expenditures (B2), the study found a more variedpattern. In Africa and the industrial countries, a clearbias was found toward relative overspending on currentrelative to capital expenditure. On the other hand,almost two thirds of the Latin American and MiddleEastern countries had B2 indices less than 0.95, suggest-ing a higher weighting of capital expenditure than wouldhave been predicted.
In comparing wages with subsidies and transfers,greater emphasis on subsidies was found in Africa andamong the industrial countries. More than two thirds ofthe African countries attached a higher weight to subsi-dies vis-a-vis wages than would have been predicted. Thereverse was true in the Latin American region. Theweight attached to all purchases of goods and servicesvis-a-vis subsidies also verified the above relationship inLatin America and Africa based on the calculation of B4.
26
Actual share in GDPof wages
Predicted share inGDP of purchases ofother goods andservices
Predicted share inGDP of wages

Balance in Expenditure Composition
Table 9. Measures
Country
ArgentinaAustraliaAustriaBahamasBahrain
BarbadosBelgiumBoliviaBotswanaBurma
CameroonCanadaChadChileCosta Rica
CyprusDominican Rep.EgyptEl SalvadorEthiopia
FijiFinlandFranceGambia, TheGermany, Fed. Rep.
GreeceGrenadaGuatemalaHondurasIceland
IranIsraelItalyJamaicaJordan
KenyaKoreaKuwaitLiberiaLuxembourg
of Balance in Composition
Othergoodsand
servicesto
wages(B1)
......
2.131.18
...
1.791.150.661.11
...
1.06......
0.652.70
0.680.511.03. . .
1.23
1.39...
0.971.51
...
0.500.970.741.160.56
0.671.410.491.31
...
1.052.150.940.691.26
Ratio of IEC Indices for
Currentexpenditure
tocapital
expenditure(B2)
0.800.640.971.100.66
1.191.340.980.811.40
0.513.321.211.190.60
1.240.821.620.751.76
0.971.550.991.451.04
0.932.810.580.311.13
0.881.921.291.350.83
1.070.601.370.631.56
Wagesto
subsidies(B3)
...
...0.583.17
...
2.040.800.690.73
...
1.52...
. . .1.101.66
1.690.550.53. . .
1.74
1.92...
0.810.65
...
8.062.200.554.360.80
0.880.820.520.61
...
0.670.260.960.731.54
of Public
Goodsand
servicesto
subsidies(B4)
0.491.250.683.051.63
2.450.590.680.70
...
1.591.42
1.081.76
1.550.450.540.311.88
2.271.190.530.861.42
5.502.130.534.570.52
0.731.030.350.641.29
0.630.420.750.661.04
Expenditure on an Economic Basis
Country
MadagascarMalawiMalaysiaMaliMalta
MauritiusMexicoMoroccoNetherlandsNicaragua
NigerNorwayPakistanPanamaPapua New Guinea
ParaguayPeruPhilippinesRwandaSenegal
Sierra LeoneSingaporeSomaliaSpainSri Lanka
SudanSurinameSwazilandSwedenSwitzerland
TanzaniaThailandTunisiaTurkeyUnited Arab Emirates
United KingdomUnited StatesUpper VoltaUruguayVenezuela
Othergoodsand
servicesto
wages(B1)
0.562.210.670.331.05
0.591.290.410.921.41
1.79...
...1.16
...
1.35. . .
1.280.941.12
2.121.26
...1.011.07
2.910.860.90
...
...
1.112.410.970.58
...
1.60...
0.250.740.56
Ratio of IEC
Currentexpenditure
tocapital
expenditure(B2)
1.180.830.401.071.76
1.28
0.360.800.58
0.966.591.581.153.75
0.560.942.740.861.06
1.560.741.530.630.60
1.630.820.890.780.60
1.370.690.601.590.17
2.710.491.350.980.74
Indices for
Wagesto
subsidies(B3)
0.940.291.151.771.84
0.721.351.670.522.32
0.55......
1.97...
1.07
0.200.380.97
0.603.03
...1.630.73
0.102.811.68
...
...
0.930.630.950.42
...
0.53...
0.641.101.30
Goodsand
servicesto
subsidies(B4)
0.730.440.981.171.87
0.651.431.300.372.76
0.650.810.221.982.65
1.340.550.270.360.98
0.903.70
1.510.74
0.202.941.531.771.37
0.950.880.900.38
0.591.790.891.171.08
27

Appendix
Table 10. Share
Country
ArgentinaAustraliaAustriaBahamasBahrain
BangladeshBarbadosBelgiumBoliviaBotswana
BrazilBurmaBurundiCameroonCanada
ChadChileCosta RicaCyprusDenmark
Dominican Rep.EcuadorEgyptEl SalvadorEthiopia
FijiFinlandFranceGambia, TheGermany, Fed. Rep.
GhanaGreeceGrenadaGuatemalaHonduras
IcelandIndiaIranIrelandIsrael
ItalyJamaicaJapanJordanKenya
KoreaKuwaitLesothoLiberiaLuxembourg
of Functional
GeneralPublic
Services
1.42.05.43.14.4
1.54.92.92.38.4
2.72.53.55.32.1
3.34.62.04.63.2
2.21.85.62.42.7
5.72.32.6
11.71.2
3.02.61.41.54.9
3.01.02.2...2.3
3.94.2
...8.13.7
1.74.78.89.84.2
Expenditures in
Defense
1.82.71.10.42.2
0.20.22.71.82.0
1.13.72.41.71.7
3.93.50.82.52.4
1.43.24.70.91.9
0.51.42.6
2.9
...5.93.71.41.8
_2.9
10.0...
25.6
1.30.9
...17.32.6
5.96.6
...1.21.0
Gross Domestic Product, 19771
Education Health
1.35.93.75.13.2
1.46.47.33.27.9
1.21.64.53.05.9
2,04.25.53.13.6
1.83.55.02.92.2
5.77.15.83.34.7
3.63.14.31.43.6
3.70.33.61.95.4
4.96.24.25.94.8
2.73.75.44.14.1
0.44.54.73.03.5
0.53.64.01.02.5
1.60.81.01.04.9
0.62.00.61.44.8
1.40.91.71.41.0
2.25.25.43.05.5
1.43.03.70.82.6
5.60.31.2
2.8
6.52.63.02.71.8
0.32.01.42.20.9
SocialSecurity
andWelfare
3.76.4
14.20.80.8
0.94.5
17.70.30.1
7.20.80.71.39.3
0.38.54.54.7
14.3
1.00.16.30.40.9
0.78.5
16.11.0
15.1
1.58.81.21.20.8
4.1...
1.36.9
11.7
13.01.14.36.0—
0.81.30.60.4
23.6
Housingand
CommunityAmenities
0.40.51.20.17.0
...1.50.80.21.9
0.10.6
...—1.4
0.11.40.43.40.6
2.1...
1.40.50.1
1.00.71.10.21.1
...0.60.30.30.5
1.40.41.60.10.6
0.82.01.40.70.1
0.13.41.10.50.5
Health,Social
Security, andWelfare
4.110.919.03.84.3
1.48.0
21.71.32.5
8.71.71.82.3
14.2
0.910.55.26.1
19.1
2.41.08.01.81.8
2.913.721.64.0
20.5
2.811.74.82.03.4
9.70.32.56.9
14.5
19.53.87.28.71.8
1.13.32.12.6
24.5
Agriculture,Forestry,
andFisheries
0.20.80.80.40.4
2.11.50.40.43.3
0.82.42.61.41.8
3.10.70.51.12.0
1.81.22.21.02.0
1.83.30.65.20.7
1.72.01.20.50.5
3.50.71.3
...0.5
1.12.32.92.32.2
0.90.14.72.21.5
Mining,Manufac-
turing, andConstruction
...0.4
0.1
0.1...
0.80.40.5
0.20.20.30.7
...
0.1
0.10.3
0.7...
0.2
0.1
0.60.70.4
...
...
0.40.52.8
0.1
0.11.11.8
...0.9
2.50.3—
4.10.4
0.14.10.20.2
...
Electricity,NaturalGas, and
Water
1.1...
1.35.8
0.6
0.31.4
0.2
0.50.2
..._
0.1
0.8—
0.40.10.70.20.1
1.00.30.10.9
..._
0.2...
1.8...
0.9...
3.7...
0.6
...0.6
...3.10.8
0.22.70.6
—
Transpor-tation andCommuni-
cations
1.82.12.51.02.3
0.94.33.81.74.9
1.50.62.13.37.4
0.71.22.90.91.0
1.3...
0.61.42.4
2.12.60.56.53.1
1.62.4
...0.9
...
1.8
2.10.61.1
2.82.12.19.32.4
0.6...
1.42.56.5
28

Appendix
Table 10 (concluded).
Country
MadagascarMalawiMalaysiaMaliMalta
MauritiusMexicoMoroccoNepalNetherlands
New ZealandNicaraguaNigerNigeriaNorway
OmanPakistanPanamaPapua New GuineaParaguay
PeruPhilippinesPortugalRwandaSenegal
Sierra LeoneSingaporeSomaliaSpainSri Lanka
SudanSurinameSwazilandSwedenSwitzerland
Syrian Arab Rep.TanzaniaThailandTunisiaTurkey
United Arab EmiratesUnited KingdomUnited StatesUpper VoltaUruguay
VenezuelaYemen Arab Rep.YugoslaviaZambia
Share of
GeneralPublic
Services
4.73.55.54.83.5
6.91.1
13.91.67.8
2.42.07.23.43.2
8.51.86.16.31.7
2.62.65.72.64.0
5.52.29.81.12.4
1.515.57.53.40.9
1.65.41.63.22.7
3.33.10.83.43.4
2.55.40.9
10.8
Functional Expenditures
Defense Education
0.81.74.93.51.2
0.20.67.00.93.5
1.52.01.34.53.2
20.75.4
1.31.4
3.03.12.62.21.7
1.66.07.41.10.6
3.0
1.83.42.1
14.43.53.31.43.5
4.34.85.03.32.4
2.38.05.2
3.12.26.64.53.5
4.83.45.91.57.9
5.12.75.12.47.7
1.00.45.76.01.5
3.51.83.52.03.0
3.42.95.22.02.7
1.36.75.97.70.8
3.23.83.87.64.9
1.46.15.02.42.2
4.31.6
5.8
Health
1.60.82.11.23.5
2.70.71.30.75.6
5.10.61.30.64.3
2.10.34.22.60.3
1.10.72.30.61.0
1.61.52.22.21.4
0.43.61.86.12.2
0.42.00.82.40.6
0.85.03.00.81.2
1.50.65.62.5
; in Gross
SocialSecurity
andWelfare
2.10.40.60.7
13.2
4.24.82.20.1
20.3
10.03.10.60.3
11.7
...0.43.80.11.9
0.48.00.20.7
0.60.30.7
10.35.9
0.72.90.1
18.710.3
3.50.30.64.00.4
0.39.18.60.5
10.1
2.1
8.20.1
Domestic
Housingand
CommunityAmenities
0.1—
0.1
1.8
0.8
0.90.11.3
0.42.1—
0.82.5
1.70.60.51.30.2
0.50.21.2—
0.3
0.21.72,10.50.1
-1.61.31.10.3
1.30.30.40.50.6
0.33.60.70.10.1
1.9......
0.6
Product
Health,Social
Security, andWelfare
3.71.22.62.0
16.7
6.95.53.50.8
26.0
15.13.81.90.8
16.0
2.10.78.02.72.2
1.11.1
10.20.91.7
2.11.82.9
12.47.3
1.16.51.9
24.712.6
3.92.31.46.41.1
1.114.111.61.3
11.2
3.60.6
13.92.6
, 19771
Agriculture,Forestry,
andFisheries
2.92.81.01.51.0
4.52.2
...2.4
...
1.71.11.40.63.4
0.50.61.03.00.4
1.81.60.61.00.8
1.10.15.00.91.8
4.00.83.61.41.0
2.23.31.82.70.7
0.10.90.20.30.3
3.00.30.34.9
Mining,Manufac-
turing, andConstruction
0.1—
0.52.1
_
...
0.9...
0.10.10.53.80.7
4.10.60.80.9—
...0.40.60.4—
0.2—1.10.20.1
_2.10.70.6
...
10.32.10.11.41.9
_0.8
...0.10.1
2.6
...1.2
Electricity,Natural
Gas, andWater
0.10.20.10.10.8
0.60.6
...0.7
...
0.10.10.40.60.2
4.20.41.10.5
...
1.00.40.10.50.2
0.7—
...
...
...0.90.90.70.1
3.51.50.3
...2.9
0.40.1
...
...0.9
3.2......
0.3
Transpor-tation andCommuni-
cations
1.12.61.00.72.6
1.21.3
...2.8
...
1.5...
1.85.83.6
6.81.72.44.71.8
...2.3
...2.60.2
0.81.32.11.1
...
2.52.73.41.51.7
2.81.81.83.04.0
...2.60.51.01.4
3.01.7
...3.2
Sources: International Monetary Fund, Government Finance Statistics Yearbook, Vol. 4 (1980); Organization for Economic Cooperation andDevelopment, National Accounts of OECD Countries, 1960-78, Vol. 2 (Paris, 1979), and Public Expenditure Trends (Paris, June 1978).
1 See Table 1 for those countries for which the data relate to earlier years.
29

APPENDIX
Table 11. Functional Expenditures as Percentage of Total Expenditure, 19771
Social Housing Health, Agriculture, Mining, Electricity, Transpor-General Security and Social Forestry, Manufac- Natural tation andPublic and Community Security, and and turing, and Gas, and Communi-
Country Services Defense Education Health Welfare Amenities Welfare Fisheries Construction Water cations
ArgentinaAustraliaAustriaBahamasBahrain
BangladeshBarbadosBelgiumBoliviaBotswana
BrazilBurmaBurundiCameroonCanada
ChadChileCosta RicaCyprusDenmark
Dominican Rep.EcuadorEgyptEl SalvadorEthiopia
FijiFinlandFranceGambia, TheGermany, Fed. Rep.
GhanaGreeceGrenadaGuatemalaHonduras
IcelandIndiaIranIsraelItaly
JamaicaJapanJordanKenyaKorea
KuwaitLesothoLiberiaLuxembourgMadagascar
MalawiMalaysiaMaliMaltaMauritius
MexicoMoroccoNepalNetherlandsNew Zealand
8.66.8
14.715.210.9
...14.36.1
18.921.9
12.717.516.227.9
9.7
22.414.69.7
17.29.9
12.713.09.0
15.9...
23.77.26.7
33.13.9
3.08.05.8
13.127.6
9.55.44.23.25.7
10.8...
11..216.19.1
12.134.331.79.1
22.8
16.417.426.98.6
19.2
6.532.112.414.66.3
10.89.03.10.25.3
...0.65.7
14.75.2
5.226.211.29.17.6
25.811.13.88.97.4
9.523.4
7.55.7
...
2.04.26.8
...9.7
1.018.214.712.110.4
...16 .123.035.92.8
2.3...
24.011.130.8
16.7...
4.02.24.0
8.015.419.33.00.6
3.516.37.16.73.9
7.920.310.125.2
7.8
12.919.015.325.620.5
5.611.220.615.715.1
13.513.326.68.99.9
11.325.78.0
19.511.4
23.818.315.19.4
12.1
18.79.6
17.211.820.6
11.61.78.67.6
12.6
15.919.08.2
20.514.3
9.321.113.28.8
14.8
10.420.825.08.7
13.3
19.313.711.214.913.6
2.515.613.014.78.6
4.410.68.48.06.4
7.35.94.75.7
12.5
4.26.23.15.2
11.8
8.96.82.79.04.9
9.013.414.28.5
14.2
7.19.1
14.77.0
14.6
17.41.52.93.9
16.8
6.813.33.77.71.5
5.15.67.01.87.8
3.86.66.98.57.5
4.23.05.59.8
13.5
22.122.239.04.12.0
8.513.237.2
2.70.2
33.46.03.46.9
23.6
1.927.022.017.735.1
6.20.8
10.12.74.4
3.022.242.1
2.838.9
7.627.14.7
10.04.7
12.9...
3.116.433.5
2.919.28.30.24.3
3.42.51.4
51.210.0
1.61.84.1
32.311.7
27.15.10.6
38.226.6
2.31.73.20.3
17.1
...4.51.61.84.8
0.44.5
...—
3.5
0.44.31.9
12.61.5
13.6...
2.23.60.4
4.11.72.80.52.9
...1.91.22.42.6
4.42.53.90.82.1
5.16.41.00.60.7
8.64.51.81.00.2
0.20.2—
4.42.1
...2.10.52.41.0
49.123.942.218.819.1
8.517.738.84.55.1
33.810.53.4
12.027.1
2.331.323.930.336.6
19.90.8
12.46.34.7
7.123.944.9
3.341.8
7.629.0
5.912.47.3
17.32.57.0
17.335.5
7.925.612.00.75.0
12.07.03.1
52.310.2
1.92.0
11.036.613.8
27.17.21.1
40.627.5
0.93.12.12.00.9
19.44.40.83.08.6
3.817.212.07.64.5
20.92.22.24.34.9
11.59.13.66.9
10.3
7.68.71.6
14.71.8
8.66.34.74.53.1
10.94.23.20.72.8
5.813.03.29.44.5
0.118.47.13.2
13.9
13.33.28.42.5
12.3
12.6...
18..3
...4.6
0.1...
1.0
0.2
1.3
1.73.01.4
0.81.21.20.3
...
0.50.1
0.50.9
4.2...
0.30.10.8
2.62.21.0
...
...
2.30.7
11.40.20.7
0.36.34.21.26.4
0.70.25.71.60.6
10.50.90.6
0.5
0.1—
2.85.10.1
...
...6.7
...0.3
6.5...
6.414.3
0.21.9
2.33.7
1.0...
2.20.9
...
0.10.30.22.9—
2.80.71.11.30.8
4.20.90.22.4
...
0.10.6
...15..2
...
2.9...
8.70.9
...
1.5
4.33.31.3
7.02.40.10.10.3
0.80.40.32.01.6
3.6
5.3...
0.2
3.91.33.44.93.2
...9.15.92.90.7
2.21.24.2
17.04.2
1.91.91.01.62.5
7.1...
0.54.21.8
1.95.71.7
15.73.8
0.31.3
...1.3—
0.6...
2.51.2
...
2.2...
12.92.60.4
3.70.21.67.90.4
3.20.44.02.72.0
5.3...
4.2...
1.4
30

Appendix
Table 11 (concluded).
Country
NicaraguaNigerNigeriaNorwayOman
PakistanPanamaPapua New GuineaParaguayPeru
PhilippinesPortugalRwandaSenegalSierra Leone
SingaporeSolomon IslandsSomaliaSpainSri Lanka
SudanSurinameSwazilandSwedenSwitzerland
Syrian Arab Rep.TanzaniaThailandTunisiaTurkey
United Arab EmiratesUnited KingdomUnited StatesUpper VoltaUruguay
VenezuelaYemen Arab Rep.YugoslaviaZambia
Functional
GeneralPublic
Services
11.431.8
...7.0
14.7
7.919.919.915.312.7
16.618.519.124.026.3
9.434.926.84.2
10.2
5.937.022.6
7.74.3
2.719.29.18.8
10.6
27.27.13.6
...14.2
7.025.2
3.727.6
Expenditures as
Defense
11.55.9
...6.9
35.8
23.8...
4.312.414.8
19.914.315.810.37.8
25.4...
20.14.52.6
11.5...5.47.5
10.2
25.012.218.34.0
13.6
35.812.621.4
10.3
6.537.519.9
...
Education
15.322.4
7.718.0
1.7
1.918.418.913.217.5
11.911.215.018.916.0
12.514.114.07.8
11.5
5.115.918.014.13.9
5.513.521.220.819.1
11.914.816.814.49.1
12.37.4
...14.8
Percentage of
Health
3.75.81.88.63.7
1.113.68.22.75.5
4.57.24.85.97.6
6.311.66.18.75.9
1.48.65.4
11.010.7
0.77.04.46.52.4
6.712.213.35.14.9
4.32.9
23.66.5
SocialSecurity
andWelfare
18.02.80.9
21.9...
1.912.30.2
16.70.2
2.525.6
1.64.72.6
1.11.01.9
37.825.5
2.76.80.3
34.249.5
6.01.23.5
10.91.7
2.421.829.7
2.742.4
5.8...
34.70.2
Total Expenditure,
Housingand
CommunityAmenities
11.8—
2.65.02.9
2.51.74.01.72.5
1.03.90.21.80.9
7.30.75.61.80.6
0.13.73.92.01.2
2.31.22.31.42.3
2.68.82.40.50.4
5.4......
1.5
Health,Social
Security, andWelfare
29.82.83.5
26.92.9
4.514.04.2
18.42.7
7.029.5
1.86.4
10.2
8.51.77.5
39.626.1
2.810.54.2
36.250.7
8.32.45.8
12.34.1
4.930.632.1
3.247.3
11.3—
34.71.6
19771
Agriculture,Forestry,
andFisheries
6.16.32.06.70.9
2.53.49.33.69.1
10.42.07.45.25.4
0.314.613.63.47.9
15.41.9
10.92.54.8
3.811.59.87.42.8
0.82.00.81.61.2
8.61.51.3
12.4
Mining,Manufac-
turing, andConstruction
0.52.1
12.21.47.0
2.82.62.80.4
...
2.71.92.9—1.1
0.10.93.10.90.5
0.15.12.11.4
...
17.87.30.43.87.2
0.21.9
....0.80.4
7.50.1
3.2
Electricity,NaturalGas, and
Water
0.81.61.80.47.2
1.93.71.6
...5.0
2.20.33.31.03.2
1.1
0.1......
2.22.61.20.2
6.05.41.4
11.1
3.10.2
...
...3.8
9.1......
0.9
Transpor-tation andCommuni-
cations
10.02.9
...3.35.7
5.82.36.30.24.5
15.05.91.80.14.0
3.84.74.22.17.8
8.92.91.01.44.1
0.50.61.06.00.8
4.91.62.0
5.8
3.22.4
...5.1
Sources: International Monetary Fund, Government Finance Statistics Yearbook, Vol. 4 (1980); Organization for Economic Cooperation andDevelopment, National Accounts of OECD Countries, 1960-78; Vol. II (Paris, 1979), and Public Expenditure Trends (Paris, June 1978).
1 See Table 1 for those countries for which the data relate to earlier years.
31
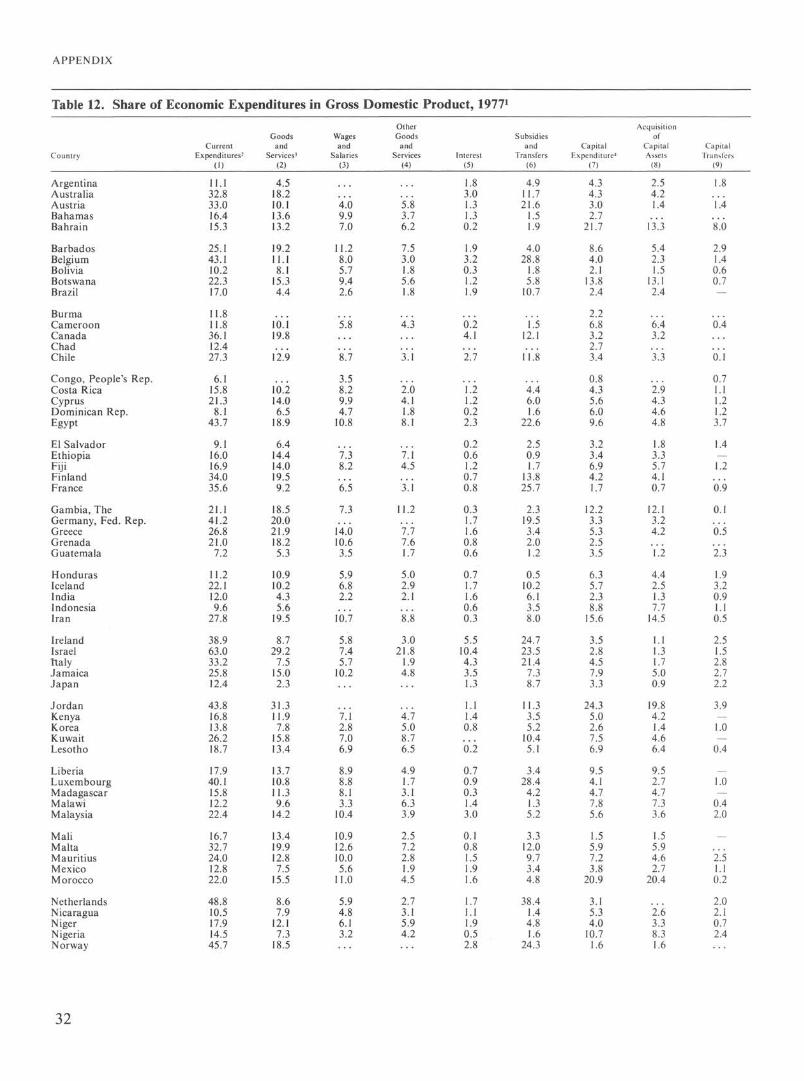
APPENDIX
Table 12. Share of Economic Expenditures in Gross Domestic Product, 19771
Country
ArgentinaAustraliaAustriaBahamasBahrain
BarbadosBelgiumBoliviaBotswanaBrazil
BurmaCameroonCanadaChadChile
Congo, People's Rep.Costa RicaCyprusDominican Rep.Egypt
El SalvadorEthiopiaFijiFinlandFrance
Gambia, TheGermany, Fed. Rep.GreeceGrenadaGuatemala
HondurasIcelandIndiaIndonesiaIran
IrelandIsraelItalyJamaicaJapan
JordanKenyaKoreaKuwaitLesotho
LiberiaLuxembourgMadagascarMalawiMalaysia
MaliMaltaMauritiusMexicoMorocco
NetherlandsNicaraguaNigerNigeriaNorway
CurrentExpenditures2
(1)
11.132.833.016.415.3
25.143.110.222.317.0
11.811.836.112.427.3
6.115.821.3
8.143.7
9.116.016.934.035.6
21.141.226.821.0
7.2
11.222.112.09.6
27.8
38.963.033.225.812.4
43.816.813.826.218.7
17.940.115.812.222.4
16.732.724.012.822.0
48.810.517.914.545.7
Goodsand
Services3
(2)
4.518.210.113.613.2
19.211.18.1
15.34.4
...10.119.8
...12.9
...10.214.06.5
18.9
6.414.414.019.59.2
18.520.021.918.25.3
10.910.24.35.6
19.5
8.729.2
7.515.02.3
31.311.97.8
15.813.4
13.710.811.39.6
14.2
13.419.912.87.5
15.5
8.67.9
12.17.3
18.5
Wagesand
Salaries(3)
...
...4.69.97.0
11.28.05.79.42.6
...5.8
...
...8.7
3.58.29.94.7
10.8
...7.38.2
...6.5
7.3...
14.010.63.5
5.96.82.2
...10.7
5.87.45.7
10.2......
7.12.87.06.9
8.98.88.13.3
10.4
10.912.610.05.6
11.0
5.94.86.13.2
...
OtherGoods
andServices
(4)
.... . .5.83.76.2
7.53.01.85.61.8
...4.3
...
...3.1
...2.64.11.88.1
...7.14.5
...3.1
11.2...
7.77.61.7
5.02.92.1
...8.8
3.021.8
1.94.8
...
...4.75.08.76.5
4.91.73.16.33.9
2.57.22.81.94.5
2.73.15.94.2
...
Interest(5)
1.83.01.31.30.2
1.93.20.31.21.9
...6.24.1
...2.7
...1.21.20.22.3
0.20.61.20.70.8
0.31.71.60.80.6
0.71.71.60.60.3
5.510.44.33.51.3
1.11.40.8
...0.2
0.70.90.31.43.0
0.10.81.51.91.6
1.71.11.90.52.8
Subsidiesand
Transfers(6)
4.911.721.6
1.51.9
4.028.8
1.85.8
10.7
...1.5
12.1...
11.8
...4.46.01.6
22.6
2.50.91.7
13.825.7
2.319.53.42.01.2
0.510.26.13.58.0
24.723.521.4
7.38.7
11.33.55.2
10.45.1
3.428.4
4.21.35.2
3.312.09.73.44.8
38.41.44.81.6
24.3
CapitalExpenditure4
(7)
4.34.33.02.7
21.7
8.64.02.1
13.82.4
2.26.83.22.73.4
0.84.35.66.09.6
3.23.46.94.21.7
12.23.35.32.53.5
6.35.72.38.8
15.6
3.52.84.57.93.3
24.35.02.67.56.9
9.54.14.77.85.6
1.55.97.23.8
20.9
3.15.34.0
10.71.6
Acquisitionof
CapitalAssets
(8)
2.54.21.4
...13..3
5.42.31.5
13.12.4
...6.43.2
...3.3
...2.94.34.64.8
1.83.35.74.10.7
12.13.24.2
...1.2
4.42.51.37.7
14.5
1.11.31.75.00.9
19.84.21.44.66.4
9.52.74.77.33.6
1.55.94.62.7
20.4
...2.63.38.31.6
CapitalTransfers
(9)
1.8...
1.4...
8.62.91.40.60.7—
...0.4
...
...0.1
0.71.11.21.23.7
1.4—1.2
...0.9
0.1
0.5...
2.3
1.93.20.91.10.5
2.51.52.82.72.2
3.9
1.0
0.4
_1.0—
0.42.0
...2.51.10.2
2.02.10.72.4
...
32

Appendix
Table 12 (concluded).
Country
OmanPakistanPanamaPapua New GuineaParaguay
PeruPhilippinesRwandaSenegalSierra Leone
SingaporeSomaliaSouth AfricaSpainSri Lanka
SudanSurinameSwazilandSwedenSwitzerland
TanzaniaThailandTunisiaTurkeyUnited Arab Emirates
United KingdomUnited StatesUpper VoltaUruguayVenezuela
Yemen Arab Rep.YugoslaviaZaireZambia
Share of
32.812.924.726.6
8.4
13.911.88.8
14.117.4
16.428.919.620.417.6
15.527.617.857.830.3
19.813.222.017.68.8
35.233.512.620.816.7
13.825.524.829.0
Economic Expenditures
CurrentExpenditures2
(1)
26.78.5
17.623.2
6.7
9.18.87.8
11.513.8
12.8...
10.510.67.3
9.924.115.529.612.9
16.09.5
13.110.6
...12.718.910.59.7
12.3
12.67.7
19.819.6
Goodsand
Services3
(2)
5.0...
11.4...
3.9
...4.04.26.85.6
6.3......
7.25.0
2.416.010.1
...
...
7.73.99.57.1
...6.1
...3.86.89.4
8.0...
11.410.4
in Gross
Wagesand
Salaries(3)
21.7...
6.2...
2.8
...4.33.64.78.3
6.5......
3.32.2
7.48.15.3
...
...
8.45.62.82.5
...6.2
...0.92.62.9
4.6...
8 49.1
DomesticOther
Goods andServices
(4)
0.61.83.01.70.3
2.20.60.10.41.2
2.7. . .1.50.42.8
1.20.20.12.82.2
1.31.11.00.5
...3.42.60.60.40.6
0.2...
2.63.6
Product, 19771
Subsidiesand
Interest Transfers(5) (6)
5.52.64.11.71.3
2.62.61.02.32.3
0.9...
7.69.47.5
4.43.42.2
25.415.2
2.52.67.96.5
...19.111.9
1.510.83.8
1.017.82.45.8
CapitalExpenditure4
(7)
25.13.55.43.62.8
4.82.24.61.83.6
3.77.83.43.35.5
10.714.39.84.71.7
8.34.4
12.27.03.3
2.01.72.72.2
15.7
7.60.56.85.9
Acquisitionof Capital
Assets(8)
23.03.52.92.92.4
3.3...
4.61.3
...
3.2...
2.11.82.9
10.713.89.84.7
...
4.03.86.86.2
...0.91.70.52.03.1
...0.55.04.1
CapitalTransfers
(9)
1.7
2.40.60.4
1.5......
0.5...
...1.01.42.6
_0.2
...
...
4.30.65.40.5
...
1.1...
0.40.2
12.6
...
...1.81.9
Sources: International Monetary Fund, Government Finance Statistics Yearbook, Vol. 4 (1980); Organization for Economic Cooperation andDevelopment, National Accounts of OECD Countries, 1960-78, Vol. 2 (Paris, 1979), and Public Expenditure Trends (Paris, June 1979).
1 See Table 2 for those countries for which the data relate to earlier years.2 The sum of columns 2, 5, and 6. Note that where columns 3 and 4 do not round up to column 2, the discrepancy is due to government contributions
to employee pension plans.3 The sum of columns 3 and 4.4 The sum of columns 8 and 9. Note that where columns 8 and 9 do not round up to column 7, the discrepancy is due to the purchases or sales of
stocks, land, and intangible assets.
33

APPENDIX
Table 13. Economic Expenditures as Percentage of Total Expenditure, 19771
CountryCurrent
Expenditures2
(1)
Goodsand
Services3
(2)
Wagesand
Salaries(3)
OtherGoods and
Services(4)
Interest(5)
Subsidies Acquisitionand Capital of Capital
Transfers Expenditure4 Assets(6) (7) (8)
CapitalTransfers
(9)
ArgentinaAustraliaAustriaBahamasBahrain
BarbadosBelgiumBoliviaBotswanaBrazil
BurmaCameroonCanadaChadChile
Costa RicaCyprusDominican Rep.EgyptEl Salvador
EthiopiaFijiFinlandFranceGambia, The
Germany, Fed. Rep.GreeceGrenadaGuatemalaHonduras
IcelandIndiaIndonesiaIranIreland
IsraelItalyJamaicaJapanJordan
KenyaKoreaKuwaitLesothoLiberia
LuxembourgMadagascarMalawiMalaysiaMali
MaltaMauritiusMexicoMoroccoNetherlands
NicaraguaNigerNorwayOmanPakistan
66.588.490.381.637.4
74.290.782.658.079.3
83.961.991.882.586.7
76.477.455.170.360.2
82.170.589.192.959.8
92.582.784.361.363.5
69.265.847.964.183.9
88.473.766.277.460.6
72.472.166.772.358.0
86.976.357.271.193.4
79.872.072.851.191.6
60.178.696.656.656.6
26.849.027.768.032.2
56.623.465.739.820.5
...52.950.5
...41.6
49.151.143.730.442.3
74.158.451.023.952.4
44.967.573.145.561.8
32.023.827.744.918.9
40.916.738.414.543.4
51.141.040.251.644.5
23.454.645.045.274.7
48.538.542.636.116.2
45.452.939.246.137.4
...
...11.049.517.2
33.016.846.224.411.9
...30.2
...
...27.7
39.836.231.717.4
...
37.634.2
...16.920.7
...43.442.729.633.6
21.412.3
...24.612.5
10.312.526.1
...
...
.30.514.617.826.628.7
19.239.415.632.860.7
30.830.031.625.711.1
27.626.9
...8.7
...
...
...15.818.515.1
22.26.3
14.614.68.6
...22.7
...
...9.9
9.714.912.013.0
...
36.518.6
...8.2
31.7
...23.930.514.528.1
9.211.5
...20.36.4
30.54.1
12.3......
20.326.422.225.015.8
3.715.229.312.314.1
17.68.5
11.010.45.2
17.926.0
...37.4
...
10.78.03.56.40.4
5.66.72.53.19.0
...1.3
10.5...
8.5
5.84.51.43.71.6
3.25.21.92.00.8
3.94.83.35.13.7
5.28.72.90.7
11.8
14.59.59.08.31.6
6.24.0
...0.92.4
2.01.36.49.40.5
2.14.5
10.73.83.3
6.68.26.01.08.0
29.031.559.1
7.24.7
11.960.514.315.249.8
...7.8
30.8...
37.2
21.421.910.736.316.3
4.86.9
36.267.0
6.6
43.710.38.0
10.72.7
32.133.317.318.453.2
33.047.518.854.515.7
15.027.126.519.811.1
61.520.4
5.916.518.2
29.329.019.411.272.1
8.121.351.49.5
11.2
25.711.68.2
13.353.1
25.48.5
17.335.811.4
15.935.88.2
17.610.8
20.620.340.315.421.2
17.228.810.94.4
34.5
7.516.39.9
29.636.0
18.012.743.935.9
7.6
3.910.020.320.433.7
21.513.519.126.730.8
9.023.036.417.78.2
14.521.621.648.5
5.8
30.317.53.5
43.415.4
15.211.23.9
...32.6
16.04.8
12.334.011.3
...33.58.2
...10.3
14.115.531.0
7.711.9
17.123.910.8
1.834.3
7.112.9
...10.124.7
7.87.0
38.433.32.3
1.83.7
12.85.8
27.4
18.07.2
11.724.730.8
6.022.734.411.48.2
14.513.715.547.5
...
14.714.63.5
39.715.3
10.5...
3.9...
19.5
8.53.05.01.8—
...2.3
...
...0.4
5.34.58.46.09.3
0.14.9
...2.50.2
...1.4
...19.511.0
10.14.95.51.05.3
2.26.36.9
13.85.3
_5.3
1.7—
2.20.22.06.3—
...7.66.00.53.8
12.33.0
...2.90.1
34

Appendix
Table 13 (concluded). Economic Expenditures as Percentage of Total Expenditure, 19771
Country
Goods Wages OtherCurrent and and Goods and
Expenditures2 Services1 Salaries Services(1) (2) (3) (4)
Interest(5)
Subsidiesand
Transfers(6)
CapitalExpenditure4
(7)
Acquisitionof Capital
Assets(8)
CapitalTransfers
(9)
PanamaPapua New GuineaParaguayPeruPhilippines
RwandaSenegalSierra LeoneSingaporeSolomon Islands
SomaliaSouth AfricaSpainSri LankaSudan
SurinameSwazilandSwedenTanzaniaThailand
TunisiaTurkeyUnited Arab EmiratesUnited KingdomUnited States
UruguayVenezuelaYemen Arab Rep.YugoslaviaZaire
Zambia
80.286.473.368.976.5
65.083.882.270.068.7
78.873.081.375.458.9
65.854.192.570.173.5
60.968.472.491.795.1
87.748.464.598.278.4
57.175.358.945.057.3
57.268.166.054.749.9
...39.642.131.337.5
57.347.047.456.752.9
36.440.9
...33.253.8
40.835.559.029.662.5
37.0...
34.6...
26.2
30.940.426.526.827.7
...
...28.821.7
9.2
38.130.8
...27.121.6
26.427.3
...15.8
...
28.827.237.4
...36.6
20.0...
24.3...
28.6
26.327.739.527.920.7
...
...1*3.39.6
28.3
19.216.2
...29.631.3
7.89.7
...16.2
...
11.18.3
21.7
...26.5
9.85.52.7
11.23.6
0.72.25.8
11.5—
...5.71.6
12.04.8
0.50.44.54.56.2
2.72.1
...8.97.5
1.61.90.8
...8 3
13.45.6
11.712.716.6
7.113.611.03.9
18.7
...28.237.632.216.7
8.06.7
40.68.9
14.4
21.825.4
...49.633.8
45.311.04.7
68.67.6
17.411.724.923.914.1
33.510.817.216.026.0
21.212.713.223.640.6
34.029.7
7.529.324.7
33.727.327.1
5.34.9
9.445.535.5
1.821.5
9.49.3
21.516.5
...
33.57.6
...13.721.1
...7.87.2
12.540.6
32.929.7
7.514.021.1
18.724.2
...2.34.8
8.48.9
...1.8
15.9
7.82.03.47.3
...
3.2...
0.24.9
...3.75.7
11.1—
0.4__
...15.33.6
14.91.8
...2.8
...
1.036.5
...
...5.6
73.9 50.0 26.6 23.2 9.1 14.8 15.1 10.4 4.7
Sources: International Monetary Fund, Government Finance Statistics Yearbook, Vol. 4 (1980); Organization for Economic Cooperation andDevelopment, National Accounts of OECD Countries, 1960-78, Vol. 2 (Paris, 1979), and Public Expenditure Trends (Paris, June 1978).
1 See Table 2 for those countries for which the data relate to earlier years.2 The sum of columns 2, 5, and 6. Note that where columns 3 and 4 do not round up to column 2, the discrepancy is due to government contribution
to employee pension plans.3 The sum of columns 3 and 4.4 The sum of columns 8 and 9. Note that where columns 8 and 9 do not round up to column 7, the discrepancy is due to purchases or sales of stocks,
land, and intangible assets.
35

APPENDIX
Table 14. Variables
Country
ArgentinaAustraliaAustriaBahamasBahrain
BangladeshBarbadosBelgiumBoliviaBotswana
BrazilBurmaBurundiCameroonCanada
BeninChadChileCongo, People's Rep.Costa Rica
CyprusDenmarkDominican Rep.EcuadorEgypt
El SalvadorEthiopiaFijiFinlandFrance
Gambia, TheGermany, Fed. Rep.GhanaGreeceGrenada
GuatemalaHondurasIcelandIndiaIndonesia
IranIrelandIsraelItalyJamaica
JapanJordanKenyaKoreaKuwait
LesothoLiberiaLuxembourgMadagascarMalawi
MalaysiaMaliMaltaMauritiusMexico
Used in Estimating Expenditure Equations:
Incomeper
Capita(in $)
1,9886,8436,3663,8686,048
801,9558,066
481524
1,463133131412
8,657
184150
1,400418
1,491
1,7409,780
816854358
673114
1,2956,6537,210
2088,420
3702,822
549
851403
7,690162330
1,9502,8693,7903,4391,466
6,593790278971
11,554
106396
9,640183163
1,046114
1,808773
1,149
Shareof
TotalPublic
Expenditurein GDP
1730372041
1134481238
2114221722
...1532
...21
2737161462
1519243338
3530193225
1218321820
4246713939
1652231939
2531462121
3220413618
Shareof
TotalPublic
Expenditure(Net of
Defense)in GDP
1427352039
1134451136
2010191520
...1128
...20
2434141057
1418233136
27
2721
1016
...15
...
32...
463738
...28211333
2530452020
2717403617
Shareof
PopulationUnder
15
2927234145
4632224346
4241434326
4639344341
2821474640
4645362124
4221482344
4347284241
4630332344
2447473748
3943204544
4344233646
1977 or
Shareof
PopulationOver
65
89
1543
39
1434
34338
24533
914334
323
1113
4143
136
33933
3118
126
83332
43
1333
33
1144
Latest Available Year
InfantMortality
Rate
31146
2331
2223
9152827
1
2730
527
3
21
101018
837
111
341
2314
1514
11819
141113
1161452
2123
12727
332
46
Shareof
Populationin
UrbanAreas
81875358
...
945713011
6125
22778
2314793641
4282464244
4012395775
2483325715
3732872118
4555876746
7553124984
330741620
3017794463
PopulationGrowth
Ratein
UrbanAreas
1.92.00.63.3
...
6.31.30.54.28.9
4.53.81.78.01.9
10.46.82.53.03.3
1.61.15.44.12.7
3.17.03.62.81.7
3.40.85.12.4
...
3.65.31.83.13.3
5.02.33.31.53.6
2.44.57.05.47.8
8.15.62.74.3
18.4
4.85.30.71.04.6
Shareof
LaborForce
inAgriculture
146
127
...
78104
5183
425585746
4787213630
358
584751
4781441410
795
544031
5763137360
4121
81324
14287945
2
8873
88487
4489
53034
Shareof
LaborForce
inIndustry
29354120
...
72543234
201956
30
156
272629
2837162426
157
163841
848192721
1915401112
3236374727
37399
3334
41444
55
205
422525
36

Appendix
Table 14 (concluded).
Country
MoroccoNepalNetherlandsNew ZealandNicaragua
NigerNigeriaNorwayOmanPakistan
PanamaPapua New GuineaParaguayPeruPhilippines
PortugalRwandaSenegalSierra LeoneSingapore
Solomon IslandsSomaliaSouth AfricaSpainSri Lanka
SudanSurinameSwazilandSwedenSwitzerland
Syrian Arab Rep.TanzaniaThailandTogoTunisia
TurkeyUnited Arab EmiratesUnited KingdomUnited StatesUpper Volta
UruguayVenezuelaYemen Arab Rep.YugoslaviaZaire
Zambia
Variables Used in Estimating Expenditure
Incomeper
Capita(in $)
566105
7,6905,026
826
144551
8,9052,224
202
1,226558742767467
1,563176415206
2,954
...107
1,5393,299
195
3491,575
6149,2489,583
886197422292852
1,15820,8404,0188,431
125
1,4722,808
4022,027
188
484
Shareof
TotalPublic
Expenditurein GDP
4313533817
2331465823
3132112015
3114162323
...37272523
2642334521
582818
. . .37
2612422317
2335212430
39
Shareof
TotalPublic
Expenditure(Net ofDefense)in GDP
3612503615
2127433717
...30101712
2811142217
...29
...2423
23...
314119
432515
...35
228
371813
21331319
...
...
Shareof
PopulationUnder
15
4642242948
4746234347
4242454446
2647444331
4845412638
4549452122
4646454643
4144232444
2844452543
47
Equations: 1977
Shareof
PopulationOver
65
23
1192
22
1443
43333
112334
424
114
333
1512
43334
54
14113
93393
3
InfantMortality
Rate
1723
11
17
3224
12917
3198
167
2273227
1
...31
1012
315
27
1
1420
62715
1029
11
32
35
312
27
23
or Latest
Shareof
Populationin
UrbanAreas
374
768350
101847
...26
5113386334
284
2421
100
...27487124
2050148556
479
141548
436590708
8380
83835
34
Available
PopulationGrowth
Ratein
UrbanAreas
4.14.40.52.24.5
6.84.63.1
...4.1
4.18.03.34.53.5
2.35.62.95.61.6
4.95.02.92.43.7
6.93.29.31.21.0
4.78.53.55.53.6
4.720.5
0.51.33.6
0.44.47.33.05.4
5.4
Year
Shareof
LaborForce
inAgriculture
5393
61044
92568
6358
3084514051
27927768
2
4583301954
791975
56
4984776943
62...
23
84
1221764276
69
Shareof
LaborForce
inIndustry
192
453514
31837
...20
188
192015
3639
1832
157
304215
10246
3748
2368
1423
14...
'433311
3227113413
11
Sources: International Monetary Fund, Government Finance Statistics Yearbook, Vol. 4 (1980), and International Financial Statistics; InternationalBank for Reconstruction and Development, World Tables (1980, 2nd ed.).
37

APPENDIX
Table 15. Variables Used in Estimating Expenditure Equations: 1977 or Latest Available Year
Country
PrimarySchool
EnrollmentRate
10892
102135
...
831081068092
908022
120106
5341
117155111
6910311010272
7723
110103108
3212944
10599
...89
1017982
9810912810598
10184
10510993
11962
1149256
9428
101103116
SecondarySchool
EnrollmentRate
56737775
...
2378893218
1822
31794
103
485243
6177244242
216
509785
966508342
...13792820
4890397158
9249156360
151653145
457
754537
Pupil-TeacherRatio,
PrimarySchool
18212144
...
5533192333
2252315125
4875396133
2616543840
4846321918
2723303038
3535214230
3131171839
2536334916
5341206161
3227212446
Indexof
Accessto
CleanWater
6610010065
100
531001003445
7717
...26
100
2026833877
95100554066
536
69100100
12100359538
4046
1003312
5110090
10086
10056176289
1720
1002633
629
906062
Populationper
HospitalBed
1708090
230250
4,430116110510340
2601,220
760380110
7801,140
300190260
200100350430460
5002,980
34070
100
1,29180
600160149
470660
701,2311,560
65090
17090
260
100950760
1,430210
560690
90410760
2701,350
100280860
Shareof
GDPin
Manufacturing
342130
...21
81026136
2410
...1419
87
211620
1419191720
159
102827
2389
162
...15
...1510
12...
193320
30131222
6
15
341414
1712281529
Shareof
GDPin
Agriculture
1265
...2
53102
1726
1048
...334
3448111323
126
212126
344722105
513
381427
...30
...3632
9...
589
57
3521—
1929
33943
30395
1910
Shareof
OtherManufacturing
andFuel inTotal
Exports
1631589937
62485996
...
16823
31
84
926921
3932166149
284
215042
...432249
1
...
105
5069
9840705777
4128276996
...76
...145
231
772
51
ArgentinaAustraliaAustriaBahamasBahrain
BangladeshBarbadosBelgiumBoliviaBotswana
BrazilBurmaBurundiCameroonCanada
BeninChadChileCongo, People's Rep.Costa Rica
CyprusDenmarkDominican Rep.EcuadorEgypt
El SalvadorEthiopiaFijiFinlandFrance
Gambia, TheGermany, Fed. Rep.GhanaGreeceGrenada
GuatemalaHondurasIcelandIndiaIndonesia
IranIrelandIsraelItalyJamaica
JapanJordanKenyaKoreaKuwait
LesothoLiberiaLuxembourgMadagascarMalawi
MalaysiaMaliMaltaMauritiusMexico
38

Appendix
Table 15 (concluded). Variables Used in Estimating Expenditure Equations: 1977 or Latest Available Year
Country
PrimarySchool
EnrollmentRate
6560
10111185
2149
1024450
12458
106110105
97614537
110
...40
10711477
391051039690
1037083
103100
10475
105109
16
95104269786
SecondarySchool
EnrollmentRate
1712928521
31089
217
5312204956
852
111155
...3
187355
1342357052
503
262320
29
81100
2
62384
5513
Pupil-TeacherRatio,
PrimarySchool
4031272339
4134172442
3031284029
2753493230
2635412929
3932381824
3350306140
3414222048
2331382242
Indexof
Accessto
CleanWater
559
10010070
27...
1003229
7920134739
65353712
100
3133
...7520
46...
37100100
7539221670
75
10010010
98754
8516
Populationper
HospitalBed
7106,630
90140400
1,2001,170
70640
2,020
266150610500880
170580730
1,080280
325570150190330
960180290
7090
980684800680410
460
100150
1,518
150340
2,060170330
Shareof
GDPin
Manufacturing
161027
...20
118
201
14
159
171725
3014175
26
...9
212714
66
2124
...
109
1989
162
252411
26166
298
Shareof
GDPin
Agriculture
16624
...24
453263
29
1734341428
11422936
2
...1579
37
411025
4...
1944282816
26133
33
106
451426
Shareof
OtherManufacturin
andFuel inTotal
Exports
22
521616
39443
10062
3516145024
5736278150
..." 2614913
194
...'3858
7413172974
23985030
3
3299
9116
10
MoroccoNepalNetherlandsNew ZealandNicaragua
NigerNigeriaNorwayOmanPakistan
PanamaPapua New GuineaParaguayPeruPhilippines
PortugalRwandaSenegalSierra LeoneSingapore
Solomon IslandsSomaliaSouth AfricaSpainSri Lanka
SudanSurinameSwazilandSwedenSwitzerland
Syrian Arab Rep.TanzaniaThailandTogoTunisia
TurkeyUnited Arab EmiratesUnited KingdomUnited StatesUpper Volta
UruguayVenezuelaYemen Arab Rep.YugoslaviaZaire
Zambia 95 15 48 42 250 19 14 78
Sources: International Monetary Fund, Government Finance Statistics Yearbook, Vol. 4 (1980), and International Financial Statistics; and Interna-tional Bank for Reconstruction and Development, World Tables (1980, 2nd.ed.).
39

This page intentionally left blank

Occasional Papers of the International Monetary Fund
1. International Capital Markets: Recent Developments and Short-Terrn Prospects,by a Staff Team Headed by R.C. Williams, Exchange and Trade RelationsDepartment. 1980.
2. Economic Stabilization and Growth in Portugal, by Hans O. Schmitt. 1981.
3. External Indebtedness of Developing Countries, by a Staff Team Headed byBahram Nowzad and Richard C. Williams. 1981.
4. World Economic Outlook: A Survey by the Staff of the International MonetaryFund. 1981.
5. Trade Policy Developments in Industrial Countries, by S.J. Anjaria, Z. Iqbal,L.L. Perez, and W.S. Tseng. 1981.
6. The Multilateral System of Payments: Keynes, Convertibility, and the Interna-tional Monetary Fund's Articles of Agreement, by Joseph Gold. 1981.
7. International Capital Markets: Recent Developments and Short-Term Prospects,1981, by a Staff Team Headed by Richard C. Williams, with G.G. Johnson.1981.
8. Taxation in Sub-Saharan Africa. Part I: Tax Policy and Administration in Sub-Saharan Africa, by Carlos A. Aguirre, Peter S. Griffith, and M. ZuhtuYucelik. Part II: A Statistical Evaluation of Taxation in Sub-Saharan Africa,by Vito Tanzi. 1981.
9. World Economic Outlook: A Survey by the Staff of the International MonetaryFund. 1982.
10. International Comparisons of Government Expenditure, by Alan A. Tait andPeter S. Heller. 1982.
International Monetary Fund, Washington, D.C. 20431, U.S.A.Telephone number: 202 477 2945
Cable address: Interfund