Embed Size (px)
Citation preview
International comparison of International
Labour Organisation published occupational
fatal injury rates:
How does New Zealand compare
internationally?
Commissioned report for the Independent Taskforce
on Workplace Health and Safety
Dr Rebbecca Lilley, Dr Ari Samaranayaka, Professor Hank Weiss
Final Report
15 March 2013
Injury Prevention Research Unit
Department of Preventive and Social Medicine
Dunedin School of Medicine
University of Otago
PO Box 56, Dunedin
New Zealand
2
Table of contents
3 List of tables
3 List of figures
4 Acknowledgements
5 Executive summary
8 Introduction
9 Methods
9 Source of occupational fatal injury data
9 Included countries
10 Period of comparison
10 Considering differences in scope and methodology
11 Incomplete coverage of the working population
12 Inclusion of self-employed workers
13 Exclusion of road traffic occupational fatal injuries
13 Inclusion of fatalities due to occupational diseases
14 Appropriate denominator data
14 Differences in industry composition
15 The use of differing industry classifications
16 Differences in firm size composition
17 Results
17 Comparison of scope of ILO occupational fatal injury data
17 Coverage of working population
17 Self-employment
17 Occupational disease
18 Road traffic occupational fatal injuries
22 Comparison of non-standardised occupational fatal injury rates
26 Comparison of industry standardised occupational fatal injury rates
28 EuroStat standardisation of European Union (EU) members
29 Discussion
29 Comparison of non-standardised occupational fatal injury incidence rates
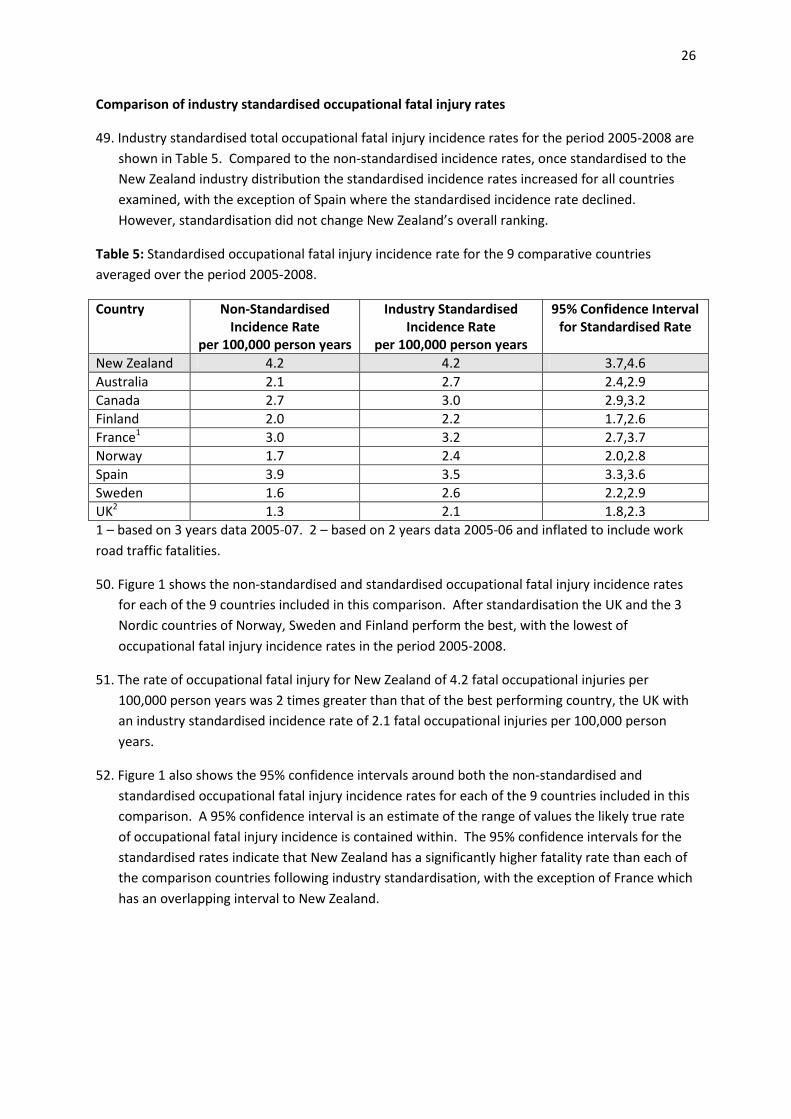
29 Comparison of industry standardised occupational fatal injury incidence rates
30 Limitations to comparisons of occupational fatal injury incidence rates
30 Coverage of the working population
31 Inclusion of self-employed workers
31 Fatalities due to occupational disease
32 Fatalities due to commuting
32 Summary of limitations

3
32 Limitations to analytical approach
34 Conclusion
34 Recommendations for improvements to occupational fatal injury statistics
35 Recommendations for further research
37 References
39 Appendix A: Difference in official published ILO and ACC occupational fatal injury data for
New Zealand, for the period 2005-2008
40 Appendix B: Adjustment for excluded road traffic-related data
42 Appendix C: Direct standardisation methodology
List of tables
19 Table 1: Data sources and scope of published ILO occupational fatal injury data for the 9
comparative countries
20 Table 2: Detailed comparison of scope of published ILO occupational fatal injury data for the
9 comparative countries
24 Table 3: Non-standardised fatal occupational injury incidence rates by industry and total
working population for the 9 comparative countries averaged over the period 2005-2008,
25 Table 4: Relative ranking safety performance using non-standardised occupational fatal
injury incidence rates by industry for the 9 comparative countries averaged over the period
2005-2008,
26 Table 5: Standardised occupational fatal injury incidence rate for the 9 comparative
countries averaged over the period 2005-2008
28 Table 6: Standardised incidence rate of occupational fatal injury of EU member states,
excluding road traffic accidents and accidents on board transport in the course of work
List of figures
27 Figure 1: Non-standardised and standardised occupational fatal injury incidence rates for
the 9 comparative countries averaged over the period 2005-2008

4
Acknowledgements
The authors would like to thank Gabrielle Davie, Injury Prevention Research Unit for her review of
the draft report.
The authors would also like to thank Zeeman Van der Merwe, Manager: Information, Strategy and
Planning and Karen Win, Senior Analyst on behalf of the Business Intelligence Unit, ACC for their
prompt provision of occupational fatal injury data for New Zealand for the period 2005-2008.
This project was funded by the Independent Taskforce on Workplace Health and Safety, Ministry of
Business, Innovation and Employment.

5
Executive Summary
This report has been written to advise the Independent Taskforce on Health and Safety on what
occupational fatal injury data shows and does not show with regards to how New Zealand’s recent
occupational safety performance compared with other countries with established market
economies.
Aims
1 – Compare New Zealand’s occupational fatal injury rate with other established market
economies, adjusting for industry composition.
2 – Identify and describe the limitations in interpreting the findings from the above comparison.
3 – Identify potential improvements to statistics or data capture that would increase the reliability
and improve the interpretation of international comparisons of occupational fatal injury.
4 – Identify areas of feasible research or analysis that could be done to increase the reliability and
improve the interpretation of international comparisons of occupational fatal injury.
Method
Data for the period 2005-2008 were obtained from the International Labour Organisation (ILO)
directly via the official ILO LABORSTA online database. Comparisons were made on the basis of
labour force coverage, case inclusion criteria, and non-standardised and industry standardised
occupational fatal injury data.
In total, 8 countries were compared with New Zealand:
Australia Finland Norway Sweden
Canada France Spain United Kingdom (UK)
Results
There is wide variability in the data coverage of the labour force and the types of working persons,
economic activities and geographical areas by each country’s occupational fatal injury data. New
Zealand data, by contrast, has a high level of labour force coverage and an inclusive case definition
of occupational fatal injury that makes direct comparison with other countries, particularly those
with poorer coverage of the labour force and/or restrictive case definitions of occupational fatal
injury, extremely problematic. The main areas of concern investigated in this report are: 1) the
coverage of the working population, 2) the inclusion of self-employed workers, 3) fatalities due to
occupational disease and 4) fatalities due to commuting. Other differences in the scope of
occupational fatal injuries included in the data, such as the exclusion of economic activities and the
inclusion of other workers (eg. unpaid family workers), also exist but were not examined in this
report.
The non-standardised data for the 9 countries in this analysis averaged over the 4 year period 2005-
2008 shows:

6
• New Zealand ranked last for overall occupational safety performance with an average rate of
4.2 occupational fatal injuries per 100,000 person years. The best rates (below 2.0
occupational fatal injuries per 100,000 person years) were reported in Finland, Sweden,
Norway and the UK.
• Comparing the relative ranking of New Zealand’s non-standardised reported occupational
fatal injury incidence rates, New Zealand performs in the lower half of the rankings for 8 of
13 International Standard Industry Classification (ISIC) major level industry classifications
examined in this analysis. Industries in which New Zealand ranked in the lower half of the
relative rankings for all 9 comparative established market economies were: Agriculture,
Hunting, Forestry and Fishing; Mining and Quarrying; Manufacturing; Electricity, Gas and
Water Supply; Construction; Financial Intermediation; Public Administration and Defence;
and Wholesale Trade.
• Differences in occupational fatal injury reporting between New Zealand and the comparison
countries due to the exclusion of certain economic activities, of the self-employed, and other
excluded fatalities should be investigated as possible explanations for differences between
these non-standardised rates.
Once standardised for industry composition averaged over the 4 year period 2005-2008, the relative
ranking of New Zealand did not change, with New Zealand remaining ranked lowest out of the 9
established market economies considered in this analysis (Figure 1). However, due to differences in
labour force coverage of the data and varying case definitions, each country’s data under-estimates
the total burden of occupational fatal injuries in comparison to New Zealand.
Figure 1: Non-standardised (unadjusted) and standardised (adjusted) occupational fatal injury
incidence rates for the 9 comparative countries averaged over the period 2005-2008. (Data for
France based on 3 years data 2005-2007 and for UK based on 2 years data 2005-2006. UK figures
inflated to include work road traffic fatalities.)
0
1
2
3
4
5
Death
s p
er
100,0
00 p
ers
on y
ears
Australia
Canada
Fin
land
Fra
nce
New
Zeala
nd
Norw
ay
Spain
Sw
eden
UK
Unadjusted rate Adjusted rate
95% CI

7
Conclusion
While making direct comparisons of international occupational fatal injury rates to benchmark
Occupational Safety performance relative to other established market economies is appealing, there
are many pitfalls to consider. Significant differences in the coverage of the labour force and the case
definition of occupational fatal injury exist in official ILO occupational fatal injury data that severely
compromise the validity of direct comparisons between countries. The potential for under-
estimation of the true relative occupational fatal injury situation due to the exclusion of self-
employed workers and fatalities due to occupational disease and commuting in the majority of
countries New Zealand was directly compared against means this comparison of occupational safety
performance is misleading.
Recommendations are made to improve future comparisons including the reconsideration of the
case inclusion criteria of New Zealand’s ILO data, qualification of further adjusting variables to allow
for adjustment of comparative country’s datasets and the establishment of a harmonised dataset to
aid more valid comparisons in occupational safety performance. Recommendations are made for
further research to determine the feasibility of establishing a harmonised dataset and for improving
future standardisation of international occupational fatal injury data.

8
Introduction
1. International comparisons of national occupational fatal injury data potentially have a critical
role to play in terms of: 1) benchmarking national occupational safety performance; and 2)
identifying hazards and, subsequently, targets for prevention of occupational fatal injuries.
Insights into the possible influence of geographic, social, economic and political factors on risk
factors for occupational fatal injuries, and how they arise, can be obtained from valid
international comparisons.
2. Despite the potential benefits of comparing the burden of workplace fatal injuries on a
multinational scale, there have been few attempts to do so. New Zealand occupational fatal
injury data has been included in three previous international comparisons of occupational fatal
injury estimates, of which two specifically examined New Zealand’s occupational safety
performance (Feyer, Lilley et al. 2001; Feyer, Williamson et al. 2001; National Occupational
Health and Safety Commission 2004). These three studies were conducted over 10 years ago.
3. This report has been written to advise the Independent Taskforce on Health and Safety on how
New Zealand’s recent occupational safety performance compares with selected other
established market economies and on the limitations of undertaking such a comparison. The
report will:
A. Compare New Zealand’s occupational fatal injury rate with reports from other established
market economies, adjusting for industry composition.
B. Identify and describe the limitations in interpreting the findings from the above comparison.
C. Identify potential improvements to statistics or data capture that would increase the
reliability and improve the interpretation of international comparisons of occupational fatal
injury.
D. Identify areas of feasible research or analysis that could be done to increase the reliability and
improve the interpretation of international comparisons of occupational fatal injury.
4. This analysis uses International Labour Organisation (ILO) data. The ILO databases, LABOURSTA
and ILOSTAT, contain occupational fatal injury data and supplementary data describing the scope
of the data included in each country’s statistics. This report will focus on comparisons of
occupational fatal injury rates with countries with established market economies similar to New
Zealand. The methods section describes the data issues considered across countries and the
methods used to take account of the differences, where possible. These include adjusting for
working road traffic occupational fatalities and standardising industry composition. The results
section presents a comparison of non-standardised fatality rates by industry, followed by the
industry standardised rates. A validity check is also presented with comparison of the relative
ranking of the 5 EU member countries to EuroStat harmonised data. The limitations of the data
comparison and recommendations for future improvements in analysis and further research to
improve occupational fatal injury statistics for international comparison are made in the
discussion and conclusion. The appendices provide additional information relevant to the
specific data and methods used.

9
Methods
5. This report closely replicates the methods used by the Australian National Occupational Health
and Safety Commission (NOHSC) to compare Australia’s Occupational Safety performance to 9
other established market economies, including New Zealand (National Occupational Health and
Safety Commission 2004). Several modifications have been made to the NOHSC methods due to
changes in the availability of ILO data since 2001.
Source of occupational fatal injury data
6. All occupational fatal injury data was sourced from the published online International Labour
Organisation (ILO) databases, in particular the LABORSTA database (data up to 2008)
[http://www.ilo.org/global/statistics-and-databases/lang--en/index.htm]. The ILO databases
provide numbers of occupational fatal cases and occupational fatal incidence rates by year and
by industry classification. The ILO databases also provide industry classifications for the total
economically active population (employees, employers and the self-employed) for each country.
7. The only ILO data available for New Zealand was the number of occupational fatal cases. New
Zealand’s ILO data is presented with suppressed cells where the cell count is less than 4 fatalities
(ie. count blanked out) but these fatalities are included in the total. Cell suppression occurs to
maintain the privacy of cases where it may be possible to identify them in a certain industry. The
Accident Compensation Corporation (ACC), who provide the ILO with New Zealand’s official
occupational fatal injury data, were contacted to obtain data for the period 2005-2008 with
suppression lifted on cells with a cell count of <4 so that industry specific analysis could occur.
As ACC data is updated over time there have been small changes in the number of occupational
fatal injuries, such that the original numbers sent to the ILO for the period 2005-2008 cannot be
replicated exactly (see Appendix A). As detailed industry classification of occupational fatalities
are needed for this analysis the ACC data generated in January 2013 for the period 2005-2008
have been used.
Included countries
8. This report initially considered all 33 Organisation for Economic Co-operation and Development
(OECD) countries (excluding New Zealand) for this comparison. To be included in the final list for
comparison to New Zealand the following criteria were considered:
A. ILO published data were available for at least 2 consecutive years in the 4 year period (2005-
2008) under consideration for this report.
B. Industry1 classification within the ILO published data were available and coded to individual
International Standard Industry Classification version 3 (ISIC3) major classifications.
C. The country had to be an established economy with a history of stable data collection, and
an OECD member prior to 2000.
9. In total, 8 comparison countries met the above criteria, namely: Australia, Canada, Finland,
France, Norway, Spain, Sweden, and the United Kingdom (UK).
1 Referred to as economic activity by ILO.

10
Period of comparison
10. The period used for comparison was from 2005-2008. These dates were selected for a number
of reasons. Firstly, between 2008 and 2009 the industry classification framework changed from
ISIC3 to ISIC4, meaning direct comparison of industry specific rates was not possible across this
period. Secondly, official ILO data were not available beyond 2010 at the time of this report,
making a comparison of rates for 2009 and 2010 less precise as there are only 2 time points for
each country to average. Finally, the online published ILO databases have been upgraded from
the LABORSTA (data up to 2008) to the ILOSTAT (data from 2009) database. At this time there is
a significant amount of missing data in the ILOSTAT database. For example, no data is available
for 3 of our 9 countries under consideration. Given these data limitations, restricting the current
comparison to the period 2005-2008 maximises the number of countries able to be included at
this time.
11. The 9 countries report the year reference period variously as the financial year (eg. New Zealand
July to June) or the calendar year (January to December). In this analysis 3 countries report the
reference period as the financial year (New Zealand, Australia and UK), two specify the calendar
year (Canada and Finland), while the remainder simply state “year” probably referring to the
calendar year. Similar to the NOHSC analysis (National Occupational Health and Safety
Commission 2004) no attempt is made in this analysis to align reference periods across
countries, due to the unavailability of data by month of fatal injury, so this presents a limitation
to comparing occupational fatal injury data across countries.
Considering differences in scope and methodology
12. Differences in the scope of occupational fatal injury data collected and the method of data
collection need to be considered before any comparisons between countries can occur. The
scope of the data refers to the composition of the occupational fatal injuries represented in the
data. What is included in the numerator (fatal case criteria) and the denominator (labour force
coverage) is important as it can limit to what extent meaningful comparisons between countries
can be made.
13. Comparison of the scope of the numerator and denominator data were undertaken using official
ILO published materials available supplementary to the published ILO occupational fatal injury
data on LABORSTA. Previous studies have identified a number of limitations to international
comparisons of rates of occupational fatal injury (Feyer, Lilley et al. 2001; Feyer, Williamson et al.
2001; National Occupational Health and Safety Commission 2004). For the purposes of this
report, the following differences in the scope of national occupational fatal injury numerator and
denominator data were specifically considered:
A. Incomplete coverage of the working population
B. Inclusion of self-employed workers
C. Exclusion of work and commuting road traffic occupational fatal injuries
D. Inclusion of fatalities due to occupational diseases
E. Appropriate denominator data
F. Differences in industry composition
G. The use of differing industry classifications

11
H. Differences in firm size composition
14. Other significant differences in the coverage of occupational fatal injury data exist, such as the
inclusion of occupational fatalities of trainees, unpaid family workers and bystanders, and the
period of time between the injury event and subsequent death. These have not been considered
further in this report due to a lack of information on these aspects. The implications of not
considering these additional differences on the validity of international comparisons of
occupational fatal injury performance will be considered in the discussion.
15. The following methods were used to address the 8 specified differences (A-H above) in scope
and methods of data collection:
Incomplete coverage of the working population
16. Previous reports have highlighted that the extent of worker coverage of published ILO data is a
major dimension on which nations differ (Feyer, Lilley et al. 2001; National Occupational Health
and Safety Commission 2004). There are two key dimensions to coverage of data in this context:
a) the extent of the working population captured by data i.e. covers all employees, employers,
and self-employed working people in a country; and
b) the completeness of capture that the data collection system has with respect to injury events
i.e. a system that covers 100% of a working population may only capture reports for 80% of
that population (Feyer, Lilley et al. 2001).
17. The dimension of coverage of data is defined in published ILO data as the “percent employed
covered”, referring to the extent of system coverage of the entire working population (a above).
Published ILO data were sought to reveal the proportion of the entire working population each
country’s occupational fatal injury data covers (a above). While figures are available for the
amount of the working population covered by each country’s official ILO published occupational
fatal injury data, this data is only available as a total figure. We know that where a country’s
data represents less than 100% of the working population the level of under-coverage of the
working population is not uniform across industries. For example, Australian data only
represents those workers covered by the Australian Workers Compensation Schemes, which
excludes Defence Force workers and significant numbers of self-employed workers in the
Agricultural industry. Data are not readily available at this time to be able to determine the level
of under-coverage by industry for each country included in this comparison; therefore, it is not
possible to adjust for incomplete coverage of official ILO published data in this analysis. The
implications of our inability to adjust for incomplete coverage of official ILO occupational fatal
injury data on the validity of international comparisons of occupational fatal injury performance
will be considered further in the discussion.
18. With regards to the completeness of capture of the data collection system (b above), further
information were sought on the source of data from which official fatal data collection systems
were based. The source of data (eg. compensated insurance claims or official reported
notifications) can influence the coverage of the working population and ultimately the extent of
comparability between countries. For example countries reporting only compensated injury
claims may exclude important groups of workers from the injury compensation scheme, under-

12
estimating the true occupational fatal injury rate in comparison with countries that include these
groups in reported notification data or insurance data. Likewise non-claiming of compensable
injuries and non-inclusion of non-compensable injuries can lead to underestimation of the true
occupational fatal injury rate in insurance derived data (Langley, Feyer et al. 2000). Under-
reporting also plagues report-based notification data collections systems (Langley, Feyer et al.
2000). While the extent of capture of the occupational fatal data collection system (b above) is
an important aspect contributing to incomplete data coverage, it is not considered further in this
analysis as data is not readily available to ascertain the impact of this form of under-coverage.
The implications of not adjusting the extent of capture of the occupational fatal data collection
system on the validity of international comparisons of occupational fatal injury performance will
be considered further in the discussion.
Inclusion of self-employed workers
19. Self-employed workers are an important component of the economically active labour force.
Other comparisons have identified considerable variability in the inclusion of self-employed
workers in official occupational fatal injury data (Feyer, Lilley et al. 2001). New Zealand includes
self-employed workers in official ILO published occupational fatal injury data. In 2005 self-
employed workers made up 17% of the total New Zealand workforce (Statistics New Zealand
2013). Industries with high proportions of self-employed workers include Agriculture, Forestry
and Fishing, and the Construction industry with over 35% of the workforce in these industry
groups self-employed (Statistics New Zealand 2013). The concern here is that when comparisons
are made (like with Australia who exclude some self-employed from their official statistics) New
Zealand will potentially have inflated incidence rates if that self-employed workers carry a higher
risk of occupational fatal injury.
20. Analysis of Australian work-related coronial file data by self-employment status found no
evidence of a higher risk of occupational fatal injury in self-employed workers compared with
employees in the same industry (Driscoll, Healey et al. 2003). These findings indicate that factors
specific to the industry that self-employed workers work in is important, rather than factors
specific to self-employment itself. A similar examination of risks of occupational fatal injury in
the self-employed has not been undertaken in New Zealand, so we are uncertain how
generalizable these findings are to the New Zealand experience. Similar uncertainty can also be
applied to the other countries included in this report. A North Carolina study reported elevated
occupational fatal injury rates in the self-employed in the retail, finance and transportation
industries (Mirabelli, Loomis et al. 2003). Due to a lack of New Zealand specific evidence in this
report we have not used the same assumption as used in the NOHSC report, that the rates of
occupational fatal injury for employees and self-employed workers are similar within a given
industry.
21. This report examined ILO reported inclusion and exclusion criteria for each country to determine
how self-employed workers are treated in each country’s official occupational fatal injury data.
The availability of occupational fatal injury data by self-employment status was determined to
assess the possibility of adjusting incidence rates to account for differences in the inclusion of
self-employed workers. No data was found to be readily available to determine the composition
13
of the self-employed by industry within occupational fatal injury data. The implications of our
inability to adjust for national level differences in self-employment on the validity of
international comparisons of occupational fatal injury performance will be considered further in
the discussion.
Exclusion of road traffic occupational fatal injuries
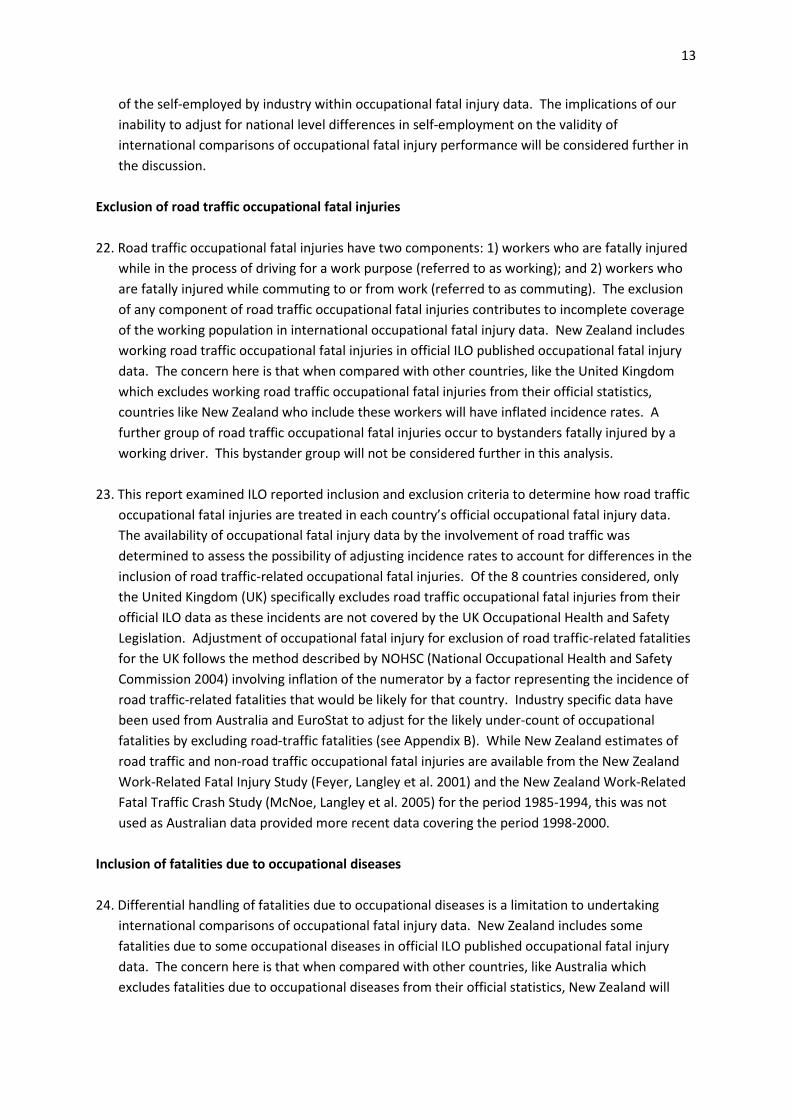
22. Road traffic occupational fatal injuries have two components: 1) workers who are fatally injured
while in the process of driving for a work purpose (referred to as working); and 2) workers who
are fatally injured while commuting to or from work (referred to as commuting). The exclusion
of any component of road traffic occupational fatal injuries contributes to incomplete coverage
of the working population in international occupational fatal injury data. New Zealand includes
working road traffic occupational fatal injuries in official ILO published occupational fatal injury
data. The concern here is that when compared with other countries, like the United Kingdom
which excludes working road traffic occupational fatal injuries from their official statistics,
countries like New Zealand who include these workers will have inflated incidence rates. A
further group of road traffic occupational fatal injuries occur to bystanders fatally injured by a
working driver. This bystander group will not be considered further in this analysis.
23. This report examined ILO reported inclusion and exclusion criteria to determine how road traffic
occupational fatal injuries are treated in each country’s official occupational fatal injury data.
The availability of occupational fatal injury data by the involvement of road traffic was
determined to assess the possibility of adjusting incidence rates to account for differences in the
inclusion of road traffic-related occupational fatal injuries. Of the 8 countries considered, only
the United Kingdom (UK) specifically excludes road traffic occupational fatal injuries from their
official ILO data as these incidents are not covered by the UK Occupational Health and Safety
Legislation. Adjustment of occupational fatal injury for exclusion of road traffic-related fatalities
for the UK follows the method described by NOHSC (National Occupational Health and Safety
Commission 2004) involving inflation of the numerator by a factor representing the incidence of
road traffic-related fatalities that would be likely for that country. Industry specific data have
been used from Australia and EuroStat to adjust for the likely under-count of occupational
fatalities by excluding road-traffic fatalities (see Appendix B). While New Zealand estimates of
road traffic and non-road traffic occupational fatal injuries are available from the New Zealand
Work-Related Fatal Injury Study (Feyer, Langley et al. 2001) and the New Zealand Work-Related
Fatal Traffic Crash Study (McNoe, Langley et al. 2005) for the period 1985-1994, this was not
used as Australian data provided more recent data covering the period 1998-2000.
Inclusion of fatalities due to occupational diseases
24. Differential handling of fatalities due to occupational diseases is a limitation to undertaking
international comparisons of occupational fatal injury data. New Zealand includes some
fatalities due to some occupational diseases in official ILO published occupational fatal injury
data. The concern here is that when compared with other countries, like Australia which
excludes fatalities due to occupational diseases from their official statistics, New Zealand will

14
have inflated incidence rates as the numerator will be higher than considering just fatalities due
to occupational injury events alone.
25. In the NOHSC report it was assumed that “only data for injuries are included in each country’s
data supplied to the ILO” as the ILO requests only data on occupational accidents. The validity of
this assumption was reviewed for this analysis using available ILO supplementary information on
occupational fatal injury data and country specific statistics available on Health and Safety
Agency websites. Current ILO supplementary data indicate this previous assumption is not valid.
26. Data is not readily available to remove fatalities due to occupational disease from official ILO
data. The implications of our inability to adjust for national level differences in the inclusion of
occupational disease fatalities on the validity of international comparisons of occupational fatal
injury performance will be considered further in the discussion.
Appropriate denominator data
27. When making international comparisons of occupational injury rates it is important to consider
exactly what is included in the denominator data. The ideal denominator is the estimated
working population that the fatal injury data is captured from. When calculating occupational
fatal injury incidence rates the numerator (count of fatal injuries) and denominator (estimated
working population) should have the same coverage of the working population. For example, if
the numerator excludes self-employed workers, the denominator should exclude these workers.
Likewise, if a country excludes armed forces from their numerator, these workers should be
excluded from the denominator. Specific denominator data in relation to the working
population covered by each country’s official occupational fatal injury data collection system
were unavailable on the ILO databases so we have been unable to assess the degree to which
each country’s denominator represents the population the numerator is drawn from.
28. As most countries exclude some group of workers, be they the self-employed (like Australia) or
workers from a specific occupation or industry group (like the UK), the denominator is often not
the total number of economically active workers (employees, employers and the self-employed)
for a country. Denominator data was required for the standardisation analysis (see Appendix C
for method). Since denominator data was unavailable on the ILO databases, country specific
denominators were derived from non-fatal injury cases and non-fatal incidence rates available
on the ILO databases. Non-fatal ILO statistics were used over the fatal statistics as the non-fatal
ILO data provided larger numbers giving extra precision for deriving the denominator. This
approach replicated that used by NOHSC. The source of denominator data for New Zealand was
from the ILO.
Differences in industry composition
29. Fatal injuries are more common in some industries than in others. High risk industries in New
Zealand include agriculture, forestry and fishing, mining, construction, and transport (Feyer,
Langley et al. 2001; McNoe, Langley et al. 2005). The industrial composition of a country will
directly influence the number of occupational fatal injuries. For instance, countries with a high

15
proportion of workers employed in high risk industries like New Zealand will usually have a
higher occupational fatal injury rate compared with countries with a higher proportion of
workers employed in low-risk industries.
30. To adjust for differences in industry composition, each comparison country’s data is standardised
to the New Zealand industry composition using a direct standardisation method.
Standardisation statistically gives each country in this comparison a similar industry composition
to a standard population. Therefore, in this analysis each comparison country’s data is weighted
to reflect New Zealand’s industry composition. Although industry standardised rates are useful
in relative comparisons across countries such as this, their absolute values cannot be used in
isolation.
31. The approach taken in this analysis was identical to that used by NOHSC (National Occupational
Health and Safety Commission 2004) where the data were standardised by removing the
influence of the varying industry profiles that exist in the 8 comparison countries, providing a
single adjusted rate that can be directly compared between countries. Direct standardisation
using the New Zealand population to standardise the industry specific rates in each country was
employed in this analysis, as was used by NOHSC (National Occupational Health and Safety
Commission 2004). This approach reduces the influence of industry particularly when industry
level data are large or considered reasonably stable (National Occupational Health and Safety
Commission 2004).
32. Standardisation involves using the number of fatalities and relevant employment denominator
for each industry to calculate industry-specific incidence rates for each country. This is used to
calculate an expected number of deaths for each specific industry in the New Zealand (Standard)
population. The direct standardised rate for each country is then calculated using the sum of the
expected deaths for each country. Appendix C describes the direct standardisation method in
more detail.
The use of differing industry classifications
33. To allow for standardisation of occupational fatal injury incidence rates by industry composition
the industry classification needs to be identical between countries. To avoid potential
differences in industry classifications by country, data classified to ISIC3 were used from each
country.
34. Not all OECD countries, however, provide data to the ILO by each ISIC3 major classification
category. A case in point is the United States that collapsed ISIC3 major classification categories
into groupings like A-B (A - Agriculture, Hunting and Forestry, and B - Fishing) and O-P (O-Other
community, social services and personal services, and P-Households with employed persons)
rather than presenting each major industry category. This creates difficulties in creating
standardised rates for comparison across countries, especially when there is no uniform
approach to which categories are collapsed. Where data is not available by individual ISIC3
major industry classification category standardisation has not been undertaken due to data
incompatibility. This applies to data from the United States, Ireland, Germany and Switzerland

16
so these countries were removed from this comparative analysis. Australia combines data for
industry classifications A–Agriculture, Hunting and Forestry and B-Fishing. To allow Australia to
be included in this comparison the industry classifications A and B were combined for the other 8
countries.
35. Almost universally data were missing for industry classifications P – Households with employed
person and X-Not classifiable by economic activity. For all 9 countries included in this analysis
these two industry classifications were removed.
Differences in firm size composition
36. Employees in small sized firms generally have a greater risk of occupational fatal injury
(Sorensen, Hasle et al. 2007), although this has not been specifically confirmed with New Zealand
data. New Zealand is predominantly a nation of small firms with around 97% of all firms
employing 20 or fewer employees (Legg, Battisti et al. 2009). The composition of different sized
firms within each country will influence the number of occupational fatal injuries in the
numerator.
37. ILO data on the distribution of firm size by industry was not readily available to adjust for country
level differences in firm size composition in this analysis. As we are unable to adjust for
differences in firm size composition by country we cannot rule out that differences in firm size
may partly explain why some countries experience better or worse occupational fatal injury rates
for certain industries. The implications of our inability to adjust for national level differences in
firm size composition on the validity of international comparisons of occupational fatal injury
performance will be considered further in the discussion.
17
Results
Comparison of scope of ILO occupational fatal injury data
38. There is wide variability in the types of working persons, economic activities and geographical
areas covered by each country’s occupational fatal injury data. Table 1 presents the data scope
of the ILO occupational fatal injury data for the 9 comparison countries included in this analysis.
Table 2 presents the detailed comparison of the scope of personal, economic activities and
geographical areas covered by each comparison country’s ILO published data.
Coverage of working population
39. ILO data for New Zealand’s occupational fatal injury experience represents 100% of the
economically active working population (Table 1). Although none of the 8 comparison countries
have complete coverage of the working population to the same extent as New Zealand, Norway
(98%), Sweden (97%) and the UK (96%) come close. The remaining 5 countries have coverage
rates below 90% of their total working populations. Common types of economically active
workers excluded are self-employed workers, as they may not be covered by the insurance
scheme the national occupational fatal injury surveillance is derived from. Common economic
activities that are excluded across the 8 comparison countries examined include the Defence
Forces (Australia, Canada, Norway, Spain and Sweden), and public administration and service
workers (France, Norway and Spain).
40. New Zealand’s ILO published occupational fatal injury data is derived from compensated injury
claims. Five other countries (Australia, Canada, Finland, France, and Spain) also derive their
official ILO data from injury insurance schemes, presenting data on compensated injury.
Reported notification to injury surveillance systems is where the remaining 3 countries (Norway,
Sweden and the UK) source their occupational fatal injury data. Coverage of the working
population by compensation systems is generally substantially higher than the coverage
obtained by Occupational Health and Safety agency notifications systems (Langley, Feyer et al.
2000; Driscoll, Mitchell et al. 2003).
Self-employment
41. ILO occupational fatal injury data for New Zealand includes self-employed workers (Table 2).
Sweden is the only other country in this current comparison to include self-employed workers.
We have been unable to determine from ILO supplementary data if the data for France includes
self-employed workers, however, given that the data for France covers 75% of the working
population it is likely self-employed workers are amongst those who are excluded from the data.
The remaining 6 countries exclude some groups of self-employed workers, such as Norway that
excludes self-employed workers if they are outside the agriculture or construction industries.
Occupational disease
42. Three countries (New Zealand, Canada and Norway) report the inclusion of fatalities due to some
occupational disease in data submitted to the ILO in relation to occupational fatal injury (table
2). According to ILO supplementary information, New Zealand includes “occupational diseases,
defined as personal injury caused by gradual process, disease or infection arising out of and in

18
the course of employment are included in the statistics” including fatalities due to inhalation
diseases (asbestos), brucellosis, dermatitis, hepatitis, leptospirosis, and other occupational
disease (other gradual process disease or infection). The remaining 6 countries exclude
occupational disease from their numerator.
Road traffic occupational fatal injuries
43. Road traffic occupational fatal injuries have two components: 1) workers who are fatally injured
while in the process of driving for a work purpose (referred to as working); and 2) workers who
are fatally injured while commuting to or from work (referred to as commuting). All countries,
except the UK, include working road traffic occupational fatal injuries in their data (table 2). This
analysis inflated the UK figures to take account of the undercount in working road traffic
occupational fatal injuries in comparison to all other countries included.
44. While we were able to adjust the UK figure to address the exclusion of working road traffic
occupational fatal injuries, no account has been taken of differences in commuting road traffic
occupational fatal injuries. New Zealand includes fatal injury cases if the commuting road traffic
crash occurred with a work vehicle. Sweden is the only other country to include commuting
cases as well with the remaining 7 comparative countries excluding these fatalities.

19
Table 1: Data sources and scope of published ILO occupational fatal injury data for the 9 comparative countries.
(Source: ILO LABORSTA http://laborsta.ilo.org/)
*New Zealand does not supply an incidence rate to the ILO, rather numbers of fatal cases. An incidence rate has been calculated for New Zealand using ILO
published economic activity data as the denominator.
1 – Coverage rate refers to the proportion of the working population covered by the relevant national occupational fatal injury data collection system
2 - Data available on published ILO electronic database LABOURSTA with industry classification coded to ISIC3.
Country Source of data Coverage
rate1
Per
100,000
Data
availability2
Reference
period
Scope
(Persons, economic activities and geographical areas covered)
Australia Compensated
injury
83% Workers to 2008 Financial
year
Excl. some self-employed, armed forces, other groups not covered
by legislation, Australian Capital Territory, occupational diseases,
commuting.
Canada Compensated
injury
81% Employees to 2008 Calendar
year
Incl. occupational disease.
Excl. some self-employed, military, commuting.
Finland Compensated
injury
85% Workers to 2008
Calendar
year
Excl. some self-employed, occupational disease, commuting.
France Compensated
injury
75% Insured
workers
to 2007 Calendar
year
Excl. commuting, occupational diseases, public administration &
services. Insufficient information to determine if self-employed
workers are included or excluded.
Norway Reported
injury
98% Workers to 2008 Calendar
year
Incl. unpaid family & self-employed in construction & agriculture,
some occupational diseases.
Excl. commuting.
New Zealand* Compensated
injury
100% Workers to 2008 Financial
year
Incl. self-employed, some occupational diseases, commuting
accidents if transport provided by work.
Spain Compensated
injury
81% Insured
workers
to 2008 Calendar
year
Excl. some self-employed, state administration & armed forces.
Sweden Reported
injury
97%
Workers to 2008 Calendar
year
Incl. self-employed, some commuting.
UK Reported
injury
96% Employees to 2006 Financial
year
Excl. self-employed, merchant shipping, air transport, road traffic
accidents, occupational disease, commuting.

20
Table 2: Detailed comparison of scope of ILO published occupational fatal injury data for the 9 comparative countries.
(Source: ILO LABORSTA http://laborsta.ilo.org/)
Country
Case inclusion Persons
Economic activities
Geographical areas Occupational
Disease
Road traffic injury Self-employed Other persons
covered
New Zealand Yes Yes
Plus work vehicle
commuting
Yes Unpaid family
workers, apprentices
and trainees
All covered All areas covered.
Includes persons working
overseas if NZ resident and
earnings taxable in NZ
Australia No Yes
Excl. commuting
Some excluded ? Excludes the armed
forces and other groups
not covered by general
workers’ compensation
legislation
Excludes the Australian
Capital Territory.
Excludes persons working
overseas
Canada Yes Yes
Excl. commuting
Some excluded ? Excludes the armed
forces
All areas covered. Some
persons working overseas
included if covered by
worker’s compensation
Finland No Yes
Excl. commuting
Some excluded Includes trainees and
apprentices
All covered.
Statistics for farmers
compiled & published
separately
All area covered. Includes
persons working overseas
if employer registered in
Finland
France No Yes
Excl. commuting
? ? Excludes public
administration and
service workers
Whole country, overseas
departments and
territories excluded
Norway Some included Yes
Excl. commuting
Some excluded
(other than
agriculture or
construction)
Unpaid family workers Excludes state
administration workers
and armed forces
All areas covered.
Covers citizens normally
resident in country and
persons working on
Norwegian ships

21
Spain ? Yes
Plus commuting
Some excluded
(other than
agriculture &
fishing)
? Excludes state
administration workers
and armed forces
All areas covered.
Includes person working
overseas if contribute to
social security
Sweden No Yes
Plus some
commuting
Yes Family workers,
apprentices and
trainees
All covered All areas covered. Includes
persons working overseas
(up to 1 yr) if sent by
Swedish company
United Kingdom No No
Excl. commuting
No Apprentices, trainees
and members of
public injured as a
bystanders to
another’s work
Excludes sea fishing,
merchant shipping and
air transport
All areas covered. Excludes
person injured outside the
country
Key: ? indicates information not specifically stated in ILO supplementary materials.

22
Comparison of non-standardised occupational fatal injury rates
45. Without taking account of industry composition differences, it is clear there is a large amount of
variation in ILO published occupational fatal injury rates between the 9 comparison countries.
Table 3 presents non-standardised occupational fatal injury incidence rates averaged over the 4
year period 2005-2008 by industry classification for the 9 countries included in this analysis.
46. In terms of total non-standardised fatal injury incidence rate New Zealand had a 4 year average
rate of 4.2 occupational fatal injuries per 100,000 person years. Prior to adjustment for industry
composition this is the highest occupational fatal injury incidence rate for the 9 established
market economies examined in this analysis. The lowest rates (below 2.0 occupational fatal
injuries per 100,000 person years) were found in Finland, Sweden, Norway and the UK.
47. Table 4 presents the relative ranking of non-standardised occupational fatal injury incidence
rates by industry classification. When comparing the relative ranking of New Zealand’s non-
standardised occupational fatal injury incidence rates New Zealand performs in the lowest half of
the rankings for 8 of 13 ISIC industry classifications examined in this analysis. Industries in which
New Zealand ranked in the lowest half of the relative rankings for all 9 comparative established
market economies were:
A - Agriculture, Hunting & Forestry + B-Fishing: New Zealand ranked 7th
with 12.4 fatalities
per 100,000 person years. Norway (15.2 fatalities) and Sweden (17.4 fatalities) have higher
occupational fatal injury rates for these industries. New Zealand includes self-employed
workers in official ILO data, and with this sector containing a high proportion of self-
employed workers. Self-employed workers constitute over 35% of the Agriculture sector in
New Zealand. It is likely that New Zealand’s Agricultural occupational fatal injury rate will be
inflated compared with countries that exclude self-employed workers in Agriculture.
Further research is warranted on the impact of self-employment in this industry.
C - Mining & Quarrying: New Zealand had the highest fatality rate in this industry with 38.7
fatalities per 100,000 person years ranking 9th
out of the 9 countries examined. Mining
represents the highest risk industry for New Zealand. The best performing countries were
Norway (5.9 fatalities) and Australia (6.1 fatalities). For New Zealand, a small number of
mining fatalities in a small mining workforce mean that these rates can fluctuate widely. The
inclusion of occupational disease may also inflate the numerator for New Zealand, as
inhalation occupational diseases could be more prevalent in this sector.
D - Manufacturing: New Zealand had the highest fatality rate in this industry with 6.1
fatalities per 100,000 person years ranking 9th
out of the 9 countries examined. Finland (1.4
fatalities) and Sweden (1.5 fatalities) had the lowest rates. The reason for New Zealand’s
higher rate in this sector is not obvious. Future analyses could examine the impact of self-
employment, occupational disease and small firm size as possible explanations.
E - Electricity, Gas & Water Supply: New Zealand had the highest fatality rate in this industry
with 18.7 fatalities per 100,000 person years ranking 9th
out of the 9 countries examined.
The best performing countries were Finland (1.9 fatalities) and Sweden (1.1 fatalities).

23
Similar to the Mining and Quarrying sector, the Electricity, Gas and Water Supply sector has
a small workforce and a small number of annual fatalities resulting in fluctuations of rates.
F - Construction: New Zealand ranked 9th
out of the 9 countries compared with an
occupational fatal injury rate of 15.3 per 100,000 person years. Australia (4.4 fatalities) and
Norway (4.4 fatalities) had the lowest rates in this sector. New Zealand include self-
employed workers in official ILO data, and with this sector containing a high proportion of
self-employed workers, over 35% of the Construction sector in New Zealand. It is highly
likely that the magnitude of difference in occupational fatal injury rates when compared
with countries that exclude self-employed workers in Construction is over-estimated.
Further research is warranted on the impact of self-employment in this industry.
J - Financial Intermediation: There are few deaths in this sector, however New Zealand
ranked 8th
with 0.7 fatalities per 100,000 person years. The best performing countries were
Finland, Sweden and Norway with no fatalities reported in this sector. Given that in the New
Zealand context this is a small sector, it is not a significant contributor to the total burden of
occupational injury in New Zealand. Future analyses should examine commuting road traffic
injuries as a potential confounder to inform future international comparisons of
occupational safety performance in this industry.
L - Public Administration & Defence: At face value New Zealand ranked 8th
with 3.2 fatalities
per 100,000 person years. Given four countries (Australia, Canada, Norway and Spain)
exclude the Defence Forces and three countries (France, Norway, and Spain) exclude Public
Administration workers for their official ILO data comparisons of New Zealand’s
performance to these countries are misleading as New Zealand includes Defence Forces and
Public Administration workers. Future analyses should examine rates with harmonised
datasets in this industry classification.
G - Wholesale and Retail trade: New Zealand ranked 6th
out of the 9 comparison countries
with 1.1 fatalities per 100,000 person years. Overall the rates of fatal injury for this sector
are low as there are low numbers of death in Wholesale and Retail trade.
48. One further sector of concern is the I- Transport, Storage and Communication industry sector.
New Zealand ranked 4th
with 6.9 fatalities per 100,000 person years in this industry. While this is
a good ranking compared with other countries the rate itself is high and contributes to the
overall burden of occupational fatal injury in New Zealand. Investigation of the influence of self-
employment, commuting and firm size in this industry should be undertaken to inform future
occupational health and safety interventions.

24
Table 3: Non-standardised occupational fatal injury incidence rates by industry and total working population for the 9 comparative countries averaged over
the period 2005-2008.
Non-Standardised Fatal Occupational Injury Incidence Rate (per 100,000 person years)
ISIC3 NZ Australia Canada Finland France1 Norway Spain Sweden UK
2
A-Agriculture, Hunting
& Forestry + B-Fishing
12.4 11.8 10.3 3.9 5.6 15.2 4.7 17.4 9.8
C-Mining & Quarrying 38.7 6.1 11.9 15.0 15.3 5.9 33.5 13.1 19.0
D-Manufacturing 6.1 2.7 2.9 1.4 3.1 2.6 4.4 1.5 1.8
E-Electricity, Gas &
Water Supply
18.7 2.5 6.0 1.9 3.8 3.0 10.2 1.1 2.0
F-Construction 15.3 4.4 9.3 7.6 10.1 4.4 12.0 5.0 5.7
G-Wholesale & Retail
Trade
1.1 0.8 1.4 1.0 2.0 0.5 1.7 0.8 0.4
H-Hotels & Restaurants 0.3 0.5 0.4 0.5 1.3 0.3 0.5 0.2 0.2
I-Transport, Storage &
Communication
6.9 9.0 7.8 7.8 8.7 4.3 13.4 4.1 6.3
J-Financial
Intermediation
0.7 0.1 0.1 0.0 0.7 0.0 0.4 0.0 0.1
K-Real Estate, Renting &
Business Activities
0.9 1.5 0.8 1.1 2.2 0.9 1.3 0.8 0.5
L-Public Administration
& Defence
3.2 1.4 2.4 3.5 0.9 1.2 1.0 2.2 0.6
M-Education 0.3 0.4 0.3 0.4 0.9 0.0 0.4 0.1 0.2
N-Health & Social Work
+ O-Other Community
0.7 0.9 0.8 0.7 1.5 0.4 1.0 0.5 0.6
TOTAL 4.2 2.1 2.7 2.0 3.0 1.7 3.9 1.6 1.3
1 – ILO data only available for period 2005-2007. 2 – ILO data available for 2005-2006.

25
Table 4: Relative ranking of safety performance using non-standardised fatality rates by industry for the 9 comparative countries, averaged over the period
2005-2008.
Non-Standardised Fatal Occupational Injury Incidence Rate (per 100,000 person years)
ISIC3 NZ Australia Canada Finland France1 Norway Spain Sweden UK
2
A-Agriculture, Hunting
& Forestry + B-Fishing
12.4
7
11.8
6
10.3
5
3.9
1
5.6
3
15.2
8
4.7
2
17.4
9
9.8
4
C-Mining & Quarrying 38.7
9
6.1
2
11.9
3
15.0
5
15.3
6
5.9
1
33.5
8
13.1
4
19.0
7
D-Manufacturing 6.1
9
2.7
5
2.9
6
1.4
1
3.1
7
2.6
4
4.4
8
1.5
2
1.8
3
E-Electricity, Gas &
Water Supply
18.7
9
2.5
4
6.0
7
1.9
2
3.8
6
3.0
5
10.2
8
1.1
1
2.0
3
F-Construction 15.3
9
4.4
1=
9.3
6
7.6
5
10.1
7
4.4
1=
12.0
8
5.0
3
5.7
4
G-Wholesale & Retail
Trade
1.1
6
0.8
3=
1.4
7
1.0
5
2.0
9
0.5
2
1.7
8
0.8
3=
0.4
1
H-Hotels & Restaurants 0.3
4
0.5
6=
0.4
5
0.5
6=
1.3
9
0.3
3
0.5
6=
0.2
1=
0.2
1=
I-Transport, Storage &
Communication
6.9
4
9.0
8
7.8
5=
7.8
5=
8.7
7
4.3
2
13.4
9
4.1
1
6.3
3
J-Financial
Intermediation
0.7
8=
0.1
4=
0.1
4=
0.0
1=
0.7
8=
0.0
1=
0.4
7
0.0
1=
0.1
4=
K-Real Estate, Renting &
Business Activities
0.9
4=
1.5
8
0.8
2=
1.1
6
2.2
9
0.9
4=
1.3
7
0.8
2=
0.5
1
L-Public Administration
& Defence
3.2
8
1.4
5
2.4
7
3.5
9
0.9
2
1.2
4
1.0
3
2.2
6
0.6
1
M-Education 0.3
4=
0.4
6=
0.3
4=
0.4
6=
0.9
9
0.0
1
0.4
6=
0.1
2
0.2
3
N-Health & Social Work
+ O-Other Community
0.7
4=
0.9
7
0.8
6
0.7
4=
1.5
9
0.4
1
1.0
8
0.5
2
0.6
3
TOTAL 4.2
9
2.1
5
2.7
6
2.0
4
3.0
7
1.7
3
3.9
8
1.6
2
1.3
1
Ranking 1-best to 9 – worst. Shaded cells indicate worst performing country for each ISIC3 industry classification.
1 – ILO data only available for period 2005-2007. 2 – ILO data available for 2005-2006.
26
Comparison of industry standardised occupational fatal injury rates
49. Industry standardised total occupational fatal injury incidence rates for the period 2005-2008 are
shown in Table 5. Compared to the non-standardised incidence rates, once standardised to the
New Zealand industry distribution the standardised incidence rates increased for all countries
examined, with the exception of Spain where the standardised incidence rate declined.
However, standardisation did not change New Zealand’s overall ranking.
Table 5: Standardised occupational fatal injury incidence rate for the 9 comparative countries
averaged over the period 2005-2008.
Country Non-Standardised
Incidence Rate
per 100,000 person years
Industry Standardised
Incidence Rate
per 100,000 person years
95% Confidence Interval
for Standardised Rate
New Zealand 4.2 4.2 3.7,4.6
Australia 2.1 2.7 2.4,2.9
Canada 2.7 3.0 2.9,3.2
Finland 2.0 2.2 1.7,2.6
France1 3.0 3.2 2.7,3.7
Norway 1.7 2.4 2.0,2.8
Spain 3.9 3.5 3.3,3.6
Sweden 1.6 2.6 2.2,2.9
UK2 1.3 2.1 1.8,2.3
1 – based on 3 years data 2005-07. 2 – based on 2 years data 2005-06 and inflated to include work
road traffic fatalities.
50. Figure 1 shows the non-standardised and standardised occupational fatal injury incidence rates
for each of the 9 countries included in this comparison. After standardisation the UK and the 3
Nordic countries of Norway, Sweden and Finland perform the best, with the lowest of
occupational fatal injury incidence rates in the period 2005-2008.
51. The rate of occupational fatal injury for New Zealand of 4.2 fatal occupational injuries per
100,000 person years was 2 times greater than that of the best performing country, the UK with
an industry standardised incidence rate of 2.1 fatal occupational injuries per 100,000 person
years.
52. Figure 1 also shows the 95% confidence intervals around both the non-standardised and
standardised occupational fatal injury incidence rates for each of the 9 countries included in this
comparison. A 95% confidence interval is an estimate of the range of values the likely true rate
of occupational fatal injury incidence is contained within. The 95% confidence intervals for the
standardised rates indicate that New Zealand has a significantly higher fatality rate than each of
the comparison countries following industry standardisation, with the exception of France which
has an overlapping interval to New Zealand.

27
Figure 1: Non-standardised (unadjusted) and standardised (adjusted) occupational fatal injury
incidence rates for the 9 comparative countries averaged over the period 2005-2008. (Data for
France based on 3 years data 2005-2007 and data for UK based on 2 years data 2005 & 2006. UK
figures inflated to include work road traffic fatalities.)
0
1
2
3
4
5D
ea
ths p
er
100
,000
pers
on
ye
ars
Au
str
alia
Can
ad
a
Fin
land
Fra
nce
New
Ze
ala
nd
Norw
ay
Sp
ain
Sw
ed
en
UK
Unadjusted rate Adjusted rate
95% CI

28
EuroStat standardisation of European Union (EU) members
53. EuroStat undertakes industry standardisation of occupational fatal injury data for EU member
countries. This data provides an opportunity to validate the relative order of 6 of our 9
comparison countries who are members of the EU. Table 6 presents the EuroStat standardised
rates of occupational non-traffic fatal injury incidence rates for these 6 EU member countries
and the industry standardised fatal incidence rate we calculated for 2005-2008 (including traffic
fatalities). While data is not available for Norway, the relative rank order for these 5 EU member
countries of occupational non-traffic fatal injury incidence rates was very similar to that obtained
in our standardisation process with the UK and Finland reporting the two lowest incidence rates
and France and Spain with the two highest incidence rates.
Table 6: Standardised incidence rate of occupational fatal injury of EU member states, excluding
road traffic accidents and accidents on board transport in the course of work (EuroStat, 2009)
54. In order to allow for direct standardisation across EU member states the EuroStat
standardisation process removes all road-traffic related fatal occupational injuries, and certain
industries (such as fishing, mining and public sectors) where EU member states do not capture
data on these sectors of economic activity. Furthermore the standard population EuroStat uses
may have a lower risk profile than the New Zealand standard population used in our analysis,
resulting in lower standardised rates for the EuroStat analysis. The EuroStat standardised
incidence rates are therefore much lower than those calculated for the ILO published data.
These EuroStat data, however, do support the general findings of our standardisation process
with regards to the relative ranking of the 5 EU member states.
EU member
state
EuroStat industry
standardised incidence
rate
(2009)
EuroStat industry
standardised
relative ranking
(2009)
Industry
standardised
relative ranking
(2005-2008)
Finland 1.1 2 2
France 2.1 5 4
Norway Not available Not Available Not Applicable
Spain 2.0 4 5
Sweden 1.2 3 3
UK 0.6 1 1
29
Discussion
Comparison of non-standardised occupational fatal injury incidence rates
55. Comparisons of non-standardised data by individual ISIC3 major industry classification identified
industries where New Zealand appeared to perform poorly relative to 8 established market
economies. Industries where New Zealand ranked poorly included: Agriculture, Hunting,
Forestry and Fishing; Mining and Quarrying; Manufacturing; Electricity, Gas and Water Supply;
Construction; Financial Intermediation; Public Administration and Defence; and Wholesale and
Retail trade.
56. However, substantial differences in the case inclusion criteria, especially around the inclusion of
the self-employed and occupational disease, may explain some of the industry specific
differences between New Zealand and the 8 comparison countries. Direct comparison of
industry specific rates without adjustment for differences in case inclusion criteria that exist
between all 8 comparison countries can, at best, be considered to be very crude and are not
advised.
57. Further analysis and research is warranted to examine reasons for possible differences in these
industry specific rates of occupational fatal injury. Previous analysis of harmonised data for New
Zealand, Australia and the USA found New Zealand had the poorest occupational safety
performance overall, particularly in the following sectors: 1) Agriculture, Forestry and Fishing, 2)
Mining, 3) Construction, and 4)Transport, Storage, Communication and Public Utilities (Feyer,
Williamson et al. 2001). The magnitude of difference between New Zealand with Australia and
the USA was smaller than when comparing non-harmonised data. It is clear that the use of
harmonised case inclusion criteria (numerator data) would produce a different comparative
pattern of poorly performing industries for occupational safety.
Comparison of industry standardised occupational fatal injury incidence rates
58. Comparison of standardised occupational fatal injury incidence rates, averaged over the 4 year
period 2005-2008, indicates that New Zealand still had the poorest reported occupational safety
record of the 9 established market economies considered. New Zealand had an incidence rate 2
times that of the best performing country of the UK. Due to differences in labour force coverage
and varying case definitions of occupational fatal injury data used by the 8 comparison countries,
each country’s data represent a lower proportion of the total burden of occupational fatal injury.
Therefore, with regard to the total burden of occupational fatal injuries each of the 8
comparison countries under-estimate the true situation.
59. This analysis demonstrated that adjusting for differences in industry composition is important for
international comparisons as the occupational fatal injury rates for all comparison countries
except Spain increased, thus reducing the gap in reported occupational safety performance with
New Zealand.
60. Other differences in the labour force coverage and case definition may explain the lower
occupational safety performance for New Zealand. However, based on a comparison of
harmonised data between the US, Australia and New Zealand (Feyer, Williamson et al. 2001), it is
likely that New Zealand’s occupational fatal injury rate will remain higher. For instance, our
30
analysis found New Zealand has a rate 55% higher than the Australian rate for the 4 year average
period 2005-2008, while harmonised data (ie. gold standard) reported the New Zealand rate was
10-15% higher for the period 1985-1994 (Feyer, Williamson et al. 2001). Therefore, we conclude
that ILO data is likely to over-estimate the magnitude of differences in occupational fatal injury
rates between New Zealand and the other 8 comparison countries. The true difference in rates,
adjusted or otherwise, remains elusive.
Limitations to comparisons of occupational fatal injury incidence rates
61. There are a number of significant data limitations that need to be taken into account with
regards to the validity of the comparisons. New Zealand has a high level of data coverage of the
labour force and an inclusive case definition of occupational fatal injury that makes direct
comparison with other countries, particularly those with poorer coverage of the working
population and/or restrictive definitions of occupational fatal injury, extremely problematic. The
main areas of concern investigated in this report are: 1) the coverage of the working population,
2) the inclusion of self-employed workers, 3) fatalities due to occupational disease and 4)
fatalities due to commuting. Other differences in the scope of occupational fatal injuries
included in the data, such as the exclusion of economic activities, differing reference periods
(financial or calendar year) and the inclusion of other workers like unpaid family workers, also
exist. However, these have not been considered due to the absence of readily available
information on which to assess these potential differences in capture and reporting.
62. New Zealand’s occupational fatal injury data includes fatalities in self-employed workers,
fatalities due to occupational disease and some commuting road traffic occupational fatal
injuries (if the vehicle is owned by work). Each extra inclusion is likely to increase New Zealand’s
estimates of occupational fatal injury relative to countries that exclude these groups. Therefore,
direct comparisons of occupational safety performance using non-harmonised or non-
standardised occupational fatal injury data amongst countries with differing reporting of
occupational fatal injury can be misleading. The following sections (63-68) detail how these
comparisons can be misleading.
Coverage of the working population
63. All 9 countries included in this comparison calculate an “incidence” rate of occupational fatality,
reflecting the total working population represented by the data. However, the source of
occupational fatal injury data differs by country. Some countries reported compensated
occupational fatal injury claims while others used data from notification reports. Even when at
face value those countries using compensated injury would appear to be directly comparable
there are likely to be considerable differences in the data captured by each scheme.
64. Each data source presents its own issues with regard to coverage of the working population. Use
of compensated injury claims can present problems due to incomplete coverage of the whole
working population by the insurance scheme (eg. Australian schemes only insure some self-
employed), through non-claiming of the compensable injuries and the non-inclusion of non-
compensable injury claims are likely to be a problem (Langley, Feyer et al. 2000). Reported data
as part of a legal notification scheme are also open to significant under-reporting, as they are in

31
New Zealand (Langley, Feyer et al. 2000). The implications of lower rates of coverage of the
working population are that occupational fatal injury rates for these countries are probably
under-estimated as significant groups of the working population are not included in the data.
For this analysis data were not readily available to be able to determine the level of under-
coverage by industry for each comparative country; therefore, it has not been possible to adjust
for incomplete coverage of official ILO published data in this analysis. On this basis, particular
caution must be given to direct comparisons between New Zealand and countries with lower
coverage of the working population, in this case Australia (83%), France (75%), Finland (85%),
Canada (81%) and Spain (81%).
65. Completeness of capture of the data collection system has an impact on the number of fatal
injury cases included in official ILO data. For example, despite New Zealand reporting 100%
working population coverage we know ACC compensated injury claims do not capture all
occupational fatal injuries in New Zealand, where the rate of capture of occupational fatal
injuries was estimated at 63% in the period 1985-1994 (Langley, Feyer et al. 2000). We have
been unable to determine the impact of the completeness of capture of the data collection
system on occupational fatal injury data and subsequently on comparisons between countries.
Inclusion of self-employed workers
66. The ability to undertake direct comparison of occupational fatal injury rates when groups of self-
employed workers are missing from the data is limited. Countries which exclude self-employed
workers will potentially under-estimate their occupational fatal injury rates. While Australian
coronial data indicates that the self-employment per se doesn’t carry any additional risk for
occupational fatal injury above the risks associated with industry (Driscoll, Healey et al. 2003),
the experience may differ by country, as observed in the USA (Mirabelli, Loomis et al. 2003).
The NOHSC report notes “that if self-employed workers are not distributed across a similar
industry pattern as employees, then the total employee fatal incidence rate for the selected
country may not be representative of the self-employed”(National Occupational Health and
Safety Commission 2004). This may be problematic for New Zealand where the agriculture and
construction industries have high numbers of self-employed, possibly inflating their overall
incidence rate in comparison to countries excluding the self-employed.
Fatalities due to occupational disease
67. The inclusion of occupational disease by New Zealand is a further important limitation of direct
comparison of occupational fatal injury rates using ILO data. ACC pays compensation for
approximately 4 deaths a year due to occupational cancer and asbestos related deaths (Driscoll,
Mannetje et al. 2004). Detailed individual level occupational fatal injury data obtained from ACC
for the same period for another surveillance purpose indicate an average of 11 fatalities per year
in the period 2005-2008 were due to gradual process injuries and disease (Gulliver, Cryer et al.
2011). The inclusion of an extra 4 -11 fatalities per year due to occupational disease in official
ILO data is small but given the small number of fatal injury cases included in New Zealand’s
numerator even a small number of cases will subsequently inflate incidence rates. Using the
range of estimates of 16-44 deaths due to occupational disease over the 4 year period examined,
removal of these deaths from the New Zealand data resulted in a drop in the standardised

32
incidence rate to between 3.6-4.0 fatalities per 100,000 person years. The inclusion of fatalities
due to occupational disease leads to over-estimation of the magnitude of difference between
New Zealand and other comparative countries that do not include fatalities due to occupational
disease. The figures presented in this industry standardised analysis are not adjusted for
fatalities due to occupational disease as more specific data is needed to adjust by industry, as
occupational disease fatalities are likely to be over-represented in industries with high risk for
occupational disease.
Fatalities due to commuting
68. It is difficult to know to what extent including cases of occupational fatal injury due to
commuting may inflate New Zealand’s rates of occupational fatal injury. New Zealand estimates
of occupational commuting fatal injuries from 1985-98 indicate road traffic and commuting
incidents combined contribute to 24-40% of the total burden of occupational fatal injuries
(McNoe, Langley et al. 2005). On average, in the period 1985-98, there were 13.7 occupational
fatal injuries due to commuting (McNoe, personal communication 20 February 2013), however
there are no estimates available of commuting incidents involving a work vehicle from this study
(McNoe, personal communication 20 February 2013). It is likely that the inclusion of even a
small number of fatalities due to commuting will inflate the incidence rate and lead to over-
estimation of the magnitude of difference between New Zealand and the other 7 comparative
countries that do not include fatalities due to commuting.
Summary of limitations
69. Although current data is not readily available to adjust for differences in labour force coverage
and case inclusion on the standardised rates of occupational fatal injury in this comparison, it is
clear that all these differences add up to make it difficult to make valid comparisons of New
Zealand data to other countries. Without taking account of differences in labour force coverage
and case inclusions the resulting comparison of industry standardised occupational fatal injury
rates are likely to over-estimate the difference between New Zealand and the 8 comparative
countries. Therefore, the true difference in rates, adjusted or otherwise, remains elusive.
Limitations to analytical approach
70. This analysis used industry classification data to standardise occupational fatal injury incidence
rates to the standard population of New Zealand. Variability in the groupings of ISIC3
classification data meant two high risk industries where merged for analysis in this comparison:
A-Agriculture, Forestry and Hunting with B-Fishing. This has resulted in us not being able to
individually compare these two industries which limit the comparability of occupational safety
performance by industry. Furthermore, the number of industries able to be examined was
restricted by a lack of availability of data for some industry classifications, particularly household
based workers (such as domestic cleaners). This further limits the extent to which industries can
be compared when data is not available for comparison. The lack of consistent provision of
industry classification data by individual major level ISIC3 classifications has resulted in a number
of countries being removed from this analysis. The main country that was removed was the
United States and this has meant that comparisons have been limited to a small number of
countries.

33
71. A further limitation of using industry standardisation to identify patterns of hazard exposures for
targeting intervention efforts is the assumption that exposures within an industry classification
are the same across countries. If the hazard exposures differ by country, for example for
agriculture or fishing, the difference in rates between countries may be explained by the
difference in hazard exposure rather than poorer occupational safety performance within a
specific industry. A standardisation approach to comparing industry level occupational safety
performance does not take account of any country level differences in hazard exposures within
industries.
72. Adjustment of UK occupational fatal injury data has been undertaken to inflate the UK figures to
take account of missing road traffic occupational fatal injury data. This approach used European
and Australian data from around the year 2000 as the basis to inflate the UK data, however,
mainland Europe and Australia may not be representative of UK road traffic occupational
fatalities. It is equally possible using relatively older data will not represent the current situation,
as the distribution of road traffic occupational fatal injuries may have changed over-time, but we
were unable to readily identify more recent data. The NOHSC report (National Occupational
Health and Safety Commission 2004) concluded that although it is not clear the extent of any
over or under-estimation using this approach, it is probably not very significant. Nevertheless,
while we have attempted to correct for the exclusion of road traffic occupational fatal injuries in
the UK data in the absence of any detailed UK data describing the ratio of road-traffic to non-
traffic occupational fatal injuries our assumptions may not be correct for the UK context.
73. While this analysis takes account of country differences in industry composition and working
road traffic occupational fatal injuries, it does not take account of many other differences in
labour force coverage and case inclusion between countries. At best, this industry standardised
analysis must be considered to be an industry adjusted guide to relative occupational safety
performance as this analysis is limited by a lack of qualification of other adjusting variables. The
most rigorous approach to undertaking comparisons of occupational fatalities is to create
harmonised data sets where an agreed set of data with universal definitions of occupational fatal
injury are used. Previous comparisons of occupational fatal injury rates between harmonised
data, official ILO data and global estimated figures (that take account of differences in reporting
and sources of data), show that compared to the gold standard of harmonised data, other
sources of occupational fatality data do not reflect the true situation (Feyer, Lilley et al. 2001).
Feyer et al (Feyer, Williamson et al. 2001) showed that harmonised occupational fatal injury data
eliminated, most large gaps between countries. While this current analysis standardised the 8
comparison countries to New Zealand on the basis of industry, many other adjustments are
needed to more accurately benchmark New Zealand’s occupational safety performance.
74. Given the serious limitations in standardising country level occupational fatal injury data to allow
for meaningful comparisons and benchmarking of occupational safety performance, there is a
strong need to understand the drivers of occupational safety performance within New Zealand.
This is at least as important as adjusting for exposures (like industry composition) compared to
another country. To understand occupational safety performance in New Zealand more
emphasis must be given to the completeness of data capture, data reliability and analysis of
quality occupational fatal injury data at the national level (Injury Prevention Research Unit and
New Zealand Environmental and Occupational Health Research Centre 1999).

34
Conclusion
75. While direct comparisons of international occupational fatal injury rates to benchmark
occupational safety performance relative to other market economies is appealing, there are
many pitfalls to this exercise. Significant differences in the definition of occupational fatal injury
exist in official ILO occupational fatal injury data. Therefore, a number of limitations need to be
acknowledged in relation to the coverage of the labour force and case inclusion criteria which
may over-estimate the differences in rates of occupational fatal injury in comparison to those
countries which include these cases.
76. Once standardised for industry composition, the relative ranking of New Zealand did not change,
with New Zealand maintaining the highest occupational fatality rate out of the 9 established
market economies considered in this comparison. However, the potential for under-estimation
of the true occupational fatal injury situation due to under-coverage of the labour force and
exclusion of certain groups of workers and types of occupational fatalities in the majority of
countries New Zealand was directly compared against means the current comparison in relative
occupational safety performance is potentially misleading.
Recommendations for improvements to occupational fatal injury statistics
77. Below are suggestions for improvements to New Zealand’s occupational fatal injury statistics
that arise from this comparison of ILO published occupational fatal injury data:
Recommendation 1: More consistent case inclusion criteria. The inclusion of occupational fatalities
due to occupational diseases and commuting road traffic injuries by New Zealand in our official
ILO data makes New Zealand particularly incomparable to many established market economies.
For the purposes of submitting New Zealand data to the ILO those occupational fatalities due to
occupational disease should be removed. While inclusion of occupational fatalities due to
commuting road traffic injuries in working vehicles captures a greater proportion of the total
burden of occupational fatal injuries, these fatalities should also be considered for removal from
official ILO data submissions and reviewed regularly to ensure this case exclusion is consistent
with the inclusion criteria of other countries we regularly compare ourselves against, as well as
ILO dataset guidelines.
Recommendation 2: Qualification of standardising variables. Better qualification of potential
adjusting variables, such as self-employment, is needed and this data could be made available in
official data sets. For example, a separate indication of how many fatalities in New Zealand
occur in self-employed workers by industry would allow for analyses to be undertaken excluding
self-employed workers for certain industries, improving the ability to create comparative
datasets with consistent case inclusion criteria.
Recommendation 3: Harmonised datasets. Establishment of consistent occupational fatal injury case
definitions between key countries New Zealand desires to make regular comparisons against
could be used to make international comparisons more valid. Harmonising datasets is rarely
undertaken as the process is very challenging and time consuming. Yet, when data is
harmonised, often a different pattern of occupational fatal injury is observed from that using
non-harmonised official ILO data (Feyer, Williamson et al. 2001). A regular programme of

35
international comparison using harmonised data should be instituted between key countries
New Zealand wishes to benchmark its Occupational Safety performance against.
Recommendations for further research
78. Below are suggestions for further research with the aim of understanding the implications of
differences in labour market coverage and case inclusion criteria which can be used to improve
New Zealand’s occupational fatal injury statistics.
Research recommendation 1: Feasibility of establishing a harmonised data-set. It is clear that New
Zealand wants to be able to compare its occupational safety performance to other comparative
established market economies, as this is the third such exercise undertaken in New Zealand
attempting to benchmark our relative health and safety performance on an international basis
(Feyer, Lilley et al. 2001; Feyer, Williamson et al. 2001). Should this remain a desired
benchmarking activity the feasibility of establishing harmonised data-sets should be investigated.
The research should aim to establish which countries harmonisation could occur with, and the
source of data (coronial or administration, for example) most appropriate for harmonisation for
New Zealand and the potentially candidate countries. Agreed occupational case definitions
should also be established in this research. The data harmonisation approach is preferred to
post-adjustment of occupational fatal injury data and is the approach taken in the EuroStat data-
set comparing occupational safety performance across EU member states.
Research recommendation 2: Improving standardisation of occupational fatal injury rates.
Adjustment or standardisation of occupational fatal injury data has been used as an attempt to
control for major differences in industry composition. While this current analysis standardised
the 8 comparison countries to New Zealand on the basis of industry, many other adjustments are
needed to more accurately benchmark New Zealand’s occupational safety performance.
Notwithstanding the many differences between labour force coverage and case inclusion, two
such adjustments that could be examined further are self-employment and firm size. Research
examining the role self-employment and small firm size has in terms of risk of occupational injury
by industry and as a possible explanation of New Zealand’s higher occupational fatal injury
incidence rates is warranted. The research should aim to examine if the rates of occupational
fatal injury differ 1) between employees and the self-employed and 2) between workers in small,
medium and large sized firms, allowing for differences in their industry. This research could be
undertaken using detailed individual case level administrative and/or coronial file data for a
selected period of occupational fatalities.
Research recommendation 3: Reliability of industry classification. There is concern that the industry
of the deceased worker does not always reflect the industry in where the fatal injury event
occurred, thus misrepresenting the actual risk of certain industries. For example, the 2011 Pike
River mine explosion occurred in a coal mine fatally injuring 29 workers. However, only 18
workers from this incident are listed in ACC occupational fatal injury data as being employed
within the mining industry. The remaining fatalities are scattered across service industry sub-
contractors, such as the construction industry. Research into the alignment of the assignment of
industry of employment and the industry of the injury event is a new area of classification
concern warranting investigation since the discrepancy between the industry of employment

36
and industry of injury event may provide better insight into causation. With the growth of
contractual outsourcing of employment in many industries the level of misclassification of
exposures could be significant. The research should aim to examine: 1) the feasibility of
ascertaining the difference in the industry of employment and the industry of the injury event in
New Zealand occupational fatal injury data; and 2) the level of concordance between the
industry of employment and the industry of the injury event in New Zealand occupational fatal
injury data. This research could be undertaken using coronial file and/or administrative
occupational fatality data on a sample of fatalities.

37
References
Driscoll T, Healey S, et al. (2003). "Are the self-employed at higher risk of fatal work-related injury?"
Safety Science 41: 503-515.
Driscoll T, Mannetje AT, et al. (2004). The burden of occupational disease and injury in New Zealand.
NOHSAC Technical Report No 1. Wellington: 1-206.
Driscoll T, Mitchell R, et al. (2003). "Coverage of work realted fatalities in Australia by compensation
and occupational health and safety agencies." Occupational and Environmental Medicine 60: 195-
200.
EuroStat. (2009). "Standardised incidence rate of fatal accidents at work, excluding road traffic
accidents and accidents on board transport in the course of work." Retrieved 28/01/13, from
www.hse.gov.uk/statistics/tables/index.htm#europeancomparisons.
Feyer A-M, Langley J, et al. (2001). "Work-related fatal injuries in New Zealand 1985-1994: numbers,
rates and trends." New Zealand Medical Journal, 114, 1124:6-10.
Feyer A-M, Lilley R, Langley J. (2001). Work-related fatal injuries in New Zealand: International
comparisons of official published data. Dunedin, New Zealand Environmental and Occupational
Health Research Centre: 45.
Feyer A-M, Williamson A-M, et al. (2001). "Comparison of work-related fatal injuries in the United
States, Australia and New Zealand; method and overall findings." Injury Prevention 7(1): 22-28.
Gulliver P, Cryer C, et al. (2011). A Chartbook of the New Zealand Injury Prevention Strategy Serious
Injury Outcome Indicators: 1994-2000. New Zealand Injury Prevention Strategy Secretariat.
Wellington, New Zealand, Accident Compensation Corporation.
Injury Prevention Research Unit and New Zealand Environmental and Occupational Health Research
Centre (1999). Work-related fatal injuries in New Zealand 1985-1994: Recommendations on the
establishment of ongoing work injury mortality surveillance. Dunedin, New Zealand, Injury
Prevention Research Unit and New Zealand Environmental and Occupational Health Research
Centre: 29.
Langley J, Feyer A-M, et al. (2000). "Work-related fatal injuries in New Zealand: can a reliable
electronic work-related fatality "register" be established ?" Journal of Occupational Health and
Safety - Australia and New Zealand 16(2): 145-153.
Legg S, Battisti A, et al. (2009). Occupational Health in Small Businesses. NOHSAC Technical Report
12. Wellington, NOHSAC.
Mirabelli MC, Loomis D, et al. (2003). "Fatal occupational injuries among self-employed
workers in North Carolina." American Journal of Industrial Medicine 44: 182-190.
McNoe B, Langley J, et al. (2005). "Work-related fatal traffic crashes in New Zealand: 1985-1998."
New Zealand Medical Journal 16(118): U1783.
National Occupational Health and Safety Commission (2004). Fatal Occupational Injuries - How does
Australia compare internationally? Canberra, Australia, National Occupational Health and Safety
Commission.

38
Sorensen OH, Hasle P, et al. (2007). "Working in small enterprises - Is there a special risk?" Safety
Science 45: 1044-1059.
Statistics New Zealand. (2013). "Person-level statistics using linked employer-employee data: Self-
employment." Retrieved 24/01/13, 2013, from www.stats.govt.nz/browse_for_stats/income-and-
work/employment_and_unemployment/LEED-reprots/person-level-statisticis/self-
employment.aspx.

39
Appendix A: Difference in official published ILO and ACC occupational fatal injury data for New Zealand, for the period 2005-2008 (c – confidential <4 cases)
Industry
2005 2006 2007 2008
ILO ACC %
Change
ILO ACC %
Change
ILO ACC %
Change
ILO ACC %
Change
Total 109 102 -7% 98 111 12% 84 98 17% 77 87 13%
A Agriculture, Hunting and
Forestry 22 16 -38% 16 26 38% 10 15 50% 12 13 8%
B Fishing 4 0 -100% 0 c - 0 c - 0 c -
C Mining and Quarrying c c - c c - 0 c - 0 0 -
D Manufacturing 16 20 20% 18 16 -13% 12 17 42% 16 16 0%
E Electricity, Gas and Water
Supply 0 c 100% 0 0 - 0 C - 0 c 100%
F Construction 28 25 -12% 32 34 6% 26 30 15% 15 20 33%
G Wholesale and Retail Trade; 5 c - 6 9 33% 0 c - 0 c -
H Hotels and Restaurants 0 c - 0 0 - 0 0 - 0 0 -
I Transport, Storage and
Communications 16 14 -14% 4 10 60% 4 5 25% 7 4 -43%
J Financial Intermediation c c - c 0 - 0 c - 0 0 -
K Real Estate, Renting and
Business Activities c c - 4 c - 4 c - 0 4 100%
L Public Administration and
Defence c 5 - c c - 6 5 -17% 0 4 100%
M Education 0 0 - 0 0 - 0 c - 0 c -
N Health and Social Work 0 0 - 0 0 - 0 0 - 0 c -
O Other Community, Social
and Personal Service Activities c c - c 0 - 0 c - 0 c -
P Households with Employed
Persons 0 0 - 0 0 - 0 0 - 0 0 -
Q Extra¬Territorial
Organizations and Bodies c 0 - c . - 0 0 - 0 0 -
X Not classifiable by economic
activity 9 7 -29% 7 8 13% 14 10 -29% 14 16 14%
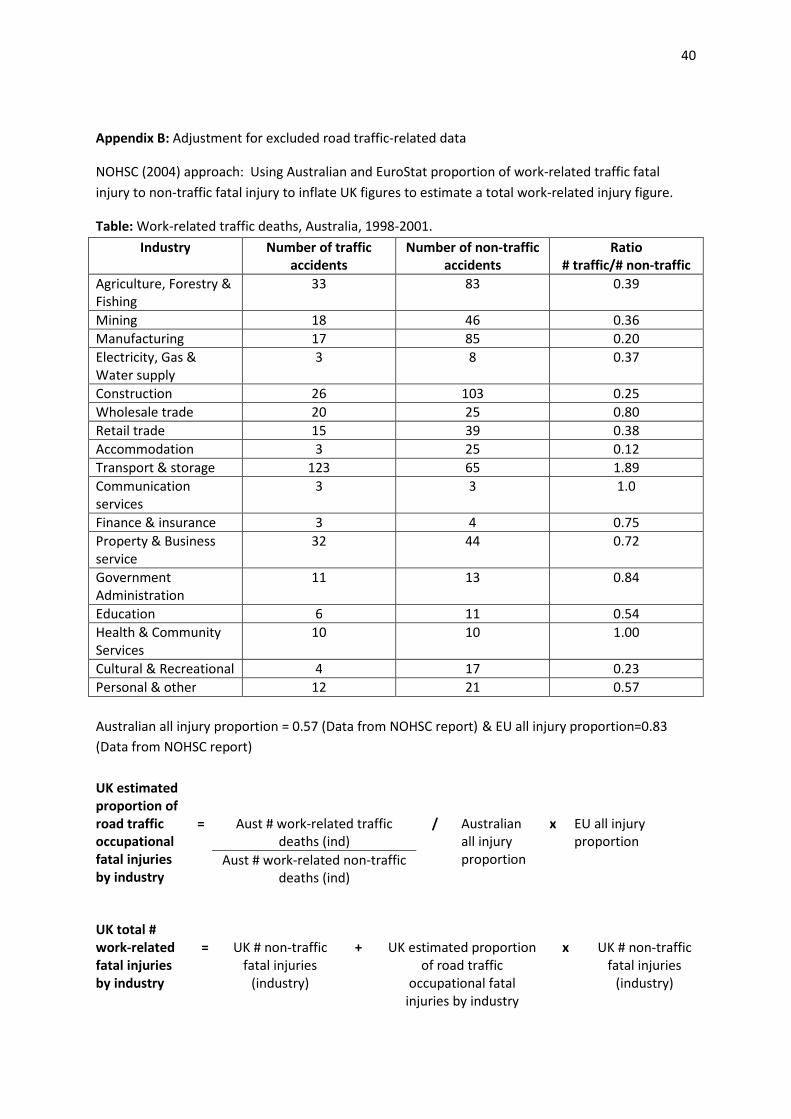
40
Appendix B: Adjustment for excluded road traffic-related data
NOHSC (2004) approach: Using Australian and EuroStat proportion of work-related traffic fatal
injury to non-traffic fatal injury to inflate UK figures to estimate a total work-related injury figure.
Table: Work-related traffic deaths, Australia, 1998-2001.
Industry Number of traffic
accidents
Number of non-traffic
accidents
Ratio
# traffic/# non-traffic
Agriculture, Forestry &
Fishing
33 83 0.39
Mining 18 46 0.36
Manufacturing 17 85 0.20
Electricity, Gas &
Water supply
3 8 0.37
Construction 26 103 0.25
Wholesale trade 20 25 0.80
Retail trade 15 39 0.38
Accommodation 3 25 0.12
Transport & storage 123 65 1.89
Communication
services
3 3 1.0
Finance & insurance 3 4 0.75
Property & Business
service
32 44 0.72
Government
Administration
11 13 0.84
Education 6 11 0.54
Health & Community
Services
10 10 1.00
Cultural & Recreational 4 17 0.23
Personal & other 12 21 0.57
Australian all injury proportion = 0.57 (Data from NOHSC report) & EU all injury proportion=0.83
(Data from NOHSC report)
UK estimated
proportion of
road traffic
occupational
fatal injuries
by industry
=
Aust # work-related traffic
deaths (ind)
/
Australian
all injury
proportion
x
EU all injury
proportion
Aust # work-related non-traffic
deaths (ind)
UK total #
work-related
fatal injuries
by industry
=
UK # non-traffic
fatal injuries
(industry)
+
UK estimated proportion
of road traffic
occupational fatal
injuries by industry
x
UK # non-traffic
fatal injuries
(industry)

41
Example –The number of Australian work-related traffic death in manufacturing (17) was used to
estimate the proportion they were of the number of non-traffic fatalities in the manufacturing
industry (85) – ratio is 0.2. The number of road traffic fatalities in the manufacturing industry in the
UK was then estimated at 29% (0.20/0.57*0.83) using the Australian all industries proportion of
traffic:non-traffic fatalities (0.57) and the EU all industries proportion of traffic:non-traffic fatalities
(0.87). The number of deaths were then estimated using the number of known deaths for the UK in
manufacturing and inflating by the number of estimated death by traffic (48+0.29*48 = 62 total
deaths manufacturing)
UK Estimated
proportion of
road traffic
occupational
fatal injuries
by industry
=
(17/85)
/
0.57
x
0.83
UK total #
work-related
fatal injuries
by industry
=
48
+
(29
x
48)
Method taken from Appendix A, (National Occupational Health and Safety Commission 2004) report.

42
Appendix C: Direct standardisation methodology
The basis for using direct industry standardisation is to find out how many deaths would have
occurred in a comparison country if it had an identical industry structure to our standard population
of New Zealand, but the industry-specific rates remained the same.
The industry-specific rates in the study group are, therefore, weighted by the population in the
equivalent industry group of the standard population (in this case New Zealand).
Expected number of deaths
(Industry A for Country B)
=
Number of cases
(Industry A for Country B)
X
NZ population in Industry A
Population
(Industry A for Country B)
The standardised rate country B is the sum of all expected deaths over all industries for country B
divided by the total New Zealand worker population.