Embed Size (px)
Citation preview

> I
>
• • > , , ) ) 1 , l
:
)
• :
1 ,
RESTRICTED
INTERNATIONAL COMMISSION FOR tHE NORtHWEST ATLANTIC ASHERIES
Serial No. 3001 (D.a. 72)
1. General Trends
ANNUAL MEETING - JUNE 1973
German (FRG) Research Report, 1972
Section I. Subarea 1 and East Greenland
by
A. Meyer and W. Lenz
A. STATUS OF THE FISHERIES
ICNAF Summ.Ooc. 73/20 (Sections I and III only)
Table 1 gives the nominal catch off West and East Greenland, taken by the Federal Republic of Germany tleet from 1962 to 1972. The total output decreased by 42% to 50,500 tons. This 1s the lowest catch since lj55 and only 25% of the maximum catch in 1963. Also the catch per fishing day has never been as small as in un although most fishing was carried out only during the months with the highest fish concentrations.
West Greenland (Subarea 1)
The decrease in catch was most pronounced in the catches of cod in Subarea 1, where in 1972 only 17,000 >-.GlI9 were caught which in only 11% of the FRG catch in 1963. The reason for this drastic decline, in partic-11,1:1): the 50% decrease in catch per fishing day. is due to poor stock size especially of the West Greenland ~.lvc.k and the hindrance to the fishery by severe ice conditions for the fourth consecutive year.
Also the catches of redfish decreased further. Only 2,650 tons were caught, which is less than 5% of the 1962 catch.
\ . East Greenland
Although the catches off East GFeen1and decreased by 38% to 30,000 tons the FRG fleet caught 9,000 tons w-ore fish off East Greenland than off West Greenland. Due to the still rather good stock size of mature cod the th .... rd highest catch was achieved in the FRG fishery for cod off East Greenland since its start in 1955. Ou the other side the redfish catch of 7.000 tons was by far the smallest since 1955. This surprising decrease in redfish landings is however more or less the consequence of less market demand.
'-1-. Forecast for 1973
a) Subarea 1. Due to the reduced size of the cod stock of West Greenland origin and the gradual decrease in strength of the East Green1andic spawning stock, which is feeding in Subarea 1. the catches will ag[iu be rather small and thus the West Greenland fishing grounds will loose much of their attraction for the fRG fleet. However after 4 heavy ice-years the ice situation in 1973 seems to be again normal (see Table 4). rhus, as in 1968, successful pelagic fishing on postspawners in May-June - non-practicable in 1969 to 1972 h,-'cause of ice - could be possible. During the second part of the year a fishery on the northern banks based on the 1968 year-class' could develop. The FRG cod landings in 1973 from Subarea 1 will also very much depend on tne possibilities for paying cod (and saithe) catches in other areas such as Subarea 2 and 3. Iceland~ the Nor~egian Coast, and the Bear Island-Spitsbergen-Barents Sea area.
b) East Greenland. The consequence of the gradual decrease in size of the stock of mature cod due to fishing, emigration to Iceland. and poor recruitment (year-caleses 1965 to 1967) will lead to a further redllction of the FRG cod catches. The catches of redfish could in 1973 surpass the cod catches, especially a.> ::onsequence of the "fishery war" off Iceland.
A2

Tab
le
1.
Su
bar
ea 1
an
d E
ast
G
reen
lan
d:
FRG
nom
inal
o
ato
hes
in
clu
din
g i
nd
ust
ria
l fi
sh
(to
ns)
, 19
62
-19
72
Co
d
Red
fish
T
ot a
1
Yea
r D
ays
Cat
ch p
er
%
Cat
ch p
er
%
Cat
ch p
er
%
fish
ing
C
atch
d
ay f
ish
. in
d.
Cat
oh
day
fis
h.
ind
. C
atch
da
y fi
sh.
ind
o
Su
bar
ea 1
19
62
6,58
4 13
3,40
4 20
.3
5.1
57,9
02
8.8
5.
2 20
0,93
2 30
.5
7.7
1963
7,
175
152,
934
21.3
4.
2 44
,355
6.
2 4.
7 20
2,92
3 28
.3
8.6
1964
5,
639
107,
982
19.1
7.
7 22
,956
4.
1 10
.0
137,
794
24.4
10
.9
1965
5,
882
107,
127
18
.2
13.3
18
,476
3.
1 10
.3
131 ,
445
22.3
14
.7
1966
4,
696
82,9
28
17.7
1
2.8
14
,91 1
3.
2 6.
1 10
2,02
9 21
.7
13.1
19
67
6,,
05
13
7,77
3 21
.9
9.1
13,6
00
2.2
3.0
155,
606
24.7
9.
4 19
68
5,81
9 13
2,49
8 22
.8
5.3
11,8
58
2.0
1.8
14
6,43
2 25
.2
5.3
1969
3,
234
67,4
31
20.9
4.
0 6,
964
2.2
5.2
75,2
9,
2,.
3
4.3
1970
1,
722
38,5
51
22.4
4.
0 4,
501
2.6
9.1
44,2
8,
25.7
5.
9 19
71
1,54
5 37
,950
24
.6
1.9
3,
335
2.2
2.0
42,4
82
27.5
2.
4 19
72
1,31
2 16
.963
12
.9
u.3
2,65
0 2.
0 1.
9 20
,732
15
.8
1.8
E.G
reen
lsnd
19
62
1,66
0 14
,317
8.
6 0.
5 25
,032
15
.1
1.2
40,9
99
24.7
1 .
2 '"
1963
2,
182
1 3,6
77
6.3
0.5
31,3
68
14.4
1.
4 4 7
,700
21
.9
2.2
1964
3,
287
29,4
00
8.9
0.
2 38
,154
1
1.6
2.
3 71
,364
21
.7
2.5
1965
2,
734
11,7
46
4.3
0.6
33,4
91
12.2
4.
5 47
,877
17
.5
4.4
:I>
1966
1,
827
7,23
1 4
.0
0.7
23,2
22
12.7
6.
3 32
,006
17
.5
6.0
w
1967
2,
157
13,0
25
6.0
0.1
22,8
79
10.6
4.
7 37
,803
17
.5
4.4
1968
1,
361
9,82
5 7.
2 0.
2 15
,432
1
1.3
2.
0 26
,417
19
.4
2.0
1969
2,
164
14,2
92
6.6
0.9
24,5
87
11.4
4.
6 40
,505
18
.7
4.2
1970
1,
532
14,3
88
9.4
0.9
15,6
72
10.2
4.
5 31
,104
20
.3
3.3
1971
1,
737
28,7
35
16.5
0.
6 14
,037
8.
1 2.
9 44
,062
25
.4
2.4
1972
1,
732
21,6
64
12.5
0.
4 7,
153
4.1
1 .6
29.7
42
17.2
0.
9
To
tal
1962
8,
244
147,
721
17.9
4.
6 82
,934
10
.1
4.0
241,
931
29.3
6.
6 19
63
9,35
7 16
6,61
1 17
.8
3;9
75,7
23
8.1
3.3
250,
623
26.8
7.
4 19
64
8,92
6 13
7,38
2 15
.4
6.1
61,1
10
6.8
5.2
209,
158
23.4
8.
0 19
65
8,61
6 11
8;87
3 13
.8
12
.1
51,9
67
6.0
6.5
179,
322
20
.8
11.9
19
66
6,52
3 90
,159
13
.8
11
.8
,8,1
33
5.8
6.2
1,4
,0,5
20
.5
11
.4
1967
8,
462
150,
798
17.8
8.
4 36
,479
4
.,
4. ;
193,
409
22.9
8
.4
1968
7,
180
142,
,23
19.8
4.
9 27
,290
,.
8
1.9
172,
849
24.1
4.
8 19
69
5,39
8 81
,723
1 g.
l ~:
~ 31
'~11
~.
8 4.
8 lH
:m
21.~
~.,
1970
3,
254
52,9
39
1 .,
20
, ,
.2
5.5
23.
.9
1971
,,
28
2
66,6
85
20.~
1.,
11
;~b~
~.
3 2.
8 86
,5~~
26
.~
2.4
1972
,,
04
4
,8,6
27
12.
0.4
• 2
1
.7
50,4
16
• '1
.3
- 3 -
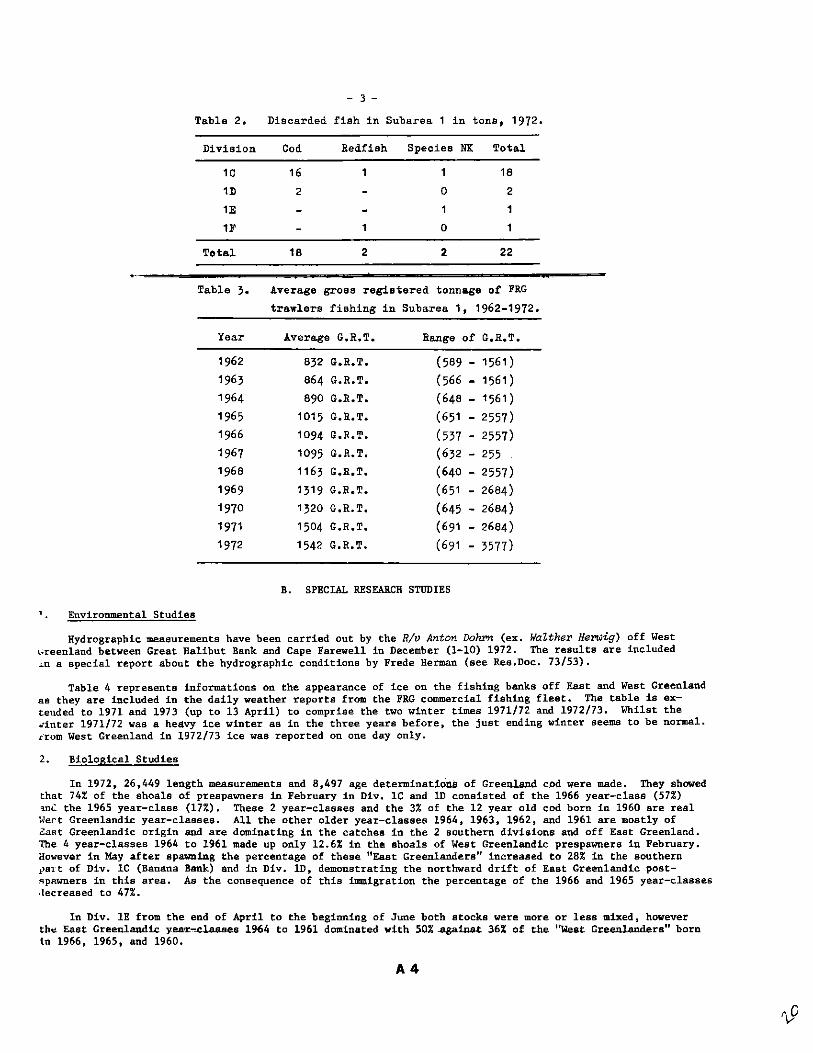
Table 2. Discarded fish in Subarea 1 in tons, 1972.
Division Cod Redfiah Species NK Total
1C 16 18
1D 2 0 2
1E 1
1F 0
Total 18 2 2 22
Table ~. Average gross registered tonnage of FRG
trawlers fishing in Subarea 1, 1962-1972.
Year Average G.R.T. Range of G.R.T.
1962 8~2 G.R.T. (589 - 1561 )
196~ 864 G.R.T. (566 - 1561) 1964 890 G.R.T. (648 - 1561)
1965 1015 G.R.T. ( 651 - 2557) 1966 1094 G.R .. T. (5~7 - 2557) 1967 1095 G.R.T. (6~2 - 255 1968 116~ G.R.T. (640 - 2557) 1969 1~19 G.R.T. ( 651 - 2684) 1970 1320 G.R.T. (645 - 2684)
1971 1504 G.R.T. ( 691 - 2684)
1972 1542 G.R.T. (691 - 3577)
B. SPECIAL RESEARCH STUDIES
Environmental Studies
Hydrographic measurements have been carried out by the R/v Anton Dohrn (ex. WaZther Herwig) off West \.~reenland between Great Halibut Bank and Cape Farewell in December (1-10) 1972. The results are included J..n a special report about the hydrographic conditions by Frede Herman (see Res.Doc. 73/53).
Table 4 represents informations on the appearance of ice on the fishing banks off East and West Greenland as they are included in the daily weather reports from the FRG commercial fishing fleet. The table is extended to 1971 and 1973 (up to 13 April) to comprise the two winter times 1971/72 and 1972/73. Whilst the ~inter 1971/72 was a heavy ice winter as in the three years before, the just ending winter seems to be normal. r'rom West Greenland in 1972/73 ice was reported on one day only.
2. Biological Studies
In 1972, 26,449 length measurements and 8,497 age determinationS of Greenland cod were made. They showed that 74% of the shoals of prespawners in February in Div. Ie and 1D consisted of the 1966 year-class (57%) ~nL the 1965 year-class (17%). These 2 year-classes and the 3% of the 12 year old cod born in 1960 are real Wert Green1andic year-classes. All the other older year-classes 1964, 1963, 1962, and 1961 are mostly of 2a~t Greenlandic origin and are dominating in the catches in the 2 southern divisions and off East Greenland. The 4 year-classes 1964 to 1961 made up only 12.6% in the shoals of West Greenlandic prespawners in February. However in May afte); spaw:n1u.g the percentage of these "East Greenlanders" increased to 28% in the southern i'8l't of Div. Ie (Banana Bank) and in Div. In, demonstrating the northward drift of East Greenlandic postRpawners in this area. As the consequence of this fmmigration the percentage of the 1966 and 1965 year-classes ,tecreased to 47%.
In Div. IE from the end of April to the beginning of June both stocks were more or less mixed, however th~ East Green1and1c yea<r-~claases 1%4 to 1961 dominated with 50% -against 36% of the "Weat Greenlanders" born tn 1966, 1965, and 1960.
A4

" C -~ C ~ ~ c
(!)
1;; .;:
" C ;> c ~ ~ c
'·0
;;; t
- 4 -
Table 4. Appearance of ice on the fishing banks off Greenland as reported by the FRG commercial fishing fleet. Dots indicate that a weather report was transmitted, the small and the long dashes stand for "ieel! and "much ice" respectively within such a report.
Dohrn
.Angmagsalik
Fylklr Bille
-1911-NOV. DEC.
-t JANI I FEB.
---1972--MAR I APR I MAY JUIE I JULY AUG.
, ..
-~ -
.Adeior Thotdenskjold ~~~~-~-.-~,,-+--+'~'--+' , . I -Di~cord
Walloe Nonortolik
Thorwnldsen
Storoe
Noname
FredenkshaJ
Danos FIs.kenoe
Fyllos
Barenen
.' .. _, 1-- . - -j
" .
, H
, I
,Itt" -, -
., H"I --" t-t-·
··iI .. -t ..... ,.
I ... I
--1973--SEJ' OKT NOV. DEC JAN. I FEB MAR APR . . , ., ...
. ,
_. ·r ... - ~,
t ...
Off South Greenland (Div. IF) in February and March, when the spawners pass this area on their way to East Greenland, 90% of the catch consisted of the 1964 to 1961 cod with a clear dominance of the rich 1963 y~ar-class with 43 to 48% and the moderate year-class 1964 with 21 to 30%. In May after spawning the 1964 cod prevailed in this area.
Growth studies showed again (see also Res.Doc. 73/38 by A. Meyer) that the West Greenland cod grow faster than the East Greenlandic cod which grow up in the southern Div. IE and IF, an area which is much more under the influence of the cold waters of the East Greenland current than the northern Div. lD to lA. The 6 and 7 year old cod of West Greenland origin caught in Div. Ie and IE in February to May - before the beginning of the new feeding season - had reached a mean length of 66.9 cm and 75.6 cm respectively. The 8 (1964 yearclass) and 9 year (1963 year-class) old IIEast Greenlanders ll caught in Div. IF in February and March had a mean length of only 70.6 and 76.0 em respectively. That in the May catches in Div. IC and ID the cod of the 1964 and 1963 year-classes (see above) were real East Greenlandic immigrants could also be proved by their small mean length of 70.9 and 74.9 cm. which is very close to the mean lengths found in Div. IF.
In the beginning of December 1972 R!V Anton Dohzrn (ex. Walther Herwig) worked in Div. lC to IF. The otolith studies showed, that on Banana Bank, Fyllas Bank and on Nanortalik Bank the 1968 year-class dominated with 53 to 76%. This means that this year-class is more or less equally represented in both Greenlandic stocks. These 4 year old cod had reached at the end of their fifth feeding period a mean length of 52.1 cm In Div. lC. 10 and IE and of 45.4 cm in Div. IF. At the moment nothing can be said about the question, whether this year-class 1968 is a rich one or is only so strongly deominating. because the stock is so weak. If we take into account, that the catches of the research ship never have been so poor as in December 1972 -and also the catches of the English R!V Cirolana (working together with Anton Dohrn) were so - probably no quick recovery of the Greenland stocks can be expected. On Little Halibut Bank where the average catch was only 0.22 t/h. the 1966 year-class dominated followed by the 1968, 1965. and 1966 year-classes. On Danas Bank the only substantial cod haul was made with 2.5 t/h. Here the catch was composed mainly of the yearclasses 1966 (45%), 196B (18%), and 1965 (15%). Off Cape Farewell a 0.8 t/h catch (within the fishery limit with the kind permission of the Danish Government) nearly exclusively consisted of the 1963 and 1964 yearclasses (84%). Nearly no young fish was found in this area.
In the commercial catches of migrating and spawning cod off East Greenland during the first 5 months of t:le year again the good East Greenlandic year-classes of 1961 and 1964 dominated with together 90%. As in 1971 the rich 1963 year-class (with 49% in the southern part and with 55% in the northern part of East Greenland) was by far the most important year-class. In the southern part the 1964 year-class followed with 22%, whilst in the Angmagssa11k-Dohrn Bank area the 1962 cod took the second place. The rich and important year-class of 1961 in the meantime is reduced to 7-8%.
A5

- 5 -
German (FRG) Research Report. 1972
Section III. Subareas 3, 4, 5 and 6 (Herring only)
by
K. Schubert
A. Statue of the Fisheries
Thirteen stern freezer trawlers were fishing with pelagic nets from the middle of July to December 1972. The total catch yielded in Subarea 3 (Subdlv. 3Pa) 110 t herring in October. In Subarea 4 the Lotal catch amounted to 510 t herring in August and October. The main fishing area of the German fleet was the Subarea 5 and the catch yielded 30,635 t herring. Of this total 27,633 t came from Subdiv. 5Ze from July to December, 2,931 t herring from Div. 5Y in the same time and 71 t from Subdiv. 5Zw in October and Nc.vember. No herring was fished in Subarea 6 in November and December. There was only a squid fishery (Table 1).
In Subarea 5 the catch decreased from 56,860 t herring in 1971 to 30,635 t in 1972. This decrease '~as due to the effort which decreased from 1,250 fishing days to 944 fishing days. The catch per day ~ecreased from 45.5 to 32.5 tons herring.
The spawning on the northern part of the Georges Bank was not so strong this year. The German fleet ~aught spawning herring in this area only some days in the second and third week of September. The main ~lshing area was 1972 on the western side of the bank, east of Nantucket Shoal/Cape Cod between 4lo-42aN, oso30'-69 a 30'W. Spawning herring was caught here on definite places in September and October. Some ~p~wning was observed in Div. 5Y in October too. One remarkable characteristic of the hydrographical ~ituation on Georges Bank was the lower temperatures in 1972. Presumably, this hydrographical situation may have an influence on the spawning behaviour, but the lower stock density could be an explanation too.
MOnthly catch, total catch, effort (fishing days), catch-per-unit effort (tons) and discarded fish (tons) are given in Table 1.
Figure 1 shows the catch per day in baskets (50 kg) on an average of about 5 days of 13 German freezer ~ca~lers in 791 fishing days in Subdiv. SZe from the last week in July to the beginning of November 1972; 19 compared with the figures for 1971 and 1970, the stock density has strongly decreased in 1972.
~. Special Research Studies
Biological studies
On board a trawler herring investigations were made in Div. 4X, Subdiv. 5Ze and Div. 5Y from August to October; in addition one sample from a research vessel cruise in March from Subdiv. 3Ps was investigated. From 79 samples, 33,622 herring were measured in these Divisions as follows: 127 in Subdiv. 3Ps, 328 in iliv. 4X, 429 in D!v. 5Y, and 32,738 in Subdiv. 5Ze. The average length in Subdiv. 3Ps was 34.74 cm in March; in Div. 4X, 24.27 em in October; in Div. 5Y, 32.25 cm in October; and in Subdiv. 5Ze, the average length was 32.19 cm in August and decreased to 30.59 cm in October. Compared to 1971, the average length WhS greater in Subdiv. 5Ze (Table 2).
Maturity stages 8 (606 %a) and 7 (357 %a) were dominant in Subdiv. 3Ps in March. Some herring were still in spawning condition (24 %a), and some had maturity s-tages 4 (16 %a). In Div. 4X in October, juvenile herring from maturity stage 2 were observed (l~OOO aka)~ whereas in Div. 5Y in October, only spawning herring (stage 6 =- 1,000 aka) were in the catches. Stage 5 formed the bulk (756 aka) of the catches in Subdiv. 5Ze in August, some importance had the stage 4 (232 aka); in addition, some herring of stages 2 and 3 were observed. In September the maturity was advanced. Stage 5 (631 aka) was still pre_dominant. Some spawning herring (stage 6 - 174 %a) and further spent fishes (stages 7 and 8) were in t:b~ catches. The stage 4 (130 %0) had still some importance. Finally in October, spawning herring (stage 6) were predominant (794 aka) in the catches, some importance had juvenile herring in stage 1 (188 '/ .. ) (Table 3b).
The age composition is shown in Table 3a. In Subdiv. 3Ps in March, herring over 8 years old (888 °ko) were dominant. Some herring from the year-classes 1964, 1965, 1966 and 1968 were present. In Div. 4X i& October, only 2-year-olds (year-class 1970) were in the catches. In Div. 5Y in the same month, the 1~57 year-class (227 ako) were dominant, some importance had the year-classes 1966 (165 aka), 1968 (155 aka), 1064 (134 ~aa) and the year-classes> 9 (113 °ka). No herring from the year-class 1970 was found. In Sllbdiv. 5Ze in August, the 6-year-old herring (274 %a) were predominant, moreover, the year-classes 1967 069 %a), 1968 (165 %a), and 1965 (156 %0) had some importance. In September, the 4-year-old herring 'o:ear-class 1968) was dominant (270 %a). In October the change to younger herring continued. The bulk ui th~ catches was now formed from the 4-year-old (year-class 1968) herring (355 °ka)' The portion of the
A6

- 6 -
year-classes 1966, 1967, 1965 decreased, whereas the 3-year-old (1969 year-class) herring (112 aka) increased. For the first time 2-year-old herring (year-class 1970) appeared in this month in the catches (132 %.).
Table 3c gives the mean length and Table 3d the mean Ll (em) by age.
Tables 3e and 3£ show the average number of vertebrae and gillrakers. Only the catch in March in Subd1v. 3Ps contained spawning herring, all other samples were autumn spawners. It seems from these Tables that the autumn spawners in the different months and divisions belonged to different stocks.
A7

~
~~~~nal ~atch.
eff
ort,
ea
\cb
p
er un~t
eff
ort
and diec~1.
of
Ger
man
fr88~er
tra
wle
ra
Su
bar
e ••
~,
4,
5 an
d 6,
i~
1911
Su
bu
'aa
and
Di.
,hio
n
Mon
th
1I0l
llina
l ca
tch
e.,
tOM
~ R
erri
utr
.....
M
ack
erel
S
alt
he
Oth
erfi
eh
Su
i.
To
tal
stfo
rt
Da
y.
fia
hin
g
~atc
h ~r d
!I~t
olUl
l :l
erri
ttg
Sha.
M
acu
nl
Sa
ith
. O
ther
fia
h
~l-d
To
tal
Dia
card
. 't
on
e l
Mac
ker
el
Sh
a'
Oth
erfl
.8b
.
To
tal
,. CO
Pi.
ber
T f
or h
arr
ing
}p
. ,
V.
<V.
X
VII
I V
III
X
110
, 2
508
--
--
--
--
--
--
7 -
-0
--
-11
7 ,
2 50
8
6 ,
, 7
18
.;
'.0
2
.0
12
.6
--
--
--
--
--
-,.
2 -
-0
--
--
19.5
'.
0
2.0
12
.6
--
--
--
--
--
--
--
--
'V,
, 5T
T
ota
l X
T
ota
l V
II
VII
I IX
X
X
I X
II
To
tal
5'0
79
,,
0
",
1204
60
80
8 '5
2
98
29!i1
-
--
-5
--
25
-,0
-
--
,0
7'
--
52
2 16
7 -
--
--
-0
nO
21
' ,.,
0 '"
,0
,8
20
-5
,0
'5
"8
-
--
--
--
5,0
8
' 60
0 '7
7
1302
60
8
"
749
,,6
;6
11
8 ,
12
24
5
' ,
22
28
,
117
63
.8
26
.;
49
.2
n.;
2
;.6
2
0.0
}6
.1
,6. ,
,.
8
21.4
-
--
-0
.'
--
0.,
0
0.2
-
--
'.7
'.
4
--
,.'
0.2
, .
2
--
--
0 ,.
6
23
.4
2.5
0 ,.
4
0.8
0
.7
0.,
-
0.,
,.
2
'.7
,. ,
-
• -
--
--
--
6;.
6
29.1
5
0.0
15
.7
25.5
20
.0
;1.0
26
.7
35.1
2
6.4
--
-,
• -
--
-5
--
-4
6 -
--
-10
-
--
I _
--
--
--
--
7 I 8
-
--
-15
FZ
I.
DI.
"
"au.
...L
... 8
5 Zw
6
• M
onth
X
II
Xl
XlI
T
ota
l
j'1oh
e t
Iud
;
NO
llin
al
catc
nes
(to
na
l
Xar
riD
.(l'
. --
--
.....
--
--
Kao
ker
el
" ,
, 2
Sa
itb
a
--
--
Oth
ufh
h
6;
0 ,ci
~ ,~~
S u
i4
10
tota
l ..
" }2
2
'" !!
!9.t
l D
4ya
fill
bin
g
7 2
40
42
C.t
ch E
!r d
y't
o!!
:!l
Her
rin
g
--
--
Sh
a'
--
--
Mac
ker
el
2.0
M
0
0.,
S
ait
he
--
--
Oth
erfh
h
'.0
0
~:5
~:!
S u
id
9.0
'.
0
.6
'l'o
ta!
12.0
5
·5
8. ,
7
.'
Db
oa
rds
!to
ns}
M
ack
erel
.
--
--
Sh
a'
--
--
-O
ther
Ush
-
--
--
'l'g
tal
--
--
-
5"
5Z
. V
II
VII
I IX
X
X
I X
II
fota
l X
X
I
}20
5912
l!
i004
62
9}
95
, 2
1.6
3'
47
2,
-5
n 5
7 -
,0
-60
-
39
" "'
88
50
, .. -
"7
-
0 -
5 20
-
25
-,
29
94
,,6
17
-
257
-7
--
--
--
--
12'
5985
15
204
85~3
227
" 28
.329
47
28
8
25
'52
,'
8
27>
" 4
7"
2 '4
12.6
!i
8.9
40
.9
;0.4
5
.0
2.'
34.9
2
;.5
'.
7
-0
0 0
0.4
-
0 -
4.'
-
0.,
0
.,
0.'
,.
6
12.5
0
.5
-14
.1
-0
-0
,., -
0 -
-0
0.2
0
.,
M
0.8
-
0.,
-
0.5
-
--
--
--
--
12.8
39
.4
41.5
31
.3
11.9
14
.6
}5
.8
23.5
20
.6
24
--
--
-24
-
, -
--
--
, -
--
-10
-
--
10
--
" -
'0
--
-4>
-
-
6 B
6
XlI
T
ota
l
--
--
12
" -
-8
,:~
86
,06
4>9
12
5' -
--
-'.
0
0.,
-
-~:1
~:i
8
.8
8.'
--
--
--
--
Ave
rase
gr
oaa
regi~tered
ton
na
ge
Qf ~rlllan
tra
wle
rs
fia
bin
g f
or b
errin
g i
n
the
IC~AP
Are
a S
ub
area
3-
5 (f
or h
errin
,)
I 22
61
GRT
(139
8-26
a4)
5-6
(fo
r e
qu
id ..
) I
1576
GRT
(1
512-
1580
)
5 'l
'ota
T
ota
l
71
06!i5
60
12
0 "7
7
'8
}66
7 4
" -
115
2281
,6
, .. ,.,
32
.5
,.8
0
.'
12
.;
0.8
-
0.4
0
.4
0.,
-2
0.9
34
.2
-2
' -
I ~6
-.....
-
58

- 8 -
Table 2. Length composition of herring in 1972 (%0)
Area 3 Ps 4 X 5 Ys 5 z • Month III X X VIII IX X
R' e e e e e
em 18 + 19 1 20 3 + 3 21 24 1 6 22 122 4 11 23 244 , 5 14 24 287 2 14 25 293
i
2 7 26 27 2 13 11 27
,
7 10 41 45 28 33 30 62 85 29 16 107 70 116 139 30 16 119 131 170 197 31 8 168 191 190 185 32 24 205 220 176 141 33 173 159 205 117 86 34 330 135 97 69 39 35 260 56 40 27 14 , 36 149 9 4 5
I 2 !
37 24 2 + + 38 + +
Total %0 1000 1000 1000 1000 1000 1000 No. of Samples 1 1 1 5 37 34 No. measured 127 328 429 1823 14972 15943 Mean Length ~cm) 34.74 24·27 32.25 32.19 31.34 30.59 Mean .Ie:i.ght kg) 0.289 0.100 0.245 0.,288 0.253 0.216
I
R. D Research Fishing C .. Commercial Fishing
Table~ al Biological data for herring in Area
Age composition (~)
3. 4. 5. 1972•
Area 4 X 5 YJ 5 z • 3 PS Month X X VIII IX X III
Year-Age Year-Age class class 1971 1 :1~71
70 2 1000 132 70 2
69 3 72 25 64 112 69 3 68 4 155 165 n.Q ill 68 4 16
67 5 ill 169 174 138 67 5 66 6 165 ill 208 138 66 6 8
65 7 82 156 102 55 65 7 32 64 8 134 89 54 20 64 8 56 63 9 52 46 43 12 <64 >8 888
<63 >9 113 76 85 38
Total 1000 1000 1000 1000 1000 1000 n 100 97 237 1118 757 126
A9

- 9 -
Tabla ,3 bl
Sexual maturit~ (%0)
Area 4 X 5Yi 5 Z a 3 PS Month X X VIII IX X III
Stages or maturity
1 188 2 1000 4 4 12
3 8 If 4 232 130 16
5 756 631 2 6 1000 174 794 24
7 46 4 354 8 11 606
Total 1000 1000 1000 1000 1000 1000 n 100 98 95 686 492 127
Table J ol
Length (em)
Area 4 X 5 Y. 5 Z a 3 PS Month X X VIII IX X III
Year-Age
I Year-Age
elaas 01as9 1971 1971
I ;( 23.51 22.38 i
70 2 .'1-363 2-389 I 70 2 '1 100 100 I
27.79 28.33 27.68 27.75 , 69 3 0.571 0.566 1.389 1.259 69 3
7 6 72 85 30.17 29.88 29.95 29.91 30.00
68 4 1.095 0·979 1.072 1.040 68 4 0.500 15 39 302 269 2
30.91 31.58 31.20 31.13 67 5 0.443 0.737 0.964 0.935 67 5
22 40 195 104 31.81 ' 32.53 32.13 31.90 32.50
66 6 0.495 0.811 0.882 0.961 66 6 16 65 232 104
32.50 33.01 32.95 33.00 31.75 65 7 0.285 0.645 1.063 0.695 6~ 7 2.916
I 8
I 37 114 42 4
33.35 33.50 33.48 33.50 33.26 64 8 - 0.307 0.700 0.864 0.571 64 8 1.809
13 ,
21 60 15 7 I
I ,
34.10 34.23 34.06 34.06 35.06 ! 63 9 - 0.800 0.218 0.761 0.777 <:64 >8 1.077
I 5 11 48 9 112
I 34.77 34.67 34.68 34.67 <63 >9 - 1.018 0.735 0.871 0.790
11 18 95 29
x 2 23.51 31.78 32.23 31.55 29.59 34.76 Totl'll 8 10363 3.994 3.003 4.239 11.697 2.002
n 100 97 237 1118 751 126
A 10

Tab
le
3 dl
T
ab
le ..3
el
...11.
..l£
ll V
erte
bra
e
Are
a 4
X
5 Y
s 5
z •
Are
a 4
X
5 Y
o 5
z •
, PS
M
onth
X
X
V
III
IX
X
Mon
th
X
X
VII
I IX
X
II
I Y
ear-
Age
Y
ear-
Age
Y
ear-
Age
o
lass
19
71
cla
ss
cla
ss
1971
19
71
x 1
6.,
2
15.5
8 Ii
56
.55
56
."
70
2 .'
1.7
6,
1.17
4 70
2
$L 0
.'7
2
0.,
25
70
2
" 11
12
"
99
98
13.5
0 15
·90
16.5
8 5
6.4
' 57
·00
56.4
1 56
.46
69 ,
0.80
0 4
.08
, 5
12
69 ,
0.28
5 0
.,8
6
0.,
66
69
3
7 1
44
54
1,.
00
13
.81
14.3
5 5
6.4
' 56
.21
56.4
1 56
.54
56.5
0 68
4
3.66
7 6.
578
5.27
6 4
29
48
68
4 0.
571
0."
5
0.'
58
0.
512
68
4 0.
500
14
14
191
161
2 16
.10
15.2
5 14
·39
13
.4'
56.2
3 56
.44
56.4
0 56
.36
67
5 7.
800
, 14.
916
4.76
6 6.
071
.... 67
5
0.'
74
0.
261
0."
, 0
.28
8
67
5 0
,. 5
I 4
19
14
22
18
110
n ,
... 13
.00
12.5
8 11
.82
12.6
1 56
.00
... 56
.50
56
.,2
5 •
• '7
56
.40
66
6 12
.500
'.
74
' 2
.n6
4.
766
2 13
25
19
66
6
0.5
"
0.22
8 0.
370
0.34
5 66
6
16
19
1"
60
1 1
1.0
0
13.5
0 14
.02
14.0
0 56
.75
56.5
0 56
.32
56
.n
56.0
0 65
7
4.50
0 8.
000
6.62
4 5.
166
65
7 0.
500
0.26
6 0.
281
0.39
8 65
7
2 2
2,
10
8 16
68
22
4
12.8
3 13
.50
13
.8,
15.5
0 56
.77
56
.,8
56
.57
56
."
56.8
6 64
8
4.,
,,
2.00
0 4.
750
64
8 0.
192
0.25
6 0.
297
0.50
0 64
8
0.80
9 3
2 9
1,
1,
44
9 7
13.8
3 12
.36
12
.10
56
.40
' 56
. "
56.6
1 5
6."
56
.68
63
9 1.
390
6.47
6 1.
300
6,
9 0.
300
' 0
."4
0
.4,0
1.
390
<64
>8
0
.5,0
,
7 5
5 ,
2,
, 11
0
13.5
0 12
.50
12.7
9 11
.50
56
.,6
56
.18
56.3
8 56
.70
63
9 1.
000
6.98
9 3.
142
<M ;
>9
0.45
4 0
.,6
3
0.37
9 0
.2"
3 14
8
11
11
58
10
i 2
16.3
2 13
.86
, 13
.21
13· 4
5 14
.03
x 2 56
.55
56.4
6 5
6.,
6
56.4
1 56
.45
56.6
6 T
ota
l 0
1.7
6,
7·93
9 4.
679
6.05
0 6.
031
To
tal
s 0.
372
0.41
9 0.
274
0.'5
1
0.40
3 0.
534
n 11
14
31
1,
1 12
9 n
99
96
95
671
490
124

M ,.... '"
.~
RESTRICTED
INTERNATIONAL COMMISSION FOR THE NORTHWEST ATLANTIC FISHERIES
Serial No. 3001 (D.a.72 )
ANNUAL MEETING - JUNE 1973
German (FRG) Research Report. 1972
Section II. Subareas 2-5 (excluding Herring)
by
J Messtorff and W Lenz
Subarea 2
A. Status of the Fisheries
ICNAF Summ.Doc. 73/20 Seotion II
The sharp decline of the FRG catches off Labrador since the peak year 1969
continued drastically also on 1972 to only 53% of the 1971 total catch. The
1972 nominal catches of groundfish as well as preliminary effort data are given
in Table 1. The catch per d~ fished was somewhat higher as observed in 1971,
but the total effort (~s fished) had been reduced considerably by 53%. This
reduction in effort again was primarily due to further increased severe ice con
ditions off Labrador in spring 1972.
On account of these adverse conditions the fishing activity was restricted to
a very short season. 7C!f, of the total catch was already taken during January,
only 9% in February and the remainder in March. No fishing took place in Division 2G.
Very few catches were reported from Division 2H but 99% from Division 2J. Cod
amounted to 93% of the total catch in Subarea 2.
The redfish by-catch remained unimportant and amounted to only ~ of the total
catch in Subarea 2.
The quantities of discarded fish were very small and much less than in 1971 as
shown in Table 2.
Forecast for 1973
Fishing operations of German (FRG) trawlers in Divisions 20-3K,L during the
first quarter of 1973 were again restricted by very severe ice conditions. After
preliminary estimates the total German (FRG) catch of cod m~, however, exceed the
A 14
- 2 -
1972 catch somewhat to a level around 80% of the national quota allocation set
for 1973.
B. Special Research Studies
1. Environmental Studies (W Lenz)
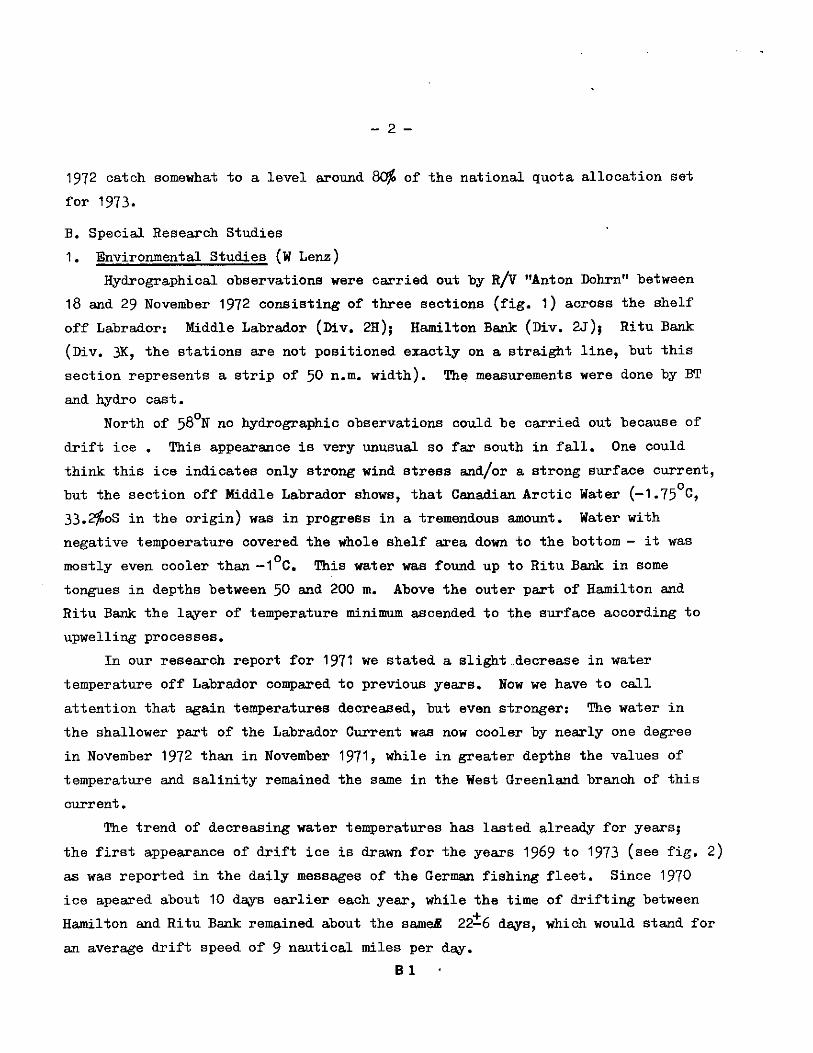
Hydrographical observations were carried out by R/V "Anton Dohrn" between
18 and 29 November 1972 consisting of three sections (fig. 1) across the shelf
off Labrador: Middle Labrador (Div. 2H); Hamilton Bank (Div. 2J), Ritu Bank
(Div. 3K, the stations are not positioned exactly on a straight line, but this
section represents a strip of 50 n.m. width). The measurements were done by BT
and hydro cast.
North of 58°N no hydrographic observations could be carried out because of
drift ice. This appearance is very unusual so far south in fall. One could
think this ice indicates only strong wind stress and/or a strong surface current,
but the section off Middle Labrador shows, that Canadian Arctic Water (-1.75°C,
33.2%oS in the origin) was in progress in a tremendous amount. Water with
negative tempoerature covered the whole shelf area down to the bottom - it was o mostly even cooler than -1 C. This water was found up to Ritu Bank in some
tongues in depths between 50 and 200 m. Above the outer part of Hamilton and
Ri tu Bank the la,yer of temperature minimum ascended to the surface according to
upwelling processes.
In our research report for 1971 we stated a slight .. decrease in water
temperature off Labrador compared to previous years. Now we have to call
attention that again temperatures decreased, but even stronger: The water in
the shallower part of the Labrador Current was now cooler by nearly one degree
in November 1972 than in November 1971, while in greater depths the values of
temperature and salinity remained the same in the West Greenland branch of this
current.
The trend of decreasing water temperatures has lasted already for years;
the first appearance of drift ice is drawn for the years 1969 to 1973 (see fig. 2)
as was reported in the daily messages of the German fishing fleet. Since 1970
ice apeared about 10 da,ys earlier each year, while the time of drifting between
Hamil ton and Ri tu Bank remained about the same!: 22:!:6 da,ys, which would stand for
an average drift speed of 9 nautical miles per da,y.
81

~
,,' m
N
T.b
le f
Su
ba
rea
/DiY
.
2 H
J
2 T
ots
l
~ K
L
M
Pn
3 T
ota
l
4 X
5 y Z
e 5
To
tal
Tab
le .
..
Su
ba
rea
/Di v
.
2 G
H
J
2 T
ota
l
3 K
4
+
5
Ger
aan
(F
RG
) ao
aiR
a1
catc
hes
(to
na)
ia S
ub
are •
• 2
-5
(ex
clu
din
g h
err
ing
fis
hery
) in
19
72
(in
clu
din
g i
nd
ust
rial
fish
-co
nv
erte
d to
fi
sh I
leal
ca
bo
ard
).
C D
R
EDFI
SH
OTR
ER
PISH
TO
TAL
day
s ca
tch
. '"
catc
h
."fo
. '"a
tch
. '" .
catc
h
. '" d
fish
ed
o
atc
h
per
day
ia
d.
cato
h
per
day
iad
. ca
tch
,p
er d
ay
ia
d.
catc
h
per
day
1n
•
6 11
4 19
.0
0.9
11
1 .
8 -
1 ~
2.2
-1 ~
8
23
.0
0·7
34
2 9
681
28.3
3
.9
562
1.6
67
.3
129
0.4
40
.3
10
372
30
.3
7.8
~48
9 79
5 28
.1
~.8
573
1.6
66
.0
142
0.4
~6.6
10
510 I
~0.2
7·7
195
I ,
514
19
147
37
.3
2.2
45
0 0
.9
45.4
0
.4
44.1
19
79
2 3
8.)
3
.6
11
17
1.5
-
19
1.7
-
2!
I 0
.5
100.
0 41
I
~.7
12.2
47
60
5 1
2.9
4
.0
240
5·1
6.7
0
.6
+
872 i
18·5
4
.6
2 -
--
30
15
.0
13.3
+
-
30
15
.0
13.3
57
4 19
76
9 3
4.4
2
.3
,H9
1
·3
30
.4
227
' 0
.4,
40.1
20
n
5!
36.1
3
·7
!
11 I
1
2 2
.0
--
--
9a!
9.0
-
11
.0
-
-I
I
31
+
~ !
--
-~§
I 18
.3
-55
:
18·3
-
6 -
--
--
: 8
.2
-49
8
.2
-9,
+
J
+
i -
--
-1
104°
1 11
.6
-10
4 I
11 .
6
-0)
H
addo
ck I,
P
oll
ock
6
b)
Po
llo
ck
104
Dis
card
ed fi
sh
(to
ns)
in
Su
bar
aas
2 -
5 (e
xcl
ud
ing
herr
ing
fis
hery
) in
197
2 (1
971)
COD
RED
FISH
O
TRER
FI
SH
TOTA
L
i !l
i : l
i 2~
" ~
2 6
182
(27;
I -(5
; I
8 (
7) I
90
39)
no
dis
card
s re
po
rted
.
w
I; I !I II

-4-
2. Biological Studies
R/V "Anton Dohrn" (ex. "ilal ther Herwig") carried
the Subarea during the second half of November 1972.
out a groundfish survey in
Due to limited working time
the survey area had to be restricted mainly to Division 2J (and the-northern part
of Division 3K). Even then the coverage as well as the number of random trawling
stations per sampling stratum was probably not sufficient in order to obtain
significant abundance indiles. A standard bottom trawl with small meshed liner
inside the cod-end was used throughout the survey. Towing time and speed were
30 minutes at 4 Kn. If not sampled for length frequency distribution, each
species caught () 30) was at least recorded by number and weight.
In Division 2J 20 hauls ranging from 150-600 m were carried out. Ail cod
(2818 kg = 3489 fish, mean weight 0.8 kg) obtained in 16 hauls until 310 m were
measured and 620 otoliths taken. No cod occurred in 4 hauls in deeper water
between 450 and 600 m where redfish dominated with-5~ of the total catches.
Four hauls in Division 2J gave a total catch of 586 kg, 32% of which were
cod. One haul in 500 m consisted mainly of roundnosed grenadier (356 kg = 8)%).
The proportion of older and larger cod seemed to have further decreased.
Wi th a mean length as low as 41.6 cm only 11% of cod measured more than 60 cm
and 1%0 over 80 cm. The scarcity of cod of age 8 and older is also well reflected
by the percentage age composition as given below. The recently recruited year
classes 1966-68 make up already 72%.
year class 1970 1969 1968 1967 1966 1965 1964 1963 1962 1961 1960 +
age 2 3 4 5 6 7 8 9 10 11 12 12+
% 1 10 18 33 21 10 5 1 1 + + +
avo length 27.2 31.9 37.7 40.1 43.3 49.1 54.3 58.868.3 (68.1) (87.5) (88.5)
Subarea 3
A. Status of the Fisheries
Catches of German (FHG) trawlers increased considerably by 47% in Division 3K
against 1971 due to diversion of effort from Subarea 2, thus fully compensating
83

- 5 -
for the loss caused by the worst ice conditions in Subarea 2. 94% of the total
catch from Division 3K was taken in February after the Labrador fishery had to
be given up.
The nominal catches in Subarea 3 as well as preliminary effort" data are given
in Table 1.
In spite of the increased fishing effort the catch per day fished also
increased quite remarkably. This could be an indication of a possibly higher
abundance of cod in the area because of good recruitment by the stronger 1966-68
year classes.
9~ of the total Subarea 3 catch consisted of cod. The redfish by-catch
remained at the same low level as in previous years. Only very small catches were
taken in Divisions 3L, 3M and 3Pn. Discards zre given in Table 2.
Forecast for 1973 - see Subarea 2
B. Special Research Studies
1. Environmental Studies
Hydrographic sections across the Laurentian channel from Divisions 3P to 4V
were carried out in March and November 1972 by Rjv "Walther Herwig". Results
are given in Res. Doc. 73/83 by W Lenz.
2. Biological Studies
A groundfish survey was conducted by R/V "Anton Dohrn" (ex. "Walther Herwig")
during the second half of November 1972 in the northern part of Division 3K and
in Subarea 2 (see remarks in Subarea 2 section).
In Division 3K 18 hauls ranging from 175-600 m were carried out. All fish
species caught were recorded at least by number and weight. Length frequencies
and ageing material were collected from priority species, especially cod. 15 hauls
in depths between 175 and 350 m contained cod but they were most abundant between
250 and 300 m. All cod (1729 fish = 1714 kig, mean weight 1.0 kg) were measured
and partly sampled for otoliths (798). Cod accounted for 38% of the total catch
weight.
3 hauls made in 450-600 m oontained no ood but 60% roundnosed grenadier and
28% redfish (total catch 1560 kg).
84

- 6 -
The percenta,ge a,ge cOII~.itien of cod for the combin'ed survey catches in
Division 3K as shown below is very similar to that found in Division 2J of
Subarea 2, and in fact also the length frequenqy distributions proved to be
almost the same. Mean length of cod in Division 3K was 44.5 cm and larger fish
of over 60 cm amounted to only 'J1, of the total number caught. 7f!1, .of the cod
were 4-7 years old (year classes 1968-65).
year class 1970 1969 1968 1967 1966 1965 1964 1963 1962 1961 1960
age 2 3 4 5 6 7 8 9 10 .11 12 12+
% 2 8 14 28 20 14 9 3 2 + + mean length 25.3 31.2 37.940.7 45.0 52.0 56.6 61.8 70.6
Subarea 4
A. Status of the Fisheries
There was no significant fishery carried out.by German (FRG) trawlers.
Compare Tabl e 1.
B. Special Research Studies
1. Environmental Studies
See Subarea 3, B.1.
A. Status of the Fisheries
Subarea 5
+
Besides the herring fishery (Res. Report~,Part III) only few pollock catches
were obtained (see Table 2).
B. Special Research Studies
1. Environmental Studies
Hydrographic observations were carried out by Rjv "Anton Dohrn" (ex. Walther
Herwig") in connection with the IeNAF larVal herring survey during the first half
of November 1972 (see Res. Doc. 73/19).
2. Biological Studies
R/V "Anton Dohrn" (ex. "Walther Herwig") took part in the international ICNAF
larval herring survey in the Gulf of Maine and Georges Bank area (see Res. Doc.
73/19). ---.. - .- .. -- - ..
In February/March 1973 R/V "Anton Dohrn" conducted a young herring survey
in Subarea 5 and Statistical Area 6 (see Res. Doc. 73/84).
85

27.-21. 11. 72
Hamil ...
21.-22.11.72
,,.. •• ,, tP ... " .... - .. " .. .'
- 7 -
Situ 1M!! .-."''1
57-12' N ,,-10'" '~"'.-"57IW
.3· JS'N 5S·00'N H' 22'.-U·"'.
34.9
...
Fig. 1: Hydrographic •• ctions off Labrador in Nov •• ber 1972
86

- 8 -
--JAN.--FEBR. -MARCH--
1969 e
1970
1971
1972
1973
Fig. 2.
-x- Cope Mugford -+- Hamilton Bonk -e- Sundall Bonk _ 0- Ritu Bonk
First appearance of drift ice at different fishing areas off Labrador £rom 1969-1973 as reported by the German fishing fleet.
B7