Embed Size (px)
Citation preview

INTERNATIONAL ASSOCIATION OF
INSURANCE SUPERVISORS
GLOBAL REINSURANCE MARKET REPORT 2004
DECEMBER 2005
International Association of Insurance Supervisors
Global Reinsurance Market Report 2004 Contents 1. Executive summary ....................................................................................................4 2. Introduction.................................................................................................................5 3. Challenges faced by the Reinsurance Transparency Group......................................6 4. Market developments .................................................................................................8 4.1 Follow up on 2004 significant events .........................................................................8 4.2 Significant events occurring in 2005.........................................................................10 4.3 Outlook of market commentators .............................................................................14 5. Developments in regulation and reporting................................................................15 5.1 Regulation of reinsurance ........................................................................................15 5.2 Regulation of disclosure ...........................................................................................19 5.3 Regulatory reporting .................................................................................................21 5.4 Financial reporting ....................................................................................................21 5.5 Credit risk transfer ....................................................................................................23 6. Resilience of the reinsurance sector ........................................................................24 6.1 Risk management practices of reporting reinsurers .................................................24 6.2 Tools used to monitor and manage the potential impact of catastrophes ................25 7. Cross-sectoral transfer of risk ..................................................................................26 8. Analysis of global reinsurance market statistics.......................................................27 8.1 Size of the global reinsurance market ......................................................................28 8.2 Structure and profile of reinsurance risk assumed ...................................................31 8.3 Derivative financial instruments and credit risk transfer activity ...............................37 8.4 Counterparty risk and linkages to other sectors .......................................................40 8.5 Investments ..............................................................................................................42 8.6 Profitability indicators ...............................................................................................44 8.7 Capital adequacy......................................................................................................47 9. Disclosure.................................................................................................................49 10. Conclusions..............................................................................................................50

Appendices I. 2004 global reinsurance market statistical tables
II. Participants in Reinsurance Transparency Group
III. Methodology and list of reporting reinsurers
IV. Summary of regulatory capital requirements in participating jurisdictions
V. Summary of regulatory reporting and current level of disclosure by reinsurers in participating jurisdictions
VI. Financial or regulatory reporting – summary of major differences to US GAAP in participating jurisdictions
VII. Summary of regulatory requirements on stress testing in participating jurisdictions
VIII. Examples of stress testing practices
IX. OECD: Recommendation of the Council on Assessment of Reinsurance Companies, 25 March 1998 – Extract of Annex and Notes
X. Main assumptions and qualifications
Page 4 of 100 IAIS Global Reinsurance Market Report 2004 December 2005
1. Executive summary
The IAIS Reinsurance Transparency Group (RTG) is pleased to present its second Global Reinsurance Market Report, based upon global reinsurance market statistics for the financial year 2004. The framework for producing the statistics was continued from that used in the previous year and these statistics represent the data of 53 significant reinsurance entities from seven major reinsurance jurisdictions meeting the selection criteria. The work continues to involve significant commitment by supervisors and industry in participating jurisdictions in a continued drive to improve the transparency of the global reinsurance industry. It is important, however, to understand some of the simplifying assumptions that have been made when preparing the report. Data has been aggregated from jurisdictions with different accounting conventions and regulatory requirements; the statistics have been compiled on a legal entity basis which will inevitably give a somewhat different picture than a compilation from group-level data; and approximations have been necessary to provide some of the analysis in the statistical tables in certain cases. These issues are discussed further in Section 3. The results of the global statistics are discussed in Section 8 of the report. Although not as profitable as the previous year, profitability in 2004 remained reasonably healthy, and reinsurers' capital was further strengthened. The 2004 statistics confirm the sector's ability to withstand the impact of the natural disasters occurring in 2004. Regarding reinsurers' participation in credit risk transfer, the data provided by the reporting entities continue to show modest participation by reinsurers in credit risk transfer (CRT). It is important for users of this report to understand, however, that monoline financial guarantors – significant participators in the CRT market – fall largely outside of the scope of this report and, in fact, no monoline insurer was captured by the selection criteria (which are set out in Appendix III) since most of their activity relates to insurance rather than reinsurance. Reinsurers' involvement in derivatives, other than credit derivatives, continues to be primarily for hedging (i.e. risk mitigation) rather than speculative purposes. The report also discusses 2005 loss-causing events. 2005 was a year that included several natural catastrophes ranging from the Asian tsunami in the early days of the New Year to the US hurricanes in September and October. Hurricane Katrina in the US is set to become the most costly natural hazard ever with current estimates for the size of insurance losses ranging from US$26 bn to almost US$70 bn. Its impact was felt hardest in the reinsurance sector as the scale of the loss exceeded the retention points of primary insurance companies. The reinsurance sector showed resilience in the face of such losses, helped by the fact that the past few years have been characterised by a hard market which had enabled reinsurance companies to rebuild balance sheets depleted by the WTC tragedy. Indeed, to date only a handful of companies have gone into run off as a result of the US hurricanes and substantial additional capital has been raised, much of which has gone into the creation of new companies, principally in Bermuda. While the sector has made great strides forward in terms of its modelling and aggregation of risk after Hurricane Andrew in 1992, recent events suggest that further work needs to be undertaken to ensure that the limitations of catastrophe models are well understood internally within insurance companies and that the data which populates models is as accurate and comprehensive as possible.

IAIS Global Reinsurance Market Report 2004 Page 5 of 100 December 2005
2. Introduction
The IAIS Reinsurance Transparency Group1 (RTG) was established with the objective of enhancing the transparency of the reinsurance sector through the regular production of global reinsurance market statistics and reports based thereon. The catalyst for the work of the RTG was a meeting of the Financial Stability Forum (FSF) in September 2002 in which the FSF discussed a number of concerns related to the reinsurance industry. While the FSF noted that the reinsurance industry had held up well in the face of past shocks, it observed that the lack of adequate transparency and public disclosures in the reinsurance industry made it difficult to assess the potential impact on the insurance sector as a whole and on the stability of other segments of the financial services sector, should industry problems arise in the future. The FSF called for efforts at the national and the international level to produce data and reports on the global reinsurance market. At the same time it asked individual reinsurance and insurance firms to expand the frequency, and enhance the quantitative and qualitative content, of their public disclosures.2 The IAIS produced an initial report on these issues in March 2004, in which it set out a framework for collecting, processing and publishing global market statistics covering a large proportion of the global reinsurance market. With regard to improving risk-oriented disclosures by individual reinsurers, the report reviewed the on-going work in this area by IAIS committees and by other groups and urged reinsurers and their supervisors to enhance risk-oriented disclosures in line with this on-going work. The primary responsibility of the IAIS Reinsurance Transparency Group is to produce the global reinsurance market statistics and reports, as well as to develop further the framework for collection of the statistics. The RTG also continues to monitor closely work in the field of risk-oriented disclosures by internationally active reinsurers, by working groups of the IAIS and by other forums. The IAIS published its first Global Reinsurance Market Report, based upon 2003 global reinsurance statistics, in December 2004.
1 The group succeeded and continues the work of IAIS Task Force Re which produced the initial report Enhancing Transparency and Disclosure in the Reinsurance Sector, March 2004.
2 See FSF Press Release dated 4 September 2002.
Page 6 of 100 IAIS Global Reinsurance Market Report 2004 December 2005
3. Challenges faced by the Reinsurance Transparency Group
In producing the tables contained in this report, the RTG faced certain challenges that require understanding so that the information presented is used appropriately by readers of the report. These challenges include the production of global data by aggregating local data that is not compiled on a consistent basis. Nevertheless, from a wide perspective, the members of the RTG believe that broad conclusions can be drawn from the tables. Readers should not use specific items from particular tables without awareness of the limitations. Some additional detail regarding the data challenges which have had to be overcome are included in Appendix X. The main challenges are as follows: Different accounting conventions and regulatory requirements The tables have been compiled from data from reinsurers supervised in different jurisdictions that employ different accounting and reporting conventions. This inevitably leads to distortions, some of which (e.g. the treatment of deferred acquisition costs) may be material. It was not possible to adjust all the data in each jurisdiction to a consistent accounting basis as this would require access to underlying individual entity and even transactional accounting records and the resources required to make such aggregation of data fully consistent would be enormous. Until such time as accounting conventions are harmonised across the world, it will not be possible to overcome this issue within the scope of the work of the RTG. It is noted that the International Accounting Standards Board is currently attempting to promote convergence in accounting and reporting standards and is interacting with local accounting standards setters and regulators. Similarly, regulatory requirements differ, sometimes significantly, and this also means that data which might otherwise be available to regulators on a consistent basis is not available. The IAIS is attempting to reinforce standards regarding the supervision of reinsurers3 and is evaluating ways that supervisors might be able to seek financial information based on general accounting and reporting standards that are, however, generally directed towards the needs of investors. Legal Entity Basis The RTG has compiled the data on a legal entity basis. This was necessary in order to consider cross-jurisdiction transactions and because different entities fall under different regulatory authorities and confidentiality could have been compromised by using a method based on financial groups. Moreover, group failures are triggered by failures at legal entity level and therefore dependencies and exposures need to be considered at this level. However, basing the statistics on legal entities causes some problems. As an example, intra-group reinsurances or guarantees which are used to mitigate risks may be robust at group level, and indeed lead to improved financial stability. However, it may appear from these statistics that there is a dependence on reinsurance which may not reflect the true risk outside of the particular group. In this regard, the statistics are likely to overstate risk exposures. This would have been
3 See section 5.1 'Regulation of reinsurance' in which the papers are discussed below the heading 'IAIS initiatives'.

IAIS Global Reinsurance Market Report 2004 Page 7 of 100 December 2005
addressed by compilation from consolidated group data but this would not have dealt with the other issues highlighted above. Approximations Due to variations in jurisdictions’ reporting requirements, most of the reporting entities do not compile data in the format or using the categorisations of the tables in this report, nor are they required to do so by their supervisors. In certain circumstances reporting entities have submitted estimates, or the RTG has itself made estimates in order to produce the tables. In some cases, not even estimates could be made so that there are some omissions from some of the tables. Notes to the tables (Appendix I), together with comments in Appendix X, indicate where there are approximations or omissions. A noteworthy example is that counterparty exposure data for some US entities, while publicly disclosed, is disclosed at a level of detail that is not consistent with the tabular information presented in Appendix I. The NAIC have had to analyse this data for the tables. Comparisons with previous year The global reinsurance market statistics included in this report represent the second year of collection of such statistics in this manner. Section 8 of this report provides some comparison of the 2004 statistics with those of 2003. However, it should be noted that, while selected on the basis of consistent criteria over the two years, the reporting reinsurers show some changes from 2003 to 2004 (see Appendix III for further information on the selection of reporting reinsurers). Furthermore, currency fluctuations over time can distort analyses of such data. Potential errors To maintain appropriate levels of confidentiality on an individual entity basis, the global statistics have been compiled in a manner which has made it impossible for any one party to the process to be responsible for, or able to verify, the parts of the process undertaken by other parties. Consequently the possibility for error is greater than in most reports of this nature. Nevertheless it is of course the case that all parties have endeavoured to produce valid data. Overall comment There are many developments in international accounting standards currently underway which will lead to greater consistency among jurisdictions and will address many of the challenges faced by the RTG in compiling this report and lead to exercises such as this being much easier, once in place. These statistics, although lacking some of the exactitude normally sought in exercises of this nature, nevertheless demonstrate progress which makes a considerable step forward in terms of transparency, sufficient to address the major issues which the RTG has considered. It is important that all users of this report use it as intended – i.e. at a high level and with awareness of the challenges and issues described in this section.

Page 8 of 100 IAIS Global Reinsurance Market Report 2004 December 2005
4. Market developments
In this section we look at developments within the global reinsurance market during 2005. Firstly, we review the impact of the significant events which occurred in 2004 and on which we reported last year. This is followed by comments on market implications of the significant natural disasters arising during 2005, in particular the impact of the hurricane season upon the US. Finally we look more generally at the outlook for the industry by market commentators, in particular the rating agencies.
4.1 Follow up on 2004 significant events Last year's report commented on the significant catastrophes occurring during 2004, and included preliminary estimates of their impact on the global reinsurance market. We have followed up on last year's analysis of those events to ascertain the nature and extent of the actual impact vis-à-vis the estimates provided last year. Impact of 2004 US Hurricane Activity
The cost of the average catastrophe in 2004 was $1.26 billion — twice that for other years in the past decade. That average was exceeded only once in the past 10 years — $1.33 billion in 2001, largely because of the September 11 terrorist attack. According to estimates of ISO,4 the U.S. property/casualty insurers paid a record $27.3 billion for insured property losses to homeowners and businesses from 22 catastrophic events in 2004 — surpassing losses from 2001. Over 80 percent of the insured losses were from the five hurricanes that made landfall in the U.S. along the Atlantic and Gulf coasts. Florida suffered the highest insured losses,5 all from the four third-quarter hurricanes — Charley, Frances, Ivan and Jeanne. A hurricane reporting summary prepared by the Florida Office of Insurance Regulation estimated the expected gross losses from the hurricanes in the state of Florida as follows:6 Number of Estimates claims expected Hurricane reported gross loss US$'bn Charley 481,553 7,419 Frances 535,734 4,754 Ivan 210,900 4,790 Jeanne 435,141 3,932 ________ ______ 1,663,328 20,895
4 Insurance Services Office, Inc. USA Press Release of February 2005
5 The ISO estimated Florida insured losses of US$18.8 bn on an industry-wide basis arising from catastrophes, reflecting the total insurance payment for personal and commercial property items, business interruption and additional living expenses. The estimate excludes loss adjustment expenses.
6 As reported in August 2005.

IAIS Global Reinsurance Market Report 2004 Page 9 of 100 December 2005
According to a Guy Carpenter report,7 no individual storm had losses that penetrated through the retention levels of most insurers. In addition, the Florida Hurricane Catastrophe Fund, a state government-backed pool, absorbed a significant amount of the losses. Furthermore, Florida’s largest insurer, the state-organised Citizens Property Insurance Corporation, had no reinsurance protection and levied a one-time assessment on Florida property insurance carriers to recoup losses sustained from last year's devastating hurricanes. The hurricanes also had an impact on the catastrophe reinsurance market in Bermuda, which provides reinsurance to many US insurance companies. Approximately US$2.6 bn was paid by reinsurers in Bermuda to cover claims from the US hurricanes in 2004. Impact of 2004 natural disasters (typhoons, flooding and storms) in Japan
During the second half of 2004, Japan experienced a series of natural disasters including floods due to heavy rains in mid-July, and a number of typhoons as well as storm damage in December. These natural disasters pushed up claims payments considerably and resulted in the highest recorded claims payments for natural disasters in a single fiscal year. Total claims for those major events at the end of the fiscal year 2004 amounted to 727.4 billion yen8 (US$6.8 bn): Occurred in Major event Claims ¥ bn US$'m9 July Heavy Rain (in Niigata & Fukushima) 17.8 166 Heavy Rain (in Fukui) 6.2 58 August Typhoon No.16 117.5 1,098 September Typhoon No.18 382.3 3,574 Typhoon No.21 33.6 314 October Typhoon No.22 27.2 254 Typhoon No.23 129.2 1,208 December Storm damage 13.6 127 ______ _______ Total 727.4 6,799 (Data source: The General Insurance Association of Japan) For such emergences, Japanese insurers are required to set up a contingency reserve (catastrophe reserve) to prepare for the extraordinary claims. For the accounts of the fiscal year 2004, all of the eight largest Japanese insurers drew upon the contingency reserve for fire insurance,10 the balance of which stood at 701.1 billion yen (US$6.6 bn9) at the end of the fiscal year 2004 (representing a decrease by 15.3% from the previous year's balance of 827.6 billion yen (US$7.7 bn9)), to ease the impact of
7 Guy Carpenter & Company Inc: The World Catastrophe Reinsurance Market 2005
8 The figure was recalculated from the recent analysis by the General Insurance Association of Japan, and exceeded the estimated claims of 515.1 billion yen as reported in the 2003 report by about 200 billion yen.
9 US$ equivalent approximated using an indicative exchange rate of ¥106.97.
10 In Japan, wind and flood damage is generally covered by fire insurance.
Page 10 of 100 IAIS Global Reinsurance Market Report 2004 December 2005
these natural disasters on total profit. In addition, as in the United States, losses from many of the storms did not penetrate to individual companies' ceded catastrophe reinsurance coverage. As a consequence, net earnings for the eight largest Japanese non-life insurers at the end of the fiscal year 2004 resulted in 259.9 billion yen (US$2.4 bn9), which represents a decrease by 17.8% in net earnings from the previous year's 316.3 billion yen (US$3 bn9). Summary of 2004
Overall the market stood up well to the catastrophic events occurring in 2004 for the reasons highlighted above. The market also appeared to be more disciplined, in spite of excess underwriting capacity. In a number of countries higher event limits were imposed on pro rata programmes as reinsurers addressed increased concerns about catastrophic exposures. In countries where primary market rates were producing high returns, some cedants retained more exposure, cutting back on their reinsurance purchases.
4.2 Significant events occurring in 2005 The effect of Hurricane Katrina and other natural catastrophes
The resilience of the reinsurance market to withstand losses was further tested in the third and fourth quarters of 2005 arising from Hurricane Katrina and a number of others during the course of the North Atlantic hurricane season. Katrina was not the only major event during the 2005 North Atlantic hurricane season. Katrina was preceded by hurricane Dennis11 in July and succeeded by hurricanes Rita and Wilma. Hurricanes Rita and Wilma themselves caused substantial damage, with estimated insured losses of US$4 bn – US$7 bn (Rita) and US$8 bn – US$12 bn (Wilma).12 However, Katrina merits particular mention in view of its magnitude as a single event and consequent greater potential impact upon reinsurers. The loss estimates of Hurricane Katrina make it by far the largest insured loss from a single event since the 11 September 2001 tragedy, far exceeding the previous largest insured hurricane loss suffered by the insurance industry – Hurricane Andrew in 1992.
11 Estimates of insured losses arising from Hurricane Dennis include US$1 – US$3 bn by RMS (Press release of 13 July 2005) and US$1 – US$4 bn by EQECAT (Press release of 11 July 2005).
12 As estimated by Risk Management Solutions (RMS).

IAIS Global Reinsurance Market Report 2004 Page 11 of 100 December 2005
Estimates of cost of Hurricane Katrina13 Estimates from professional firms of the cost to the insurance sector are as follows:
Low High US$'bn US$'bn Risk Management Solutions 40 60 AIR 61 69 EQECAT 26 43 ISO14 34 34 Towers Perrin 40 55
As can be implied from the ranges of estimates above, current assessments of the cost to the insurance sector involves a large degree of uncertainty. Factors which have added to the complexity in making estimates include: the separation of damages between wind and flood; the impact of a large proportion of commercial losses, including business interruption; the uncertain length of the recovery process; and the effects of potential litigation. Katrina compared with Andrew
The cost of 1992's Hurricane Andrew was insured losses of around US$20 bn. The box above shows the expected costs of Katrina to be much higher, even when inflation adjusted. Towers Perrin has estimated the insured losses to be borne by the reinsurance sector at between US$20.7bn – US$24bn (representing 44% - 52% of the total cost).15 Nevertheless, the sector appears to have been able to withstand the impact. In 1992, only 30% of insured losses due to Hurricane Andrew were ultimately ceded to the reinsurance sector. Even so, as Andrew took place after a soft market, the overall stock of capital in the global reinsurance market was largely depleted and it took years for the sector to recover. Its impact resulted in a reduction in balance sheet capital of many companies, which reduced capacity. Events of September 11 were similar. Both resulted in stronger pricing and the entrance of new capital. As noted above, Katrina is expected to generate significant losses for the reinsurance sector, but is not expected to lead to widespread solvency issues. As noted by Fitch, Katrina occurred following "a sustained period of technically adequate premium rates…and strong capital formation."16 For the reinsurance sector in general it is expected that losses from Katrina could be absorbed by 2005 earnings, in which case net income and return on equity for 2005 would suffer but capital, and thus capacity, would be maintained.
13 Provided for illustration. See Benfield: 2005 Catastrophe losses: Hurricane Katrina, 15 November 2005
14 Insured property losses only. Preliminary estimates as announced in Press Release dated 4 October 2005. On 28 November ISO issued a further Press Release estimating insured catastrophe losses in 2005 at US$50.3, of which Katrina, Rita and Wilma account for US$45.2.
15 Towers Perrin: Hurricane Katrina: Analysis of the impact on the insurance industry, October 2005
16 FitchRatings: Mid-year 2005 global reinsurance review and outlook: steady as she goes but do troubled waters lie ahead? September 2005

Page 12 of 100 IAIS Global Reinsurance Market Report 2004 December 2005
Impact upon individual reinsurers
No reinsurer failures have been reported as a direct consequence of the recent US hurricanes. While there does not seem to be a clear view as yet on Katrina's impact upon market sentiment toward the sector generally (see 'Outlook of market commentators' below), rating agencies are carefully monitoring developments. However, there has been specific action by rating agencies in respect of individual reinsurers:
- AM Best and Standard & Poor's have placed a number of reinsurers 'under review' or 'on watch' with negative implications, due to the magnitude of their loss in relation to earnings or capital.
- There has been a small number of actual downgrades. There is also the question as to whether Katrina will have an impact on the supply of reinsurance and retrocession capacity in general in the near term, both in terms of price and/or availability. Impact on the sector's capital
All insurers writing property coverage in the south east of the US, and most reinsurers worldwide, are expected to incur losses as a result of Katrina. However, Hurricane Katrina losses are not expected to have a material impact on the reinsurance sector's overall capital position but rather to result in significantly reduced earnings for the year 2005. On the basis of announced company loss estimates, which it lists in its report, Benfield has estimated that insured losses from Katrina will be shared as follows: North America (36%); Bermuda (35%); the UK, including Lloyd's (12%); and Europe and the rest of the world (17%).17 The same report also lists significant post-Katrina capital raising initiatives which, in addition to those by companies domiciled in Bermuda, include a number of carriers from the US, the UK and Switzerland. The catastrophe reinsurance market in Bermuda has experienced significant claims as a result of Hurricanes Katrina, Rita and to a lesser extent Wilma. Current estimates of reported losses to Bermuda insurers and reinsurers arising from hurricanes Katrina and Rita are US$10.3 bn,18 although final estimates of the total impact will take time to determine. While the losses suffered by the Bermuda carriers has resulted in third quarter net losses for most of the market, at this time only one reinsurance company has decided to place itself into run-off from the event. Many Bermuda reinsurance companies have successfully raised additional capital from either share offerings or debt to help maintain strong capitalisation. The reinsurance market has also seen renewed interest from investors, with new capital coming into the market to take advantage of potential rate increases and a perceived loss of industry capacity for hurricane cover in the aftermath of Katrina and Rita. This is particularly evident in Bermuda, where the capital takes two forms: firstly, additional capital raised by existing reinsurers (as noted above); secondly, the formation of eleven19 new Class 4 companies in Bermuda since the storms (see Appendix IV and V for additional information about Bermuda Class 4 companies). At
17 See Benfield, op. cit
18 Source: Dowling and Partners, IBNR # 47, Vol. XII, 27 November 2005.
19 As at the date of this report.

IAIS Global Reinsurance Market Report 2004 Page 13 of 100 December 2005
the date of this report US$8.4 bn of capital had been announced to fund new start-ups, in addition to announced capital raising of US$8.7 bn by existing Bermuda carriers. 20 In the UK, the impact of Katrina, Rita and Wilma on Lloyd's earnings for 2005 is estimated at just over US$5bn and the chances that the Lloyd's market will make an overall profit for 2005 are small. However, no material impact is expected on Lloyd’s Central Fund and no Lloyd's syndicate has been unable to trade forward as a result of the US hurricanes. Underwriting capacity for the Lloyd's market is expected to increase by 7% to US$26.5bn for 2006, reflecting an improved rating environment in catastrophe-related classes of business. Implications for risk management
Since Hurricane Andrew the insurance sector has made significant improvements in its ability to monitor aggregate geographic exposures. Nevertheless, catastrophe models by their nature are not precise measurement tools – the lack of historical data required for enhanced use of internal models, results in a greater degree of judgement in calibrating such models; and historical data may not accurately predict future outcomes over the longer term. Katrina is characterised particularly by the high level of commercial property claims, which are difficult to estimate, and by uncertainty of circumstances following the event which will affect business interruption and additional living expenses.21 We note that some initial published estimates of losses from Katrina were subsequently increased significantly. The 2004 and 2005 US hurricane experience highlights the limitations of models. Modelling firms and users thereof have publicly discussed the need to revise models to reflect appropriately: demand surge, an increased frequency of storm activity, the share of water losses that adjusters may assess to wind insurance coverage, the commercial lines risk embedded in contingent business interruption contracts and the possible replication of unusual protracted, extensive flooding as has occurred in New Orleans. At least one commentator expects that reinsurers may use Katrina as an opportunity to increase exposure data requirements for reinsurance submissions and are expecting insurers to be "more cautious in their reliance on the catastrophe models, more fully understanding [of] their limitations and building in appropriate conservatism."22 Conclusion
While the size of the losses triggered by the 2005 US hurricanes are still uncertain, the following tentative conclusions can be drawn: • The impact of Katrina was felt heavily by the reinsurance sector. This contrasts
with losses incurred during the 2004 hurricane season in which primary insurers' respective retention levels were frequently not pierced and where, in any event, a large percentage of the losses was covered by a discrete state protection fund.
20 Source: Reinsurance Association of America, Post Katrina Capital raised as of 2 December 2005, from press release by Best Week.
21 As noted by Towers Perrin, op. cit.
22 Towers Perrin, op. cit.

Page 14 of 100 IAIS Global Reinsurance Market Report 2004 December 2005
• Although final estimates of the cost will take some time, insured losses – including those borne by the reinsurance sector – are very large.
• Despite the scale of likely claims, no widespread failures appear to have been triggered in the storms' immediate aftermath. A few reinsurers have closed to new business, but more importantly the sector has attracted significant amounts of new capital, most of which has been directed to Bermuda.
• Whist the industry has made significant improvements in risk modelling since Andrew, recent activities have also underlined the limitations of the models used, as well as the importance of ensuring that they are not only properly calibrated but also populated by good quality data.
The storm seasons of 2004 and 2005 are indicative of the unexpected risks that reinsurers face while they accumulate exposures. This was reinforced by the Indian Ocean tsunami in December 2004 and, more recently, by the terror bombings in London and Egypt.
4.3 Outlook of market commentators Last year we reported on the improvement in outlook for the sector by the rating agencies, noting that between July and September 2004 Standard & Poor’s, Fitch and Moody’s all revised their outlook for the sector from ‘negative’ to ‘stable’. In its Mid-year 2005 Outlook23 Fitch anticipated maintaining a 'stable' outlook for the sector, in view of expected consistent underwriting, operating and capital trends over the next 12-24 months. Prior to hurricane Katrina, Standard & Poor's was also maintaining a 'stable' outlook in its Global Reinsurance Highlights 2005, published in early September. Reaction post hurricane Katrina
Standard & Poor's revised its outlook from 'stable' to 'negative' at the end of September 2005. In the accompanying press release24 it commented that "the negative outlook implies that downgrades are expected to outnumber upgrades in the remainder of 2005, although the number of downgrades is expected to be modest." It placed a number of reinsurers on CreditWatch with negative implications, representing those for which the impact of the North Atlantic hurricane season was expected to result in a reduction in capital. Standard & Poor's intends to review its outlook once the impact of the coming renewal season becomes clearer. Fitch has maintained its 'stable' outlook following Katrina, and anticipates Katrina to be more of an earnings event than one with impact on the sector's capital, a view also largely shared by Standard & Poor's.25 Moody's has also maintained its 'stable' outlook for the sector.
23 FitchRatings: Mid-year global reinsurance review and outlook: Steady as she goes but do troubled waters lie ahead? September 2005
24 Standard & Poor's: Near-term strains on reinsurers' financial strength after Katrina lead to negative global reinsurance outlook. Press release dated 28 September 2005.
25 Standard & Poor's: Teleconference spotlights insurance-related issues relating to hurricanes Katrina and Rita. Press release dated 3 October 2005

IAIS Global Reinsurance Market Report 2004 Page 15 of 100 December 2005
Movements in ratings of reporting entities
We observe that, following some deterioration in reinsurers' average ratings between 2001 and 2003, the downward trend stabilised in 2004.26 Ratings have remained fairly stable during 2005. Of the 53 reporting entities covered by this report, there were three upgrades and eight downgrades during 2005.27 The impact of the North Atlantic hurricanes does not appear to have had significant impact on reinsurer ratings generally. Outlook beyond 2005
A year ago a softening of the market was anticipated and commentators were discussing the need to maintain market discipline. However, as discussed above, the magnitude of losses incurred as a result of hurricane Katrina as a single-event loss may contribute to a hardening of property/catastrophe premium rates. It is too early to conclude what its impact on pricing more generally will be. Both Fitch and Standard & Poor's have commented on the apparent growing frequency in weather-related events amid concerns over changes in weather patters. This is a potential challenge to which the sector may need to respond in terms of pricing and risk management in the future.
5. Developments in regulation and reporting This section discusses the main on-going and recent developments in regulation pertaining directly, or indirectly, to reinsurance.
5.1 Regulation of reinsurance The regulation of reinsurers is currently not harmonised. Descriptions of individual reporting jurisdictions’ regulatory capital requirements and regulatory reporting for reinsurers are provided in Appendices IV and V. They show that the level and content of regulation vary substantially between jurisdictions. IAIS initiatives • IAIS initiatives towards global harmonisation of the regulation of reinsurers to date
include the IAIS Principles on minimum requirements for supervision of reinsurers (October 2002) and the IAIS Standard on supervision of reinsurers (October 2003). Based on the underlying premise that all reinsurers must be supervised, the Principles and the Standard anticipate a global approach to the supervision of reinsurers that will be anchored in the home jurisdiction, and thus constitute a significant first step towards harmonising supervisory practice for the global reinsurance industry. The Principles identify requirements of a supervisory framework that are common for primary insurers and for reinsurers, such as licensing, fit and proper testing and on-site inspection, and those requirements that need to be adapted to reflect reinsurers’ unique risks: technical provisions,
26 See IAIS reports Enhancing transparency and disclosure in the reinsurance sector, March 2004; and Global Reinsurance Market Report 2003, December 2004.
27 As at 13 December 2005.

Page 16 of 100 IAIS Global Reinsurance Market Report 2004 December 2005
investments and liquidity, economic capital adequacy, corporate governance, and exchange of information. The Standard addresses the latter requirements more specifically. The IAIS also recently issued a Guidance paper on risk transfer, disclosure and analysis of finite reinsurance (see below). Following the adoption of these papers, work is continuing with the completion of a survey on reinsurance supervision, whose purpose is to assess the degree of compliance with the Principles and Standard on supervision of reinsurers and to determine what additional guidance or elaboration of the Standard may be required to assist supervisors As noted above, the Principles and the Standard are based on the underlying premise that all reinsurers must be supervised, and anticipate a global approach to the supervision of reinsurers that will be anchored in the home jurisdiction. With this aim in mind the IAIS is continuing to focus its efforts on developing mutual recognition criteria and processes which will enable the host supervisor to rely on the supervisory capacity and capability of the home supervisors, as well as providing credibility and comfort to the host supervisor on the reinsurance support provided to its local insurers. This work is likely to result in an IAIS Guidance Paper in due course.
• Finite reinsurance In October 2005 the IAIS issued a Guidance paper on risk transfer, disclosure and analysis of finite reinsurance. Finite reinsurance, or financial reinsurance, is a contract between an insurer and a reinsurer where limited risks are transferred to the reinsurer. In some cases, these contracts may be financing arrangements (where funds are effectively loaned by the reinsurer to the insurer), in which case they should be accounted for as loans and not reinsurance. Recent regulatory developments have highlighted the concern that this form of reinsurance has been used improperly on occasion. From a supervisory perspective, the primary issues in finite reinsurance revolve around whether there is adequate risk transfer and there is appropriate accounting and disclosure. In some instances, misuse of finite reinsurance has resulted in misrepresentation of the insurer's financial position to supervisors, policyholders, investors and other stakeholders and brought into question the adequacy of corporate governance and management accountability. The supervisory guidance paper outlines the key areas that supervisors should focus on. Key sections of the paper include:
• background on the development of finite reinsurances and uses
• key characteristics of finite reinsurance, evaluation of risk transfer, accounting and disclosure
• issues supervisors should be aware of and recommended supervisory approaches.
The IAIS will continue its consideration of industry practices involving, and supervisory approaches to, finite reinsurance to keep abreast of developments. In doing so it will also be considering whether further IAIS papers are needed on this topic.

IAIS Global Reinsurance Market Report 2004 Page 17 of 100 December 2005
• Solvency and capital adequacy
In October 2005 the IAIS adopted a paper A new framework for insurance supervision. The framework underpins the IAIS's past and future standard-setting activities on supervision of insurers (and reinsurers). A central part of this framework is the development of a common structure and common standards for the assessment of insurer solvency in order to enhance transparency and comparability across different regulatory regimes, and thereby engender convergence of solvency regimes on an international basis. In this regard the IAIS also adopted in October 2005 a paper Towards a common structure and standards for the assessment of insurer solvency: cornerstones for the formulation of regulatory financial requirements. These cornerstones will form the foundation of further work towards common standards for the assessment of insurer solvency. A 'roadmap paper' containing a reasonably detailed work plan and time path for the completion of the common structure and common standards for solvency assessment is planned for release before the end of 2005.
Developments in the EU • Financial Groups Directive
The Financial Groups (or Conglomerates) Directive was adopted by the European Commission in November 2002 and published in its final form in February 2003. The Directive implements the internationally agreed principles for the supervision of financial groups previously issued by the Joint Forum. The implementation date of the Directive by EU member states was 11 August 2004 and its requirements first applied to the supervision of accounts for the financial year beginning on 1 January 2005 or during that calendar year. The key objective of the Directive is to enhance prudential soundness and effective supervision of financial conglomerates – large financial groups active in different financial sectors, often across borders (i.e. at least 40% of the group’s business is financial and at least 10%, or failing that €6 billion of its financial business, is in each of the insurance/reinsurance and the combined banking/investment sectors). The Financial Groups Directive also provides for capital adequacy requirements for the group to include all financial undertakings (including reinsurance undertakings) within the group. The application of the requirements of the Financial Groups Directive in 2005 has created a new financial regime for conglomerates. The requirements for conglomerates build on key aspects of the existing regulatory regimes for the different business sectors, including the need for a conglomerate to have adequate capital. Requirements are also in place in relation to risk concentration and intra-group transactions. In addition conglomerates must have adequate systems and controls to monitor their intra-group risks. To streamline the supervision of such groups, the Directive requires a single supervisory co-ordinator for each conglomerate. A key aim of the Directive is the consistent application of group supervision for all financial groups operating in Europe. It achieves this by extending the scope of the current supervisory oversight of banking and investment groups, to include parent companies located outside the EEA, as is already the case for insurance groups. Where such non-EEA groups are already subject to equivalent supervisory

Page 18 of 100 IAIS Global Reinsurance Market Report 2004 December 2005
requirements in their home country, the need for additional regulation from the EEA falls away. Conglomerates are also subject to similar requirements if they have non-EEA parents.
• Reinsurance Directive In June 2005, the proposed EU Directive on Reinsurance was approved by the European Parliament and on 17 October, it was adopted by the European Council of Ministers. EU Member States will have two years for complying with the directive which came into force following its publication in the Official Journal on 9 December 2005. The directive establishes a legal framework for the regulation and prudential supervision of reinsurers by their 'home country' on the basis of a harmonised system. The directive requires reinsurers to be authorised by the member state in which the reinsurer has its head office and imposes minimum capital requirements on authorised reinsurers, requiring them to maintain at all times, capital resources of not less than €3m (€1m in case of captives). Authorised reinsurers will also need to comply with various other prudential rules, including requirements to maintain a minimum margin of solvency, establish adequate technical provisions and ensure that assets are prudently invested, properly diversified and sufficiently liquid, having due regard to the amount and duration of the expected claims payments. The directive also lays down supervisory powers in cases where a company’s financial situation deteriorates, where no adequate technical provisions are in place or where there is insufficient solvency. These powers provide scope for the home member state to require the submission of a plan for the restoration of a sound financial situation, a finance scheme and a financial recovery plan or to withdraw authorisation. Once implemented, the directive will contribute to reinforce financial security and stability by imposing minimum capital requirements and improving transparency about reinsurers, thereby facilitating the markets’ assessment of their financial standing.
• Solvency II project At the beginning of 2000, the European Commission initiated a fundamental and wide-ranging review of the current EU solvency regime for insurance (and reinsurance) undertakings in the light of current development in insurance, risk management, finance techniques and financial reporting. One of the key objectives of the review is to establish a solvency system that better matches the true risk profiles of insurance undertakings and reflects market realities and developments while avoiding undue complexity. It is intended that this should then lead to more efficient and secure markets and, by harmonising national legislation and supervisory practices, to a more level playing-field among insurers in Europe and to a stronger position for European insurers generally. Solvency II is characterised by its risk-based approach. Detailed work on Solvency II started in September 2004 and, currently, it is expected that a framework directive will be issued in June 2007 with a detailed directive to be finalised in 2008 and fully implemented in 2009/2010.

IAIS Global Reinsurance Market Report 2004 Page 19 of 100 December 2005
OECD work on reinsurance – an overview • Since the mid-1990s, the OECD Insurance Committee has been pursuing
systematic and focused work on reinsurance aimed at promoting enhanced transparency of the sector. In 1996 it published a Note entitled Regulation and Supervision of Reinsurance, which observed a large range in the degree of supervision of reinsurers among OECD Member States. In 1998 the OECD issued the Recommendation of the Council on Assessment of Reinsurance Companies, which recommended that the Member States invite insurance companies and reinsurance companies under their supervision to collect and provide specific information that would allow the ceding companies to assess the soundness of the reinsurance companies to which they cede risks. The Recommendation identified in its Annex and Notes 18 specific factors which an insurer ought to consider in its assessment of a reinsurer in respect of their business relationship (see Appendix IX).
• In 2002, the Committee issued a binding OECD Decision of the Council on the Exchange of Information on Reinsurers, which mandates Member States to provide relevant information on reinsurers established in its territory, and, under certain conditions, a dedicated OECD internet reinsurance network with information on reinsurer fraud, insolvency and limitation of activity within their respective jurisdictions.
• In 2004 the Committee commissioned an extensive Paper entitled Trends in Reinsurance Markets and Regulation in OECD Countries and an identically entitled Note for discussion, which addresses reinsurance market issues and concerns after the 9/11 events, reviews the rationale and alternative approaches to reinsurance regulation, focuses on reinsurer capital adequacy requirements and highlights the risks in reinsurer market conduct. The Committee is continuing to monitor developments relevant to the sector.
5.2 Regulation of disclosure Current disclosure requirements and practices for reinsurers are widely divergent (see Appendix V for a summary of regulatory reporting and the current level of disclosures by reinsurers in participating jurisdictions). In May 2004 the Joint Forum published a report entitled Financial Disclosure in the Banking, Insurance and Securities Sectors: Issues and Analysis. This report examines the progress made by financial firms in adopting the recommendations contained in the report of the Multidisciplinary Working Group on Enhanced Disclosure (Fisher II working group) issued in April 2001, and the efforts of regulators and other standard setters in the area of financial disclosure. It shows that while firms have made good progress on enhancing financial disclosures, greater levels of disclosure are desirable. It was encouraged to see that regulators and standard setters are working on initiatives aimed at enhancing financial disclosures, mentioning on-going work by the IAIS, the Basel Committee on Banking Supervision, the International Organization of Securities Commissions and the International Accounting Standards Board. IAIS initiatives Recent and current steps taken by the IAIS towards global harmonisation of disclosure regulation for insurers and reinsurers are:

Page 20 of 100 IAIS Global Reinsurance Market Report 2004 December 2005
• The adoption of an IAIS Standard on disclosures concerning technical performance
and risks for non-life insurers and reinsurers in October 2004, the first of three IAIS standards regarding public disclosure requirements. The standard addresses the analysis of technical performance, key assumptions and sources of measurement uncertainty as well as sensitivity, stress testing and scenario analysis (including sensitivity analysis of both assets and insurance liabilities).
• The adoption of an IAIS Standard on disclosure concerning investment risks and performance for insurers and reinsurers, in October 2005. This standard sets minimum disclosure requirements, both qualitative and quantitative, so that market participants can assess the specific risks to which the company may be exposed. The standard requires disclosures on the investment objectives, risk exposures, asset class segregation and performance measurement.
• Work on a draft IAIS Standard on disclosures concerning technical performance and risks for life insurers and reinsurers, which is expected to be issued in 2006.
It is intended that the three standards will be combined into a single disclosure standard at a later date. International Accounting Standards Board (IASB) The International Accounting Standards and International Financial Reporting Standards issued by the IASB impact disclosure by reinsurers within the European Union, and other jurisdictions adopting IAS/IFRS for public financial reporting purposes, in particular: • IFRS 4 ('Insurance Contracts')
The standard requires, in particular, disclosure that: - identifies and explains the amounts in an insurer’s financial statements arising
from insurance contracts; and
- helps users of those financial statements understand the amount, timing and uncertainty of future cash flows from insurance contracts.
The IAIS is currently conducting a survey on the impact upon supervisors of the implementation by (re)insurers of this standard.
• IFRS 7 ('Financial Instruments: Disclosures') This standard was issued by the IASB in August 2005 and it supersedes IAS 30 ('Disclosures in the Financial Statements of Banks and Similar Financial Institutions') and the disclosure requirements of IAS 32 ('Financial Instruments: Disclosure and Presentation'),28 and is effective from 1 January 2007 with earlier application encouraged. The standard updates the disclosure framework for risks arising from financial instruments. It takes into account public and private sector initiatives which have led to proposals for improvement and the fact that techniques used by entities for
28 As a result of IFRS 7, IAS 30 is withdrawn and IAS 32 is renamed Financial Instruments: Presentation.

IAIS Global Reinsurance Market Report 2004 Page 21 of 100 December 2005
measuring and managing exposures to risks arising from financial instruments have evolved. The standard gives rise to consequential amendments to IFRS 4 in respect of contracts which fall under the definition of 'insurance contract' rather than 'financial instrument'.
5.3 Regulatory reporting
In participating jurisdictions, reinsurers are required to provide regulatory returns to their supervisors. Some of the information in those returns is available to the public and some is obtained on a confidential basis (see Appendix V on regulation and current level of disclosure by reinsurers in participating jurisdictions). The publicly available information ranges from financial statements (balance sheet, profit and loss account, and schedules containing informative notes and data such as the detailed list of investments) to the full list of regulatory reporting templates. The non-public information required by supervisors is generally substantial when public disclosure is limited, including such items as detailed technical results, information on provisions, claims development triangles by class of business, or stress testing analysis on assets and provisions. Where the regulation of pure reinsurers is more limited than the regulation of insurers which also accept reinsurance, pure reinsurers may not be asked to provide supervisors with the corresponding regulatory returns, such as those on capital adequacy and solvency requirements or asset-liability matching.
5.4 Financial reporting Each jurisdiction is reporting in different GAAP
Currently, there are wide divergences in the level of financial reporting requirements applied to reinsurers across jurisdictions. There are also significant variations in the accounting practices, as well as the terms and measurement approaches, used by individual reinsurers. Although insurance and reinsurance accounting in the EU is currently harmonised under the directives, these directives contain a significant number of options that have been exercised differently in Member States. As a consequence, there is no common accounting regime even in the EU. For purposes of producing the Global Reinsurance Market Statistics, financial information included in the statistics is consistent with GAAP of the reporting jurisdictions or entities concerned or, in the case of US reporting reinsurers, consistent with regulatory reporting practice. Introduction of IFRS for European reinsurers
The introduction of IFRS29 on 1 January 2005 has significantly changed at least the consolidated financial statements of reinsurers. The use of international financial reporting standards is expected to increase convergence of financial reporting requirements.
29 For the purposes of this paper, IFRS is taken to include International Accounting Standards(IAS) and International Financial Reporting Standards (IFRS) issued by the International Accounting Standards Board (IASB).

Page 22 of 100 IAIS Global Reinsurance Market Report 2004 December 2005
For reinsurers, as for insurers, the introduction of such standards comes in two stages. This first phase of the IASB's Insurance Contracts Project is meant to be a stepping stone towards a final standard. Phase I of the project has resulted in IFRS 4 ('Insurance Contracts'), which is an interim standard dealing only partly with the accounting issues related to insurance contracts. As a result, following the adoption of IFRS 4 with effect from 2005, and until Phase II of the Insurance Contracts Project is completed, there will be no comprehensive standard on insurance assets and insurance liabilities. Instead, the major rules will be found in IAS 39 ('Financial Instruments: Recognition and Measurement') and in the interim standard IFRS 4. The Regulation No. 1606/02 of the European Parliament and of the Council of 19 July 2002 on the application of international financial reporting standards relates to the consolidated accounts of EU listed entities and publicly traded entities. As a result of this Regulation, endorsed IFRSs are automatically applicable as of 2005 to the consolidated financial statements of listed insurers and reinsurers and those with listed debt instruments. However, some Member States have chosen to require or permit the application of IFRS to other types of insurers and reinsurers as well as to annual (individual) accounts. As mentioned above, the use of IFRS is now required for the consolidated accounts of insurers and reinsurers, while – for the moment – this is generally not the case for annual (individual) accounts. A number of jurisdictions, however, allow, but do not require, the application of IFRS to both consolidated and annual accounts. Consequently, in these countries, the real impact largely depends on companies’ choices. Areas where IASB standards cause some reinsurers concern
The main areas where further discussion may be necessary regarding how IASB/IFRS projects will affect reinsurers are the same as for direct insurers : The mismatch issue arises from reporting assets on a fair value basis (IAS 39)
while liabilities in most countries are based on historical cost (IFRS 4 maintains local GAAP during Phase I). This may result in equity volatility due not only to economic conditions but also to this inconsistency between measurement methods for assets and liabilities. A number of solutions to this 'mismatch' issue have been discussed with the IASB but none has achieved general acceptance.
The IFRS 4 provides a definition of an insurance (and reinsurance) contract which
is based on the 'significance' of insurance risk accepted by the (re)insurer. This definition may have significant effects on the financial statements of reinsurers, where a part of the current portfolio may not contain 'significant' insurance risk. The ineligibility for certain contracts to be considered (re)insurance contracts may effect the level of technical provisions. Furthermore, the lack of guidance on the definition of insurance risk and of its 'significance', could potentially damage the comparability of financial statements and, as such, cause concern to supervisors.
These are areas which have the potential to cause a lack of transparency between different reinsurers even after the changes are adopted. The further work described below will try to address some of these concerns. Phase II of the IASB's Insurance Contracts Project
To assist with the second phase of its Insurance Contracts Project the IASB created an Insurance Working Group (IWG) to analyse accounting issues relating to insurance contracts, and to advise the Board thereon. The IWG has met regularly since it was

IAIS Global Reinsurance Market Report 2004 Page 23 of 100 December 2005
formed in September 2004. Nevertheless Phase II involves challenging issues and, according to its most recent work plan, the IASB is not expecting to publish an initial Discussion Paper on Phase II before the third quarter of 2006, and it is unlikely that reinsurers would be required to apply the final insurance standard before 2011. IAIS input into Phase II of the IASB's Insurance Contracts Project
The IAIS is represented on the IWG through two seats as 'official observer'. The IAIS believes that it would be most preferable if the methodologies for calculating items in public financial reports are able to be used for, or are substantially consistent with, the methodologies used for regulatory reporting purposes, with as few changes as possible to satisfy prudential reporting requirements. In early June 2005 it published a paper Issues arising as a result of the IASB's Insurance Contracts Project – Phase II: Initial IAIS Observations,30 which provides its initial observations as input into Phase II of the IASB's Insurance Contracts Project. The paper highlights a number of areas where the IAIS believes differences may develop and whether they would be surmountable or not. The IAIS also expects to provide further input to the IASB throughout its Phase II project, through written comments as well as through its representation on the IWG. Future convergence of IASB and other standards
In September 2002, the IASB agreed to add a short term convergence project to its active agenda. The objective is to reduce differences between IFRS and US GAAP. The project is a joint project with FASB. Simple steps towards convergence are taken whenever a standard is revised by the IASB or the FASB.31 Specific processes with a longer-term timetable are to be defined to deal with more complicated or sensitive issues. In particular, in April 2005, at a joint meeting, members of both Boards expressed the view that adopting a single measurement attribute would improve financial reporting and significantly simplify accounting standards. While the favoured approach seems to be towards full 'fair value', it is questionable whether such an approach would provide an achievable solution in the near future. In January 2005, the IASB and the Accounting Standards Board of Japan agreed to launch a joint project to reduce differences between IFRSs and Japanese standards towards a final goal of their convergence.
5.5 Credit risk transfer
The Joint Forum
The Joint Forum published its report on Credit risk transfer 32 in March 2005, the work on which had been initiated by the Financial Stability Forum. The report focuses on the most recent CRT techniques (credit default swaps and collateralised debt obligations). The main conclusions of the report are that: (i) CRT instruments have achieved a relatively clean risk transfer; (ii) market participants seem to be largely aware of risks associated with CRT instruments; (iii) there is no evidence of CRT leading to hidden concentrations of risk on some categories of institutions, outside market-making activities; and (iv) CRT instruments are widely considered by participants as having a positive impact on financial stability. However, in order to enhance the soundness of
30 The paper is publicly available on the IAIS website at: www.iaisweb.org.
31 The US Financial Accounting Standards Board.
32 The Joint Forum: Credit Risk Transfer, March 2005. Available on the IAIS website at: www.iaisweb.org.
Page 24 of 100 IAIS Global Reinsurance Market Report 2004 December 2005
CRT markets, the Joint Forum makes 17 recommendations in relation to risk management practices, disclosure, and supervisory approaches to CRT activities. The report identifies monoline financial guarantors as significant participants in credit risk transfer. Otherwise the report suggests that, at the time of writing, insurers’ and reinsurers' involvement in CRT was modest. The Committee on the Global Financial System (CGFS)
Following publication of its report on Credit Risk Transfer by the CGFS,33 a statistical collection template has been developed for credit default swaps. A first instalment of the new data, as part of the BIS’s publication OTC Derivatives market activity in the second half of 200434 was published in May 2005. Notional amounts of credit default swaps outstanding were $6.4 trillion at the end of 2004. Such data on credit default swaps will be made available on an ongoing basis as part of the semi-annual central bank derivatives statistics disseminated by the BIS.
6. Resilience of the reinsurance sector
Last year’s report noted that the group planned to consider areas not currently addressed by the global statistics. One of these was an assessment of the resilience of the reinsurance sector looking at how large an event or events - and of what type and magnitude - could be absorbed without having a destabilising effect on the sector.35 The group has subsequently discussed how such issues might best be addressed within the context of this report. It was decided that it would not be appropriate to undertake deterministic stress tests on the global data due to the very different macro economic environments of participating jurisdictions. Furthermore, there is a significant range of risk profiles of reporting reinsurers (ranging from single line property catastrophe reinsurers to multi-product businesses containing both life and non-life writing direct as well as reinsurance) which would make the construction of a simple stress test extremely complicated. Given these difficulties, the group decided to consider resilience in two ways: • by examining the risk management practices of reporting reinsurers (examples of
which are highlighted in Appendix VIII) and specifically the tools used to monitor and manage the potential impact of catastrophes; and
• to gather high level summaries of the requirements and practices of participating jurisdictions on stress testing (the results of which are set out in Appendix VII).
6.1 Risk management practices of reporting reinsurers By their very nature, reinsurers are exposed to similar risks to primary insurers, chiefly insurance (covering both underwriting and reserving), investment, credit and operational risks.36 One risk which is perhaps more acute in reinsurers is the risk
33 Committee on the Global Financial System: Credit risk transfer, January 2003
34 Bank for International Settlements: OTC derivatives market activity in the second half of 2004, May 2005
35 On the issue of insurance and reinsurance markets ability to absorb catastrophic risks, see OECD (2005) Catastrophic Risks and Insurance, and OECD (2005) Terrorism Risk Insurance in OECD Countries.
36 For further detail see the IAIS Glossary of terms up-dated in February 2005.
IAIS Global Reinsurance Market Report 2004 Page 25 of 100 December 2005
arising from the concentration of risk exposures. The nature of reinsurance business means that carriers are more removed from the individual risks being written and receive less information about them. Concentrations of exposure can thus arise without underwriters necessarily being fully aware of it. For this reason most reinsurers estimate their exposures in a different way from primary insurers, and take steps to limit their total exposure. Whilst standards of data quality vary between firms, reinsurance carriers have to place reliance on data they receive from cedants and this poses inherent difficulties, both relating to the monitoring of aggregation and to establishing appropriate reserves if and when an event occurs. The effect of this phenomenon is even more marked in the retrocession market, where carriers are further removed from the underlying risks. Reporting reinsurers seek to manage these risks at both individual legal entity and group level. In the case of the former, risk management is typically geared towards meeting solvency and other requirements which may be set by the local regulator, as well as the capital required by rating agencies. However, given the nature of a reinsurance group’s business model, which typically has risk being pooled across the group to be held against a central pool of capital, risk management is also performed at group level and on a holistic basis (i.e. consideration is given to the inter-dependency of various single entity exposures as well as the aggregate effects of such single entity exposures on the overall risk profile of the group). Furthermore, reinsurers are increasingly conducting due diligence and audits of cedants' data and underwriting processes.
6.2 Tools used to monitor and manage the potential impact of catastrophes Stress testing
Given that dealing with risk and uncertainty is the core of a reinsurer’s business, companies need to understand the potentially wide range of possible outcomes in order to evaluate whether their net retention levels remain within their overall pre-defined risk appetite. To that end, stress tests, as well as scenario analysis, are frequently-used tools in reporting reinsurers’ risk management practices. Their use is also encouraged by the IAIS more generally. For instance in its Guidance paper on stress testing by insurers37 the IAIS has noted that stress tests should be considered as a fundamental element in an insurer’s overall risk management framework and not simply a tool for capital allocation purposes, a performance monitoring measure or a regulatory burden. Simulations of pre-defined catastrophe scenarios are used by reporting reinsurers to ensure that events whose occurrence appears less probable are also considered in a firm’s planning and decision-making. These simulations are of great importance within their risk management framework, regardless of the materialisation of the simulated natural catastrophes. Catastrophe modelling
Insurers and reinsurers make extensive use of natural disaster and other catastrophe models. Major reinsurers have created their own proprietary catastrophe models but also use modelling tools sold by various specialist firms. The creation and development of such models over the past fifteen years has helped reinsurers to develop a better understanding of their aggregate risk positions than existed at the time
37 IAIS Guidance paper on stress testing by insurers, October 2003

Page 26 of 100 IAIS Global Reinsurance Market Report 2004 December 2005
of Hurricane Andrew in 1992. Many reporting reinsurers use multiple models to help analyse risk in their reinsured portfolio, and by studying the varying output from these models they continue to learn about the parameter risk associated with the utilisation of models. Models have proved valuable to reporting reinsurers since they provide an independent way to assess base line underwriting risk. This is important since, as highlighted above, reinsurers are relying on a secondary source of data being one step removed from actual assessment of policyholder risk and as such have to rely on underwriting data that is assembled by cedants. Since reinsurers also face inherent difficulties in assessing the effects of aggregation of risks from multiple clients writing multiple books of business which can all be exposed to the same event or peril, they use a variety of analytical techniques to assess the effects of aggregation in their portfolios. Models, however, are not crystal balls. Since modelled outcomes can vary from actual experience insurers and reinsurers need to be fully aware of how the models work and plan for these variations. The quality of model output is limited by many factors, including the accuracy of specific data input by both the primary insurer and the reinsurer. Modelling firms also regularly revise and up-date their models to reflect new loss experience and new assessments of future loss probabilities. Modelling firms and users have discussed the need to revise their models in view of the experience of the 2004 and 2005 US hurricanes which have highlighted some of the inherent limitations.
7. Cross-sectoral transfer of risk
The Global Reinsurance Market Report 2003 was produced partly in response to the Financial Stability Forum (FSF) meeting in September 2002 where concerns were expressed about a perceived lack of information available to financial authorities about the activities and risk positions of reinsurance companies. Two areas specifically cited for improvement in information were the cross-sectoral transfer of risk to the reinsurance sector and the linkages between reinsurance and other financial sectors. Credit risk transfer (CRT) was a particular concern. The 2004 RTG report, based upon 2003 data, concluded that:- Insurance supervisors participating in the Joint Forum Working Group reviewed supervisory reports to measure the extent of insurers’ investments in CRT. They concluded that in general CRT activities, if treated as investments, made up only around 1% of total investments, leading to a conclusion that, at present levels, insurers’ aggregate financial strength is not threatened by their involvement in CRT. With regard to the reinsurance sector, the global reinsurance market statistics indicate that reinsurers’ use of derivatives is for hedging purposes, with no material transactions for non-hedging purposes by entities whose main business is reinsurance. In relation to the reporting entities, all material accumulations in CDOs are mainly within the specialised US monoline sector.38 The 2004 report (Section 8.3 below) also observes that, on the basis of these statistics, the participation in credit risk transfer by reinsurers is a small percentage of the activity in credit risk transfer by the insurance sector as a whole, not capturing the values of risk accepted by primary insurers directly from insureds.
38 See IAIS Global reinsurance market report 2004, section 5.4.
IAIS Global Reinsurance Market Report 2004 Page 27 of 100 December 2005
The 2004 data included in the current report shows no material change to the cross sectoral exposures compared with 2003 (see Sections 8.3 and 8.4). During the year the group considered the hypothesis that, if exposures between different financial sectors are such that they might cause concern, then there should be attempts to measure these inter-sectoral exposures in all directions. In order to gain a better understanding of what information is available at the global level regarding cross-sectoral exposures the IAIS wrote to the Financial Stability Forum regarding the availability of analysis from other sectors and/or the wider measurement of exposures between different financial sectors. In response, it would appear that analysis is not currently available from any other sector at the global level with regard to credit risk transfer that would contradict or corroborate the findings of the RTG report. In its reply, the Forum also observed that the area continues to be characterised by fast growth in transaction volumes, an increasing number of market players and significant product innovation. Given the ongoing rapid developments in the CRT area and in the ways firms manage and record this activity, the Forum has suggested that it may be useful for representatives of the relevant sectoral committees to engage in further discussion of these issues. The Reinsurance Transparency Group looks forward to providing input into these discussions.
8. Analysis of global reinsurance market statistics The concept of 'global reinsurance market statistics' was premised on the view that analysis and publication of global reinsurance market data would increase transparency and promote a better understanding of aggregate reinsurance risks and the relationship of the reinsurance market with other sectors. The reinsurers selected have come from seven jurisdictions (Bermuda, France, Germany, Japan, Switzerland, the United Kingdom and the United States) in which the major reinsurance market participants are incorporated, and have participated in the statistics on a voluntary basis to the extent that data required to produce the statistics is not publicly available. Further details on the methodology for producing the 2004 global statistics and the list of reinsurers whose data has been aggregated to produce these statistics is given in Appendix III. As has been noted earlier various challenges were faced in collecting and aggregating data from different jurisdictions which are subject to different accounting and regulatory reporting requirements. The main challenges are set out in Section 3 above, with further details in Appendices VI (Summary of major differences to US GAAP) and X (Main assumptions and qualifications). The 2004 statistics are organised in a similar way to those for the previous year and cover the following key aspects of the global reinsurance market:
1. Size of the global reinsurance market (section 8.1)
2. Structure and profile of reinsurance risk assumed (section 8.2)
3. Derivative financial instruments and credit risk transfer activity (section 8.3)
4. Counterparty risk and linkages to other sectors (sections 8.4)
5. Investments, profitability and capital adequacy (sections 8.5 – 8.7)

Page 28 of 100 IAIS Global Reinsurance Market Report 2004 December 2005
The statistics in (1) and (2) relate to just the reinsurance business of the reporting entities.39 Data in (3), (4) and (5) is in respect of the entire business of the reporting entities (i.e. including direct business). Unless otherwise stated, the data covered by the statistics includes both affiliated and unaffiliated business.
8.1 Size of the global reinsurance market
Economic background
The world economy grew rapidly (by 4%) in 2004 due to significant GDP expansion in the US, China, India and Central Europe. Despite rising oil prices, inflation remained low in industrialized countries; it was higher in China. Long-term interest rates remained at historically low levels: around 4% in the US, UK, Germany and France; below 2% in Japan. In 2004 capital markets remained well below their record 2001 levels although they improved further in 2004 in the US by 3% and in Japan, Germany, France and UK by about 7% to 8%.40 The insurance industry further consolidated in 2004. World premiums, both non-life and life, maintained a growth rate slightly above 2%. However regional differences in GDP growth, as well as in insurance and tax regulation, led to changes in regional market shares: Europe's share of the global market increased by almost 2%, while North America and Asia lost 1.8% and 0.5% respectively due to low demand for life assurance in the US and Japan. Insurers maintained a low equity exposure in 2004. Notwithstanding steadily rising stock markets, they did not buy shares on a large scale to leverage their investment performance in a rising market. They kept their equity exposure not only below the level of the 1999 stock market boom but also below that of the 2002 stock market crisis. A desire to strengthen their capital base led to most insurers retaining earnings. A few did however turn to capital markets to raise fresh capital in, or shortly before, 2004. Insurers’ conservative investment strategies and sustained capitalisation efforts eventually succeeded in changing the outlook of investment banks and rating agencies on the industry from negative to neutral in 2004. At the end of year the global reinsurance 2004 market appeared stable despite signs of softening in rates. Developments in major reinsurance markets
In the US, while net insurance premiums declined by 3.3% in 2004, pre-tax operating income fell by 21% and ROR41 by 24%. A 5% increase in the combined ratio (to 97.9%) was accompanied by an 11.8% rise in total adjusted shareholders’ funds. The industry has also been adversely affected by expanding prosecutor and supervisor probes into its practices.
39 In some instances an element of direct business is included. Where this is the case, a note has been made in Appendix I.
40 See Sigma No 2/2005: World insurance in 2004.
41 Return on revenue.
IAIS Global Reinsurance Market Report 2004 Page 29 of 100 December 2005
The European market – excluding London – weathered record storm losses with strong underlying earnings from non-catastrophe business proving quite resilient. While premium income fell on account of a weak US dollar and strict underwriting, balance sheets remained intact. The London market showed strong earnings at the peak of the insurance cycle. Although some premium rates were softening, others stayed firm. Enhanced governance at Lloyd’s may have added further to the market’s robustness. In the Asia-Pacific markets, increases in capacity had led to declining profits, although the financial health of reinsurers has remained stable even as conditions softened. Conservative underwriting, reasonable earnings and sufficient capitalisation underpinned the performance of the market. Finally, in Latin America, strong growth was accompanied by greater competition among major reinsurers. Despite decreasing prices in many important lines, premiums continued to grow by around 10%, reflecting in part limited reinsurance capacity in the region. Size of the global market
In analysing the size of the global reinsurance market it should be noted that there are a number of sources of global reinsurance market data. Some of these sources are based on group level (or unaffiliated) data and some on entity level (or affiliated plus unaffiliated) data. There are, furthermore, several ways to measure the size of the reinsurance market, for example:
- Gross or net reinsurance premiums assumed in respect of non-affiliated and/or affiliated cedants
- Premiums ceded, by non-affiliated cedants and/or affiliated cedants
- Reinsurance recoverables
- Reinsurers’ share of claims incurred
- Gross claims incurred and/or their share of reinsurance business assumed
- Reinsurance claims paid
- Gross claims provisions in respect of reinsurance business assumed. Depending on the source and the perspective chosen, publicly available data tends to yield differing sizes of the global reinsurance market. For instance:
(a) Swiss Re42 provides the following estimates based on market statistics of supervisory authorities, national insurance associations and A M Best covering approximately 50 jurisdictions. The reinsurance data reflects premiums ceded by primary insurers to unaffiliated reinsurance companies. Cessions between affiliated companies are excluded, either based on reported figures or estimates.
42 Source: Swiss Re Economic Research & Consulting, based on internal papers (November 2005)

Page 30 of 100 IAIS Global Reinsurance Market Report 2004 December 2005
Gross premiums and premiums ceded by primary insurers (US$'bn) 1990 1995 2000 2001 2002 2003 2004 Share Top 10 2004 share Non-life
Gross premiums 537.4 745.0 758.2 814.0 927.1 1,080.3 1,187.2
Ceded premiums 59.8 89.9 94.5 108.1 124.6 141.1 134.4 80% 52% Life
Gross premiums 673.9 1,056.4 1,370.6 1,300.8 1,388.0 1,529.1 1,702.5
Ceded premiums 7.3 11.1 20.0 22.4 25.0 29.4 33.4 20% 87% The premium data as estimated by Swiss Re is derived from the demand side of the market, i.e. premiums ceded from the primary insurance industry to the reinsurance market. The above data relating to premiums ceded can also be presented as follows:
Premiums ceded by primary insurers (US$'bn)
0
20
40
60
80
100
120
140
160
180
1990 1995 2000 2001 2002 2003 2004
US$
'bn Non-life
premiumsLife premiums
Total
To compare this data (a total of US$167.8 bn for non-life and life premiums ceded) with the global reinsurance market statistics, one could look at the Table 1.1 figure for 'Net reinsurance premiums assumed' (US$132.5 bn). Although the bases for the two sets of figures are not directly equivalent, they nevertheless indicate that the IAIS global reinsurance statistics capture a significant proportion of the market.

IAIS Global Reinsurance Market Report 2004 Page 31 of 100 December 2005
(b) FitchRatings43 offers the following time series data for a sample of 34 reinsurance organisations: Net premiums written by top 34 reinsurers (US$'bn) 2000 2001 2002 2003 2004 Net premiums written 58.1 63.5 82.6 93.2 91.8 The figures provided by Fitch clearly understate the size of the global reinsurance market as they only comprise non-life business and do not include all major market players. For example, Lloyd’s is not included in the data. (c) A M Best44 lists the consolidated premiums for 2004, gross and net, for each of the top 35 reinsurers worldwide. Together with comparative figures for 2003, these are as follows (US$'bn): 2003 2004 Gross reinsurance premiums written 172.5 171.7
Net reinsurance premiums written 146.0 145.8 The A M Best figures are a further indicator of the size of the global reinsurance market. In order to avoid the double counting of retroceded business, the figure for net reinsurance premium (US$145.8 bn) is the appropriate one for the purpose of comparison with 'net reinsurance premiums assumed' in Table 1.1 (US$132.5 bn). On the basis of this comparison the net reinsurance premium figures in the IAIS statistics represent over 90% the A M Best population. The above examples illustrate that current assessments of the size of the global reinsurance market can vary significantly, depending on a number of parameters chosen. Nonetheless, the reinsurance premiums assumed, as reported in Table 1.1, could be viewed as a credible estimate of the size of the market by most standards.
8.2 Structure and profile of reinsurance risk assumed
There is no simple measure of risk in the insurance and reinsurance business. Reinsurance risk profiles have to be described by proxy variables and their values at a given time, such as premium volumes or loss histories per class and line of business, or per treaty type. The most commonly used risk indicators in reinsurance are premium figures, typically further broken down by gross/net premiums, by lines of business, by geographical region and by type of treaty (proportional vs. non-proportional). Premium figures are often used as a proxy for the risk transferred to a reinsurer and its price. However, while premiums reflect the price of a contract, they do not necessarily reflect its underlying risks.45 Claims statistics may also serve to assess the risk profile
43 FitchRatings Mid-Year 2005 Global Reinsurance Review and Outlook
44 A.M. Best Special Report: Global Reinsurance September 2005
45 Taking premium as a proxy for risk transfer ignores the effect of diversification.

Page 32 of 100 IAIS Global Reinsurance Market Report 2004 December 2005
of reinsurers. While claims statistics and claims frequencies can be useful, for instance to model risks, they may not be an accurate predictor of future losses. Risk profiles can change very quickly, loss patterns may shift and new risks may emerge, for example in casualty lines. In reinsurance of low frequency/high severity events (e.g. natural catastrophe) claim statistics alone are of little value and need to be supplemented by expert analysis (e.g. geosciences and actuarial techniques). Information provided by claims provision data can be useful but is somewhat limited as low claims provisions of a reinsurer could either point to a low level of incurred claims, claims which have a short tail, or an understatement of ultimate losses (that is later adjusted). Furthermore, statistics on aggregated liabilities in the form of sums assured could be used as an indicator for certain risk types. However, sums insured are not, by themselves, an indicator of a reinsurer’s exposure, as they do not take into account the probability that incurred losses will reach the layer covered by the reinsurance contract. In some cases reinsurance policy limits could be used as a measure of maximum loss. The data in Table 1.1, which records gross reinsurance premiums assumed for the reporting entities, produces the following profile of gross reinsurance premiums assumed by class of business.
Gross reinsurance premiums assumed by class of business
2003
Life Insurance
(all)21%
P ro perty36%
Liability38%
Financial lines5%
2004
Life Insurance
(all)29%
P ro perty34%
Liability34%
Financial lines3%
Structure and profile of risk assumed by reporting entities; proxy: gross premiums written
Caution is advised in any attempts at assessing net risk transfer among the regions and the total risk assumed by the reporting entities. Since the reporting entities deal with each other, sometimes in the same jurisdictions and often with their affiliates, when gross premiums written are used as a proxy of the risk assumed there may be multiple counting of the risk the reinsurance sector actually draws in from primary insurers. The actual initial risk that gets reinsured may thus be different from what the global statistics (C-level data) suggest. These problems would be alleviated if the

IAIS Global Reinsurance Market Report 2004 Page 33 of 100 December 2005
global statistics were group-based but this would present other problems as noted in Section 3 above. Geographical structure
The diagram below shows regional shares of insurance risk - as measured by the proxy of gross premiums - ceded by direct insurers (and reinsurers) to the reporting reinsurers.
Gross premium ceded by region of ceding insurer
North America57%
Asia and Australia
6%
Africa, Near and Middle
East1%
Latin America1%
Europe35%
Origin of insurance risk as per premiums ceded
Insurance risk/premiums assumed by the reporting reinsurers were ceded by direct insurers and reinsurers (likely to include some reporting entities) located mostly in North America (57%), but also in Europe (35%), to a much smaller extent in Asia (6%) and marginally in Latin America and Africa and Near and Middle East. Destination of risk as per premiums assumed Insurance risk (premiums) ceded by insurers and reinsurers worldwide were assumed 50 % by the reporting reinsurers located in North America and 49% by those in Europe. Net premium position, net risk position
The following additional analysis has been derived from the B-level statistics of Table 1.2:46
46 The figures in column 1 ('Gross assumed') have been calculated from the B-level statistics within Table 1.2 and column 3 ('Net assumed/(ceded)') has been derived by comparing columns 1 and 2.
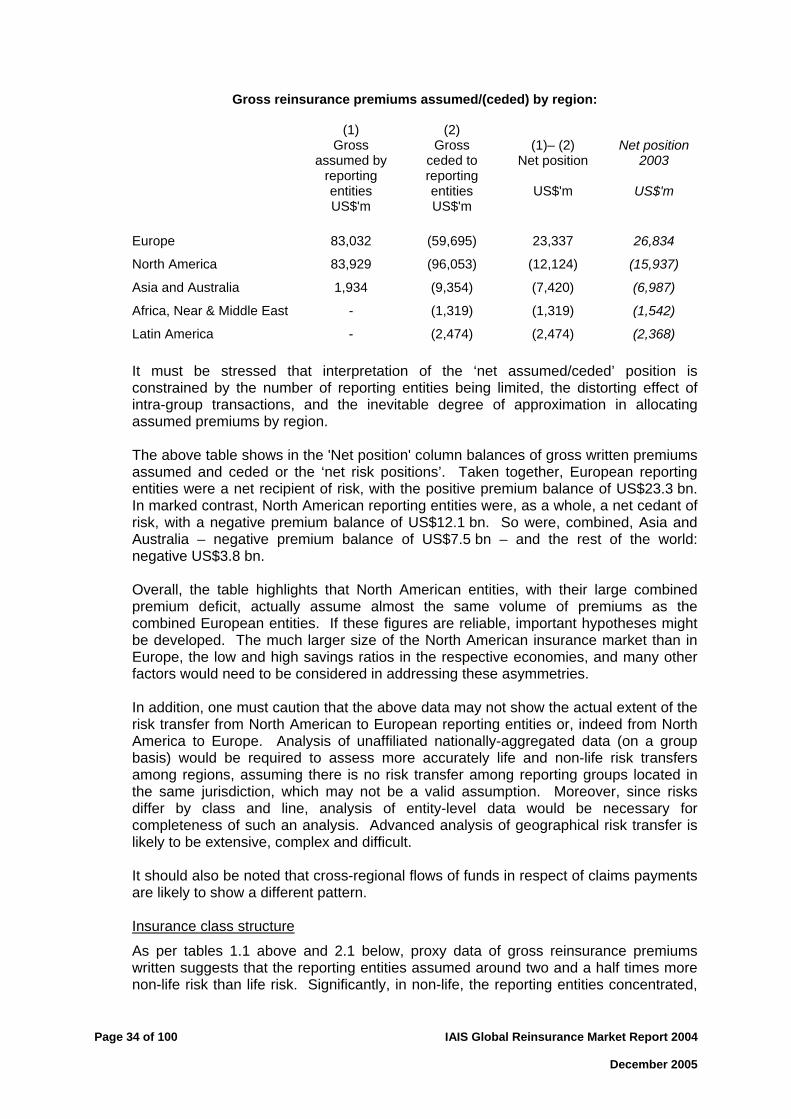
Page 34 of 100 IAIS Global Reinsurance Market Report 2004 December 2005
Gross reinsurance premiums assumed/(ceded) by region:
(1) Gross
assumed by reporting entities US$'m
(2) Gross
ceded to reporting entities US$'m
(1)– (2) Net position
US$'m
Net position
2003
US$'m
Europe 83,032 (59,695) 23,337 26,834
North America 83,929 (96,053) (12,124) (15,937)
Asia and Australia 1,934 (9,354) (7,420) (6,987)
Africa, Near & Middle East - (1,319) (1,319) (1,542)
Latin America - (2,474) (2,474) (2,368) It must be stressed that interpretation of the ‘net assumed/ceded’ position is constrained by the number of reporting entities being limited, the distorting effect of intra-group transactions, and the inevitable degree of approximation in allocating assumed premiums by region. The above table shows in the 'Net position' column balances of gross written premiums assumed and ceded or the ‘net risk positions’. Taken together, European reporting entities were a net recipient of risk, with the positive premium balance of US$23.3 bn. In marked contrast, North American reporting entities were, as a whole, a net cedant of risk, with a negative premium balance of US$12.1 bn. So were, combined, Asia and Australia – negative premium balance of US$7.5 bn – and the rest of the world: negative US$3.8 bn. Overall, the table highlights that North American entities, with their large combined premium deficit, actually assume almost the same volume of premiums as the combined European entities. If these figures are reliable, important hypotheses might be developed. The much larger size of the North American insurance market than in Europe, the low and high savings ratios in the respective economies, and many other factors would need to be considered in addressing these asymmetries. In addition, one must caution that the above data may not show the actual extent of the risk transfer from North American to European reporting entities or, indeed from North America to Europe. Analysis of unaffiliated nationally-aggregated data (on a group basis) would be required to assess more accurately life and non-life risk transfers among regions, assuming there is no risk transfer among reporting groups located in the same jurisdiction, which may not be a valid assumption. Moreover, since risks differ by class and line, analysis of entity-level data would be necessary for completeness of such an analysis. Advanced analysis of geographical risk transfer is likely to be extensive, complex and difficult. It should also be noted that cross-regional flows of funds in respect of claims payments are likely to show a different pattern. Insurance class structure
As per tables 1.1 above and 2.1 below, proxy data of gross reinsurance premiums written suggests that the reporting entities assumed around two and a half times more non-life risk than life risk. Significantly, in non-life, the reporting entities concentrated,

IAIS Global Reinsurance Market Report 2004 Page 35 of 100 December 2005
almost equally, on property and liability risks. There was clearly much less risk assumed in financial lines of business. The statistics in table 2.1 can be presented as follows:
Reinsurance premiums assumed by class of business and type of contract US$m
0
10
20
30
40
50
60
70
Life Insurance(all)
Property Liability Financial lines
US$
'bn Proportional
Non-proportional
Contract type
As per table 2.1, the reporting entities assumed life risks almost exclusively under proportional contracts.47 For non-life, they assumed under proportional contracts more than twice as much risk as under non-proportional contracts for the property and liability classes of business and more than six times as much for the financial lines. For life and non-life combined, a comparison of proportional and non proportional reinsurance coverage would not be meaningful. Structure and profile of risk assumed; proxy: net earned premiums and net claims incurred. The statistics included in Table 2.2 give the following profile of risk assumed, on the basis of net earned premiums and net claims incurred:
47 However, see comment below table 2.1 in Appendix I.

Page 36 of 100 IAIS Global Reinsurance Market Report 2004 December 2005
Net earned Net claims premiums incurred % of total % of total Class of business 2004 2003 2004 2003 Life insurance (all) 30 24 31 25 Non-life: - Property 31 34 27 26 - Liability 35 37 39 46 - Financial lines 4 5 3 3 ___ ___ ___ ___ 70 76 69 75 For both years the analysis is fairly consistent with the ratio shown for gross reinsurance premiums assumed in Table 1.1 (see 8.1 above). The 2004 figures show a higher proportion of life business, compared with 2003 (in which the reporting entities provided figures for non-life reinsurance business which were around three times those for life business). Changes in the reporting entities from 2003 to 2004 may be a factor. Structure and profile of risk assumed; proxy: net claims provision
Table 2.3 gives a profile of claims exposures in respect of retained reinsurance risk. Based upon the reporting entities, it shows 46% (2003: 40%) of claims provisions related to ‘life’ business and 54% (2003: 60%) to ‘non-life’ business. The data for non-life insurance in the table can be presented as follows:
Claims provision for reinsurance assumed by class of business
0
20
40
60
80
100
120
140
160
180
200
Non-lifeinsurance (all)
Property Liability Financial lines
US$
'bn
Reported claims
Claims incurred butnot reported (IBNR)
Total
For non-life business 63% of claims provisions related to liability business, 31% to property business and 6% to financial lines (2003 figures: 63%, 34% and 3%). As noted above, reporting entities assumed fairly comparable gross and net reinsurance premiums in respect of property and liability lines. The much higher claims provision

IAIS Global Reinsurance Market Report 2004 Page 37 of 100 December 2005
for liability lines reflects both the higher loss ratio for liability business (see Section 8.6 below) and the longer-tail nature of liability business compared with property lines. The proportion of claims incurred but not reported (IBNR) to the total non-life claims provision was 38% (2003: 34%) and, as for 2003, showed very little variation in this ratio for the three lines of business.
8.3 Derivative financial instruments and credit risk transfer activity Reinsurers use a variety of derivative financial instruments including swaps, options, forwards and exchange-traded financial futures. Before looking at the data, however, it should be noted that the methodology for compiling the global reinsurance market statistics was determined with the intention of covering a large proportion of the global reinsurance market whose main business areas are reinsurance. Thus the criteria for selecting reporting entities for the statistics are based upon premium volume and claims reserves. The framework for compiling these statistics is not designed with the aim of a specialised report on derivatives and credit risk transfer, but rather reports the activities in this area by the reporting reinsurers on the basis of the statistics gathered. Other reports, noted below, have focussed more specifically on derivatives and credit risk transfer. The global statistics show data on the types of derivative transaction entered into by reporting entities. They represent amounts outstanding at the year end 2004 in respect of the direct insurance business, as well as the reinsurance business, of the entities covered by this report. The information has also been collected according to whether the transactions are entered into for hedging or non-hedging purposes, and include both notional amounts and fair values. The results are as follows: Extract from Table 3.1: Reporting entities’ use of derivative financial instruments Held for hedging
purposes Held for non-hedging
purposes Total
Type of contract Notional amount US$m
Fair value (+/-)
US$m
Notional amount US$m
Fair value (+/-)
US$m
Notional amount US$m
Fair value (+/-)
US$m Interest rate contracts 118,896 999 8,998 128 127,894 1,127 Equity and index contracts 13,331 828 946 22 14,277 850
Foreign currency contracts 2,186 82 2,385 (69) 4,571 13
Credit derivatives 84 3 44,947 (48) 45,031 (45) Other 40 1 1,901 (25) 1,941 (24)
The level of involvement in derivatives is indicated by the notional amounts48 of derivative transactions. As in 2003, the results show far greater involvement in hedging activity49 (i.e. risk mitigation) than in non-hedging activities, and that this relates overwhelmingly to interest rate contracts (88% in terms of notional amount).
48 The notional amount of a derivative represents a standard of measurement of the level of involvement in such transactions and is not a quantification of market risk or credit risk. It represents the amount used to calculate contractual cash flows to be exchanged. It does not generally represent an amount to be paid or received, except for certain contracts such as currency swaps.
49 Transactions which are primarily carried out for risk mitigation purposes represent ‘hedging’ activities. The objectives of using derivatives for hedging purposes include managing exposure to price, foreign currency and/or interest rate risk on

Page 38 of 100 IAIS Global Reinsurance Market Report 2004 December 2005
Of the amounts outstanding which relate to non-hedging activities, most relates to credit derivatives, and this is discussed below. Credit Risk Transfer
In addition to looking at overall activity in derivatives, the global reinsurance market statistics look further at two types of instrument used for credit risk transfer, and according to whether protection is bought or sold. Credit Default Swaps (CDS) – A credit default swap is an instrument under which one party (‘the protection seller’) agrees to compensate another party (‘the protection buyer’) for the financial loss it may incur following the occurrence of a credit event in relation to a specified obligation in return for a premium. These are predominantly unfunded instruments and similar to guarantees. Collateralised Debt Obligations (CDO) – These are credit portfolio products in which a portfolio of credit risk exposures is assembled, segmented into tranches of different risk exposure, and transferred to investors. Traditional products are asset backed and use securitisation to transform the credit risk into an investment product. More sophisticated, synthetic products have recently been emerging which have characteristics closer to those of derivatives. A report by the Joint Forum (see 5.5 above) comments that only the largest dealers and more sophisticated investors appear to be active in these new products. Hedge Funds constitute a new and rapidly growing CRT investor base active both in funded and synthetic structures with a general preference for equity and non-investment grade risks. Participation in credit risk transfer by the insurance sector
The global credit derivatives market is expanding rapidly. FitchRatings estimate that the market, including cash CDOs, expanded to US$5.4 trillion notional value of outstanding contracts at the end of 2004 (an increase from US$3 trillion at the previous year end).50 As noted in section 5.5, a BIS semi-annual publication on OTC derivatives market activity51 estimated the notional amounts (bought plus sold) of credit default swaps outstanding as at the end of December 2004 to be US$6.4 trillion. Commentators, including the IMF,52 have remarked upon the growing participation in credit risk transfer by the insurance sector. Fitch comments that the global insurance/reinsurance sector (excluding financial guarantors) grew as a seller of protection, with an estimate net sold position of US$319 bn at the end of 2004. This figure is however distorted by the dominant position in the market of AIG Financial Products.53 After adjusting for AIG, the net sold position is US$51 bn (compared with US$18 bn at the end of 2003). The gross sold position is estimated at US$397 bn, including US$17 bn of cash CDOs (compared with US$258 bn in 2003).
planned or anticipated investment purchases, existing assets or liabilities. A reinsurer might engage in derivative transactions for other reasons (‘non-hedging’ activities). These might form part of an asset management strategy, with an objective of diversification, for example, or for income generation, such as locking in attractive investment conditions for future available funds.
50 FitchRatings, Global credit derivatives survey: risk dispersion accelerates, November 2005
51 Bank for International Settlements: OTC derivatives market activity in the second half of 2004, May 2005
52 International Monetary Fund, Global Financial Market Developments, April 2005 (See Insurance Industry Update, page 40).
53 A non-insurance subsidiary of AIG.
IAIS Global Reinsurance Market Report 2004 Page 39 of 100 December 2005
In last year's report we noted that the monoline financial guarantee sector had been receiving significant attention as a seller of credit protection and referred to FitchRatings' 2003 special report on credit policy,54 which cites this sector as the largest seller of credit protection, on a net basis. Fitch notes that the monoline sector continued to be one of the largest sellers of protection within the credit derivatives market in 2004, but with a significantly slower growth rate on 2003 (8%), and a declining appetite for CDOs. No monoline financial guarantors have been captured by the selection criteria for the global reinsurance market statistics for 2004. It should also be noted that monolines fall largely outside of this report since most of their activity relates to insurance rather than to reinsurance. Analysis of the 2004 statistics
In analysing the statistics, it should be recalled that the figures relating to credit risk transfer in these global reinsurance statistics represent the total operations (i.e. direct as well as reinsurance operations) of the entities covered by the statistics. On this basis, the data provided by the reporting entities continue to show modest participation by reinsurers in credit derivatives. Involvement in credit derivatives continues to be primarily for portfolio return and optimisation and secondly for hedging. Credit default swaps
The global reinsurance market statistics indicate participation in credit risk transfer through credit default swaps in respect of both protection bought (US$4 bn notional) and protection sold (US$19 bn notional), with amounts outstanding at a level similar to that of the 2003 statistics (respectively US$4 bn and US$20 bn).55 However, as in 2003, these figures represent a limited number of direct insurers which carry out a small amount of reinsurance business relative to the rest of their direct business. No specialised reinsurer, or entity whose main business is reinsurance, covered by this report reported material involvement in credit derivatives transactions in 2004. In addition to credit default swaps, the figures representing credit derivatives in Table 3.1 include derivatives embedded in life reinsurance treaties for which bifurcation is required for financial reporting purposes.56 Such derivatives arise because investment returns received by reinsurers on cedants' deposits are based on the cedants' return from either: (i) their general assets, or (ii) specified blocks of those assets. Collateralised debt obligations
Outstanding amounts relating to CDOs were minimal based upon the reported data of the reinsurers included in the statistics. Conclusion
With regard to the reinsurance sector, as for 2003, the global reinsurance market statistics indicate that reinsurers’ use of derivatives is primarily for hedging purposes, with no material outstanding amounts relating to non-hedging activities by entities
54 FitchRatings, Global Credit Derivatives: A Qualified Success, September 2003
55 See Appendix I, Table 3.2.
56 For the purposes of these statistics, CDOs are not included within 'credit derivatives' in Table 3.1.

Page 40 of 100 IAIS Global Reinsurance Market Report 2004 December 2005
whose main business is reinsurance. Outstanding balances relating to CDOs by reporting reinsurers were minimal. On the basis of these statistics, the participation in credit risk transfer by the reinsurers covered by this report is a small percentage of the activity in credit risk transfer by the insurance sector as a whole.
8.4 Counterparty risk and linkages to other sectors
This section reports on counterparty party exposure data provided by the reporting entities. The full results are in Appendix I Tables 4.1 to 4.4. The RTG collected the data in these tables in order to consider the risk that any sector could be materially disadvantaged by adverse experience in the reinsurance sector or whether the reinsurance sector could be materially disadvantaged by adverse experience in a particular sector. The report gives a profile of counterparty exposures both to and from the reinsurance sector and discusses whether there is evidence of concentrations of cross-sectoral exposures involving the reinsurance sector. On the basis of the global statistics the RTG found no evidence of undue concentration of assets in, or liabilities to, any one sector of counterparty (other than the insurance sector) by the reinsurance market as a whole. Reinsurers’ exposure to other sectors (selected assets)
Table 4.1 (Appendix I) records exposures of reinsurers to counterparties, the former by sector of counterparty (insurers, financial institutions, split where possible between banks and investment institutions, sovereigns and other sectors). On the basis of the entities covered, reinsurers’ assets were found to be invested as follows in accordance with the classifications used: % of total
2004 200357
Debt securities 42 38
(Re)insurance recoverables and receivables 27 33
Equity investments 17 16
Cash 11 10
Others 3 3
Debt securities are a major asset category within this table, accounting for well over 40% of total selected assets. Of debt securities held 31% (2003: 35%) had been issued by Sovereigns and 63% (2003: 54%) by issuers from sectors outside of the financial services industry. Less than 5% (2003: 7%) was identified as having been issued by financial institutions.58
57 Comparatives have been updated for consistency with the 2004 analysis, and in respect of an understatement in the 2003 statistics of 'Receivables arising from insurance and assumed reinsurance business' (Tables 4.1 & 4.2) which was identified during the collection of the 2004 data.
58 Reporting entities were unable to provide the analysis for all selected assets by sector. Please refer to the relevant notes in Appendix I.

IAIS Global Reinsurance Market Report 2004 Page 41 of 100 December 2005
With regard to (re)insurance recoverables and receivables, it is to be expected that a significant amount of reinsurers' assets are exposed to the insurance sector. This exposure arises from recoverables in respect of business ceded (reinsurance and retrocession) and premiums due in respect of direct and reinsurance business assumed, which together account for 27% (a decrease on 2003) of total selected assets (17% and 10% respectively). Of the amount relating to recoverables in respect of business ceded, 26% (2003: 41%) was found to be covered by collateral. Shares and other equity investments made up 17% (2003: 16%) of the total and, for those which reporting entities were able to analyse by sector, were held as follows: 25% in the insurance sector; 11% in financial institutions; and 64% in other sectors.58 Corresponding figures for 2003 were 19%, 11% and 66% respectively. Reinsurers’ cash and cash equivalents, where analysis was available, were found to be deposited with banks or held as deposits within the insurance sector. ‘Others’ relates primarily to other loans and receivables. At least 75% of selected assets were held in non-affiliates. Those held in affiliate entities (21% of the total) was made up primarily of shares and other equity investments, reinsurance recoverables and receivables, and cash and cash equivalents, accounting for 37%, 36% and 21% of the ‘affiliate’ total (2003: 32%, 50% and 12% respectively).59 Other sectors’ exposure to the reinsurance sector (selected liabilities and paid up capital)
Tables 4.3 and 4.4 look at the exposures of counterparties to reinsurers, the former by sector of counterparty and the latter according to whether the counterparty is affiliated. As last year, key liabilities and paid up capital were found to relate to insurance liabilities. 41% (2003: 39%) of the total represented gross claims provisions in respect of the primary insurance business engaged in by reporting entities.60 Gross claims provisions in respect of the reinsurance business assumed accounted for 43% (2003: 41%) of the total, whereby the counterparties involved are within the insurance sector.61 Other than in respect of technical liabilities (i.e. the liability to pay future claims in respect of contracts of insurance and reinsurance that have been entered into), the RTG found no evidence that reinsurers' liabilities are unduly concentrated to any one sector of counterparty. (See Appendix I, Table 4.3.) The data provided by the reporting entities showed the exposure of affiliate entities to reinsurers’ liabilities and paid up capital to represent 25% of the total (2003: 33% on the basis of the items which reporting entities were able to analyse by affiliation). Of this, the majority (80%) represents gross claims provisions in respect of primary and
59 Percentages are in relation to the total of selected assets which reporting reinsurers allocated as relating to ‘affiliate entities’ – see Table 4.2.
60 ‘Gross claims provisions’ relating to primary business undertaken by reporting reinsures is given in total only, and not analysed in the statistics according to counterparty, for the reasons that a) there is no requirements for direct insurers currently to provide such an analysis, and b) this report is concerned primarily with reinsurance rather than direct business.
61 It is to be noted that, where cross-sectoral risk transfer occurs through the use of a special purpose vehicle (SPV), the sector of the counterparty is shown according to the legal status of the SPV, which is likely to be ‘insurer’.

Page 42 of 100 IAIS Global Reinsurance Market Report 2004 December 2005
assumed reinsurance business. This is to be expected; many of the reporting reinsurers are part of insurance or financial groups, which transfer risk within the group as part of the group’s risk management strategy (see Section 6 above).
8.5 Investments
Investment activity of both reinsurers and insurers is carried out to ensure the matching of investment assets with the corresponding insurance liabilities due to their clients. There is a close relationship between a reinsurance company’s investments and the provision of reinsurance cover, covering the period from receipt of premium to payments of claims. The volume, quality, and structure of the investments are important components in reinsurers’ risk management. Investment assets arise primarily from the investment of premium income and the reinvestment of profits. Although the acquisition of investments is not the actual goal of the production process for reinsurance companies, it represents an important element in the provision of reinsurance cover. The investments of reinsurance companies place risk protection for direct insurers on a secure foundation. Investment principles and objectives62
In some jurisdictions investments by the reinsurance industry are subject to strict legal and administrative provisions, consisting mainly of general investment principles (security, profitability, liquidity, as well as mixture and diversification), qualitative investment categories, and quantitative limits on investments. Reinsurance companies, as major institutional investors, conduct professional asset management, which involves pursuing the following objectives, in particular: maintaining adequate liquidity and quality of investments to allow fulfilment of
obligations at all times
achieving the highest possible returns with the greatest possible security
practising a long-term oriented investment policy employing consistent asset-liability management.
Reinsurance companies are increasingly using risk management systems to manage their investments and are adapting their portfolio structure to their individual level of risk tolerance. Investment environment63
In the first three months of the year under review the global economy experienced a vigorous upturn, only to lose impetus again as early as the second quarter. There were three factors in this slowdown: firstly, the sharp rise in crude oil prices; secondly, the flagging stimuli from US monetary policy, and thirdly, the restrictive fiscal measures taking hold in China, the world's other major economic force The latter instituted a set of administrative rules intended to slow down the overheating economy. The increasing price of oil – which peaked at record levels in late October – was reflected in
62 The IAIS is currently working on a Draft Standard on Disclosures concerning Investment performance and risks for Insurers and Reinsurers.
63 See International Monetary Fund, Global Financial Stability Report – Market Developments and Issues, April 2005 and September 2005 (http://www.imf.org/External/FT/GFSR/2005/01/index.htm).
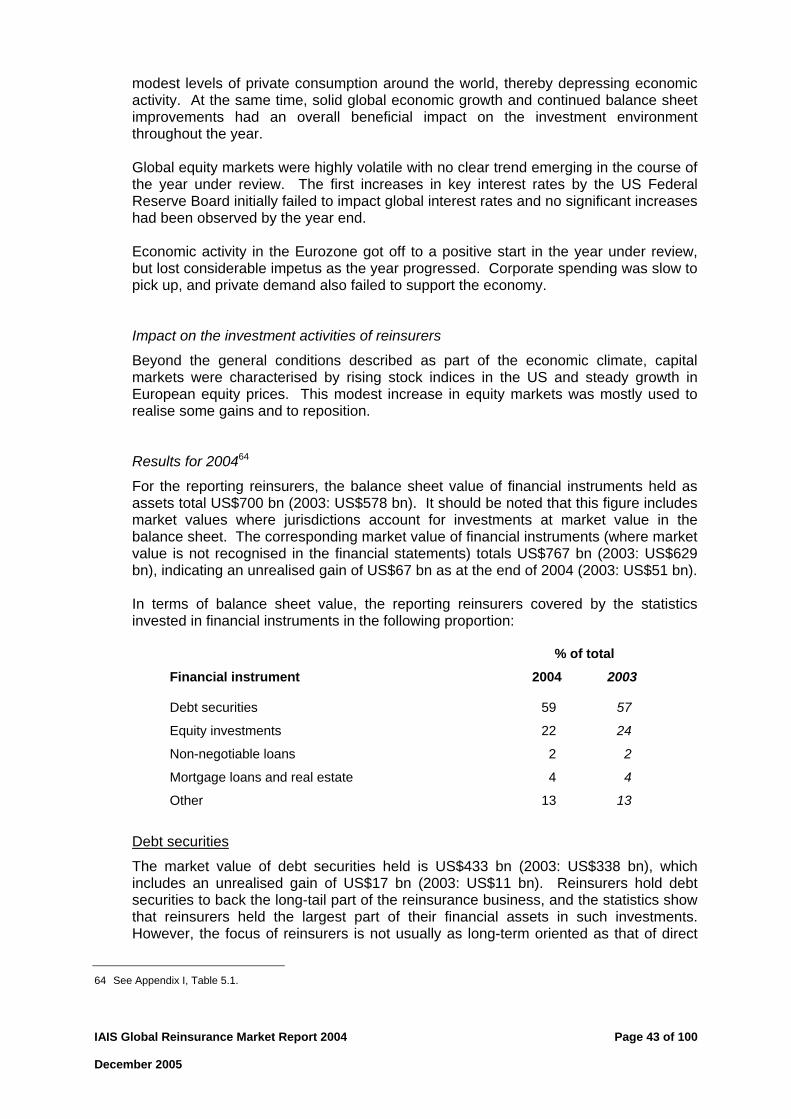
IAIS Global Reinsurance Market Report 2004 Page 43 of 100 December 2005
modest levels of private consumption around the world, thereby depressing economic activity. At the same time, solid global economic growth and continued balance sheet improvements had an overall beneficial impact on the investment environment throughout the year. Global equity markets were highly volatile with no clear trend emerging in the course of the year under review. The first increases in key interest rates by the US Federal Reserve Board initially failed to impact global interest rates and no significant increases had been observed by the year end. Economic activity in the Eurozone got off to a positive start in the year under review, but lost considerable impetus as the year progressed. Corporate spending was slow to pick up, and private demand also failed to support the economy. Impact on the investment activities of reinsurers
Beyond the general conditions described as part of the economic climate, capital markets were characterised by rising stock indices in the US and steady growth in European equity prices. This modest increase in equity markets was mostly used to realise some gains and to reposition. Results for 200464
For the reporting reinsurers, the balance sheet value of financial instruments held as assets total US$700 bn (2003: US$578 bn). It should be noted that this figure includes market values where jurisdictions account for investments at market value in the balance sheet. The corresponding market value of financial instruments (where market value is not recognised in the financial statements) totals US$767 bn (2003: US$629 bn), indicating an unrealised gain of US$67 bn as at the end of 2004 (2003: US$51 bn). In terms of balance sheet value, the reporting reinsurers covered by the statistics invested in financial instruments in the following proportion:
% of total
Financial instrument 2004 2003 Debt securities 59 57
Equity investments 22 24
Non-negotiable loans 2 2
Mortgage loans and real estate 4 4
Other 13 13
Debt securities
The market value of debt securities held is US$433 bn (2003: US$338 bn), which includes an unrealised gain of US$17 bn (2003: US$11 bn). Reinsurers hold debt securities to back the long-tail part of the reinsurance business, and the statistics show that reinsurers held the largest part of their financial assets in such investments. However, the focus of reinsurers is not usually as long-term oriented as that of direct
64 See Appendix I, Table 5.1.
Page 44 of 100 IAIS Global Reinsurance Market Report 2004 December 2005
life insurers.65 Therefore compared to many direct life insurers a larger part of investments is held in more liquid assets. Investment in debt securities issued by affiliates remained minimal. Equity investments
The market value of shares and other equity investments shows US$194 bn (2003: US$174 bn), which includes unrealised gains of US$43 bn (2003: US$34 bn). Of these unrealised gains US$16 bn (2003: US$12 bn) relates to holdings of shares in reporting entities themselves or in their affiliates, which under normal circumstances are not held for liquidity purposes and are not available for sale. Unrealised gains fluctuate with movements in the stock markets. Non-mortgage loans and Mortgage loans and real estate
Amounts invested were comparably small. Others
'Other investments' includes a significant amount of cash and cash equivalents (including deposits), loans which are not allocated either as 'non-negotiable loans' or as 'mortgage loans', and sundry investments which do not fall into the other categories within Table 5.1. Conclusion
The above analysis indicates that, similar to year-end 2003, reporting reinsurers invested the majority of their investment assets in debt securities, cash equivalents and real estate/mortgage loans – i.e. assets generally considered conservative and/or which are secured. It is also again worth noting that in some cases, either for regulatory or contractual reasons, reinsurers have to deposit investments with their direct insurer clients. Under these circumstances, it may be the direct insurer, or its supervisory requirements, which determines the investment strategy.
8.6 Profitability indicators The global economic upswing was beneficial to premium levels in most reinsurance markets in 2004. The favourable conditions enabled reinsurers to stabilise their technical results, a fact that was reflected in profitability. As indicated earlier in this report, the industry also withstood the impact of the US hurricanes in the third quarter, thus avoiding significant adverse impact upon profit. Results for 2004
The global statistics show net earned premiums totalling US$181 bn (see Appendix I, Table 5.2) and a total result (before tax) of a profit of US$17 bn (2003: US$23 bn). This represents a pre-tax profit of almost 9.5% in terms of net earned premiums, which is a marked decrease on the 14% of 2003.
65 Note that in some jurisdictions, notably the US, certain lines of non-life business can cover a number of decades.

IAIS Global Reinsurance Market Report 2004 Page 45 of 100 December 2005
Two of the main performance indicators for non-life underwriting are the loss ratio and the combined ratio. The loss ratio represents the ratio of claims incurred to earned premiums; the combined ratio is the sum of the loss ratio and the expense ratio (ratio of expenses to earned premiums), and gives a rough indication of the profitability of a (re)insurer’s underwriting operations.66 For non-life business, the global statistics show an average loss ratio of 72% (2003: 68%) and an average combined ratio of 102% (2003: 98%), which indicates that premiums did not cover both non-life claims and operating expenses, as they had done in 2003.67 The results for participating jurisdictions, based upon those of the reporting entities, is as follows: Jurisdiction Loss ratio % Combined ratio % (listed in order of 2004 combined ratio) A 57 86 B 64 89 C 70 97 D 88 102 E 70 103 F 69 104 G 84 118 Weighted average 72 102 As in 2003, performance varied considerably across jurisdictions. The above ratios are calculated from statistics which include both reinsurance business and direct insurance business for those entities which also carry out direct insurance.68 The weighted average loss ratio above may be compared with a ratio derived from the data in Table 2.2, which gives an analysis of net earned premiums and net claims incurred by class of business in respect of the reinsurance business of the reporting entities.
66 The use of combined ratios ignores capital costs and investment income. While capital costs are associated with the riskiness of the business, investment income is related to the time lag of loss payments. The profitability of business with the same combined ratio thus can differ, i.e. the riskier the business, the lower the profitability. On the other hand, the longer the time lag, the higher the profitability.
67 Subject to the qualifying notes to Table 5.2 in Appendix I.
68 See Appendix I, Table 5.2.

Page 46 of 100 IAIS Global Reinsurance Market Report 2004 December 2005
Profitability by line of non-life business
The statistics recorded in Table 2.2 allow us to look in further detail at profitability of non-life reinsurance according to broad line of business:69
Line of business Net premiums Net claims Loss earned incurred ratio % US$m US$m 2004 2003 Property 47,213 27,889 59 55
Liability 51,391 40,124 78 87
Financial lines 5,140 2,855 56 43
Weighted average for non-life 68 70
As noted in section 8.2 above, reporting reinsurers concentrated almost equally on property and liability risks, with much less business in financial lines. These figures continue to indicate a significant difference in profitability for these two lines of business, although less so than in 2003.70 An average loss ratio of 68% (2003: 70%) for non-life reinsurance-only business can be calculated from the information in Table 2.2. This shows improved, and increasing, profitability when compared to the ratios calculated from Table 5.2, as above (a loss ratio of 72% in 2004 and 68% in 2003). The reason for this is believed to be the impact of reinsurers' direct business which is included in the Table 5.2 statistics. As noted elsewhere in this report, the 2004 weather events which hit the US and Japan in 2004, had a far greater impact upon primary insurers than the reinsurance sector. Investment returns
Investment returns were US$33 bn (2003: US$32 bn) – representing nearly 18% (2003: nearly 20%) of total net premiums. The contribution from investment income was necessary to achieve a break-even result for non-life business. Exceptionally, this had not been the case in 2003, in which a combined ratio of less than 100 was achieved. Conclusion
Although not as profitable as 2003, the global statistics indicate that 2004 was a year in which the profitability of the global reinsurance industry remained relatively healthy, again enjoying a strong contribution from investment returns. As noted in last year's report, in business years where the loss ratio is relatively low, in some jurisdictions provisions have to be set aside as a buffer against years with higher loss ratios. The requirement to maintain such provisions71 is beyond the discretion of
69 The data in Table 2.2 intends to include only the reinsurance business of the reporting entities. It nevertheless includes an element of direct business for reasons explained in Appendix I. However, this is not believed to have a significantly distorting impact upon these loss ratios.
70 The use of loss ratios ignores expenses, capital costs and investment income, which could have a significant effect depending on the timelag of the class of business.
71 Sometimes known as ‘equalisation provisions’ or ‘contingency reserves’.

IAIS Global Reinsurance Market Report 2004 Page 47 of 100 December 2005
management. The transfer of funds to such a reserve is an additional expense72 which impacts upon total results. Accordingly, the above presentation understates the sector's underlying profitability.
8.7 Capital adequacy
Risk management and capital
From the supervisor’s perspective a solvency regime should take into account not only the sufficiency of technical provisions to cover claims and associated expenses, but also the sufficiency of capital to absorb significant unexpected losses – to the extent not covered by the technical provisions – on the risks for which capital is explicitly required. It should also require additional capital to absorb losses from risks not explicitly identified.73 Capital is a very important aspect of a reinsurer’s risk management system. Increasing focus on risk management
From a supervisor’s perspective, it is important to know whether capital available is sufficient. The more capital that is available, the greater the likelihood of (re)insurers being able to withstand unexpected losses and hence to survive in the long run. The assessment of the required amount of capital is highly technical and will often utilise actuarial techniques. However, risk management is acquiring increasing prominence in the assessment of capital, and in this regard the reinsurance industry is having to prepare for fundamental changes in capital requirements (such as Solvency II for European insurers).74 A number of jurisdictions already adopt a risk-based approach to capital requirements (see Appendix IV for summary of regulatory capital requirements in participating jurisdictions). An effective internal risk management system already is, and will increasingly become, a key factor in the assessment and management of capital. Results for 2004
Within the context of capital adequacy, the security of reinsurance is also an important consideration. In this section we look at regulatory capital required in comparison with total capital available of the reporting reinsurers, and also consider the degree of dependence by reinsurers on reinsurance (retrocessions) recoverable. The entities covered by the statistics show regulatory capital required of US$78 bn and total capital available of US$274 bn (see Appendix I, Table 5.4). The corresponding figures for 2003 were US$65 bn75 and US$244 bn. In making any comparison with the figures for 2003, one should bear in mind that the 2004 statistics capture a larger number of reinsurers (53 compared with 43 for 2003 – see Appendix III). As the bases for calculating the required regulatory capital differ between jurisdictions, the aggregation of such data at the global level is not particularly meaningful. The national level data is therefore also provided in Table 5.4 (Appendix I), and shows that
72 Included in Table 5.2 within ‘other income and expenses’.
73 See ICP 23 of IAIS Insurance core principles, October 2003.
74 See Section 5.1 for further comments on Solvency II.
75 Excluding France.

Page 48 of 100 IAIS Global Reinsurance Market Report 2004 December 2005
capital available exceeds capital required for all participating jurisdictions, which can be illustrated as follows:
Reporting reinsurers' total capital available
0
20
40
60
80
100
Bermud
a (9)
France
(5)
German
y (8)
Japa
n (2)
Switzerl
and (
3)
UK (1)
US (25)
US$
'bn
Required capital
Total capitalavailable
* number of reporting reinsurers from each jurisdiction indicated in brackets. Direct comparison between jurisdictions should not be made due to differing regulatory capital requirements across jurisdictions,76 differing requirements within jurisdictions for pure reinsurers and those reinsurers which write some direct business, and differing accounting principles. Total capital available shows some increase on 2003. As noted above, a larger number of reinsurers are represented in the statistics for 2004 than in the previous year, partly a result of the new business which developed following the September 2001 WTC tragedy. Another reason for the increase in available capital is the more favourable investment environment in 2004, resulting in higher unrealised gains on investments at the end of 2004 (US$65 bn77 compared with US$49 bn at the end of 2003). Total capital available continues to exceed reinsurers’ net premiums earned (US$181 bn),78 as in 2003, demonstrating that there is more capital available than premiums paid by insurers to reinsurers. This means that every amount paid by customers is more than backed by capital. Equally important is the fact that reinsurers’ capital includes 'buffers' such as contingency reserves and unrealised gains, in addition to equity. Contingency reserves provide a buffer before equity capital is utilised. The statistics show contingency reserves of US$30 bn (2003: US$25bn). Unrealised gains, noted above, represent gains which have not been recognised in the financial statements that could be realised if assets were sold at the reporting date.
76 Representing in some cases the minimum regulatory requirement. For further information on regulatory capital requirements in participating jurisdictions, see Appendix IV.
77 Slightly lower than the figure in table 5.1 due to restrictions on the extent to which such items are allowed for purposes of assessing regulatory capital.
78 See Appendix I, Table 5.2.

IAIS Global Reinsurance Market Report 2004 Page 49 of 100 December 2005
The total result – a profit of US$17 bn – has also been used to increase retained earnings. Gearing
Table 5.3 compares the capital base with the size of recoverables arising from the reinsurance of direct business and the retrocessions of assumed reinsurance business of the reporting entities: ‘gearing’. This ratio gives an indication of the degree of exposure of the reinsurance sector to reinsurance assets failing to be recovered. Recoverables are looked at both gross and net of collateral and other offsetting items. The results are as follows:
Recoverables as a percentage of capital 2004 2003
% % − Gross 69 70
− Net of collateral and offsetting items 31 38 The above figures do not take into account security provided via letters of credit (which are not a balance sheet item) for all jurisdictions. If taken into account this would reduce the ‘net’ ratio further. The ratios show a slight decrease upon 2003 and indicate that the capital base of the sector as a whole continued not to be unduly dependent upon the recovery of reinsurance assets. Conclusion
On the basis of the statistics of the reporting reinsurers, 2004 shows an increase in capital for the sector, reflecting the more favourable investment environment in 2004, new capital and businesses within the sector, and continuing overall profitability.
9. Disclosure
In its report, Task Force Re recommended that the Reinsurance Transparency Group should monitor closely progress by other Committees of the IAIS and work in other forums in the field of risk-oriented disclosures, and that this should be done with reference to its own considerations on potential improvement in this area. A summary of progress in the regulation of disclosure since Task Force Re issued its report is included in Section 4.2 above. A summary of the current level of disclosure by reinsurers in participating jurisdictions is also provided in Appendix VI. The Reinsurance Transparency Group remains encouraged by the level of on-going work in this field.

Page 50 of 100 IAIS Global Reinsurance Market Report 2004 December 2005
10. Conclusions
The global statistics show 2004 to have been a year of reasonable health for the reinsurance industry. Although it did not achieve an overall underwriting profit which it had done in 2003, it was largely unaffected by the natural disasters occurring in 2004 and increased the overall level of capital available. The global statistics show all participating jurisdictions with capital available significantly in excess of the regulatory capital required (or proxy therefor), based upon the entity-level data included in the statistics. In 2005 the sector felt the impact of Hurricane Katrina in the US, which is set to become the most costly natural hazard ever with current estimates for the size of insurance losses ranging from US$26 bn to almost US$70 bn. The scale of the loss exceeded the retention points of primary insurance companies. The reinsurance sector showed resilience in the face of such losses, helped by the fact that the past few years have been characterised by a hard market which had enabled reinsurance companies to rebuild balance sheets depleted by the WTC tragedy. Indeed, to date only a handful of companies have gone into run off as a result of the US hurricanes and the sector has been able to raise capital both to strengthen balance sheets and for the creation of new companies, principally in Bermuda. The global statistics indicate little participation in credit risk transfer by reinsurers or any significant concentration of exposures by reinsurers to other sectors or by other sectors to the reinsurance sector. As discussed in Section 3 above, the production of these global statistics involves a number of factors which mean that their interpretation should be done with care and at a high level. Within this context the high-level conclusions which we can draw from these statistics continue to go some way to answering questions about potential systemic risk arising from the reinsurance sector, and build upon last year's report and the 2003 global reinsurance market statistics. In the longer term, it is clear that significant harmonisation in both regulation and reporting are necessary in order to make significant improvements in the transparency of the reinsurance industry and in the ease of use of disclosures by reinsurers.

Appendix I
IAIS Global Reinsurance Market Report 2004 Page 51 of 100 December 2005
2004 global reinsurance market statistical tables The figures included in the tables below represent the aggregated results of the reporting reinsurers listed in Appendix III. Except where indicated otherwise below the relevant table, the data in tables 1.1 – 2.3 relates to the reporting entities’ reinsurance business only; in tables 3.1 – 5.4 data relates to reporting entities’ reinsurance and direct business. Comments and explanatory notes relevant to specific tables have been included below each table. The main general assumptions and qualifications are included in Appendix VIII. Table 1.1 Table 1.1 analyses gross reinsurance premiums by class of business (life/non-life, with non-life analysed into property, liability and financial lines). The Table also shows how much of these premiums are retained and how much is retroceded both to other reporting reinsurers and to non-reporting reinsurers.
Table 1.1: Gross reinsurance premiums assumed by class of business and retrocessions by class of business and reporting status of retrocessionaire Gross reinsurance premiums assumed by class of business and retrocessions by class of business and reporting status of retrocessionaire (US$m)
Class of business
Gross reinsurance premiums assumed
Of which retroceded to reporting
entities
Of which retroceded
to non-reporting entities
Net reinsurance premiums assumed
Life insurance (all) 48,274 3,493 4,795 39,986
Non-life insurance 120,621 6,774 21,327 92,520
of which Property 57,076
Liability 58,443
Financial lines 5,102
Total Life and Non-Life 168,895 10,267 26,122 132,506
• For the US, the annual statements do not collect information in a manner which enables
the retrocession of reinsurance business assumed to be distinguished from the reinsurance of direct business assumed. This table therefore includes an element of reinsurance of direct business within the figures relating to retrocessions, with a corresponding understatement of ‘net reinsurance premiums assumed’.
• Because of the above, conclusions on the levels of retrocession and net premiums assumed have not been drawn from this data.

Appendix I
Page 52 of 100 IAIS Global Reinsurance Market Report 2004 December 2005
Table 1.2 Table 1.2 analyses gross reinsurance premiums assumed according to the regions of ceding insurers. Aggregated results indicate the origination of ceded risks at a global level. Further analysis of jurisdiction level information also enables information on net cross-regional transfer of reinsurance premiums to be produced.
Table 1.2: Gross Reinsurance premiums ceded to reporting reinsurers by region of ceding insurer Gross Reinsurance premiums ceded to reporting entities by region of ceding insurer (US$m)
Region of ceding insurer
Gross reinsurance premiums
ceded
Europe 59,695 North America 96,053 Asia and Australia 9,354 Africa, Near and Middle East 1,319 Latin America 2,474 Total 168,895
Table 2.1 Table 2.1 shows gross reinsurance premiums assumed by class of business, and according to whether the business relates to proportional or non-proportional contracts. Table 2.1: Reinsurance premiums assumed by class of business and type of contract Gross reinsurance premiums assumed proportional/non-proportional by class of business (US$m)
Class of business Proportional Non-proportional
Life insurance (all) 48,010 264 Non-life insurance 83,187 37,434 of which Property 38,143 18,933
Liability 40,641 17,802 Financial
lines 4,403 699 Total 131,197 37,698
• For the US, the annual statements do not collect information in a manner which enables
analysis of ‘life’ business to be split between ‘proportional’ and ‘non-proportional’ types of contract. All has been included as ‘proportional’.

Appendix I
IAIS Global Reinsurance Market Report 2004 Page 53 of 100 December 2005
Table 2.2 Table 2.2 is a high level overview of technical performance, showing ‘net premiums earned’ and ‘net claims incurred’ by class of business. Table 2.2: Technical performance by class of business Net premiums earned and net claims incurred by class of business in respect of reinsurance business assumed (US$m)
Class of business Net
premiums earned
Net claims
incurred
Life insurance (all) 44,879 32,605 Non-life insurance 103,743 70,869 of which Property 47,212 27,890
Liability 51,391 40,124 Financial
lines 5,140 2,855 Total Life and Non-Life 148,622 103,474
• US data included in this table is in respect of both reinsurance and direct business. The
annual statements do not collect information in a manner which distinguishes between direct and reinsurance business for ‘net premiums earned’. The US data for ‘net claims incurred’ is included on a similar basis for purposes of comparability. For all other jurisdictions the data relates to just the reinsurance business of the reporting entities.
Table 2.3 Table 2.3 gives a profile of claims exposures in respect of retained reinsurance risk (‘net claims provision’) by class of business and, where possible, making a distinction between reported claims and incurred claims which have not yet been reported to the reinsurer, for which the degree of uncertainty may be higher. Table 2.3: Claims provision for reinsurance assumed by class of business Net claims provision for reinsurance assumed, by class of business and reporting status of claim (US$m)
Class of business
Net claims provision
for reported claims
Net claims provision incurred but not
reported (IBNR)
Total claims
provision for incurred
claims
Net life assurance provision
Total net claims
provision and net life assurance provision
Life insurance (all) 163,490 163,490 Non-life insurance 118,880 71,353 190,233 190,233 of which Property) 39,720 24,574 64,294 64,294
Liability 74,734 44,636 119,370 119,370 Financial
lines 4,426 2,143 6,569 6,569 Total Life and Non-Life 353,723

Appendix I
Page 54 of 100 IAIS Global Reinsurance Market Report 2004 December 2005
Table 3.1 Table 3.1 analyses derivative financial instruments held by reinsurers, by type of contract. Additional analysis indicates whether the contracts relate to hedging activity or not. The information includes both notional amounts and fair values.
Table 3.1: Reporting entities’ use of derivative financial instruments Derivative financial instruments by type of instrument (notional and fair values) (US$m)
Held for hedging purposes Held for non-hedging purposes Total
Type of contract Notional amount 13)
Fair value (+/-)
Notional amount
Fair value (+/-)
Notional amount
Fair value (+/-)
Interest rate contracts 118,896 999 8,998 128 127,894 1,127 Equity and index contracts 13,331 828 946 22 14,277 850 Foreign currency contracts 2,186 82 2,385 -69 4,571 13 Credit derivatives 84 3 44,947 -48 45,031 -45 Other 40 1 1,901 -25 1,941 -24 Total 134,537 1,913 59,177 8 193,714 1,921
Table 3.2 Table 3.2 records information on credit default swaps and collateralised debt obligation (CDO) investments, in respect of both protection bought and protection sold positions, including both notional amounts and fair values. Table 3.2: Reporting entities’ participation in credit risk transfer (CRT) activity Participation in credit default-swaps and CDOs by notional and fair value (US$m)
Type of contract Total
(notional amount)
Fair value (+/-)
Credit default swaps of which Protection
bought 3,895 -46 Protection
sold 18,603 27 CDO investments of which Protection
bought 36 48 Protection
sold 519 250 Total Protection bought 3,931 2 Total Protection sold 19,122 277
One jurisdiction was unable to provide separate figures for credit default swaps (notional value US$420 m; fair value US$4m) and collateralised debt obligations (book value US$1,506 m; fair value US$1,532 m) analysed between bought and sold positions. The data in Table 3.2 therefore represents six jurisdictions.

Appendix I
IAIS Global Reinsurance Market Report 2004 Page 55 of 100 December 2005
Tables 4.1/4.2 Tables 4.1 and 4.2 deal with exposures of reinsurers to counterparties, the former by sector of counterparty (insurers, financial institutions, split where possible between banks and investment institutions, sovereigns and others) and the latter according to whether the counterparty is affiliated. These tables record information on selected assets covering the major asset categories as well as the extent to which recoverables from ceded reinsurance and retrocessions, as well as derivatives, are covered by collateral. Table 4.1 Table 4.1: Key counterparty exposures (selected assets) by sector of counterparty Key counterparty exposures (selected assets) by sector of counterparty (US$m)
Of which
Selected assets Total* Insurers (1)
Financial institutions
(2)
Banks Investment institutions
Sovereigns (3)
Other sectors
(4)
Recoverables from ceded reinsurance and retrocessions
188,567 188,567
of which covered by collateral 101,390 101,390
Debt securities 454,702 1,958 22,563 11,878 6,691 142,945 287,236Cash and cash equivalents deposited 118,750 63,788 25,477 25,277 200 16 385Shares and other equity investments 190,196 46,793 22,306 4,042 6,173 2 121,095Derivative financial instruments with positive fair value
3,051 120 2,909 1,471 413 0 22
of which covered by collateral 1,130 0 1,105 752 216 0 25
Receivables arising from insurance and assumed reinsurance business
107,127 105,351 0 0 0 0 1,776
Other loans and receivables 27,481 10,846 3,060 445 1,543 933 12,642Total 1,089,874 417,423 76,315 43,113 15,020 143,896 423,156
* ‘Total’ represents the total of selected assets allocated by sector in (1) to (4), plus those which could not be allocated by sector. • Cash and cash equivalents deposited of $29,084 m could not be allocated by sector.
• Figures relating to ‘financial institutions’ have been analysed, where possible, according to whether they relate to banks or to investment institutions.

Appendix I
Page 56 of 100 IAIS Global Reinsurance Market Report 2004 December 2005
Table 4.2 Table 4.2: Reporting entities’ counterparty exposure (selected assets) by affiliation of counterparty Key counterparty exposures (selected assets) by affiliation of counterparty (US$m)
Selected assets Total* Affiliate entities
Non-affiliate entities
Recoverables from ceded reinsurance and retrocessions
188,567 45,243 92,955 of which covered by
collateral 101,390 15,475 28,428 Debt securities 454,702 2,140 452,562 Cash and cash equivalents deposited 118,750 48,274 70,476 Shares and other equity investments 190,196 82,794 107,402 Derivative financial instruments with positive fair value
3,051 182 2,869 of which covered by
collateral 1,130 0 1,130 Receivables arising from insurance and assumed reinsurance business
107,127 36,725 70,402 Other loans and receivables 27,481 10,513 16,968 Total 1,089,874 225,871 813,634
* ‘Total’ represents the total of selected assets allocated by affiliation, plus those which could not be allocated. 'Recoverables from ceded reinsurance and retrocessions' includes US$50,369m, and recoverables subject to collateral of US$57,487m which could not be analysed by affiliation.
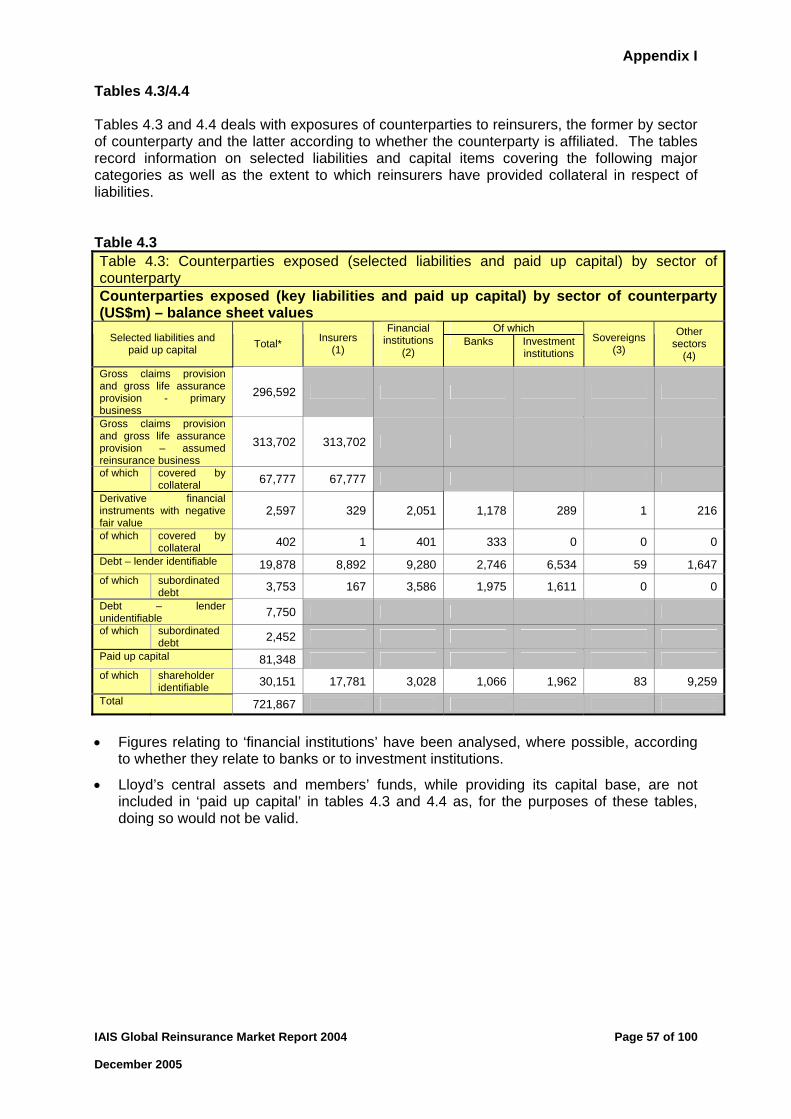
Appendix I
IAIS Global Reinsurance Market Report 2004 Page 57 of 100 December 2005
Tables 4.3/4.4 Tables 4.3 and 4.4 deals with exposures of counterparties to reinsurers, the former by sector of counterparty and the latter according to whether the counterparty is affiliated. The tables record information on selected liabilities and capital items covering the following major categories as well as the extent to which reinsurers have provided collateral in respect of liabilities. Table 4.3 Table 4.3: Counterparties exposed (selected liabilities and paid up capital) by sector of counterparty Counterparties exposed (key liabilities and paid up capital) by sector of counterparty (US$m) – balance sheet values
Of which Selected liabilities and
paid up capital Total* Insurers (1)
Financial institutions
(2) Banks Investment
institutions Sovereigns
(3)
Other sectors
(4)
Gross claims provision and gross life assurance provision - primary business
296,592
Gross claims provision and gross life assurance provision – assumed reinsurance business
313,702 313,702
of which covered by collateral 67,777 67,777
Derivative financial instruments with negative fair value
2,597 329 2,051 1,178 289 1 216
of which covered by collateral 402 1 401 333 0 0 0
Debt – lender identifiable 19,878 8,892 9,280 2,746 6,534 59 1,647of which subordinated
debt 3,753 167 3,586 1,975 1,611 0 0Debt – lender unidentifiable 7,750 of which subordinated
debt 2,452 Paid up capital 81,348 of which shareholder
identifiable 30,151 17,781 3,028 1,066 1,962 83 9,259Total 721,867
• Figures relating to ‘financial institutions’ have been analysed, where possible, according
to whether they relate to banks or to investment institutions.
• Lloyd’s central assets and members’ funds, while providing its capital base, are not included in ‘paid up capital’ in tables 4.3 and 4.4 as, for the purposes of these tables, doing so would not be valid.

Appendix I
Page 58 of 100 IAIS Global Reinsurance Market Report 2004 December 2005
Table 4.4 Table 4.4: Counterparties exposed (selected liabilities and paid up capital) by affiliation of counterparty Counterparties exposed (key liabilities and paid up capital) by affiliation of counterparty (US$m) – balance sheet values
Selected liabilities and paid up capital Total Affiliate
entities
Non-affiliate entities
Gross claims provision and gross life assurance provision - primary business
296,592 44,604 251,988
Gross claims provision and gross life assurance provision – assumed reinsurance business
313,702 100,042 213,660
of which covered by collateral 66,777 25,874 41,903
Derivative financial instruments with negative fair value
2,597 411 2,186 of which covered by
collateral 402 1 401 Debt – lender identifiable 19,878 7,701 12,177 of which subordinated
debt 3,753 1,506 2,247 Debt – lender unidentifiable 7,750 0 7,750 of which subordinated
debt 2,452 0 2,452 Paid up capital 81,348 28,589 52,759 of which shareholder
identifiable 30,149 11,127 19,022 Total 721,867 181,347 540,520

Appendix I
IAIS Global Reinsurance Market Report 2004 Page 59 of 100 December 2005
Table 5.1 Table 5.1 looks at reinsurers’ invested assets. It records financial instruments held by reinsurers at balance sheet value and at market value, by major type of financial instrument held. It also records the unrealised gains and losses on investments where there is a difference between balance sheet value and market value. Also included is the extent to which financial instruments are represented by investment in the affiliates or in the company’s own shares. Table 5.1: Reporting entities’ investments Investments by type of financial instrument (US$m)
Financial instrument At balance sheet value
At market value
Unrealised gains/
losses on potential
sale
Debt securities 416,127 433,431 17,304 of which issued by
affiliates 2,131 2,156 25 Shares and other equity investments 151,114 193,787 42,673
of which Own and affiliate shares
70,193 85,897 15,704 Non-negotiable loans (including non mortgage loans)
13,806 13,855 49 Mortgage loans and real estate 26,670 32,973 6,303 Other 92,497 93,614 1,117 Total invested assets 700,214 767,660 67,446
• Where jurisdictions account for investments at market value, the market value has been
used in both columns.
• For investments where no market value was available, book value has been included as a proxy for market value.
Table 5.2 Table 5.2 gives a high level overview of reinsurers’ profitability, both in overall terms and for ‘life’ and ‘non-life’ business. Table 5.2: Reporting entities’ profitability indicators and ratios Reporting entities’ profitability indicators and ratios (US$m)
Revenue account items Non-life Life Total
Net premiums earned 137,310 43,999 181,309 Net claims incurred -98,503 -38,281 -136,784 Net operating expenses -41,747 -10,927 -52,674 Non-technical operating expenses* -507 Investment income 33,075 Other income/expenses (+/-) -7,133 Total result 17,286 Loss ratio % 72% Combined ratio % 102%
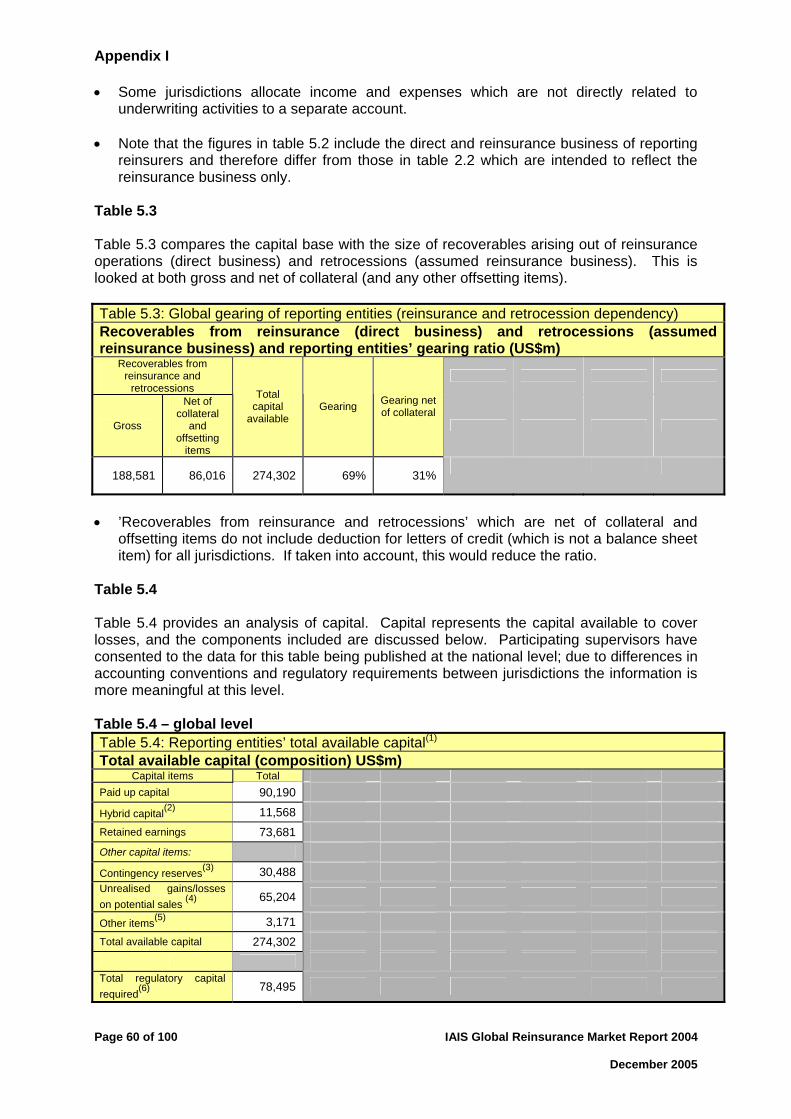
Appendix I
Page 60 of 100 IAIS Global Reinsurance Market Report 2004 December 2005
• Some jurisdictions allocate income and expenses which are not directly related to underwriting activities to a separate account.
• Note that the figures in table 5.2 include the direct and reinsurance business of reporting
reinsurers and therefore differ from those in table 2.2 which are intended to reflect the reinsurance business only.
Table 5.3 Table 5.3 compares the capital base with the size of recoverables arising out of reinsurance operations (direct business) and retrocessions (assumed reinsurance business). This is looked at both gross and net of collateral (and any other offsetting items). Table 5.3: Global gearing of reporting entities (reinsurance and retrocession dependency) Recoverables from reinsurance (direct business) and retrocessions (assumed reinsurance business) and reporting entities’ gearing ratio (US$m)
Recoverables from reinsurance and
retrocessions
Gross
Net of collateral
and offsetting
items
Total capital
available Gearing Gearing net
of collateral
188,581 86,016 274,302 69% 31%
• ’Recoverables from reinsurance and retrocessions’ which are net of collateral and
offsetting items do not include deduction for letters of credit (which is not a balance sheet item) for all jurisdictions. If taken into account, this would reduce the ratio.
Table 5.4 Table 5.4 provides an analysis of capital. Capital represents the capital available to cover losses, and the components included are discussed below. Participating supervisors have consented to the data for this table being published at the national level; due to differences in accounting conventions and regulatory requirements between jurisdictions the information is more meaningful at this level. Table 5.4 – global level Table 5.4: Reporting entities’ total available capital(1) Total available capital (composition) US$m)
Capital items Total Paid up capital 90,190 Hybrid capital(2) 11,568 Retained earnings 73,681 Other capital items: Contingency reserves(3) 30,488 Unrealised gains/losses on potential sales (4)
65,204 Other items(5) 3,171 Total available capital 274,302
Total regulatory capital required(6) 78,495

Appendix I
IAIS Global Reinsurance Market Report 2004 Page 61 of 100 December 2005
Table 5.4 – by jurisdiction Table 5.4: Reporting entities' total available capital(1) Total available capital (composition) US$m)
Capital items Bermuda France Germany Japan Switzerland UK US Paid up capital 10,100 3,004 13,484 2,155 654 19,071 41,722
Hybrid capital(2) 1,522 2,711 2,444 0 3,036 0 1,855Retained earnings 5,827 1,271 7,443 7,179 9,799 5,113 37,049Other capital items:
Contingency reserves(3) 0 1,739 15,413 10,706 2,269 0 361Unrealised gains/losses on potential sales (4) 852 13,370 12,121 19,274 12,228 0 7,359
Other items(5) 933 -72 29 3,229 -348 0 -600Total available capital 19,234 22,023 50,934 42,543 27,638 24,184 87,746
Total regulatory capital required(6) 8,184 6,318 7,007 8,996 3,709 4,331 39,950
Please refer to Appendix III for the number of reporting reinsurers from each jurisdiction included in these statistics. (1) The figures in this table estimate the total capital of the reporting entities included in
these statistics, which is available to meet losses. The figures do not necessarily represent capital as defined either by participating jurisdictions' national GAAP or by their national regulations. They include unrealised gains/losses according to national GAAP. Such a measure could be viewed as a proxy for capital available in the case that reserves/provisions including IBNR do not cover future claims payments. It must be taken into consideration that – depending on national statutory valuation rules – unrealised gains is an allowable component in assessing margin of solvency. The measure 'total available capital' in this table is based on a legal entity view and is not to be compared with respective measures on a consolidated group basis as eventually published in other reports or studies or sources.
(2) ‘Hybrid’ capital is as defined as eligible by the supervisor or regulation and relates to non-share (stock) capital which is ‘’permanent' in nature, such as long-term debt issued.
(3) 'Contingency reserve' arises where the event giving rise to the loss has not occurred; it includes 'equalisation provision' and 'catastrophe reserve'.
(4) 'Unrealised gains/losses on potential sale' represents the potential gains or losses on sale of investments which would have been realised had sale occurred at the reporting date, by comparing the balance sheet value with market value. The total differs from that in Table 5.1 due to restrictions on the extent to which such items are allowed for purposes of assessing regulatory capital.
(5) 'Other items' include adjustments in respect of taxation, dividends, general bad debt provisions and treasury stock.
(6) It should be noted that regulatory capital requirements differ between jurisdictions. See Appendix IV for a summary of regulatory capital requirements in participating jurisdictions. It should be noted that in 2004 France had no regulatory capital requirement for pure reinsurers; the French reporting entities included in the statistics are internationally active insurers whose main activities include reinsurance, and the capital requirement relates to their status as primary insurers.

Appendix II
Page 62 of 100 IAIS Global Reinsurance Market Report 2004 December 2005
Participants in Reinsurance Transparency Group Participating jurisdictions Bermuda
France
Germany
Japan
Switzerland
United Kingdom
United States
Reinsurance Transparency Group members Julian Adams (Chairman) 79 Financial Services Authority, United Kingdom
Jeremy Cox Bermuda Monetary Authority, Bermuda
Hervé de Villeroché Ministère de l’Economie des Finances et de l’Industrie, France
Florence Lustman Commission de Contrôle des Assurances, des Mutuelles et Institutions de Prévoyance, France
Lutz Janke BaFin, Germany
Tomoko Amaya Financial Services Agency, Japan
Kurt Schneiter Swiss Federal Office of Private Insurance, Switzerland
Paul Taylor Financial Services Authority, United Kingdom
Alessandro Iuppa Maine Bureau of Insurance/NAIC, United States
Representatives of RTG members Leila Madeiros Bermuda Monetary Authority, Bermuda
François Tempé Commission de Contrôle des Assurances, des Mutuelles et Institutions de Prévoyance, France
Guillaume Autier Ministère de l’Economie des Finances et de l’Industrie, France
Sebastian Ashenbrenner- BaFin, Germany von Dahlen
Hitomi Imai Financial Services Agency, Japan
Piotr Andrzejewski Swiss Federal Office of Private Insurance, Switzerland
David Simmons Financial Services Authority, United Kingdom
Bryan Fuller NAIC, United States
79 Replacing Alan Spence of the Financial Services Authority, United Kingdom from September 2005

Appendix II
IAIS Global Reinsurance Market Report 2004 Page 63 of 100 December 2005
Industry representatives Emmanuelle Rousseau Scor, France
Hans-Jürgen Säglitz GDV, Germany
Ralph Vogelgesang Munich Re, Germany
Makoto Hori Tokio Marine & Nichido Fire Insurance Co. Ltd, Japan
Katsuo Matsushita General Insurance Association of Japan
Heinz Kaplanek Swiss Re, Switzerland
Patricia Hakong Lloyd’s, United Kingdom
Beth Grossman ACORD, United States
Brad Smith American Council of Life Insurers, United States
Brad Kading Reinsurance Association of America, United States
Martin Carus AIG, United States
Peter Boller International Association of Actuaries
Secretariat The IAIS Secretariat provides secretariat support to the Reinsurance Transparency Group, with involvement, as necessary, from the FSF Secretariat, IMF and World Bank staff, and other financial stability organisations.

Appendix III
Page 64 of 100 IAIS Global Reinsurance Market Report 2004 December 2005
Methodology and list of reporting reinsurers Structure of the statistics As for the previous report, the method of gathering, processing and releasing the data submitted by reporting reinsurers is based on a three-level approach, with each level of data requiring different treatment and confidentiality rules: A-level data (legal entity-based information)
B-level data (nationally aggregated data)
C-level data (global data).
Using reinsurer-specific information (A-level data), and using a consistent template, participating supervisors have compiled aggregate reports (B-level data) for their respective jurisdictions. Supervisors have then transmitted the aggregate reports (B-level data) for their respective jurisdictions to the IAIS Secretariat. Based on the aggregate reports received from the supervisors the IAIS Secretariat has compiled the data into global tables (C-level data). Coverage and selection criteria To obtain a significant coverage of the global reinsurance market, criteria were agreed upon for the selection of globally significant reinsurers (‘reporting reinsurers’) to be included in the statistics. The selection criteria, which are unchanged from the previous year, are based upon unaffiliated business only, to avoid the inclusion in the statistics of those reinsurers whose significant reinsurance transactions are intra-group only. The criteria are as follows: Gross unaffiliated reinsurance premiums assumed of US$800 million (US$20 million for
monolines); or
Gross unaffiliated technical reserves of US$2 billion (not applied to monolines); with
Discretion of the national authority to recommend certain entities to be excluded, with a final decision by the group.
This has resulted in a total of 53 major reinsurers from the seven participating jurisdictions meeting the selection criteria for inclusion in the 2004 global reinsurance market statistics are as follows:
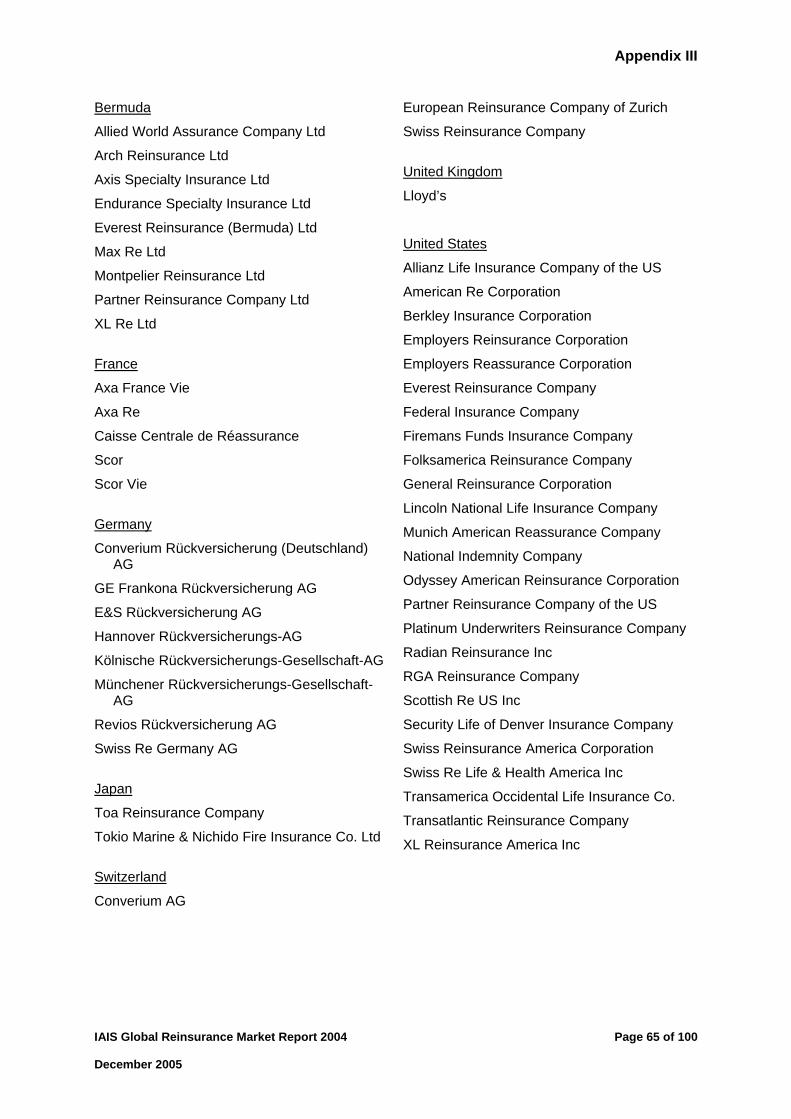
Appendix III
IAIS Global Reinsurance Market Report 2004 Page 65 of 100 December 2005
Bermuda
Allied World Assurance Company Ltd
Arch Reinsurance Ltd
Axis Specialty Insurance Ltd
Endurance Specialty Insurance Ltd
Everest Reinsurance (Bermuda) Ltd
Max Re Ltd
Montpelier Reinsurance Ltd
Partner Reinsurance Company Ltd
XL Re Ltd
France
Axa France Vie
Axa Re
Caisse Centrale de Réassurance
Scor
Scor Vie
Germany
Converium Rückversicherung (Deutschland) AG
GE Frankona Rückversicherung AG
E&S Rückversicherung AG
Hannover Rückversicherungs-AG
Kölnische Rückversicherungs-Gesellschaft-AG
Münchener Rückversicherungs-Gesellschaft-AG
Revios Rückversicherung AG
Swiss Re Germany AG
Japan
Toa Reinsurance Company
Tokio Marine & Nichido Fire Insurance Co. Ltd
Switzerland
Converium AG
European Reinsurance Company of Zurich
Swiss Reinsurance Company
United Kingdom
Lloyd’s
United States
Allianz Life Insurance Company of the US
American Re Corporation
Berkley Insurance Corporation
Employers Reinsurance Corporation
Employers Reassurance Corporation
Everest Reinsurance Company
Federal Insurance Company
Firemans Funds Insurance Company
Folksamerica Reinsurance Company
General Reinsurance Corporation
Lincoln National Life Insurance Company
Munich American Reassurance Company
National Indemnity Company
Odyssey American Reinsurance Corporation
Partner Reinsurance Company of the US
Platinum Underwriters Reinsurance Company
Radian Reinsurance Inc
RGA Reinsurance Company
Scottish Re US Inc
Security Life of Denver Insurance Company
Swiss Reinsurance America Corporation
Swiss Re Life & Health America Inc
Transamerica Occidental Life Insurance Co.
Transatlantic Reinsurance Company
XL Reinsurance America Inc

Appendix III
Page 66 of 100 IAIS Global Reinsurance Market Report 2004 December 2005
Generally, reporting reinsurers have completed entity level data from information included in, or consistent with, financial statements and regulatory returns, supplemented by additional analysis where necessary. Some of the relevant information, in particular that included in financial statements and published regulatory returns, is publicly available. Other information which is not public has been produced and submitted to the supervisor on a voluntary basis. For the US reinsurers, the NAIC compiles extensive, entity-level information from mandatory annual statement data which is publicly available in the NAIC Financial Data Repository (FDR). Most of the information required to complete the statistical tables for the relevant entities has been produced by the NAIC from this data. Certain of the data has been provided by the NAIC’s Securities Valuation Office, based upon the mandatory annual statements submitted by industry. Changes in reporting reinsurers from previous year As a result of applying consistent selection criteria, 53 reporting reinsurers were selected for the 2004 statistics, compared with 43 for 2003. The increase in number of reporting reinsurers was primarily in Bermuda. The attacks on September 11, 2001 created a demand for property/catastrophe capacity in the insurance market, which led to a number of new reinsurance companies being formed in Bermuda to take advantage of the loss of capacity in the wake of the attacks. Other insurance companies that had formed prior to 9/11 were also able to attract capital investment and increase their business in various lines. These companies have grown over the intervening years to a size which now brings them within the scope of this report. Of the seven new Bermudian companies reporting data for this report, the oldest was incorporated in 1999, and five were incorporated after the 9/11 attacks. Reasons for changes in reporting reinsurers in other jurisdictions are growth, change in organisational structure or business strategy, and run-off.
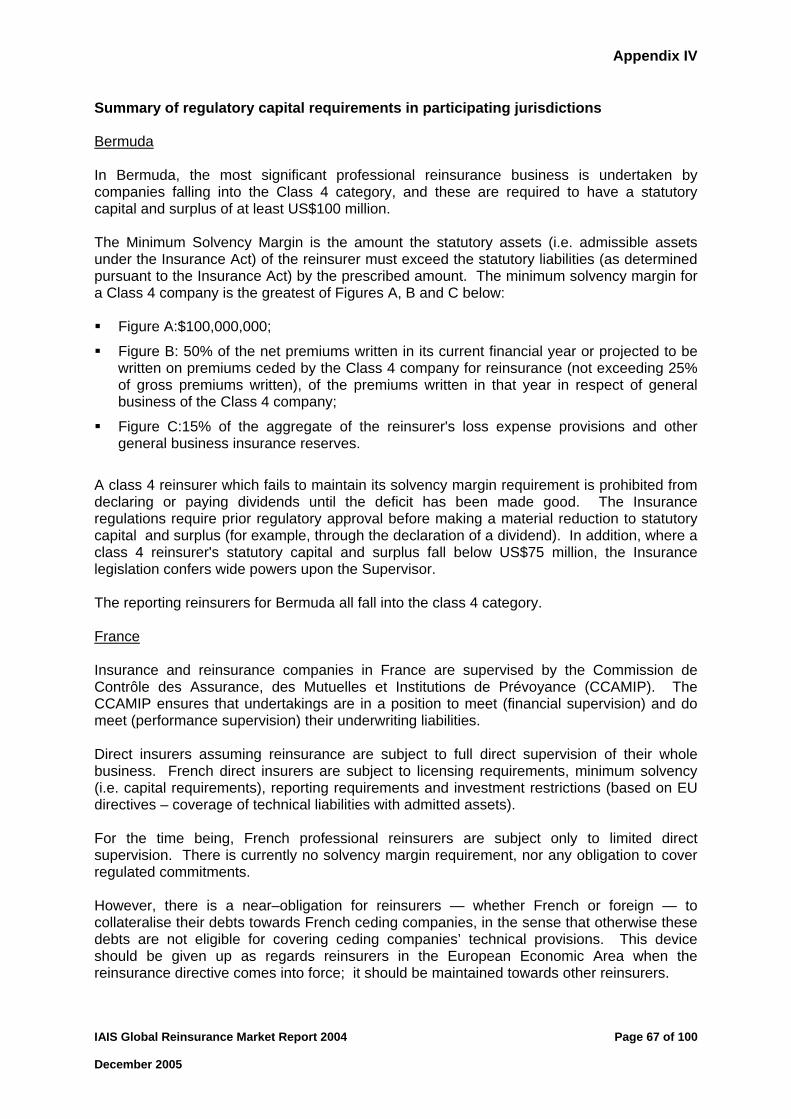
Appendix IV
IAIS Global Reinsurance Market Report 2004 Page 67 of 100 December 2005
Summary of regulatory capital requirements in participating jurisdictions Bermuda In Bermuda, the most significant professional reinsurance business is undertaken by companies falling into the Class 4 category, and these are required to have a statutory capital and surplus of at least US$100 million. The Minimum Solvency Margin is the amount the statutory assets (i.e. admissible assets under the Insurance Act) of the reinsurer must exceed the statutory liabilities (as determined pursuant to the Insurance Act) by the prescribed amount. The minimum solvency margin for a Class 4 company is the greatest of Figures A, B and C below: Figure A:$100,000,000;
Figure B: 50% of the net premiums written in its current financial year or projected to be written on premiums ceded by the Class 4 company for reinsurance (not exceeding 25% of gross premiums written), of the premiums written in that year in respect of general business of the Class 4 company;
Figure C:15% of the aggregate of the reinsurer's loss expense provisions and other general business insurance reserves.
A class 4 reinsurer which fails to maintain its solvency margin requirement is prohibited from declaring or paying dividends until the deficit has been made good. The Insurance regulations require prior regulatory approval before making a material reduction to statutory capital and surplus (for example, through the declaration of a dividend). In addition, where a class 4 reinsurer's statutory capital and surplus fall below US$75 million, the Insurance legislation confers wide powers upon the Supervisor. The reporting reinsurers for Bermuda all fall into the class 4 category. France Insurance and reinsurance companies in France are supervised by the Commission de Contrôle des Assurance, des Mutuelles et Institutions de Prévoyance (CCAMIP). The CCAMIP ensures that undertakings are in a position to meet (financial supervision) and do meet (performance supervision) their underwriting liabilities. Direct insurers assuming reinsurance are subject to full direct supervision of their whole business. French direct insurers are subject to licensing requirements, minimum solvency (i.e. capital requirements), reporting requirements and investment restrictions (based on EU directives – coverage of technical liabilities with admitted assets). For the time being, French professional reinsurers are subject only to limited direct supervision. There is currently no solvency margin requirement, nor any obligation to cover regulated commitments. However, there is a near–obligation for reinsurers — whether French or foreign — to collateralise their debts towards French ceding companies, in the sense that otherwise these debts are not eligible for covering ceding companies’ technical provisions. This device should be given up as regards reinsurers in the European Economic Area when the reinsurance directive comes into force; it should be maintained towards other reinsurers.

Appendix IV
Page 68 of 100 IAIS Global Reinsurance Market Report 2004 December 2005
The reinsurance directive is currently being enforced and will lead to the submission of all reinsurers to an agreement procedure, and to the introduction of a solvency margin requirement. Germany Pure reinsurers have to meet the same standards as primary insurers concerning capital requirements. A respective amendment (§§ 119 to 123c) of the German Insurance Supervision Law (Versicherungsaufsichtsgesetz - VAG) was adopted at the end of 2004. Pursuant to § 53c in connection with § 123b VAG, reinsurance companies have to have an amount of free equity capital, which enables them to fulfil their contractual obligations at any time. This amount has to be, as a minimum, at least as high as the solvency margin requirements; whereas the solvency margin requirements are determined by the overall business volume. With respect to defining solvency margin requirements, § 53c (2) 1 VAG refers to the respective European Community Directive ('Solvency I'). Insurance undertakings that carry on both reinsurance and primary insurance business also have to subject their entire technical insurance business to the solvency requirements applicable to primary insurers – also based on the above mentioned paragraphs of the VAG and on the Solvency I Directive. The supervisory authority may take any precautions and make any orders which are necessary to ensure that reinsurance undertakings are able to meet their obligations arising from reinsurance relationships at all times. The funds of reinsurers have to be adequate in order to fulfil all obligations under the existing reinsurance contracts. In addition, if a pure reinsurer is part of an insurance group the guidance on reinsurance group solvency pursuant to EC Directive 98/78 already applies. Japan Japan adopts a risk-based approach to regulatory capital requirements, which focuses on the major risks: insurance risk, assumed interest risk, asset management risk and operational risk (life and non-life business), and additionally catastrophe risk (non-life business). Insurers are expected to maintain a regulatory minimum capital of 200% of the estimated value of the risks. Switzerland Pursuant to Art. 10 of the Insurance Supervisory Law (1978, as of 2000), Swiss reinsurers should provide necessary guarantee to the insured, in particular as regards their solvency and the organisation and conduct of their business. Accordingly, Swiss supervision procedures and industry practices require that a reinsurer's eligible or free capital amount to at least 20% of net premiums earned, but no less than CHF 10 million. Draft regulations, currently being discussed, include detailed solvency margin and target capital requirements for Swiss reinsurers. United Kingdom The underlying UK requirements are that authorised firms must as a minimum meet the European Community Directive requirements. However, a new key principle set out in the FSA’s Prudential Sourcebook is that “A firm must maintain adequate financial resources”. UK does not differentiate between insurers and reinsurers for these purposes.
Appendix IV
IAIS Global Reinsurance Market Report 2004 Page 69 of 100 December 2005
The EC requirement for the solvency margin is based on the higher of a percentage of premiums or a percentage of claims calculation, together with an additional loading of 50% for all liability classes with a minimum amount. This amount is considered by the FSA to be too low for most firms, and therefore it requires firms to maintain their own assessment (an Individual Capital Assessment or 'ICA') on an ongoing basis of the capital it needs given the nature of risks and risk mitigation that the firm has. The FSA may then give guidance to the firm as to the amount of capital the FSA considers it should hold if it considers the firm’s own assessment is too low. If the firm does not meet this level of capital, the FSA is able to restrict the amount of business the firm writes, or take other regulatory action. In addition firms are required to report the result of a risk based capital calculation (an Enhanced Capital Requirement or 'ECR') with percentages applied to premiums, claims, and assets, with the percentages depending on the line of business, and generally expected to be able to justify where their own capital assessment differs from the ECR.
Lloyd’s is also subject to the capital assessment framework described in the previous paragraph. For Lloyd’s, the same principles apply, but the nature of this unique market means that there are differences in application. Each member has to hold a level of capital as assessed by Lloyd’s annually. Each managing agent is required to assess, for each of the syndicates, the amount of capital required to support the risks that the syndicate is exposed to. Lloyd’s centrally is required by the FSA to scrutinize each syndicate ICA and to satisfy the FSA that the Lloyd’s review process is robust and may be relied on. As part of the review, Lloyd’s actuaries assess and review the modelling methodology and assumptions. FSA is kept informed of Lloyd’s conclusions for each syndicate ICA and FSA actuarial teams perform sample check reviews of syndicate ICAs.
The syndicate ICA as agreed and where appropriately increased by Lloyd’s, is then used to calculate the regulatory capital requirement for each member. Each member has to hold a level of capital in excess of the regulatory requirement as assessed by Lloyd’s annually. The level of capital is subject to the EC minimum and regulatory review. United States In the US individual States require reinsurers to maintain a minimum level of capital and surplus in order to establish and continue operations. In addition, the NAIC has adopted a risk-based capital approach, which applies to both direct insurers and reinsurers, and requires a risk-based capital ratio of not less than 200%. Financial solvency is also monitored through the use of financial profile reports, prioritisation tools and financial analysis. Separate risk-based capital formulae exist for life (re)insurers, property/casualty (re)insurers and health (re)insurers, using a four-tier system to indicate the severity of any capital deficiency. These formulae include components to assess risks related to reinsurance. Where the risk-based capital requirement is lower than a State’s minimum capital requirement, the higher figure is required.

Appendix V
Page 70 of 100 IAIS Global Reinsurance Market Report 2004 December 2005
Summary of regulatory reporting and current level of disclosure by reinsurers in participating jurisdictions A study was carried out, originally by Task Force Re and now updated, to look at the public disclosures of a sample of groups including significant reinsurance operations, covering the jurisdiction represented within the global reinsurance market statistics. Reference was made to publicly available consolidated financial statements and website information. This has been supplemented by further information from national supervisors within participating jurisdictions, including comments relating to regulation of reinsurers generally as well as specifically to disclosure. It may be noted that EU listed groups will need to prepare consolidated financial statements in accordance with International Financial Reporting Standards with effect from 1 January 2005. Bermuda In Bermuda, the most significant professional reinsurance business is undertaken by companies falling into the Class 4 category. Under the Insurance Act, every Class 4 insurer is required to file annually a statutory financial return and statutory financial statements within four months of the insurer’s financial year end. Penalty fines may be incurred if filings are not made as required. The statutory financial return includes: • Audit opinion from an auditor approved by the Supervisor, stating that the auditor carried
out a proper examination of the insurer’s statutory financial statements, and that the examination was conducted in accordance with an accepted auditing standard;
• Cover sheet describing the types of business conducted, whether it is written on a direct/reinsurance basis, premium by related/unrelated categories, description of stop loss reinsurance cover, and whether loss reserves are discounted;
• A declaration of statutory ratios, which includes a premium to statutory capital and surplus ratio, a five-year operating ratio, and a change in statutory capital and surplus ratio;
• A Loss Reserve Specialist Opinion from a fully qualified actuary in respect to the insurer’s loss and loss expense provisions;
• Schedule of Ceded Reinsurance, a list of the reinsurers the company has contracts with, including their jurisdiction, rating, premium ceded, amounts owing to the reinsurer and a listing of aged recoverables owed from the reinsurer.
• Form 1 – Statutory Balance Sheet – general business, a prescribed line-by-line listing of all assets, liabilities and statutory capital & surplus;
• Form 2 – Statutory Statement of Income – general business, a prescribed line-by-line listing of all revenues and expenses;
• Form 8 – Statutory Statement of Capital and Surplus, a detailed breakdown of the amounts that make up the statutory capital and surplus;
• Notes to the Statutory Financial Statements.

Appendix V
IAIS Global Reinsurance Market Report 2004 Page 71 of 100 December 2005
The regulations do not require any of the information submitted to be made available to the public. However, most of the Class 4 companies licensed in Bermuda are publicly traded in the U.S. stock markets, and file extensive financial disclosure statements with the U.S. Securities Exchange Commission ('SEC'). The generally high level of financial security in Bermuda, coupled with very stringent solvency margin requirements for the Class 4 sector, has allowed most of the Class 4 companies to achieve A ratings from the internationally recognised rating agencies. All prepare audited financial statements and obtain A M Best’s, Standard & Poor’s, Moody's, and/or Fitch Ratings to which they submit extensive financial disclosure materials including both material quantitative and qualitative information. Reinsurers present consolidated financial statements (balance sheets, income statements, cash flow statements, and statements of changes in equity). In addition, SEC rules require the comprehensive disclosure regarding the use of financial instruments including their use of derivatives and other hedging activities. Further, the publicly traded companies are required to provide 'market risk' disclosures, both quantitative and qualitative about all financial instruments presented 'outside' the financial statements. Moreover, market analysts such as Goldman Sachs and Merrill Lynch review detailed financial data and provide extensive reports on company performance and forecast for the future. France The current supervisory framework for reinsurance and insurance companies in France is based on a single set of accounts that is used for both accounting and supervisory purposes. These accounts - balance sheet, profit and loss account and annex, including a detailed list of investments – are public documents. Firms usually provide financial statements (balance sheets, income statements, cash flow statements and the complete list of investments with their localisation, market and book value) with notes which provide details on their premiums, assets, investments, liabilities and debt. Some information is also provided in the annual report (technical result with premiums, claims, provisions and expenses by class of business, and also premiums and claims by region, information on risk management, business strategy corporate management and retrocession). Some firms also disclose information on their share capital, alternative risk transfer, derivative financial instruments and claims development triangle. All these documents are publicly available. Parent companies also have to publish consolidated financial statements with notes on their consolidation methods and list of consolidated entities. More detailed information is reported to the supervisor in the form of CCAMIP returns, referred as 'C reports' (annual) and 'T reports' (quarterly), which are not publicly available. The information provided by insurers and reinsurers in these returns includes: • C1 : detailed technical results by insurance category and sub-category
• C2 : liabilities and technical results by country
• C3 : reinsurance accepted and ceded (with a distinction between intra-group and external reinsurance)
• C4 : premiums per type of guarantees
• C5 : insurance liabilities and assets backing those liabilities (not for pure reinsurers)

Appendix V
Page 72 of 100 IAIS Global Reinsurance Market Report 2004 December 2005
• C6 : solvency margin : required margin and eligible equity components (not for pure reinsurers)
• C6 bis : projection of the solvency requirement of the society for the next 5 years (not for pure reinsurers)
• C8 : description of the reinsurance covers (not for pure reinsurers)
• C9 : detailed list of the reinsurers and stress testing of the reinsurance cover (not for pure reinsurers)
• C10-C11-C12 : loss development triangle by insurance category and sub-category (non-life)
• C20-C21 : detailed information per contract (life)
• T1 : information on activity (premium, number of contracts sold, amount and number of claims occurred)
• T2 : list of investment by class of assets (at book value and market value) ;
• T3 : stress testing analysis on assets and technical provisions
• A 'solvency report' where the society demonstrate its future solvency (where the society have to explain both their internal control and process to maintain their solvency but also the results of their balance sheet projection under different scenarios).
• A 'report on the investment politics'
• A 'report on reinsurance politics' (not applied to pure reinsurers)
Germany External Accounting
Reinsurers and insurers have to prepare external, which generally means publicly available, accounts in accordance with general rules and a specific regulation. These annual statements are based on the German accounting standard set out in the German Commercial Code and other regulations. These focus very much on the creditor, in particular the policyholder, rather than the investor. The principle of prudence has top priority. Within 10 months of the financial year end, reinsurers have to draw up their annual accounts as well as the status report80. This generally happens much earlier. These documents must be submitted to the supervisor as soon as they have been drawn up, i.e. before they are made public. The consolidated financial statements (balance sheet, income, cash flow, stockholder equity, comprehensive income, and retained earnings) include informative notes with details on reinsurers' assets, market value of investments, and liabilities; premiums, investment results and expenses. For the sample of reinsurers reviewed, companies offer information on their financial products business, including useful comments on their market, credit and liquidity risks, including ratings. Fair value of financial instruments is also available. According to the Corporate Sector Supervision and Transparency Act (KonTraG) reinsurers have to set up a risk management system which identifies potential risks. Companies have an obligation to disclose information about such risks and the structure of the system.
80 These consist of the balance sheet, the profit and loss account and the notes to the accounts.

Appendix V
IAIS Global Reinsurance Market Report 2004 Page 73 of 100 December 2005
Additionally all reinsurers have to meet the requirements of the German Accounting Standard 5-20. Reinsurers have to prepare a risk report under the rules of this standard. For the sample of reinsurers reviewed, disclosure includes details on the type, maturity, currency, and regional allocation of assets and investments. Information on provisions, debt (with some information on the characteristics of the instruments), and other liabilities is provided. Details on the class, claims, ratios, and regional allocation of premiums are available. General information on risk management, business strategy, affiliated and subsidiary companies and principal officers can also be found. Auditor's report
Reinsurers and insurers must have their annual accounts and the status report checked by an auditor. BaFin has to be informed before his appointment and before the audit takes place. The contents of audit reports are stipulated in the 'Regulation on Auditor's Reports' published by BaFin. Two copies of the audit report are to be sent to BaFin, together with the related comments of the managing and the supervisory boards. Finally, the auditor's report on the managing board's statement about the relations with affiliated companies also needs to be presented. Internal accounting
The term internal accounting refers to information an insurer has to submit to the supervisory authority only. The provisions applying to internal accounting are similar to the provisions for non life insurers. They were laid down in a regulation in 199581 and last amended in 2005. The changes are part of a continuous improvement process at the BaFin aiming at a reduced administration effort and further risk oriented supervision. For this purpose some statements were omitted (compare the Global Reinsurance Market Report 2003) and some newly introduced (see below). The present provisions require all reinsurers to submit the documents mentioned below, which are required in a prescribed format. The documents which insurers have to put forward provide not only a more detailed break-down of the external accounts; they also allow a closer look into the reinsurer's business. The following documents are to be submitted: • balance sheet (statement 100)
• profit and loss account (statement 200) - (excerpts for the technical account)
− for the entire insurance business
− for the entire reinsurance business accepted by domestic ceding insurers
− for the entire reinsurance business accepted by foreign ceding insurers
− for each class of insurance – (very detailed split)
• development of investments (statements 101)
• income from and expenses for investments (statement 201)
• Statement 203 (newly introduced) additional information with respect to reinsurance, including details about individual technical profits and losses relating to the accepted
81 Accounting in accordance with the ordinance concerning the reporting by insurance undertakings to the Federal Insurance Supervisory Office.

Appendix V
Page 74 of 100 IAIS Global Reinsurance Market Report 2004 December 2005
reinsurance business (former statement 250). And information on inward and outward reinsurance business, by every direct insurer and reinsurer dealt with (former sample 1).
• Statement 251 (newly introduced) information about covering technical provisions.
• Statement 252 (newly introduced) information about the insurance business and the contracts, and in particular details about technical claims provisions.
• Statement 604 (newly introduced) quarterly information about the technical reinsurance business.
• Statement 671 (newly introduced) every six months information about technical provisions and details about the assets of reinsurers.
• Statement 688 (newly introduced) forecasting with a yearly cut-off date (30.06.) the respective development of the following six months.
Finally, reinsurers also have to supply informal statements such as an outline of the methods they use for setting up the provision for claims outstanding. If applicable the Reinsurer has to present the consolidated annual report, which may be prepared on the basis of either IAS or US GAAP, including an auditor's report. The reinsurer is subject to the rules applicable to group supervision, if a primary insurer is involved also. In addition to information delivered on a regular basis, the supervisor may request from the reinsurer any other information it requires. Japan Insurance companies in Japan, including reinsurance companies, are subject to the disclosure requirements of the Insurance Business Law and relevant Enforcement Regulations. The industry association sets out further standards on disclosure. These result in highly comprehensive and standardised disclosures by Japanese insurers, including reinsurers. In addition to the primary consolidated financial statements (balance sheets, income statements, cash flow statements, statement of retained earnings), companies disclose general information on business strategy, organisational structure, senior management and shareholders, as well as detailed information on investment activities, insurance activities, risk and solvency. Information on investment activities includes, for example, asset management policy (qualitative), investment by class of asset, return on investment by class of asset, information on maturity (for securities and loans), information on debtors (for loans) etc. Information on insurance activities includes, for example, details, by line of business, on policy liabilities, premiums, claims paid, insured amounts, underwriting profit, etc. Also disclosed is information on derivatives such as the policy on the use of derivatives (qualitative) and notional and market values of derivatives by type of transactions. Information on risk includes a description on the risk management system and risk management policy. As for quantitative information, ‘insurance risk’, ‘assumed interest risk’ and ‘asset management risk’ are calculated and disclosed based on a formula set by the Financial Services Agency. The overall risk based capital adequacy ratio (solvency margin ratio) is also disclosed.

Appendix V
IAIS Global Reinsurance Market Report 2004 Page 75 of 100 December 2005
Details of the reports insurance companies are required to submit in connection with their financial results are included in 'Financial statements' and 'Business reports' as well as 'Periodical monitoring' requirements. 1) Financial statement (required half yearly), which includes: • Overview of business result (summarised business result, ratios related to company
management, statement of profits / losses, statements of assets, liabilities and capital)
• Balance of major accounts (state of securities, etc., insurance policy reserve, claims provisions, liability reserve), requiring a detailed breakdown by type of security or by class of business line
• Business expenses (including claims expenses), requiring a detailed breakdown by type of expense
• Business result (business result of primary insurance, number of business contracts, amount of claims payment by class of business line, net business result, direct net premiums, direct net claims paid by class of business line)
• Schedule of asset management (situation of asset management, proportion of assets invested with the same insurance company)
• State of risk-monitored loans (schedule required)
• Conditions of solvency adequacy for claims payment - Solvency Margin Ratio (Calculation of amount by type of risk is required).
• State of transaction with major shareholders
2) Business report (required annually), which includes: • Overview of business situation and result*
• Indicators showing business result* *A detailed breakdown or information for the above items are required.
• Shareholders’ meetings, etc. (report on shareholders’ meetings, dividend and surplus distribution, other matters to be reported)
• Balance sheets
• Profit-loss statements
• Statement of cash flows
• Report on fund depreciation
• Report on payment of fund interest
• Report on profit appropriation
• Report on loss disposition
• State of securities (securities held for trading purposes, securities held for other purposes)
• Conditions of solvency adequacy for claims payment (Solvency Margin Ratio)
3) Periodical monitoring (required: (A) Monthly (B) Quarterly (C) Half yearly (D) Yearly), including:
Appendix V
Page 76 of 100 IAIS Global Reinsurance Market Report 2004 December 2005
• Current situation of insurance business (balance of insurance business (B), state related to the third-sector business (B), state related to new business by way of subscription (B))
• Liquidity risk (liquidity index (A), liquidity reserve (B))
• Market risk (state of securities by purpose of holding (B), risk analysis table by category (B), state of derivative transaction (B), index related to securities retained (B), interest rate risk related to reserved account (B), equity holding state by type of industry (C), list of top 20 shareholding balance in Japan (C))
• Credit risk (basic information by rating (C), list of top 20 loaned companies (C), state of assets for largely-loaned companies (C))
• Others (situation of invested assets (B), balance sheet by asset remaining period (C))
Switzerland Swiss reinsurers publish balance sheets, income statements, shareholders’ equity statements, and cash flow statements with informative notes to them. The consolidated information is complemented with information on business segments. These notes include information on investments (type of instrument, country, currency and maturity), derivative financial instruments (interest rate contracts, equity and index contracts, foreign currency and other instruments), acquisitions and dispositions, and debt in some detail. Premiums are detailed by geographic allocation and line of business. Additional information on subsidiaries and equity investments is also available. General notes on the firms’ risk management and business strategy complement the quantitative information. United Kingdom Insurers and reinsurers are both regulated by the Financial Services Authority (FSA) in the UK. Lloyd's is subject to the same requirements. For regulatory reporting purposes, no distinction is drawn between an insurer and a reinsurer. The FSA requires UK authorised insurers and reinsurers to complete and submit an audited return on an annual basis (the FSA return). The return comprises, among other things, the revenue account, profit and loss account and balance sheet at the end of the year together with the annexed notes, statements, reports and certificates and it must be audited. The regulatory return must be submitted to the FSA within 2 months, 15 days of the year end or if submitting electronically (on FSA Approved software) within 3 months. The FSA return comprises a number of standard forms which must be completed.82 Forms 9 to 17 report the detailed assets and liabilities (including derivatives) and profit and loss figures and compare these with solvency requirements. The general business revenue (forms 20 to 39) largely comprise analyses of premiums and claims by class of insurance business. There are eleven accounting classes, broken down into eight classes for direct and facultative business and three classes for treaty reinsurance.
82 Forms 1 to 8 are no longer in use.
Appendix V
IAIS Global Reinsurance Market Report 2004 Page 77 of 100 December 2005
Accident year accounting is the normal basis of accounting for these forms. However the underwriting year accounting basis is also permitted and where this is adopted, a supplementary note must be included in respect of each accounting class, stating: (a) the reason for accounting for such business on an underwriting year basis;
(b) the basis for distinguishing between such business and any other business falling within the same class accounted for on an accident year basis;
(c) the accounting policy adopted for determining the provision for claims outstanding; and
(d) if the information provided in (a) to (c) differs in respect of risks incepted in the financial year in question from risks of a similar description incepted in previous financial years, the reason for the difference.
Information given for each accounting class is also further subdivided as follows: (a) direct and facultative business is broken down by risk group within each country or
reported on a reconciliation basis;
(b) treaty reinsurance business is broken down into business categories.
This information included in the revenue forms above is to allow the FSA to analyse, compare and monitor the performance by class of business and to assess the adequacy of claims provisions by comparing actual claims movements with technical provisions. Companies writing long-term insurance business are required to complete forms 40 to 45, which give fuller details supporting the revenue forms and forms 46 to 61 give details supporting the valuation report by the appointed actuary. The following details must also be provided:
1. additional information on general insurance business reinsurance ceded;
2. statements of major treaty reinsurers and cedants and facultative reinsurers (general insurers);
3. statement of additional information on derivative contracts
4. statement of information on controllers (UK insurers only)
5. statement of information about the appointed actuary (life insurers)
6. supplementary notes to the return to amplify the information given on the forms; and
7. the certificates and auditors’ report required by the regulations.
Companies in the UK generally adopt UK GAAP which requires a significant amount of disclosure (detailed in Schedule 9a to the Companies Act 1985) and comply with applicable accounting standards, the ABI SORP as well as the Combined Code on Corporate Governance. In addition to the substantial information publicly available in the FSA returns, a considerable amount of information is also provided in the annual report (such as the segmental analysis usually provides an analysis of premiums, claims and expenses by region and major class of business). Lloyd's syndicates also report under UK GAAP. Information on assets and investments is normally summarised in the CEO’s report, and details of the type of assets, their currency and investment returns are provided in the notes to the accounts. Information on risk the management framework and the management of key risk areas is included in the Statement of Corporate Governance.

Appendix V
Page 78 of 100 IAIS Global Reinsurance Market Report 2004 December 2005
United States In the United States, from a regulatory standpoint, reinsurers are subject to the same regulatory template as employed for direct writing insurers. That means that they are required to disclose the same level of extensive information as direct writers and that information is completely available to the public.83 Moreover, the information is uniform notwithstanding the state-by-state regulatory system because of the use of a uniform annual statement template, uniform instructions therefor and uniform accounting standards. The statement templates and instructions are specific to property and casualty insurance, life insurance, and health insurance. The disclosures include a balance sheet, income statement, statement of cash flows, underwriting schedules showing direct, assumed and ceded premiums, losses and loss adjustment expenses by line of business (about 30 lines of business are included). Many of the financial schedules also include subtotals for affiliated/non-affiliated, authorised/unauthorised and pooling arrangements. Investments schedules detailing each investment held as of a reporting date by type of investment (i.e., real estate, mortgage loans, bonds, preferred stocks, common stocks, other invested assets and derivative type investments with approximately 30 data items per investment, including statutory values and fair values), historical paid and incurred loss and loss expense development experience by line of business including reserve performance and detailed reinsurance information showing the source of all assumed premiums and the destination of all transferred business through cessions (facultative and treaty). In addition, the disclosures require answers to numerous regulatory questions and detailed and formatted footnote disclosures. The statements disclose all investment activity in the interim of reporting periods and those interims are quarterly. Profit and loss per investment transactions are readily discernible. Additionally, companies are required to file statements prepared by independent certified public accountants that disclose differences between their findings and those presented by companies in their filed statements. Also, companies are required to file, in the case of life companies, actuarial opinions and memoranda, and in the case of property/casualty insurers, loss reserve opinions, from qualified actuaries. The independent certified accountants' reports and the actuarial opinions are publicly available. Publicly traded companies are also required to file additional information of the type noted above with the securities regulators. This information is also publicly available. The regulatory system in the United States also provides that all material holding company transactions require filing prior to engagement. Some of those transactions above a relatively modest threshold actually require prior approval. Such transactions are disclosed to the public in the filed statutory statements. Mergers, acquisitions, changes in domicile, changes in form of an entity, changes in control, etc. all require prior regulatory approval. Sales of blocks of business require prior approval and appropriate disclosures. Dividends to stockholders are limited.
83 See the NAIC website at http://www.naic.org/insprod.

Appendix VI
IAIS Global Reinsurance Market Report 2004 Page 79 of 100 December 2005
Financial or regulatory reporting – summary of major differences to US GAAP in participating jurisdictions The items below are the identified areas, in the financial statements (in respect of US entities the regulatory returns) of reporting reinsurers, where a material difference between national GAAP and US GAAP could arise: Bermuda - Reports in US GAAP France (French GAAP)
• Investments (carried at historical cost or amortised cost) • Impairment provisions (valuation allowances) may be reversed if market conditions
improve • Realised gains/losses on fixed maturities sold before maturity are taken to capitalisation
reserve • Embedded derivatives are not recognised • Treasury shares included as an asset • No deposit accounting (no concept of financial reinsurance) • Cost of reinsurance recorded in year in which reinsurance arrangement placed • DAC (life) – significant difference in definition • DAC (non-life) – acquisition costs are deferred (rather than may be deferred);
commission on reinsurance ceded not credited to DAC • Provision for premium deficiency – based on historical benefits / losses; DAC is not offset • Equalisation reserves • Universal life/investment contracts – total premiums recorded as revenue • Non-life technical/claims provisions (more prudent and not discounted) • Life technical provisions (prudent tables and rate of discount) Japan (J-GAAP)
• Contingency reserves (including ‘catastrophe’ and ‘price fluctuation’ reserves) • DAC • IBNR (Minimal impact) Germany (German GAAP - HGB)
• Financial assets (largely at market value under US GAAP) • Premium income (for life products only premiums related to risk transfer treated as
premiums under US GAAP) • Provision for premium refunds (higher under HGB) • Equalisation reserve (under HGB) • Technical/claims provisions (more prudent under HGB) • Acquisition costs (capitalised and amortised under US GAAP) • Depreciation and valuation write-downs (not applied to temporary diminutions under US
GAAP) • Equity accounting for interests in associates under US GAAP (dividend distributions only
under HGB)

Appendix VI
Page 80 of 100 IAIS Global Reinsurance Market Report 2004 December 2005
• Goodwill (written off direct to reserves under HGB) Switzerland (Swiss GAAP)
• Equalisation reserves allowed under CH GAAP • Fixed income securities available-for-sale may be measured at amortised cost for CH
GAAP • Goodwill may be amortised under CH GAAP • Reversal of impairment charges allowed under CH GAAP under certain conditions United Kingdom (UK GAAP)
• Substantially the same as US GAAP • Loss reserves are not discounted, as they are under US GAAP • Catastrophe reserves held as additional provision (for Lloyd's these are held at global
level) United States (US SAP)
Non-admitted assets: • Fixtures and fittings • Computer hardware and software(> 3% capital and surplus) • Intangibles generally • Goodwill > 10% capital and surplus • DAC (expensed as incurred) • Premiums/agents’ balances outstanding for more than 90 days • Deferred tax assets > 10% capital and surplus • Investments > statutory maximum holdings • Prepaid expenses Liabilities: • No discounting of loss reserves (exception for WCI) • Provision for uncollectible reinsurance (per prescribed calculation) • Dividends may be recorded earlier under GAAP than SAP • Asset valuation reserves (against credit related investment losses) • Interest maintenance reserve (deferral of realised gains/losses over remaining life of
investments) Reinsurance recoverables: • Amounts relating to unpaid losses are offset against loss liabilities instead of being
included as an asset.

Appendix VII
IAIS Global Reinsurance Market Report 2004 Page 81 of 100 December 2005
Summary of regulatory requirements on stress testing in participating jurisdictions Bermuda The Bermuda Monetary Authority has issued guidance on risk management that requires insurers to: a. implement and maintain sound and prudent risk management policies and systems, and
have integrated policies that, taken together, apply to the insurer’s significant activities regarding the corporate philosophy on risk management, the insurer’s permissible exposure to risk, objectives of risk management, delegation of authorities and responsibilities, and processes for identifying, monitoring and controlling/managing risk;
b. identify all material risks, financial and non-financial, that they face, assess their potential impact and have policies in place to manage them effectively;
c. establish an appropriate tolerance level or risk limit for material sources of risk; and
d. regularly review the market environment in which they operate, draw appropriate conclusions as to the risks posed and take appropriate actions to manage adverse impacts of the environment on the insurer’s business.
Class 4 companies in Bermuda conduct stress testing on various aspects of their business, including on the underwriting and investment cycles. As many of these companies deal with catastrophe reinsurance, catastrophe modelling is a key component for the pricing of property policies. Models are usually developed so that the company can monitor both its overall exposure to certain types of events (windstorms, floods, etc.) and to monitor its overall exposure in a given geographic area. Companies conduct scenario testing to calculate the impact on loss reserves and capital under a series of hypothetical disasters, in order to gauge the impact of such scenarios on their various lines of business. Companies also conduct stress tests on assets such as investments to determine how fluctuations in interest rates or market conditions could affect the Company’s assets. In addition, Class 4 companies submit information to analysts and rating agencies such as AM Best and Standard & Poor's. These agencies also conduct stress testing or the company/group’s capital as part of their assessment of a company. France All French insurers and reinsurers are asked to send to the CCAMIP the following non-public information: • on a quarterly basis, quantitative results on quite rudimentary stress testing performed on
both assets and technical provisions (sensitivity analysis);
• on an annual basis, detailed quantitative results on stress testing performed on the reinsurance cover of the society;
• on an annual basis, detailed quantitative results and qualitative information on stress testing performed on the global financial situation of the society.
During on-site inspections, supervisors assess the quality and adequacy of the models, assumptions and scenarios used in stress testing.

Appendix VII
Page 82 of 100 IAIS Global Reinsurance Market Report 2004 December 2005
Germany The Federal Financial Supervisory Authority (BaFin), Germany, is experienced in inducing and conducting stress tests at different companies and sectors. The aim of these stress tests is an early identification of potential vulnerabilities. Stress tests are one of several early warning indicators in the context of insurance supervision in Germany. BaFin stress tests include both qualitative and quantitative elements. The growing importance of qualitative elements is due to increased requirements concerning the management of assets. A negative stress test result would not automatically imply a concrete danger for the financial obligations of the tested insurance company. Such BaFin stress tests typically provide information about the risk-carrying-capacity of an insurance company. Among the factors which determine the risk-carrying-capacity of an insurance company are, for example, hidden reserves with respect to assets and equity capital. A higher risk-carrying-capacity allows the utilisation of riskier investments. Stress tests induced by German insurance supervisors also review whether an insurance company would be able to cover its liabilities during a lasting capital market crisis – without implementing countermeasures. Different rules oblige reinsurers in Germany to disclose potential major risks. First of all, reinsurance companies provide financial statements, including detailed information on their assets. Reinsurers' risk management systems have to meet demands of the Corporate Sector Supervision and Transparency Act (KonTraG) in identifying potential risks. Companies have to disclose the structure of their risk management system and information about identified potential risks. In addition to that, reinsurance companies have to prepare a substantial risk report under the rules of the German Accounting Standard 5-20, in which scenario and sensitivity tests as well as stress tests are required. German insurance supervisors have always been observing the excellent financial strength of reinsurers. In a recent84 revision of the insurance supervision law (Gesetz über die Beaufsichtigung der Versicherungsunternehmen [Versicherungsaufsichtsgesetz – VAG]) the legal base of reinsurance supervision in Germany has been extended. The respective BaFin circular with respect to insurance undertakings (Rundschreiben 6/2005) clarifies the execution of stress test with respect to reinsurers. This circular clarifies that reinsurance companies have to carry out a quarterly stress test with respect to their fixed reserves.85 BaFin receives and reviews these internal stress test results either on demand or during on-site inspections. Additionally, BaFin has the power to request all relevant information, including stress tests etc., in order to ensure that reinsurers maintain sufficient risk management. Japan Regular reporting requirements
As supervisory requirements on stress testing related to market risk including interest rate risk, foreign exchange risk, and stock price risk, the FSA requires insurance companies to regularly submit information concerning changes in the present market value of the invested assets under assumptions related to the underlying assets. The bases for these
84 21 December 2004
85 Compare also: Circular letter (Rundschreiben) 29/2002.

Appendix VII
IAIS Global Reinsurance Market Report 2004 Page 83 of 100 December 2005
assumptions, such as BPV for interest rate risk, percentage of currency fluctuation for foreign exchange risk, TOPIX for stock price risk, used by each insurance company in its own internal management shall be applied for the estimation of the present market value. Through the on-site inspection
The FSA carries out on-site inspection of insurance companies and examines if their risk management could execute appropriate analysis of risk and use of analytical results. Through the inspection, the FSA notifies that it is desirable for insurance companies to regularly perform stress testing and use the result in their risk management division. Disclosure requirements
The FSA announced the Comprehensive Guideline for Supervision that could impose upon insurance companies the disclosure of the outline of their own stress testing management and how to use the result. This has been enforced from the fiscal year 2005. Switzerland Legislation currently in force does not specifically require Swiss reinsurers to conduct and report the results and methodology of stress tests. Nonetheless, pursuant to Art. 10 of the Insurance Supervision Law (1978, as per 2003) the reinsurers must provide sufficient guarantees in particular as regards their solvency, business set up and business conduct. Under the present regulatory practice Swiss reinsurers' capital requirements are expected to amount to at least 20% of net premiums earned, but no less than CHF 10 million. Furthermore, advanced stress tests and methodology have long been used by Swiss reinsurers in the routine management of their prudential and financial positions, thus underpinning their regulatory reporting. The new Insurance Supervision Law and Regulations, expected to be in force in 2006, incorporate the Swiss Solvency Test for insurers and reinsurers. They substantiate regulator-defined stress-tests, regulator-defined scenarios, as well as entity-defined scenarios, in the determination of target capital. They provide for the issuance by the Swiss supervisor of directives for the determination by reinsurers of their target capital, including using stress-tests and scenarios. They mandate the ensuing certified reporting of all relevant information by reinsurers. United Kingdom The Financial Services Authority ('FSA') requires all insurers and reinsurers to comply with the Integrated Prudential sourcebook (http://fsahandbook.info/FSA/html/handbook/PRU). Under the FSA's rules, a firm must maintain adequate financial resources. In order to assess the adequacy of such resources, the firm must identify and assess risks to its ability to meet its liabilities as they fall due, including the major sources of risk in each of the following categories:
• credit risk; • market risk; • liquidity risk; • operational risk; • insurance risk; and • group risk
The firm must carry out stress tests and scenario analyses that are appropriate to the nature of each of the major sources of risk. The firm must take reasonable steps to identify an

Appendix VII
Page 84 of 100 IAIS Global Reinsurance Market Report 2004 December 2005
appropriate range of realistic adverse circumstances and events in which the risk identified crystallises, and estimate the financial resources the firm would need in each of the circumstances and events considered in order to be able to meet its liabilities as they fall due. The FSA indicates that such work should be carried out at least annually or more frequently if appropriate. Regulated firms are also required to undertake an Individual Capital Assessment ('ICA'). Through this process and the firm's ICA submission to the FSA, firms will set out the work it has completed on stress testing, or modelling work which encompasses the stressed risks. PRU provides a significant level of detailed guidance as to the factors to be considered when assessing each of the types of risk listed above. Over 70 examples of risks to be considered are given, and in addition a practical illustration of how a small firm might undertake the analysis is provided. Through these requirements, the FSA has introduced a very comprehensive framework which ensures its regulated entities undertake stress testing within a world leading capital assessment process. United States Risk-based capital is a method of measuring a minimum amount of capital appropriate for a company to support its overall business operations in consideration of its size and risk profile. The Risk-based capital analysis begins with reported financial data based upon the accounting requirements that apply to the insurer. A company's risk-based capital is calculated by applying factors to various asset, premium, claim, expense and reserve items. The factor is higher for those items with greater underlying risk and lower for less risky items. The adequacy of a company's actual capital can then be measured by a comparison to its risk-based capital as determined by the formula. Risk-based capital standards will be used by regulators to set in motion appropriate regulatory actions for insurers that show indications of weak or deteriorating conditions. It also provides an additional standard for minimum capital requirements that companies should meet to avoid being placed in rehabilitation or liquidation. The formulaic method has been modified recently for certain products to require scenario testing using a principles-based approach. Within this new approach there is modelling of a significant number of scenarios (approximately 1,000) that test changes to the market environment, such as changes to interest rates and equity returns, that is used to calculate the capital requirement. In addition to the capital requirements, insurers are required to establish the position of 'Appointed Actuary' who is responsible for expressing an actuarial opinion concerning the reserves and related liabilities on each company's books. For life insurance the responsibilities of this position are codified in the NAIC model 'Actuarial Opinion and Memorandum Regulation'. This regulation requires the actuary to include in the actuarial opinion several statements including: "The reserves and related items, when considered in light of the assets held by the company with respect to such reserves and related actuarial items including, but not limited to, the investment earnings on the assets, and the considerations anticipated to be received and retained under the policies and contracts, make adequate provision, according to presently accepted actuarial standards of practice, for the anticipated cash flows required by the contractual obligations and related expenses of the company". It is likely that the appointed actuary will need to consider multiple scenarios regarding economic environment and policyholder behaviour in order to make that statement. The actuarial profession has developed Actuarial Standard of Practice 22 (ASOP 22) to provide guidance to the actuary in complying with this regulation. For property/casualty insurance, the actuary must similarly opine on whether the identified liabilities make a

Appendix VII
IAIS Global Reinsurance Market Report 2004 Page 85 of 100 December 2005
reasonable provision for all unpaid loss and loss expense obligations of the Company under the terms of its contracts and agreements. To be considered reasonable, the stated reserve amount would need to be within the actuary's range of reasonable reserve estimates. The actuary also must provide relevant comments that would include whether or not there is a risk of material adverse deviation in the reserves. The actuary should explicitly state whether or not he or she reasonably believes that there are significant risks and uncertainties that could result in material adverse deviation. If such risk exists, the actuary should include an explanatory paragraph to describe the major factors, combination of factors, or particular conditions underlying the risks and uncertainties that the actuary reasonably believes could result in material adverse deviation.
Appendix VIII
Page 86 of 100 IAIS Global Reinsurance Market Report 2004 December 2005
Examples of stress testing practices The following examples of industry stress testing practices have been supplied, for additional information on current practice. The examples are listed in alphabetical order by jurisdiction and then by organisation. Bermuda Stress testing practices of a Bermuda domiciled reinsurer Outlined below are our stress and scenario tests for insurance risk. These tests are conducted to estimate the capital required to support our business plan. We employ a stochastic model to separately model (a) unearned risk, (b) underwriting risk, and (c) reserving risk at a granular level. The underwriting and unearned risk are further broken down into attritional losses, large losses and threat losses. Dependencies between classes of business and different risk elements are captured using a correlation matrix. For the purpose of our modelling we select and set key parameters and assumptions, which include but are not limited to:
- Large Individual Risk Losses - Large Catastrophe Losses - Potential for Adverse Loss Experience - Non-Claims Related Costs and Expenses - Direct Exposure to Reserve Deterioration - Indirect Exposure to Reserve Deterioration - Non Matching Reinsurance - Over Reliance on Reinsurance - Potential for Reinsurance Exhaustion - Post Loss impact on Reinsurance - Past Reinsurance / the Reinsurance Asset
Our modelling designs recognise the fact that some of the elements of insurance risk may not be modelled or may be modelled only partially. For that element of insurance risk that is not modelled, risk-based capital is estimated using a number of stress and scenario tests. These tests are carried out in respect of selected key risk events that are identified by our risk management team from the universe of key risks to which our business might be exposed. In this regard, as a best practice, our risk management applies the guidance provided by the UK Financial Services Authority on a groupwide basis although Bermuda companies are not required to comply with the FSA guidance. Some of the stress and scenario tests identified and used to quantify the non-modelled element of insurance risk are set out in the table below:

Appendix VIII
IAIS Global Reinsurance Market Report 2004 Page 87 of 100 December 2005
Risk Event Scenario Test Impact
cost $ Residual Risk Probability
Proportion Already Modelled
ICA Amount $
Non standard wording
Inappropriate underwriting Materially flawed
pricing
Coverage dispute Reinsurance purchase Programme not
fully placed
Exposure management
Inappropriate PML methodology
Germany - Extract: Hannover Re Annual Report 2004 Risk report Our business consists of the systematic acceptance of underwriting risks. In our understanding, the concept of risk has both positive and negative connotations (opportunities and dangers). We assume our business partners' risks on the basis of advanced methods and procedures, although only if the associated opportunities promise a commensurate increase in the value of the company. A professional set of tools for the appropriate controlling of risk acceptances is therefore indispensable for our company. Organisation of risk management Risk management at Hannover Re is characterised by central process coordination and local risk responsibility in the various areas of business:
• Local staff bear primary responsibility for the monitoring of risks and risk-policy measures within their specific areas.
• Local risk controllers are charged – on the level of specific business groups – with aggregating and controlling individual risks and, where necessary, initiating appropriate risk-minimisation measures.
• Centralised risk controlling steers the entire process and describes the risk situation of the entire company across all business groups.
Our internal risk reporting consists primarily of standard and ad hoc reports that are made available to decision-makers within a central risk information system on a periodic basis or, where necessary, immediately. Constant monitoring of mission-critical factors ensures early detection of undesirable developments and facilitates implementation of appropriate countermeasures. In addition, an annual risk inventory, in which all risks or risk groups that could potentially jeopardise the company's survival are thoroughly analysed and quantified, ensures that the risk portfolio is up-to-date. Regular process-independent controlling of the entire risk management system ensures that developments which could threaten the company's continued existence are detected at an early stage. We have categorised Hannover Re's risks as follows:
• global risks, • strategic risks, • operating risks, which we subdivide into
- technical risks,

Appendix VIII
Page 88 of 100 IAIS Global Reinsurance Market Report 2004 December 2005
- investment risks and - operational risks.
Global risks Global risks derive, inter alia, from:
• developments in legislation and court practice, • including questions of liability, • political and social changes, • environmental changes.
Risks of this type can be reduced only to a limited extent, nor can they necessarily be avoided because they are beyond our direct sphere of influence. Our risk management measures must therefore ensure that unfavourable developments, in particular, are identified as early as possible and appropriate actions taken. We counter these potential risks, inter alia, by means of the following measures:
• Diversification of our portfolio into four largely autonomous business groups. In this way we reduce the capital adequacy otherwise required in property and casualty reinsurance by altogether around 50%. At the same time we achieve optimal risk spreading.
• Constant monitoring of claims trends (e.g. electromagnetic fields, toxic mould, silica, biotechnology, pharmaceutical risks as well as analyses of claims and major losses). Our underwriting policy is regularly adjusted on the basis of these analyses, e.g. through the use of appropriate contractual exclusions or through technical and geographical diversification of the portfolio.
• Analysis of the findings of worldwide scientific research studies into possible changes in the risk situation associated with natural catastrophes (e.g. storm frequencies and intensities due to climate change) and their implications for potential losses. To this end we use recognised simulation models and also employ our own scientists, who control the quality of licensed models and develop our own tools. The most significant events for Hannover Re in the year under review were the hurricanes 'Charley', 'Frances', 'Ivan' and 'Jeanne' (Caribbean and USA) as well as typhoon 'Songda' (Japan).
• Tracking of relevant trends in court practice around the world (anti-trust and regulatory law, liability issues, corporate compliance) and changes in relevant accounting standards(US GAAP/IFRS) by specialised service units within Hannover Re.
************************************************
Germany - Extract: Munich Re Annual Report 2004 / Megacities - Megarisks Risk report Recent years have shown that the Munich Re Group’s risk landscape can change quickly and unexpectedly owing to a wide range of events or influences. We are constantly refining the tools with which we monitor and manage risks, so that in our view they have now reached a high degree of maturity. We are in a position to assess risk situations appropriately, despite the greatly increased pace of change. The growing complexity and dynamism of the environment in which we operate means that there are natural limits, however. There cannot and never will be absolute security when it comes to identifying risks at an early stage, measuring them sufficiently or correctly estimating their real hazard potential. Following a short description of the functions, organisation and important tools of risk monitoring and risk control – based on German Accounting Standard DRS 5–20 – we focus in this report on the main risks and important risk management measures. At the end of the report, we evaluate the risk position of the Munich Re Group as a whole.
Appendix VIII
IAIS Global Reinsurance Market Report 2004 Page 89 of 100 December 2005
Functions, organisation and important tools of risk monitoring and control We adopt a holistic approach, solidly based on our internal risk model. The main objective is to analyse, regulate and control the interdependencies between risks on the asset and liability sides, and strategic and operational risks. This means considering endogenic and exogenic economic parameters as well as the requirements and expectations of our clients, our shareholders, the supervisory authorities and the rating agencies. Responsibility for holistically analysing, regulating and controlling the risks on the asset and liability sides in the Munich Re Group is located centrally with Integrated Risk Management. Here, we have combined important instruments such as asset-liability management, active capital management and capital modelling. We gear our business portfolios to the requirements set by management, allocating risk capital on the basis of our internally developed risk model and the risk and return expectations derived from it. Thus, for example, mismatch risks between assets and liabilities are significantly diminished by means of appropriate investment and hedging strategies, reducing the risk capital required and improving capital productivity. In day-to-day business, responsibility for systematically handling individual risks in insurance and reinsurance lies with executives in their function as risk managers. They identify, analyse, monitor and manage the risks on an ongoing basis with support from the risk controllers. Processes, tools and systems – including appropriate controls – are in place throughout the Group to measure and assess the risks as far as possible and to identify, avert and protect against potential hazards. The basis for the permanent and systematic handling of risks is formed by management requirements and decisions on risk tolerance, which are derived from the Group’s risk strategy and risk policy and are geared to capitalisation and liquidity. This process includes examining what claims burdens can be borne or are still tolerable. We also use simulations of pre-defined catastrophe scenarios to ensure that events whose occurrence appears less probable are also considered in our planning and decisions. Central Risk Controlling coordinates regular risk assessments. Besides a standardised risk survey among the risk managers, relevant risks and risk fields are looked at in more depth with the respective experts and are evaluated in workshops together with the insurance and reinsurance risk controllers responsible in order to assess the risk situation holistically. The risk assessments have different focal points. In the annual risk assessment, the inventory and comprehensive analysis of risks are to the fore. The business-plan risk assessment, on the other hand, concentrates on comparing the results from the risk assessment process with the contents of the operative strategic planning; we ensure that each risk identified as significant is matched by an adequate risk-reducing measure. Ad-hoc risk assessments are triggered by risks or hazards that suddenly emerge. Central Risk Controlling sets standards and develops the systems further; the decentralised risk controllers in the units throughout the Group adjust these to the current situation where necessary. Risk management and risk controlling are functionally separate. The related functions and responsibilities of all participants, such as the Board of Management, risk managers, decentralised risk controllers and central risk controllers, are clearly defined. Central Risk Controlling is also responsible for reporting to management about the current risk situation – on an ad-hoc basis if required – and for checking measures relating to risk policy and proposing new ones where necessary. The Munich Re Group complies both with the German Law on Corporate Control and Transparency and with the local regulations on risk management in the different countries in which it operates. The risk management system is regularly examined independently, both by internal auditing units at the individual Group companies and by the external auditor as part of the annual audit.

Appendix VIII
Page 90 of 100 IAIS Global Reinsurance Market Report 2004 December 2005
Main strategic risks Strategic risks arise if our strategy is not compatible with market or client requirements and expectations or with economic parameters, these disparities not being recognised, and our objectives and initiatives not taking sufficient account of such a development. In our strategic planning process, we carefully analyse the strategic risks, which are evaluated in individual projects (e.g. investment or market-entry projects) using scenarios (correlations, effects, occurrence probability, etc.). In addition, we systematically perform 'swot analyses' (strengths, weaknesses, opportunities, threats) and define the required action in the course of our balanced scorecard process. One of the main risks for any company is being too conservative and failing to recognise new business opportunities. We counter this danger by, among other things, integrating innovation teams into our operative reinsurance units in order to tap into new product and client segments at an early stage. This approach is also designed to ensure that we identify and work on current market and client issues, as well as fields of knowledge that are of critical importance for the future. Risk control measures In the Munich Re Group, binding underwriting guidelines and limits and clear underwriting authorities precisely regulate who is authorised and accountable for concluding insurance and reinsurance contracts and at what conditions. We regularly check compliance with these guidelines and closely observe developments in the global and local markets, reacting where necessary with appropriate measures that are translated without delay into underwriting guidelines if required. As a general rule, our treaties and the original business ceded to us contain clear liability limits, since unlimited covers are ultimately not calculable either in insurance or reinsurance. Accidents like the one that occurred on the German Wiehltal bridge in August 2004 strengthen our resolve to continue working for the general abolition of unlimited covers in the insurance industry worldwide. Despite the implementation of our restrictive underwriting policy with regard to unlimited covers, such risks will continue to feature in our portfolio in the foreseeable future, as insurers do not convert their original inforce policies immediately. Another preventive risk controlling measure is the agreement of accumulation budgets in reinsurance. Particularly in property lines, our reinsurance companies assume very large liabilities for earthquake and windstorm losses, and to a lesser extent for hailstorm and flood risks. These losses often affect many clients at the same time. It is therefore essential that the natural hazard liabilities underwritten are controlled and limited on a Group-wide basis. This is why we introduced accumulation budgets for the hazards earthquake and windstorm many years ago. By means of these budgets, the Board of Management stipulates annually the maximum liability to be assumed by individual reinsurance companies of the Munich Re Group for such events per loss accumulation zone. The loss scenarios underlying the accumulation budgets are regularly checked. An excellent tool for risk prevention, and thus for risk controlling, is careful reserving to cover future claims and losses which have been incurred but not yet reported or not reported enough. Hence we generally establish provisions for uncertain liabilities using actuarial methods. In addition, where required under national rules of insurance supervision and accounting, we post provisions for fluctuations in claims experience, although these are not included as such in our IRFS consolidated financial statements. Claims provisions for all classes of business and at all companies are regularly checked by means of internal reviews and audits to make sure they are sufficient. These analyses draw on the expertise and experience of a wide range of specialists, such as actuaries, scientists of various disciplines, underwriters and accounting experts. Whenever possible, we also refer to external statistics and documents (e.g. certified biometric calculation bases in life and health insurance) and, where necessary, appropriate adjustments are made to the provisions posted. Owing to the

Appendix VIII
IAIS Global Reinsurance Market Report 2004 Page 91 of 100 December 2005
particular uncertainties involved, however, there is a substantial risk of misestimates in establishing reserving requirements. Thus, as in the previous years, we had to substantially strengthen reserves for losses from business written in the past. Particularly in US liability insurance business, the damages awarded by courts – to asbestosis claimants, for instance – recurrently exceed even the most pessimistic assumptions. This also means that further, possibly considerable, increases in the loss reserves from this and other liability complexes cannot be ruled out in the future either. A further important risk control measure in the field of underwriting is the cession of a portion of our risks to third parties via external reinsurance and retrocession. All our companies have appropriate intra-Group and external reinsurance and retrocession cover. The core component of Munich Re’s retrocession is an accumulation excess-of-loss cover, which provides protection against losses from natural catastrophes. The dimensions of this cover are based on analyses of our accumulation budgets in those parts of the world exposed to natural catastrophes. The cover is placed on the international reinsurance market. We only choose business partners for our externally placed reinsurance and retrocessions that have been accepted by our Security Committee, which examines the security of potential retrocessionaires and reinsurers on the basis of a range of criteria. The minimum requirement for participating in one of our retrocession or reinsurance treaties is a rating of a– from S&P or A.M.Best. Disaster scenarios Disaster scenarios such as natural catastrophes, industrial accidents or terrorist attacks cause bodily injuries, environmental damage, property damage and pure financial losses in various combinations. Life, disability, health and workers’ compensation insurances, property and liability insurances can therefore be affected in different ways. For the purposes of accumulation control, scenarios affecting various classes of business can be anticipated at two levels, from which conclusions can also be drawn with respect to prevention and the protection of victims: – Disaster scenarios – The central question here is: what bodily injury, property damage, pure financial losses and environmental damage can be caused by natural events or man-made disasters? From analysing the facts and comparable historical cases, the insurance industry can come up with ideas for prevention. – Insurance markets – Here the question is: how do the insurance markets handle disaster scenarios? It is essential to look at market structures, which vary from country to country. These structures are characterised by varying forms of interaction between private and state prevention, social security and private insurance, private and public liability law, and also by various ad hoc government aid programmes and compensation funds. Not only are there differences from one country to another, but market structures also change over time, often following spectacular losses that prompt political pressure to take action. Analysing market structures helps identify weak spots, such as currently exist in Germany where the protection of victims of violence is concerned.
************************************************ Japan – Integrated Risk Management The following is an example of Integrated Risk Management method adopted by a non-life insurance company which is primarily a direct insurer. The purpose of Integrated Risk Management is to secure the resilience of the company by quantifying various risks, such as underwriting, investment, and operational risks, relative to business activities and maintaining sufficient net assets to absorb potential financial losses arising out of those risks.

Appendix VIII
Page 92 of 100 IAIS Global Reinsurance Market Report 2004 December 2005
1. Stress Testing Methodology: Expected Shortfall The company quantifies amount of risks based on predetermined risk retention period (1 year) and confidence level (99%). The method in use for quantification is risk index known as Expected Shortfall, Conditional Value at Risk (CVaR), or Tail Value at Risk (T-VaR), which represents the expected value of losses exceeding the confidence level. The company conducts stress testing by utilizing 99% - Expected Shortfall. Chart 1. Risk Distribution and Risk Index
2. Risk Tolerance Integrated Risk Management aims at maintaining the company's ratings and preventing it from the discontinuation of business by limiting the aggregated amount of risks, within the internally defined maximum risk tolerance. The company determines its maximum risk tolerance every year, and manages its operations by maintaining the quantified amount of risks within the said level.
************************************************ Switzerland - Converium’s stress testing practices Converium’s stress testing is based on an internal risk model employing a stochastic (Monte-Carlo) method for both the asset and the liability side of the balance sheet. The asset modelling relies on a stochastic scenario generator. For each stochastic scenario, balance sheet and income statement projections are produced. Thus Converium has a full Asset-Liability Management (ALM) which we consider Dynamic Financial Analysis (DFA) compliant. By definition, the method does not use arbitrarily constructed deterministic scenarios. Instead, the set of stochastic scenarios naturally contains a fair amount of stress scenarios, encompassing a wide set of relevant risk factors and their dependencies. On the asset side, we use an economic scenario generator covering many economic variables in six currency zones. The scenarios are realistically calibrated as they rely on bootstrapping from past market behaviours. A heavy-tailed extrapolation of distributions makes sure that the stochastic simulation includes economic stress scenarios beyond the set of the yet observed shocks. The values of Converium’s investments in different asset classes ensue from the economic scenarios.
Probability Density
Amount of Loss
VaR (99%):
Statistically, losses exceeding this amount will not occur in 99 years out of 100 years.
1%
99% - Expected Shortfall:
The expected value of losses exceeding VaR99%.
Appendix VIII
IAIS Global Reinsurance Market Report 2004 Page 93 of 100 December 2005
On the liability side, the stochastic stress scenarios arise from the heavy tails of the loss distributions and the dependencies between different treaties and lines of business. The tail dependencies are modelled using copulas, which is a direct way to introduce 'correlation stress'. All these elements conform to the actuarial methods used in contract pricing. Some lines such as Credit&Surety depend on the economic cycle, which is modelled by a link to the economic scenario generator. The model includes Converium’s retrocession coverage and the stochastic development of insurance reserves. Strategic management decisions such as choice of retention and retrocession as well as asset allocation can be inserted as parameters in the ALM model. It is possible to analyze the consequences of these decisions in terms of the projected future balance sheets over one or more years. For stress testing, the focus is on the worst simulation results rather than the average. We analyze the 5% or 1% lowest resulting values of key balance sheet variables such as the shareholders’ equity after one or more years. In those bad scenarios, we often find interdependent risks such as the combination of badly performing capital markets and moderately increasing interest rates together with growing high-risk business. By contrast, deterministic single-variable stress scenarios such as 'another 50% drop in equity' in our opinion risk to misrepresent the true risks of a company as they ignore the danger of risk factor combinations. A company may well pass stress tests with regard to isolated risk factors, but fail the test when a combination of less stringent stresses is considered. By analyzing the 1% worst outcomes, we identify the dominant risk factors quantitatively by their contributions to the expected shortfall. These 'reverse-engineered' risk factors represent reality better than arbitrary assumptions. Converium’s ALM model is normally updated twice a year. The results are summarized in the semi-annual ALM report and presented to Converium’s ALM committee and the GEC. Final strategic decisions are made by that committee, approved by the GEC and, eventually, the Board of directors.
************************************************ Switzerland – Extract: Swiss Re Annual Report 2004 Swiss Re Risk Management At Swiss Re, risk management considerations are an essential dimension of strategic planning and an integral part of the management discipline exercised by the Executive Board and the Board of Directors. Swiss Re risk management organization and processes are designed to ensure a disciplined approach to controlled risk taking. This requires a strong risk management organization and comprehensive risk management processes to identify, assess and control the Group’s risk exposures. Good corporate governance dictates the need for a clear separation of responsibilities between risk taking and risk and performance measurement. Swiss Re Risk Management does not execute business. It sets the guidelines and standards based on best practice and develops the risk measurement and risk aggregation techniques applied group wide as well as managing risk reporting, risk aggregation and risk steering at Group level. Risk management principles At Swiss Re, risk management is based on four guiding principles that are applied throughout the Group. Controlled risk taking is a prerequisite for maintaining financial strength of Swiss Re, thus the Group’s overall risk limits are clearly defined. Clear

Appendix VIII
Page 94 of 100 IAIS Global Reinsurance Market Report 2004 December 2005
accountability of all business units for the risks they take. The incentive structures are aligned with Swiss Re’s overall business objectives. An independent risk management function is established in order to avoid conflicts of interest and to ensure independent oversight of risk taking activities. Open risk culture fosters risk transparency and responsiveness to change as integral element of Swiss Re’s risk control process which is designed to effectively facilitate timely risk mitigation. Swiss Re has institutionalized processes to facilitate risk management knowledge sharing at all levels. Swiss Re risk landscape Swiss Re distinguishes two types of risks. Core risks are split into the three broad categories of Insurance risk, i.e. the risk of incurring a financial loss as a result of a property, casualty, life or health insurance event; Financial market risk, i.e. the risk of assets and/or liabilities being negatively impacted by changes in financial market risk factors, such as equity market prices, interest rates, credit spreads, foreign exchange rates or real estate prices; Credit risk, i.e. the risk of incurring a financial loss due to adverse changes in the creditworthiness of counterparties of Swiss Re and/or third parties. The risks classified as ancillary risk arise as a consequence of undertaking business and comprise operational risks, i.e. the risk of incurring a direct or indirect loss due to inadequate or failed internal processes, people, systems, external events or non-compliance with regulation resulting in regulatory penalties or a total or partial inability to operate properly; funding and liquidity risk which may result from larger than expected cash outflows or smaller than expected cash inflows and a restricted ability to raise short-term funds. In addition, sudden liquidity requirements may arise if covenants are triggered under specific adverse circumstances, requiring the collateralisation of debt obligations and third party guarantees with assets of a specified quality. Swiss Re Integrated risk modelling As Swiss Re is exposed to multiple risks, Swiss Re assesses both the entirety and the correlation of the risks in its portfolio to determine which of them may accumulate and which of them may contribute to diversification. Swiss Re has developed its own internal integrated risk model, which is used to determine the amount of capital required to support the risks on Swiss Re’s books and to allocate overall risk-taking capacity to specific lines of business. The model is based on economic principles and continuously reviewed and relevant new techniques and insights are included to reflect prevailing best practice. Swiss Re’s model is based on two important principles. Firstly, an asset liability management (ALM) approach to assess risk, measuring its net impact on the economic value of both assets and liabilities, is used. Secondly, the impact of risk is measured on an integrated basis, taking into account the fact that a single risk factor can impact different sub-portfolios and different risk factors can exhibit dependencies. Based on these principles, it is possible to obtain the probability distribution for the Group’s annual economic profit and loss, specifying the likelihood that profit or loss will fall within any given range. From this distribution a base capital requirement is derived that captures the potential for severe, but rare, aggregate losses over a one-year time horizon. The base capital requirement is then compared with available capital to determine the adequacy of Swiss Re’s capitalisation. Various statistical measures can be used to summarise the risk distribution and define the base capital requirement. One widely used measure is the 99% Value at Risk (VaR): a maximum loss that will be exceeded in only one year out of a hundred. In addition to the 99% VaR, Swiss Re considers other statistical measures. One such measure is the so-called 99% expected shortfall (also known as 99% TailVaR). While 99% VaR measures the maximum loss that will be exceeded in only one year out of one hundred, 99% expected shortfall

Appendix VIII
IAIS Global Reinsurance Market Report 2004 Page 95 of 100 December 2005
measures the average of losses that occur with a frequency of less than once in one hundred years. The 99% expected shortfall is a more conservative risk measure. In addition to the overall Group 99% expected shortfall, standalone 99% expected shortfall for property and casualty, life and health, financial market, credit, and funding and liquidity risks is calculated. Such a procedure allows to clearly evaluate the diversification effect: the base capital requirement for the entire portfolio is smaller than the sum of the base capital requirements for the individual sub-portfolios. Stress scenarios complement the Swiss Re integrated risk model Stress scenario analyses complement the integrated risk model by providing information on the economic implications for Swiss Re if certain adverse situations arise. For insurance, the impact of rare insurance events is evaluated. For financial markets and credit, the results of fairly well established scenarios that are more likely to occur have been chosen to facilitate comparison with other companies. Natural catastrophe stress tests are performed for e.g. European windstorm, Atlantic hurricane, Japanese earthquake and California earthquake each of them based on a 200 year return period. The tests show the estimated economic impact of these loss events on expected discounted claims for each natural catastrophe loss event on a pre-tax basis, after allowing for retrocessions, risk swaps and securitisations. The resulting estimates also take into account that an event could trigger claims in various lines of business. A life insurance stress test performed is based on the average sum insured and on the assumption that the excess mortality is evenly spread across the population. The latter does not allow for the typically lower mortality experienced among the insured population. Financial market risk stress tests depict the pre-tax impact of market scenarios on available economic capital. An equity scenario (e.g. 30% fall in global equity markets) includes traded equities, private equities, equity derivatives, Guaranteed Minimum Death Benefit products and funding obligations arising from equity holdings in Swiss Re pension funds. An interest rate scenario (e.g. 100bp increase in global yield curves) depicts the net economic impact on assets and liabilities from a rise in interest rates. A real estate scenario (e.g. 15% fall in global real estate markets) is applied to real estate exposure including investments in real estate and own-use property. Credit scenarios depict the estimated pre-tax impact on available economic capital. For instance the default scenario shows estimated additional (unexpected) losses due to adverse default rate changes. In general, the modelled scenarios (rating migration, deterioration of recovery levels) are based on a credit environment development similar to 2001, which was the worst credit experience of the past ten years. This period also reflects the changes in credit markets due to the increased use of credit derivatives.
************************************************ United Kingdom – Lloyd’s Stress and scenario testing is carried out by managing agents and by Lloyd’s to determine the anticipated impact of extreme, unexpected but plausible, large loss events within a three year time horizon. Stress tests are generally defined by reference to adverse movements in key financial parameters (such as interest rates, asset values or liability values) or to the potential causes of severe insurance losses (such as a natural catastrophe or major industrial incident).
Appendix VIII
Page 96 of 100 IAIS Global Reinsurance Market Report 2004 December 2005
The scenarios used to produce the stress tests are generated either deterministically by considering adverse events that reflect realistic stresses that Lloyd’s should be able to withstand, or stochastically based on explicit statistical assumptions. Stochastic modelling The Lloyd’s stochastic model relies on the random generation of scenarios. This is used to quantify risk within the Lloyd’s market arising from syndicates’ exposures. The numerical method used throughout the stochastic model is Monte-Carlo simulation. Simulation techniques rely on producing a large number of random scenarios. In this case the scenarios reflect reserve deteriorations per unit of exposure in each line of business ('risk group'), year of account and currency written by Lloyd’s syndicates, as well as their relative position around the Lloyd’s market average portfolio. The stress that each scenario produces is observed and by the consideration of all scenario outcomes statistical conclusions on risk can be drawn. Realistic disaster scenarios
In addition, Lloyd's also assesses its aggregate risk exposure through a review of the loss estimates resulting from a range of realistic disaster scenarios (RDS). One of the main objectives of this exercise is to model and analyse aggregation or potential aggregation of risks within the Lloyd’s market. As part of this exercise, all syndicates are required to report estimated losses based on a number of scenarios, which are either compulsory or required only if de-minimis limits are met (i.e. where the exposure exceeds predetermined loss thresholds). The compulsory events are:
• Second event – ‘as if’ assessment of a Hurricane Andrew immediately following a Northridge earthquake
• Florida windstorm • California earthquake • New Madrid earthquake • European windstorm • Japanese earthquake • Terrorism event • Gulf of Mexico windstorm • Japanese typhoon
The de-minimis events are:
• USA windstorm • Marine event • North Sea - loss of major complex • Aviation collision • Major risk loss (total loss to the syndicate's largest single risk) • Satellite risks • Liability risks • Political risks • Alternative RDS A (to be generated based on the syndicate's substantial exposures) • Alternative RDS B (as for Alternative RDS A)
Through aggregating losses from particular events, the overall risk exposure of the Lloyd’s market can be assessed which links into the capitalisation of Lloyd’s. The analysis also extends to the consideration of cash flow and liquidity modelling which are critical in the understanding of a syndicate’s resilience to a major loss event.

Appendix IX
IAIS Global Reinsurance Market Report 2004 Page 97 of 100 December 2005
OECD: Recommendation of the Council on Assessment of Reinsurance Companies, 25 March 1998 – Extract of Annex and Notes Annex Assessment of Reinsurance Companies It is the responsibility of the insurance companies to identify the information they need for assessing the soundness (which includes the fact that the individual reinsurance company is able, financially and administratively, to pay legitimate claims and can be relied upon to do so promptly) of reinsurance companies. The nature and extent of the assessment may vary, according to the nature and importance of the transaction, the nature and importance of the parties concerned. While the responsibility for assessment remains ultimately with the ceding companies, it may be appropriate to draw on the experience of brokers or other sources of information and expertise (e.g.: specialised press and rating agencies), but in a prudent way. Reinsurance companies will, for the purpose of this Recommendation, be understood as professional reinsurance companies, associations of underwriters authorised to accept reinsurance, direct insurance companies accepting reinsurance. They have different characteristics and may be subject to different regulatory and supervisory frameworks, including accounting rules. There are a number of possible sources of information relevant to an assessment. In addition to statutory annual reports and accounts, examples include publicly disclosed regulatory returns and other sources. These may provide an adequate basis for an assessment. Where such information is not available, or appears insufficient, then insurance companies may consider the following factors or comparable ones: 1) Legal and statutory framework
- legal status of the reinsurance company;
- scope of regulation and supervision of reinsurance in the home country (licensing registration, solvency provisions, rules related to technical provisions, collateralisation, winding-up, accounting), and if necessary in host country;
- reinsurance regulation of investments, existence of rules related to liquidity, diversification, spread currency matching, maturity matching, derivatives, securitisation, and movements of capital. Reinsurance regulations on investments abroad, transfer of profits, premiums, claims;
- tax regulation of reinsurance in the home country, and, if necessary, in host countries;
- characteristics of the reinsurance contract law applicable to the contract when not specified in the contract.
2) Structural indicators
- structure and composition of the main direct shareholding, whether it belongs to groups or conglomerates, for at least the last three years, taking account of listed/unlisted nature of the company;

Appendix IX
Page 98 of 100 IAIS Global Reinsurance Market Report 2004 December 2005
- relevant business relationship with other companies (including strategic alliances, significant relation/legal agreement, accepted non-related risks for captives, intra-group retrocessions).
3) Management
- reputation and integrity of board management and legal representatives (and other staff, if relevant); fit and proper criteria, when existing; absence of relevant professionally related criminal or civil sentences or convictions.
4) Performance indicators (for at least the past three years) (see notes)
- gross and net premiums;
- incurred losses (gross and net);
- operating expenses;
- investment income.
5) Technical provisions and solvency
- level and composition of technical provisions, including loss provisions (gross and net) and equalisation provisions (gross and net);
- general methods of valuation of technical provisions and results of past valuations;
- level and composition of guarantee funds, of which shareholders’ equity and subordinated liabilities, shareholders’ equity being specified as: subscribed capital and equivalent funds, share premium account, revaluation reserves, other reserves and minority interests;
- use of alternative risk transfers.
6) Investments
- for at least the past three years: spread of assets between the following categories: real estate, mortgage loans, shares, bonds with fixed revenue, loans other than mortgage loans, other investments;
- methods of valuation in the balance sheet, including derivatives.
Notes In case of premiums, for the main classes of covered risks; and at least for general liability, transport and catastrophic risks; and for the main countries, or regional group of countries, in which they operate.
In case of losses, for the main classes of covered risks, and at least for general liability, transport and catastrophic risks.
These data should enable the calculation of combined ratio (losses plus expenses divided by premiums), loss ratio, expenses ratio, operational ratio (losses plus expenses minus investment income – insofar as they are included in annual results – divided by premiums) and retention ratio.
The spread of retroceded premiums per main retrocessionaires, possibly with names, should also be communicated, for the main classes considered.

Appendix X
IAIS Global Reinsurance Market Report 2004 Page 99 of 100 December 2005
Main assumptions and qualifications • For notes specific to individual statistical tables, please refer to the comments below the
tables as set out in Appendix I. • For a summary of regulatory capital requirements in participating jurisdictions, see
Appendix IV. • For a summary of major differences between financial/regulatory reporting in participating
jurisdictions and US GAAP, see Appendix VI. General points
In this report the RTG uses the aggregated statistics of 53 significant reinsurance entities as a proxy for the global reinsurance market as a whole.
For reasons described, in particular in Section 3 and elsewhere in the report, the global statistics are an aggregation of entity level data. Results would differ had group-level data been used.
The statistics in tables 1.1 to 2.3 (which relate to premiums and claims) are in respect of the reinsurance business of the reporting entities.
The statistics in tables 3.1 to 5.4 relate to the direct and reinsurance business of the reporting entities; the areas covered by these tables are more applicable to the reporting entity as a whole.
Not all entities or jurisdictions have been able to complete all of the information in all tables. Where tables, or parts of tables are not fully complete for all reporting reinsurers, a note on the level of completion has been made below the relevant table in Appendix I.
Not all entities or jurisdictions have been able to extract or analyse the data as originally intended. Where tables, or parts of tables, include data which is given on a different basis to that of most other participating jurisdictions, if this gives rise to a limitation within the data a note on the limiting factor has been made below the relevant table in Appendix I.
Except where otherwise indicated, data is consistent with participating jurisdictions’ national GAAP (or US Statutory Accounting Principles).
Some analysis has required manual extraction and/or estimates to be used.
Certain data used to complete the statistical tables may not originally have been produced for the same purposes as those of these statistics.
Participating jurisdictions are not responsible for the accuracy of the tables submitted to them by reporting entities; the IAIS Secretariat is not responsible for the accuracy of B-level data submitted to it by participating supervisors.
Aggregation of global (C-level) statistics
• The C-level statistics have been aggregated from the national level (B-level) statistics by simple addition of the B-level statistics submitted by participation jurisdictions to the IAIS Secretariat.

Appendix X
Page 100 of 100 IAIS Global Reinsurance Market Report 2004 December 2005
Jurisdiction specific points
• For the UK, inward facultative reinsurance is excluded from the statistics, consistent with the fact that it is reported together with ‘direct’ business for local regulatory reporting. The impact upon the global statistics is not material (i.e. significantly less than 5% of gross reinsurance premiums assumed).
• For the US, the national-level tables have been produced by the NAIC, based primarily upon information held in the Financial Data Repository, and not through aggregating entity-level tables produced by the selected reinsurers.
Selection criteria for reporting reinsurers
• Reporting reinsurers have been selected for the 2004 global reinsurance market statistics, based upon the agreed criteria and, for practical reasons, upon their 2003 data.86 Entities meeting the selection criteria for the first time on the basis of their 2004 data will, however, be asked to participate the following year. For this reason there is a potential time delay in the impact of growth markets being reflected in the statistics.
Financial year end
• Reporting reinsurers in all participating jurisdictions have a financial reporting year end of 31 December, except for those in Japan, which have a financial reporting year end of 31 March.
The global reinsurance market statistics for 2004 include the financial results of reporting reinsurers from Japan for the financial year ended 31 March 2005, and from elsewhere for the year ended 31 December 2004.
Exchange rates
• Exchange rates used to translate jurisdictions’ data denominated in local currency to US Dollars for the purpose of completing the tables are as follows:
Sterling: £1 to US$1.92 Euro: €1 to US$1.35 – 1.36 Japanese Yen: US$1 to ¥106.97
This applies only to those entities/jurisdictions where the data necessary to prepare the statistical tables was not already available on a US Dollar basis.
• Exchange rate movements between local currencies and the US Dollar may over time cause fluctuations in the global statistics, which are not a factor of the underlying business activities.
86 Except the US, where the selection is based upon 2004 data.