Embed Size (px)
Citation preview

NUREG/IA-0212, Vol. 1
International Agreement Report
Kalinin VVER-1000 Nuclear Power StationUnit 1 PRA (Beta Project)
Executive Summary
English Version
Prepared byFederal Nuclear and Radiation Safety Authority of the Russian Federation (Gosatomnadzor)now the Federal Environmental, Industrial and Nuclear Supervision Service of Russia(Rostechnadzor) with support from the U.S. Nuclear Regulatory Commission
Conducted under agreement between the United States and the Russian Federation on theprovision of assistance dated 4 April 1992
Office of Nuclear Regulatory ResearchU.S. Nuclear Regulatory CommissionWashington, DC 20555-0001
November 2005
Published byU.S. Nuclear Regulatory Commission

iii
ABSTRACT This document summarizes goals, scope, and results of an international probabilistic risk assessment (PRA) project for Unit 1 (VVER-1000) of the Kalinin Nuclear Power Station in Russia. The project was organized and managed by U.S. Nuclear Regulatory Commission and the Russian Federal Nuclear and Radiation Safety Authority, Gosatomnadzor, from 1995 to 2004. In 2004 the responsibilities of Gosatomnadzor were subsumed by the newly established Federal Environmental, Industrial and Nuclear Supervision Service of Russia, Rostechnadzor. The report consists of four sections describing administrative features of the project and technical results of three main areas of the PRA: Level 1 and Level 2 for internal initiators and limited scope studies for other events (fire, flood, and seismic events). The report is directed toward regulatory authority management and specialists familiar with PRA methods.

iv
v
FOREWORD During the Lisbon Conference on Assistance to the Nuclear Safety Initiative, held in May 1992, participants agreed that efforts should be undertaken to improve the safety of nuclear power plants that were designed and built by the former Soviet Union. That agreement led to a collaborative probabilistic risk assessment (PRA) of the Kalinin Nuclear Power Station (KNPS), Unit 1, in the Russian Federation. The KNPS Unit 1 PRA was intended to demonstrate the benefits obtained from application of risk technology towards understanding and improving reactor safety and, thereby, helping to build a risk-informed framework to help address reactor safety issues in regulations. The U.S. Department of State, together with the Agency for International Development (AID), requested that the U.S. Nuclear Regulatory Commission (NRC) and the Federal Nuclear and Radiation Safety Authority of the Russian Federation (Gosatomnadzor, or GAN) work together to begin applying PRA technology to Soviet-designed plants.1 On the basis of that request, in 1995, the NRC and GAN agreed to work together to perform a PRA of a VVER-1000 PWR reactor. Under that agreement, the NRC provided financial support for the PRA with funds from AID and technical support primarily from Brookhaven National Laboratory and its subcontractors. KNPS Unit 1 was chosen for the PRA, and the effort was performed under the direction of GAN with the assistance of KNPS personnel and the following four other Russian organizations: • Science and Engineering Centre for Nuclear and Radiation Safety (GAN’s and now
Rostechnadzor’s technical support organization) • Gidropress Experimental and Design Office (the VVER designer) • Nizhny Novgorod Project Institute, “Atomenergoprojekt” (the architect-engineer) • Rosenergoatom Consortium (the utility owner of KNPS) One of the overriding accomplishments of the project has been technology transfer. In NRC-sponsored workshops held in Washington, DC, and Moscow from October 1995 through November 2003, training was provided in all facets of PRA practice. In addition, the Russian participants developed expertise using current-generation NRC-developed computer codes, MELCOR, SAPHIRE and MACCS. Towards the completion of the PRA, senior members of the Kalinin project team began the development of risk-informed, Russian nuclear regulatory guidelines. These guidelines foster the application of risk assessment concepts to promote a better understanding of risk contributors. Efforts such as this have benefited from the expertise obtained, in part, from the training, experience, and insights gained from participation in the KNPS Unit 1 PRA project. The documentation of the Kalinin PRA comprises two companion NUREG-series reports: • NUREG/CR-6572, Revision 1, “Kalinin VVER-1000 Nuclear Power Station Unit 1 PRA:
Procedure Guides for a Probabilistic Risk Assessment,” was prepared by Brookhaven National Laboratory and the NRC staff. It contains guidance for conducting the Level 1, 2, and 3 PRAs for KNPS with primary focus on internal events. It may also serve as a guide for future PRAs in support of other nuclear power plants.
1 As a result of a governmental decree in May 2004, GAN was subsumed into a new organization, known as the Federal Environmental, Industrial and Nuclear Supervision Service of Russia (Rostechnadzor).
vi
• NUREG/IA-0212, “Kalinin VVER-1000 Nuclear Power Station Unit 1 PRA: Volumes 1 and 2,” was
written by the Russian team and, by agreement, includes both a non-proprietary and proprietary volume. The non-proprietary volume, Volume 1, “Executive Summary Report,” discusses the project objectives, summarizes how the project was carried out, and presents a general summary of the PRA results. The proprietary volume, Volume 2, contains three parts. Part 1, “Main Report: Level 1 PRA, Internal Initiators,” discusses the Level 1 portion of the PRA; Part 2, “Main Report: Level 2 PRA, Internal Initiators,” discusses the Level 2 portion; and Part 3, “Main Report: Other Events Analysis,” discusses preliminary analyses of fire, internal flooding, and seismic events, which may form the basis for additional risk assessment work at some future time.
____________________________ Carl J. Paperiello, Director Office of Nuclear Regulatory Research U.S. Nuclear Regulatory Commission
vii
TABLE OF CONTENTS
Page
Abstract ....................................................................................................................................................... iii Foreword.................... ................................................................................ ...................................................v List of Figures .............................................................................................................................................. x List of Tables .............................................................................................................................................. xi Acknowledgements ....................................................................................................................................xii Acronyms and Abbreviations ...................................................................................................................xiii 1. THE BETA PROJECT ................................................................................................................... 1 1.1 Introduction ..................................................................................................................................... 1 1.2 Project General Purpose and Scope ................................................................................................. 1 1.3 Participants and Management .......................................................................................................... 2 1.4 Project Planning............................................................................................................................... 3 1.5 BETA Project Personnel .................................................................................................................. 6 1.6 References ....................................................................................................................................... 7 2. LEVEL 1 PROBABILISTIC RISK ASSESSMENT ...................................................................... 8 2.1 Features of the Plant Relevant to Level 1 Probabilistic Risk Assessment ....................................... 8 2.2 Scope/Objectives ............................................................................................................................. 8 2.3 Characteristics of Level 1 Probabilistic Risk Assessment Tasks..................................................... 9 2.3.1 Assumptions and Limitations of the Probabilistic Risk Assessment ............................................ 10 2.3.2 Kalinin Nuclear Power Station Safety Functions and Safety Systems ......................................... 11 2.3.3 Determination of Initiating Events and Frequency ....................................................................... 11 2.3.4 Accident Sequence Modeling ....................................................................................................... 12 2.3.5 System Modeling .......................................................................................................................... 13 2.3.6 Thermal-Hydraulic Analysis ......................................................................................................... 13 2.3.7 Component Reliability Assessment .............................................................................................. 14 2.3.8 Dependency Analysis .................................................................................................................... 14 2.3.9 Common Cause Failures ............................................................................................................... 15 2.3.10 Human Reliability Analysis .......................................................................................................... 16 2.3.11 Characteristics of the Probabilistic Risk Assessment Model ........................................................ 17 2.4 Results and Conclusions ................................................................................................................ 17 2.4.1 Core Damage Frequency and Parametric Uncertainty .................................................................. 17 2.4.2 Importance Analysis ..................................................................................................................... 23 2.4.3 Sensitivity Analysis ...................................................................................................................... 29 2.4.3.1 Sump Clogging Issues ................................................................................................................... 29 2.4.3.2 Feed-Water Pump Trip Frequency ................................................................................................ 30 2.4.3.3 Emergency Diesel Generator Reliability ...................................................................................... 30 2.4.4 Conclusions and Recommendations of the Level 1 Probabilistic Risk Assessment for Internal Initiators ..................................................................................................................... 31 2.4.4.1 Core Damage Frequency and Major Contributors ........................................................................ 31 2.4.4.2 Possible Plant Safety Improvement Measures .............................................................................. 32 2.4.4.3 Limitations of the PRA Study ....................................................................................................... 32 2.4.5 Basic Directions for PRA Refinement .......................................................................................... 33 2.5 References ..................................................................................................................................... 34

viii
TABLE OF CONTENTS (Continued)
Page
3. LEVEL 2 PROBABILISTIC RISK ASSESSMENT .................................................................... 36 3.1 Scope/Objectives .......................................................................................................................... 36 3.2 Characteristics of the Level 2 Probabilistic Risk Assessment ...................................................... 36 3.3 Features of Unit 1 Relevance to the Level 2 Probabilistic Risk Assessment ................................ 36 3.4 Interface Between Level 1 and Level 2 PRA ................................................................................ 37 3.4.1 Plant Damage State Identification ................................................................................................ 37 3.4.2 Plant Damage State Attributes ...................................................................................................... 38 3.4.3 Approach to Plant Damage State Matrix Development ................................................................ 39 3.5 Containment Performance ............................................................................................................ 43 3.6 Containment Loads ....................................................................................................................... 44 3.6.1 In-Vessel Steam Explosions ......................................................................................................... 45 3.6.2 Ex-Vessel Steam Explosions ........................................................................................................ 45 3.6.3 Loads from Flammable Gas Combustion ..................................................................................... 45 3.6.4 Loads from Direct Containment Heating ...................................................................................... 46 3.6.5 Basement Melt-Through ............................................................................................................... 47 3.6.6 Vessel Thrust Force ...................................................................................................................... 48 3.6.7 Temperature-Induced Hot Leg, Pressurizer Surge Line, and Steam Generator Header/Tube Failure .................................................................................................... 48 3.6.8 Containment Overpressure ............................................................................................................ 49 3.6.9 Reactor Vessel Bottom Head Failure ............................................................................................ 49 3.7 Severe Accident Progression Analysis ......................................................................................... 49 3.7.1 Accident Progression Event Trees ................................................................................................ 49 3.7.2 Accident Progression Event Tree Quantification .......................................................................... 53 3.7.3 Fission Product Release Categories .............................................................................................. 53 3.7.4 Development of Containment State Matrix .................................................................................. 56 3.8 Accident Source Terms ................................................................................................................. 59 3.8.1 Grouping of Various Fission Products .......................................................................................... 59 3.8.2 In-Vessel Releases ........................................................................................................................ 59 3.8.3 Fission Product Transport in the Reactor Coolant System ........................................................... 60 3.8.4 Ex-Vessel Releases ....................................................................................................................... 60 3.8.5 Fission Product Transport Inside Containment ............................................................................. 60 3.8.6 Results of Radionuclide Releases into the Environment .............................................................. 60 3.9 Sensitivity Study ........................................................................................................................... 63 3.10 Results and Conclusions ............................................................................................................... 65 3.10.1 Plant Damage States ..................................................................................................................... 65 3.10.2 Containment Performance ............................................................................................................ 66 3.10.3 Radiological Releases ................................................................................................................... 69 3.10.4 Sensitivity Analysis ...................................................................................................................... 69 3.10.5 Observations on Containment Performance ................................................................................. 69 3.11 References ..................................................................................................................................... 71

ix
TABLE OF CONTENTS (Continued)
Page 4. INTERNAL FIRE, FLOOD, AND SEISMIC ANALYSES ........................................................ 73 4.1 Internal Fire Analysis .................................................................................................................... 73 4.1.1 Objectives ..................................................................................................................................... 73 4.1.2 Fire Initiation Frequency Evaluation ............................................................................................ 73 4.1.3 Selection and Assessment of Compartments ................................................................................ 74 4.1.4 Main Control Room Fire Analysis ................................................................................................ 74 4.1.5 Results and Conclusions ................................................................................................................ 74 4.2 Internal Flood Analysis ................................................................................................................. 75 4.2.1 Objectives ..................................................................................................................................... 75 4.2.2 Selection and Assessment of Compartments ................................................................................ 75 4.2.3 Method Used to Analyze Flooding Scenarios................................................................................ 75 4.2.4 Results and Conclusions ............................................................................................................... 76 4.3 Seismic Analysis ........................................................................................................................... 76 4.3.1 Objectives ..................................................................................................................................... 76 4.3.2 Hazard Study ................................................................................................................................. 76 4.3.3 Studies on Soil Response .............................................................................................................. 77 4.3.4 Building and Structure Response and Fragility Studies ................................................................ 77 4.3.4.1 Reactor Building ........................................................................................................................... 78 4.3.4.2 Diesel Generator Building ............................................................................................................ 78 4.3.4.3 ECCS Intermediate Cooling Circuit Building ............................................................................... 79 4.3.4.4 Turbine Building ........................................................................................................................... 79 4.3.4.5 Pumphouse..................................................................................................................................... 79 4.3.4.6 Stack .......................................................................................................................................... 79 4.3.5 Results and Conclusions ............................................................................................................... 79 4.4 References...................................................................................................................................... 79 5. CLOSURE .................................................................................................................................... 81
x
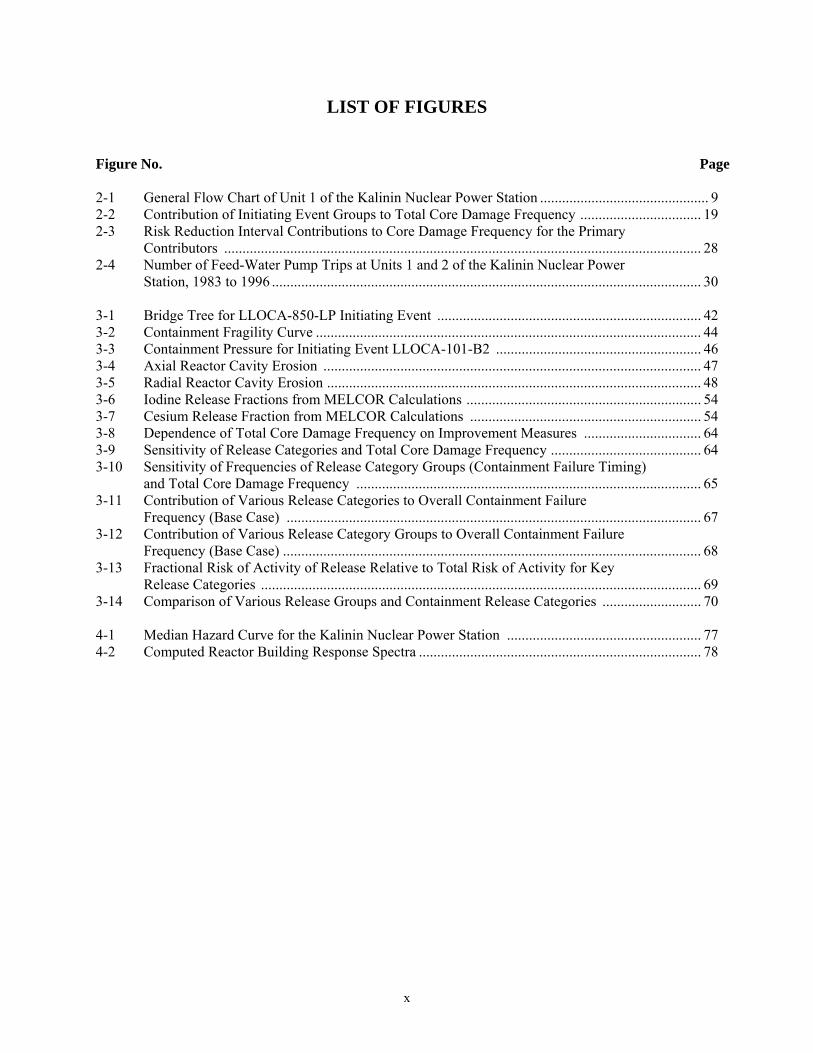
LIST OF FIGURES
Figure No. Page 2-1 General Flow Chart of Unit 1 of the Kalinin Nuclear Power Station .............................................. 9 2-2 Contribution of Initiating Event Groups to Total Core Damage Frequency ................................. 19 2-3 Risk Reduction Interval Contributions to Core Damage Frequency for the Primary Contributors .................................................................................................................................. 28 2-4 Number of Feed-Water Pump Trips at Units 1 and 2 of the Kalinin Nuclear Power Station, 1983 to 1996 ..................................................................................................................... 30 3-1 Bridge Tree for LLOCA-850-LP Initiating Event ........................................................................ 42 3-2 Containment Fragility Curve ......................................................................................................... 44 3-3 Containment Pressure for Initiating Event LLOCA-101-B2 ........................................................ 46 3-4 Axial Reactor Cavity Erosion ....................................................................................................... 47 3-5 Radial Reactor Cavity Erosion ...................................................................................................... 48 3-6 Iodine Release Fractions from MELCOR Calculations ................................................................ 54 3-7 Cesium Release Fraction from MELCOR Calculations ............................................................... 54 3-8 Dependence of Total Core Damage Frequency on Improvement Measures ................................ 64 3-9 Sensitivity of Release Categories and Total Core Damage Frequency ......................................... 64 3-10 Sensitivity of Frequencies of Release Category Groups (Containment Failure Timing) and Total Core Damage Frequency .............................................................................................. 65 3-11 Contribution of Various Release Categories to Overall Containment Failure Frequency (Base Case) ................................................................................................................. 67 3-12 Contribution of Various Release Category Groups to Overall Containment Failure Frequency (Base Case) .................................................................................................................. 68 3-13 Fractional Risk of Activity of Release Relative to Total Risk of Activity for Key Release Categories ........................................................................................................................ 69 3-14 Comparison of Various Release Groups and Containment Release Categories ........................... 70 4-1 Median Hazard Curve for the Kalinin Nuclear Power Station ..................................................... 77 4-2 Computed Reactor Building Response Spectra ............................................................................. 78

xi
LIST OF TABLES Table No. Page 1-1 BETA Project Phase III Tasks ......................................................................................................... 4 1-2 Training Courses and Technical Meetings (June 1996 – November 2003) .................................... 5 2-1 Kalinin Nuclear Power Station Unit 1 Safety Functions and Systems ......................................... 12 2-2 Frontline and Support Systems ..................................................................................................... 13 2-3 Dependencies Learned from Nuclear Power Plant Operation and Safety Analyses ..................... 15 2-4 Components Considered in Common Cause Failure Analysis ..................................................... 16 2-5 Results of Parametric Uncertainty Analysis of Core Damage Frequency .................................... 18 2-6 Input of Initiating Events to Core Damage Frequency ................................................................. 20 2-7 Minimal Cutsets of the Most Significant Accident Sequences ..................................................... 22 2-8 Importance of Component Unavailability ..................................................................................... 25 2-9 Important of Human Error Events ................................................................................................ 26 2-10 Results of Sensitivity Analysis for Containment Sump Clogging ................................................ 29 2-11 Results of Core Damage Frequency Sensitivity Analysis for Emergency Diesel Generator Reliability ......................................................................................................... 31 3-1 KNPS Unit 1 and Zion Plants Design Features ............................................................................ 38 3-2 Plant Damage State Matrix (Part 1) .............................................................................................. 40 3-3 Plant Damage State Matrix (Part 2) .............................................................................................. 41 3-4 Main Plant Damage States ............................................................................................................ 43 3-5 APET Nodal Questions ................................................................................................................. 51 3-6 Release Category Characteristics................................................................................................... 55 3-7 Containment State Matrix ............................................................................................................. 57 3-8 Release Categories in Order of Importance Relative to Total Core Damage Frequency ............. 58 3-9 Main Characteristics of Release Category Groups ....................................................................... 58 3-10 Fractional Release of Radionuclides for Various Release Categories .......................................... 61 3-11 Fractional Risk of Release Activities ............................................................................................ 62 4-1 List of Rooms with Fire Potential That Contribute More Than 1% to Core Damage Frequency for Internal Initiating Events ........................................................................................ 74 4-2 List of Rooms with Flooding Potential That Contribute More Than 1% to Core Damage Frequency for Internal Initiating Events ................................................................. 76

xii
ACKNOWLEDGMENTS Participants of the project would like to tender special thanks to former and present management of the U.S. Nuclear Regulatory Commission (NRC), Chairman N. Diaz, Mr. J. Taylor, Dr. T. Speis, Mr. C. Ader, Mr. M. Cunningham, Ms. M. Drouin, Mr. S. Newberry and Mr. T. King for organization and support of the close joint work between the Russian team and U.S. experts. We also greatly appreciate the interest, guidance, and support from Gosatomnadzor’s side: Mr. Y. Vishnevskiy and Mr. A. Gutsalov. NRC project managers, Mr. A. Szukievicz and Mr. J. Lane, provided invaluable input to the project. Our long-term international cooperation would be impossible without input from Mr. G. Fowler and Mrs. M. Carter of the NRC Office of International Programs. From the very beginning, Dr. D. Bley was a key technical leader for our team. Brookhaven National Laboratory staff, especially Dr. D. Diamond, Dr. T-L. Chu, and Dr. M. Azarm, also provided a great deal of support. These and many other colleagues from the U.S. and Russia made the project as successful as possible. Any possible deficiencies in the work are solely the responsibility of our team. As the project ends, we can say confidently that this work was an impressive example of international technical cooperation whose goal is to promote nuclear energy safety.

xiii
ACRONYMS AND ABBREVIATIONS AFWP Auxiliary feed-water pump APET Accident progression event tree ATWS Anticipated transient without scram BNL Brookhaven National Laboratory CCF Common cause failure CDF Core damage frequency CF Containment failure DCH Direct containment heating ECCS Emergency core cooling system EDOGP Experimental and Design Office “Hydropress” EFWP Emergency feed-water pump ET Event tree FAIVS Fast-acting isolating valve system FT Fault trees F-V Fussell-Vesely risk importance measure FWP Feed-water pump GAN Russian Federal Nuclear and Radiation Safety Authority (Gosatomnadzor of Russia) GCC Gore-Chernomyrdin Commission HA Primary hydro accumulator system HPECCS High-pressure emergency core cooling system HPSI High-pressure safety injection HRA Human reliability analysis I&C Instrumentation and control IAEA International Atomic Energy Agency ICCS Intermediate emergency core cooling system IE Initiating event KNPS Kalinin Nuclear Power Station, Russia LLOCA Large LOCA LOCA Loss of coolant accident LPECCS Low-pressure emergency core cooling systems MCP Main circulating pump MCR Main Control Room MCS Minimal cutset MFWP Main feed-water pump MGL Multiple Greek letter NIAEP Nizhny Novgorod Project Institute “Atomenergoproject”, Russia NPP Nuclear power plant NPS Nuclear power station NRC U.S. Nuclear Regulatory Commission NVNPS-5 Novovoronezh NPS Unit 5 PDS Plant damage states PGA Peak ground acceleration PRA Probabilistic risk assessment PWR Pressurized-water reactor RCS Reactor coolant system REA Rosenergoatom Concern, Russia RRI Risk Reduction Interval RY Reactor-year

xiv
ACRONYMS AND ABBREVIATIONS (Continued)
SDS-A Steam dump stations to the atmosphere SDS-C Steam dump stations to the main condenser SEC NRS Scientific and Engineering Center for Nuclear and Radiation Safety of GAN SG Steam generator UO2 Uranium dioxide

1
1. THE BETA PROJECT 1.1 Introduction The joint United States-Russian Federation governmental Gore-Chernomyrdin Commission (GCC), headed by then Vice-President Albert Gore and Premier-Minister Victor Chernomyrdin, was established in 1993 to improve technical cooperation between the U.S. and Russia. The Joint Coordinating Committee on Civilian Nuclear Reactor Safety exists within the boundaries of the GCC. Through the Committee, the U.S. Nuclear Regulatory Commission (NRC) is providing nuclear safety support to the GCC, including supporting the Russian Federal Nuclear and Radiation Safety Authority Gosatomnadzor (GAN). In November 1993, a Memorandum of Meeting between the NRC and GAN identified an initiative to support Russia in performing a probabilistic risk assessment (PRA) of a VVER-1000 nuclear power plant (NPP). Both NRC and GAN recognized that the PRA methodology has had a profound effect on the discipline of nuclear reactor safety in the West. The two agencies agreed on the importance of transferring and applying the method to Russian-designed and -operated reactors so that the results and findings could be used in decision making by those who operate NPPs and those who regulate them. The agencies also decided that an acceptable way to organize the project would be to divide it into various phases, with associated subtasks. GAN indicated that Unit 1 of the Kalinin Nuclear Power Station (KNPS), which is a VVER-l000 (V-338 NPP), would be the subject of analysis. The Memorandum of Meeting, dated November 19, 1994, between NRC and GAN documented this agreement under Priority 8: JOINT DEVELOPMENT OF PROBABILISTIC RISK ASSESSMENT (PRA). In early 1995, the NRC and GAN agreed to work together to perform the PRA under an Implementing Agreement, calling this activity the “BETA Project.” Documentation of the project consists of the following: 1. Procedure Guides for a Probabilistic Risk Assessment, NUREG/CR-6572, Rev. 1, BNL-NUREG-
52534, Rev.1, 2005. 2. Kalinin VVER-1000 Nuclear Power Station Unit 1 PRA, Executive Summary Report. U.S. Nuclear
Regulatory Commission and the Federal Environmental, Industrial and Nuclear Supervision Service of Russia. The joint BETA Project. NUREG/IA-0212, Volume 1, 2005 (this document).
3. Kalinin VVER-1000 Nuclear Power Station Unit 1 PRA. Main Report. Level 1, Internal Initiators. NUREG/IA-0212, Volume 2, Part 1, 2005, Proprietary.
4. Kalinin VVER-1000 Nuclear Power Station Unit 1 PRA. Main Report. Level 2, Internal Initiators. NUREG/IA-0212, Volume 2, Part 2, (including appendices) 2005, Proprietary.
5. Kalinin VVER-1000 Nuclear Power Station Unit 1 PRA. Main Report, Other Events Analysis. NUREG/IA-0212, Volume 2, Part 3, 2005, Proprietary.
1.2 Project General Purpose and Scope The purpose of the BETA Project was to advance the use of PRA in Russia to benefit operating and regulatory organizations. The performance of a PRA at the KNPS would demonstrate the process and its utility to regulators and plant owners. The most important results of this activity were expected to be:

2
• a probabilistic assessment of core damage frequency (CDF) of KNPS Unit 1 • definition of the most important contributors to CDF (particular equipment units, systems, etc.) • recommendations to increase the KNPS safety level (organizational and technical measurements to
increase equipment and system reliability, etc.) • an analytical (computer) PRA model of the unit. More specifically, the study was done for initiating events (IEs) postulated to occur during plant power operation. Analysis within the BETA Project involves different levels of a wide-scope PRA. However, attention focused on PRA Level 1 (systems modeling and CDF assessment), and primarily on malfunctions and failures internal to the plant. Initially it was assumed that, for PRA Levels 2 and 3 (external consequences and risk assessment), a more simplified approach would be used. As the project progressed, participants agreed to limit PRA Level 3 activity to a training course only. Only limited investigations were done for internal fires, floods, and earthquakes. For the Level 2 PRA, accident progression and containment performance were analyzed for the set of plant damage states (PDSs) identified in the accident frequency analysis. The primary objectives of the containment performance evaluation were to provide information to plant personnel and regulatory bodies and to define the influence of accident situation development on containment performance and operator actions. PRA Level 1 was done based on PRA task descriptions presented in the International Atomic Energy Agency (IAEA) safety series report, Procedures for Conducting Probabilistic Safety Assessments of Nuclear Power Plants (Level 1) (Ref. 1.1). NRC developed specific procedure guides for the study, using recent PRA improvements, on every project task, including such areas as fires, flooding, earthquakes, and Level 2 activities. 1.3 Participants and Management The project was managed by jointly assigned representatives of the NRC and GAN, now Rostechnadzor. Consistent with the project’s objectives, most of the PRA was performed by the GAN and other Russian participating organizations. Other than the NRC and GAN, the following are principal contributors to the BETA Project: From the U.S.: • Brookhaven National Laboratory (BNL) • Agency for International Development, which provides the funding for the project From Russia: • Scientific and Engineering Center for Nuclear and Radiation Safety (SEC NRS), the technical support
organization of GAN, located in Moscow • Rosenergoatom Concern (REA), the Russian plant operating organization, located in Moscow • KNPS, located near Udomlya city, 350 km northwest of Moscow • Experimental and Design Office “Hydropress” (EDOGP), the designer of the KNPS Nuclear Steam
Supply System, located 40 km from Moscow • Nizhny Novgorod Project Institute “Atomenergoproject” (NIAEP), the architect-engineer of KNPS,
located 400 km east of Moscow.

3
All these Russia organizations joined in specific Implementing Agreements with the NRC in 1995 to conduct the BETA Project. The project was managed by an Administrative Committee and Technical Steering Group comprising members from the organizations. The Administrative Committee, including project managers from the NRC, BNL, and each Russian organization, met periodically in Moscow to analyze project status and create the working plan for the following year. The Technical Steering Group, including NRC experts and participants from Russian organizations, provided technical supervision of the project. This group was led by two coordinators appointed by and representing NRC and GAN. 1.4 Project Planning The project was organized into four main phases: • Phase I. Project Organization • Phase II. Training, Procedure Guide Development, and Data Gathering • Phase III. Level 1 PRA for Internal IEs (System Modeling and Accident Frequency Analysis) • Phase IV. Fire, Flood, and Seismic Investigations, Level 2 and Level 3 PRA (Containment
Performance Analysis and Risk Assessment). Each phase consisted of a number of tasks that described the specific work, milestones, work products, and associated resources. The NRC and its contractors developed and maintained two “living” documents: General Plan of VVER-1000 PRA (Ref. 1.2) and Detailed Task Description (Ref. 1.3), which were reviewed and approved by both GAN and the NRC. Phases I and II of the project were completed in 1997. Phase III was conducted between June 1996 and summer 2000. Table 1-1 lists all Phase III tasks. In 1998, preliminary results were reviewed by U.S. and independent Russian experts. Section 2 of this summary report presents the results of this phase of the project. Phase IV was carried out from 1999 through 2004. The scope of the Level 2 PRA exceeded the initially planned approach, which had been simplified. Its results are presented in Section 3 of this summary report. Fire, flood and seismic analysis was conducted only in a limited scope, but the work comprised all necessary training and steps of a PRA (see Section 4 of this summary report for results). Table 1-2 lists training courses and technical meetings that took place while conducting the PRA. Other meetings included the yearly meetings of Russian and U.S. project managers, and plant site visits.

4
Table 1-1 BETA Project Phase III Tasks
No. Task Task Title 1 III.A Plant Familiarization and Information Gathering 2 III.B Identification and Selection of Site Sources of Radioactive Releases 3 III.C Determination and Selection of Plant Operating States 4 III.D Definition of Core Damage States or Other Consequences 5 III.E Selection and Grouping of Initiating Events 6 III.F Functional Analysis and Systems Success Criteria 7 III.G Event Sequence Modeling 8 III.H System Modeling 9 III.I Human Reliability Analysis 10 III.J Qualitative Dependence Analysis 11 III.K Assessment of the Frequency of Initiating Events 12 III.L Assessment of Component Reliability 13 III.M Assessment of Common Cause Failure Probabilities 14 III.O Initial Quantification of Accident Sequences 15 III.P Final Quantification of Accident Sequences 16 III.R Interpretation of Results; Importance and Sensitivity Analysis 17 III.S Spatial Interactions 18 III.T Fire Analysis 19 III.U Flood Analysis 20 III.V Seismic Analysis 21 III.W Documentation 22 III.X Initial PRA Analysis (two-month workshop) 23 III.Y PRA Applications Plan
5
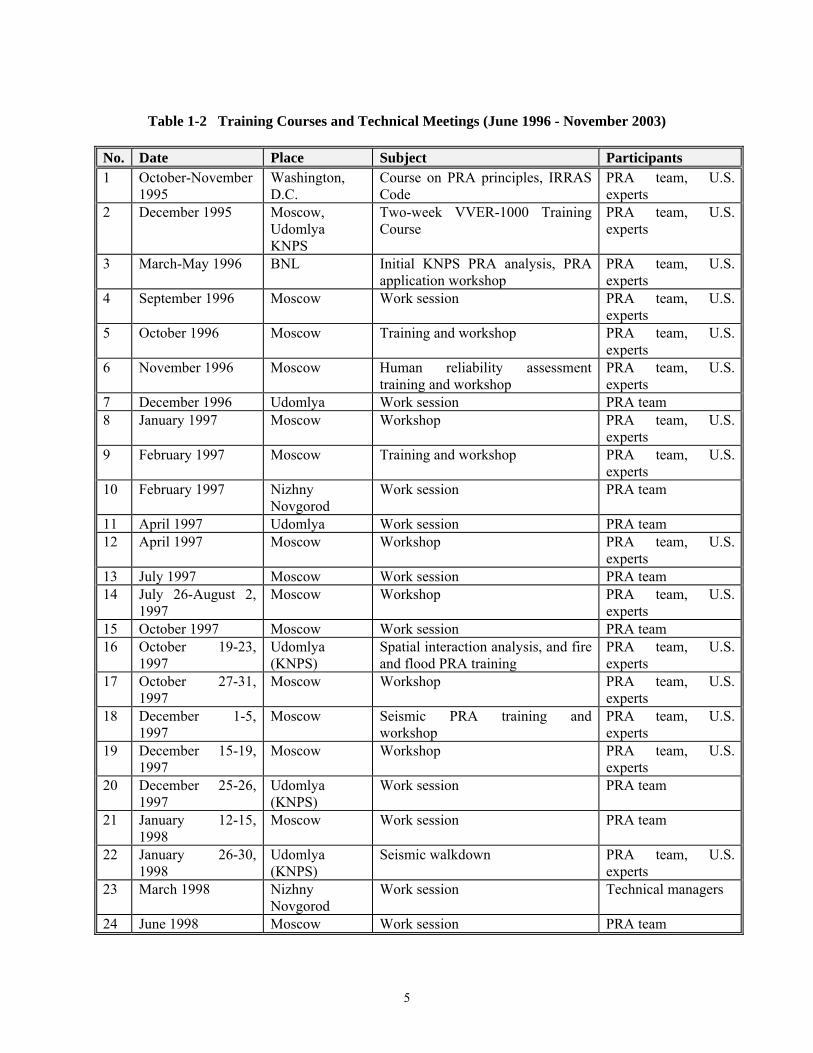
Table 1-2 Training Courses and Technical Meetings (June 1996 - November 2003)
No. Date Place Subject Participants 1 October-November
1995 Washington, D.C.
Course on PRA principles, IRRAS Code
PRA team, U.S. experts
2 December 1995 Moscow, Udomlya KNPS
Two-week VVER-1000 Training Course
PRA team, U.S. experts
3 March-May 1996 BNL Initial KNPS PRA analysis, PRA application workshop
PRA team, U.S. experts
4 September 1996 Moscow Work session PRA team, U.S. experts
5 October 1996 Moscow Training and workshop PRA team, U.S. experts
6 November 1996 Moscow Human reliability assessment training and workshop
PRA team, U.S. experts
7 December 1996 Udomlya Work session PRA team 8 January 1997 Moscow Workshop PRA team, U.S.
experts 9 February 1997 Moscow Training and workshop PRA team, U.S.
experts 10 February 1997 Nizhny
Novgorod Work session PRA team
11 April 1997 Udomlya Work session PRA team 12 April 1997 Moscow Workshop PRA team, U.S.
experts 13 July 1997 Moscow Work session PRA team 14 July 26-August 2,
1997 Moscow Workshop PRA team, U.S.
experts 15 October 1997 Moscow Work session PRA team 16 October 19-23,
1997 Udomlya (KNPS)
Spatial interaction analysis, and fire and flood PRA training
PRA team, U.S. experts
17 October 27-31, 1997
Moscow Workshop PRA team, U.S. experts
18 December 1-5, 1997
Moscow Seismic PRA training and workshop
PRA team, U.S. experts
19 December 15-19, 1997
Moscow Workshop PRA team, U.S. experts
20 December 25-26, 1997
Udomlya (KNPS)
Work session PRA team
21 January 12-15, 1998
Moscow Work session PRA team
22 January 26-30, 1998
Udomlya (KNPS)
Seismic walkdown PRA team, U.S. experts
23 March 1998 Nizhny Novgorod
Work session Technical managers
24 June 1998 Moscow Work session PRA team

6
Table 1-2 Training Courses and Technical Meetings (June 1996 - November 2003) (cont’d) No. Date Place Subject Participants 25 June 1999 Moscow Work session PRA team 26 March 2000 Moscow Work session PRA team 27 March-April 2000 BNL Four-week work session PRA team, U.S.
experts 28 July-August 2002 BNL Three-week workshop, PRA
Level 2 and MELCOR training PRA team, U.S. experts
29 October 2002 Albuquerque, USA
Two-week workshop, PRA Level 2 PRA team, U.S. experts
30 November 2003 Bethesda, USA Three-week workshop and PRA Level 3 training including MACCS code
PRA team, U.S. experts
1.5 BETA Project Personnel The following served as key personnel for the BETA Project: Program Directors: • Mr. Themis Speis (1995-1997), Mr. Thomas King (1997-2001), Mr. Scott Newberry (2001-2003),
Mr. Charles Ader (2003-2005); NRC • Dr. Alexander Matveev, GAN Senior Project Managers: • Mr. Andrew Szukiewicz (1995-1998), Nelson Su (1998), John C. Lane (since 1999); NRC • Mr. Sergei Volkovitskiy, GAN Project Managers: • Dr. David Diamond (1995-1999), John Lehner (since 1999); BNL • Mr. Mikhail Mirochnitchenko, GAN • Mr. Vladimir Khlebtsevich, REA • Dr. Boris Gordon, SEC NRS • Mr. Grigori Aleshin, KNPS • Mr. Vladimir Kats, NIAEP • Dr. Valeri Siriapin, EDOGP U.S. Experts for PRA Level 1 for Internal Events, Fires, and Flooding: • Dr. Dennis Bley, Buttonwood Consulting, Inc. • Dr. David Johnson, PLG, Inc. • Dr. Tsong-Lun Chu, BNL • Dr. Mohammed Ali Azarm, BNL

7
U.S. Experts for Seismic Analysis: • Dr. Yang Park, BNL • Dr. Robert Kennedy • Dr. Robert Campbell • Dr. Jim Xu, BNL U.S. Experts for PRA Level 2 and Level 3 Analysis: • Mr. Mark Leonard, Daycoda, Ltd. • Mr. Nathan Bixler, Sandia National Laboratory • Richard Haaker, AQ Safety, Inc. Core PRA Team Members: • Dr. Eugene Shubeiko, SEC NRS, team leader until March 1998 • Dr. Gennadi Samokhin, SEC NRS, team leader since March 1998 • Ms. Tatiana Berg, SEC NRS • Ms. Valentina Bredova, SEC NRS • Ms. Elena Zhukova, SEC NRS • Mr. Artour Lioubarski, SEC NRS • Mr. Dmitri Noskov, SEC NRS • Mr. Vyacheslav Soldatov, SEC NRS • Mr. Eugene Mironenko, KNPS • Mr. Oleg Bogatov, KNPS • Mr. Maxim Robotaev, KNPS • Mr. Viatcheslav Kudriavtsev, EDOGP • Mr. Vladimir Shein, EDOGP • Mr. Valeri Senoedov, NIAEP • Ms. Svetlana Petrunina, NIAEP • Ms. Ludmila Eltsova, NIAEP • Mr. Alexander Yashkin, NIAEP Technical Assistance: • Ms. Irina Ioudina, SEC NRS • Ms. Irina Andreeva, SEC NRS • Ms. Regina Lundgren, Consultant 1.6 References 1.1 International Atomic Energy Agency. 1992. Procedures for Conducting Probabilistic Safety
Assessments of Nuclear Power Plants (Level 1). IAEA Safety Series No. 50-P-4, International Atomic Energy Agency, Vienna.
1.2 U.S. Nuclear Regulatory Commission. 1995 and subsequent editions. General Plan of VVER-1000
Probabilistic Risk Assessment. Addendum to BETA Project Implementing Agreements. 1.3 U.S. Nuclear Regulatory Commission. 1995 and subsequent editions. Detailed Task Description.
Addendum to BETA Project Implementing Agreements.
8
2. LEVEL 1 PROBABILISTIC RISK ASSESSMENT This section summarizes the results of the Level 1 full-power, internal events portion of the PRA.1 2.1 Features of the Plant Relevant to the Level 1 Probabilistic
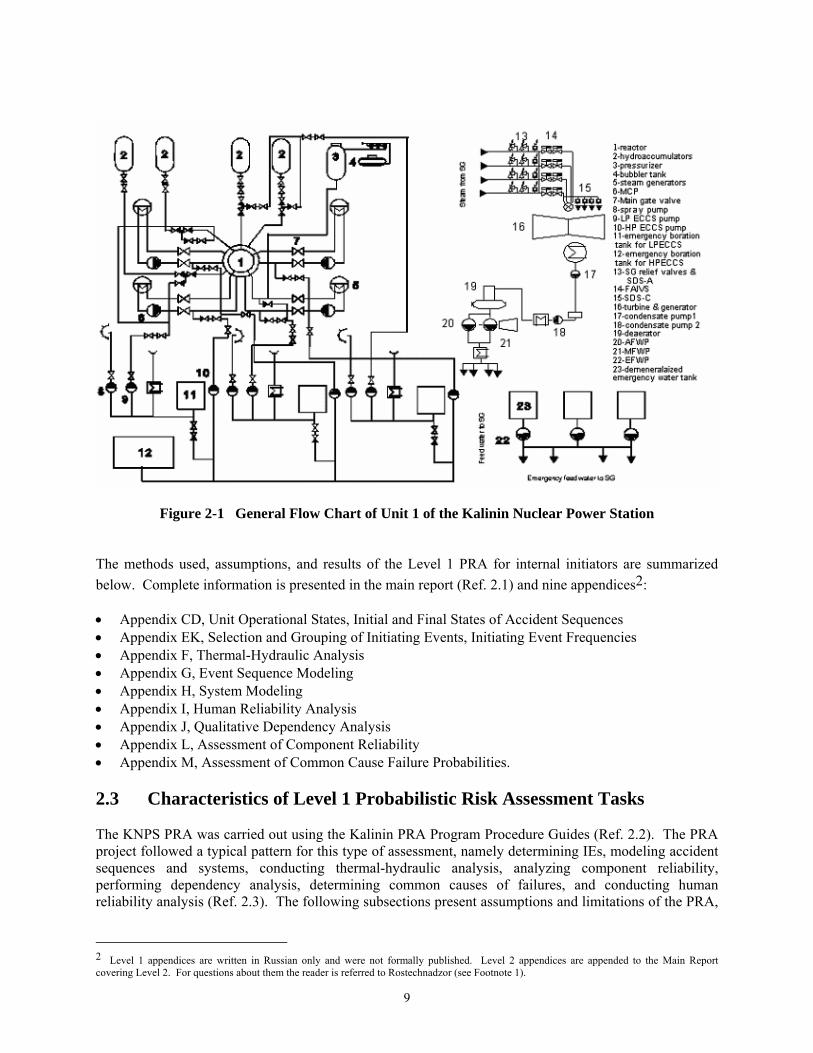
Risk Assessment Unit 1 VVER-1000 of the KNPS (“small series” V-338 design) began operation in May 1984. Life expectancy for the unit is about 30 years. The plant is located north of the Tver region, about 350 km from Moscow. Two lakes, Udomlya and Pesvo, provide cooling water for circulating and service water systems. Another similar reactor power unit operates on the same site as Unit 1. The two units share a common turbine hall, a subsidiary building, an auxiliary building, and an engineering building. The reactors are located in separate reactor buildings. Each KNPS unit has its own pump station to cool turbine condensers and equipment. Electrical power is supplied to the external grid via two power lines at 330 kV and three lines at 750 kV. Unit 1 is a pressurized light-water nuclear reactor, with nominal thermal power of 3000 MW (3210 MW maximum). Coolant pressure at the reactor outlet is 160 kg/cm2, and coolant outlet temperature is 320oC. The core consists of 163 fuel assemblies; 61 have clusters of control rods. Each fuel assembly consists of 312 fuel rods. The fuel is low-enrichment (U-235) uranium dioxide. The fuel mass in the core is about 79,500 kg. The fission chain reaction is controlled by means of absorbing boric carbide rods used in the reactor trip system. These rods are arranged into 10 control groups, depending on their position in the core. The tenth group is the working one (i.e., this group automatically controls the fission chain reaction). KNPS Unit 1 contains two cooling circuits. Figure 2-1 presents a schematic diagram of the primary and secondary circuits and major safety systems. The primary (radioactive) circuit consists of the reactor and four circulating loops. Demineralized water, with controlled boron content, serves as both coolant and moderator. The primary coolant, circulated under pressure through the reactor core, removes heat from the nuclear fuel. A steam-type pressurizer connected with the primary circuit maintains primary coolant pressure. The heat energy is transmitted through four steam generators to the secondary circuit. The secondary cooling circuit includes four horizontal steam generators, where heat transferred from the primary circuit boils water, forming steam that drives the main turbine generator. Condensate from the turbine is returned to the steam generator. The fuel matrix, fuel element cladding, and tightly sealed primary circuit compose three subsequent barriers against the release of radioactive contamination. The sealed containment with all the primary radioactive equipment inside serves as the fourth barrier. One particular feature of the reactor (if compared to later versions of the VVER-1000 unit) is that it contains main isolation valves on primary circulating loops and lacks the connection of the high-pressure emergency core cooling system (HPECCS) to the containment sumps. 2.2 Scope/Objectives By the summer of 2000, the BETA Project team completed a Level 1 PRA for internal events. Only the reactor core was considered a radioactive hazard for a set of initiators occurring when the reactor is operating at power. The freeze date for the PRA is 1997.
1 The detailed report on which this and the other sections of the executive summary report are based is proprietary. Requests for the report may be made to the Federal Environmental, Industrial, and Nuclear Supervision Service of Russia, Rostechnadzor and the U.S. Nuclear Regulatory Commission.
9
Figure 2-1 General Flow Chart of Unit 1 of the Kalinin Nuclear Power Station
The methods used, assumptions, and results of the Level 1 PRA for internal initiators are summarized below. Complete information is presented in the main report (Ref. 2.1) and nine appendices2: • Appendix CD, Unit Operational States, Initial and Final States of Accident Sequences • Appendix EK, Selection and Grouping of Initiating Events, Initiating Event Frequencies • Appendix F, Thermal-Hydraulic Analysis • Appendix G, Event Sequence Modeling • Appendix H, System Modeling • Appendix I, Human Reliability Analysis • Appendix J, Qualitative Dependency Analysis • Appendix L, Assessment of Component Reliability • Appendix M, Assessment of Common Cause Failure Probabilities. 2.3 Characteristics of Level 1 Probabilistic Risk Assessment Tasks The KNPS PRA was carried out using the Kalinin PRA Program Procedure Guides (Ref. 2.2). The PRA project followed a typical pattern for this type of assessment, namely determining IEs, modeling accident sequences and systems, conducting thermal-hydraulic analysis, analyzing component reliability, performing dependency analysis, determining common causes of failures, and conducting human reliability analysis (Ref. 2.3). The following subsections present assumptions and limitations of the PRA,
2 Level 1 appendices are written in Russian only and were not formally published. Level 2 appendices are appended to the Main Report covering Level 2. For questions about them the reader is referred to Rostechnadzor (see Footnote 1).

10
a brief summary of the essential safety features of KNPS Unit 1 incorporated into the PRA, and the major characteristics of the PRA model. 2.3.1 Assumptions and Limitations of the Probabilistic Risk Assessment The prescribed scope of the PRA; available analytical tools, information, and data; and available resources for the analysis led to limitations in the model and the necessity to use assumptions. In general, the following assumptions and limitations applied: • Neither positive nor negative effects of KNPS Unit 2 were analyzed. • It was conservatively assumed that a failure of the reactor emergency protection system would
damage the reactor core. As a result of this assumption, relevant accident sequences were not developed; however, to identify these sequences, their end state was marked anticipated transients without scram (ATWS).
• It was assumed that steaming or flooding of the turbine hall as a result of an accident would cause failure of all electrically driven components (valves and pumps). Running pumps would stop; idle pumps would fail to start, etc.
• The possibility of structural damage of the equipment from thermal impact (e.g., thermal shock and impingement of the steam generator tubes and headers) was not analyzed.
• Seal leakage of the primary main circulating pumps was not modeled because of positive results of a special test, provided by the manufacturer, of the seal in emergency conditions (Ref. 2.6).
• Failure of ruptured pipelines was not presented in the system fault tree (FT) models. These failures were considered IEs.
• Recovery was not modeled as a restoration of components assumed to be unavailable at IEs or failed during accidents. The only exclusion is recovery of offsite power, which is imbedded in the categorization of loss-of-offsite-power data (less than 0.5 hours).
In addition to these general assumptions and limitations, some special assumptions and limitations were used for particular PRA tasks. Some significant examples are the following: • Primary leaks through the two sequential check valves or the two sequential closed valves were
analyzed only for bypass containment loss-of-coolant accident (LOCA) IEs. • The vacuum in the main condenser could be maintained when the condenser ejectors are fed with
steam through the steam dump station of the de-aerator when pressure in the main steam header rises to above 12 bars. Should this be the case, it may be possible to cool down the unit up to the primary pressure, allowing activation of the low-pressure emergency core cooling systems (LPECCS).
• It was assumed that core damage would result from the inability to maintain the reactor in a hot stable state for 24 hours, accompanied by failures of both the make-up system and the HPECCS, which provides boron to the primary circuit required for a cold state.
• For large LOCAs (LLOCAs), it was conservatively assumed that simultaneous failure of containment spray and containment isolation would lead to loss of primary coolant that could not be compensated for and to drying out and damage of the core.
• If, during an accident, a required component successfully received an automatic signal to begin operation, the model did not consider the failure mode “erroneous position before the IE of the component.”
• The study did not include a failure mode caused by spontaneous change in valve position for valves whose position was continuously monitored.
• Malevolent behavior, such as deliberate acts of sabotage, was not considered.

11
Realism in event sequence models was maintained to the extent possible, and results of the PRA were reviewed by NRC experts to be logical and reasonable. Nevertheless, some conservative assumptions were made, mostly in scenarios involving small contributions to core damage. 2.3.2 Kalinin Nuclear Power Station Safety Functions and Safety Systems Table 2-1 summarizes major safety functions and safety systems of KNPS Unit 1 incorporated in the PRA. 2.3.3 Determination of Initiating Events and Frequency The team used the following definition of an IE:
An initiating event creates disturbances in power unit operation and demands activation automatically or by operating personnel of emergency reactor trip and/or other safety systems, or it is an event that directly causes reactor core damage.
The initiators of interest in this study are those referred to as internal IEs and are associated with malfunctioning or failure of plant systems, operator errors, or failures in electrical distribution devices. One external IE group was also considered: the loss of electrical power supply for various durations. The list of IEs was based on the generalized list of IEs for nuclear power stations with VVER reactors, recommended by the IAEA (Ref. 2.4). Some events were added and some modified or excluded according to the specifics for Unit 1. Particular IEs were grouped so that one representative IE resulted in the most severe outcome of accident progression (conservative approach). The same system success criteria and the same specific boundary conditions (requirements with regard to personnel actions, automatic operation of the systems, availability of the equipment, etc.) were attributed to an IE group. Each group was modeled by a set of event trees (ETs) and FTs. The PRA model considered 130 IEs and 40 groups. The IE groups are presented in Table 2-6. Sources of information were the following: • KNPS Units 1 and 2 operational data for 1984 to 1996 (overall operating time of 16.4 reactor-years) • data for Russian NPSs for 1988 to 1995 and Ukrainian VVER NPSs for 1988 to 1991 (overall
operating time of 120 reactor-years) • generic IE frequencies from IAEA publications (Ref. 2.4 and Ref. 2.5) and from other VVER PRAs
(Ref. 2.6). The team used a Bayesian evaluation method to estimate frequencies of IEs with limited specific statistical data obtained at Units 1 and 2 of the KNPS and generic data for other VVER design units. For IEs that never occurred at Russian NPSs, the team estimated the frequency based on international operating time data as well as available engineering techniques and modeling. To assess the frequency of some IEs, the team developed special FT models (in particular, for IEs “loss of service water system,” “spurious opening of several steam dump stations to atmosphere,” and “spurious closing of several primary main isolation valves.” Therefore, calculations for common cause failure (CCF) of support systems as IEs may be conservative. The team also used a lognormal probability distribution function of IE frequencies to estimate uncertainty parameters in each case.

12
Table 2-1 Kalinin Nuclear Power Station Unit 1 Safety Functions and Systems
Safety Functions and Safety Systems Description
Reactivity Control Control rods 61 rods in one mechanical system Make-up boron injection pumps 3 High-pressure safety injection (HPSI) 3 centrifugal pumps plus 3 piston
pumps Reactor Coolant System Overpressure Protection Power-operated relief valves 3 Containment Overpressure Protection Spray system 3 centrifugal pumps Primary Coolant Injection HPSI 3 centrifugal pumps plus 3 piston
pumps LPECCS 3 centrifugal pumps Hydroaccumulators (HAs) 4 Decay Heat Removal Emergency feed-water pumps (FWPs) 3 motor-driven pumps Steam dump station to atmosphere (SDS-A) 4 Auxiliary FWPs 2 motor-driven pumps Steam dump station to condenser (SDS-C) 4 LPECCS 3 centrifugal pumps Emergency Power Supply Batteries 3 emergency plus 1 common Diesel generators 3 trains
2.3.4 Accident Sequence Modeling The PRA model represents the set of accident sequences following the IEs up to the end state of each sequence. The team used an approach called “large event trees - large fault trees” in modeling. Under this approach, ETs took into account the maximum number of possible cause-consequence relationships and used time-dependent logic to develop the accident sequences. In addition, many of the large ETs employed special transfer ET logic in their development. The end states of accident sequences were divided into two main categories: “successful” and “unsuccessful.” The end state of an accident sequence was considered successful when the shutdown unit reached a steady and safe condition within 24 hours of the IE and the degree of core damage did not exceed the limits established for design basis accidents. The 24-hour period could be extended if another event (e.g., exhaustion of the coolant, fuel, oil, compressed gases, etc., and impossibility of renewing supplies) might jeopardize that success. The 24-hour period might be immaterial if accelerating adverse physical processes resulted in an unsuccessful end state. Unit cold shutdown and hot shutdown were considered steady and safe conditions. A temperature of greater than 1200ºC for fuel element cladding, established for design accidents of VVER-1000 reactors, was considered a criterion for an unsuccessful end state of accident sequences. In addition, if a successful end state could not be sufficiently substantiated in the model, the end state was “conservatively” considered unsuccessful.
13
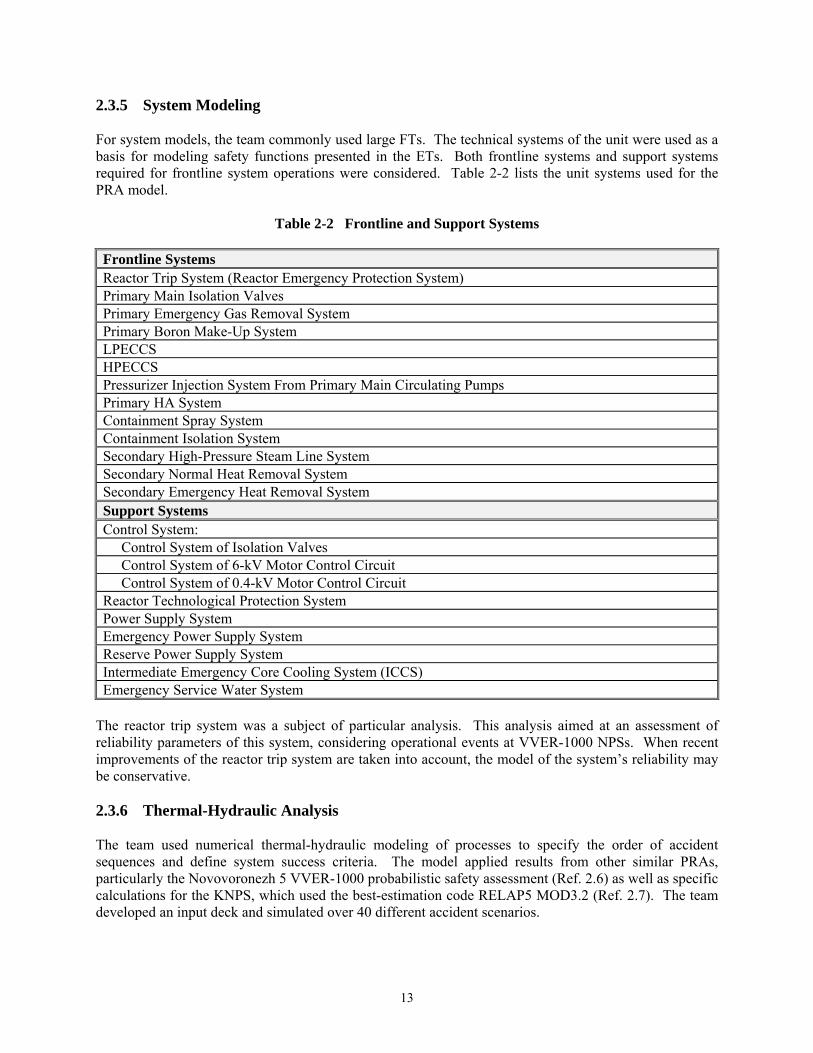
2.3.5 System Modeling For system models, the team commonly used large FTs. The technical systems of the unit were used as a basis for modeling safety functions presented in the ETs. Both frontline systems and support systems required for frontline system operations were considered. Table 2-2 lists the unit systems used for the PRA model.
Table 2-2 Frontline and Support Systems Frontline Systems Reactor Trip System (Reactor Emergency Protection System) Primary Main Isolation Valves Primary Emergency Gas Removal System Primary Boron Make-Up System LPECCS HPECCS Pressurizer Injection System From Primary Main Circulating Pumps Primary HA System Containment Spray System Containment Isolation System Secondary High-Pressure Steam Line System Secondary Normal Heat Removal System Secondary Emergency Heat Removal System Support Systems Control System: Control System of Isolation Valves Control System of 6-kV Motor Control Circuit Control System of 0.4-kV Motor Control Circuit Reactor Technological Protection System Power Supply System Emergency Power Supply System Reserve Power Supply System Intermediate Emergency Core Cooling System (ICCS) Emergency Service Water System
The reactor trip system was a subject of particular analysis. This analysis aimed at an assessment of reliability parameters of this system, considering operational events at VVER-1000 NPSs. When recent improvements of the reactor trip system are taken into account, the model of the system’s reliability may be conservative. 2.3.6 Thermal-Hydraulic Analysis The team used numerical thermal-hydraulic modeling of processes to specify the order of accident sequences and define system success criteria. The model applied results from other similar PRAs, particularly the Novovoronezh 5 VVER-1000 probabilistic safety assessment (Ref. 2.6) as well as specific calculations for the KNPS, which used the best-estimation code RELAP5 MOD3.2 (Ref. 2.7). The team developed an input deck and simulated over 40 different accident scenarios.

14
2.3.7 Component Reliability Assessment Component reliability assessment started with a list of system components based on modeled safety functions. The team then collected information on systems control, operation, and maintenance and inspections. Failure modes for each component were then identified, with the following modes considered: • failure to start • failure to run • unavailability because of maintenance or repair • CCF • human error. The PRA model includes a total of 114 mechanical-type components, as well as electrical and control components. Because of insufficient statistical data from the KNPS for the 1993-to-1996 time period, the Bayesian updating process was used to estimate component reliability parameters. A priori distribution of the parameters was inferred from the comprehensive analysis of data available from previous VVER-1000 PRAs (so-called “generic data”). These generic data were based primarily on the results of 26 years of operation of Balakovo NPS Units 1 to 4 VVER-1000s. In addition, for some equipment, IAEA data (Ref. 2.8) and U.S. nuclear industry data (Ref. 2.9) served as input. Generic data for electrical and control components were applied because of lack of plant-specific failure rate data for electrical equipment. A special analysis estimated the inability to remove heat from the reactor core because containment sumps were clogged. This accident involves the injection of shredded pieces of primary insulation into the containment sump strainers and core as a result of loss of primary coolant. The modeled event was called “sump clogging.” The experiments carried out at Zaporozhye Unit 5 and South-Ukrainian Unit 3 VVER-1000s have unequivocally shown the possibility of those consequences (Ref. 2.6). The following probabilities of sump clogging were used in the Kalinin PRA model: • for a maximum double-sided LOCA (D = 850 mm) – 0.95 • for a LLOCA (150 mm < D < 300 mm) – 0.15 • for a medium LOCA (70 mm < D < 150 mm) – 0.05 • for a small LOCA (25 mm < D < 70 mm) – 0.001. These sump clogging probabilities were used as conservative estimates based on interpretation of the available experimental data. 2.3.8 Dependency Analysis Within the PRA, a special task analyzed possible dependencies between events, systems, and components and grouped those dependencies into two categories: • direct functional dependencies and support system dependencies explicitly modeled in the ETs and
FTs • dependent events and failures that occurred in practice but whose interrelations could not be
presented in the model as functional dependencies or dependencies from support systems (CCF and developing failures, which change the mode of operation in such a manner that other equipment fails).
15
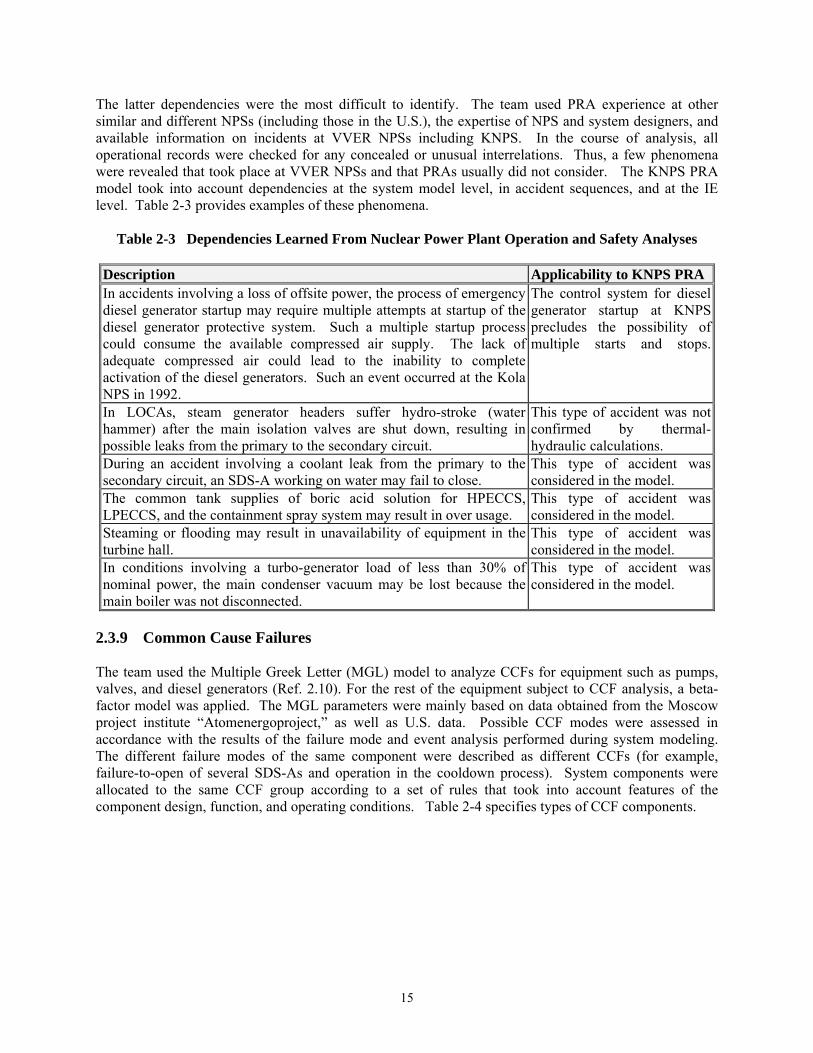
The latter dependencies were the most difficult to identify. The team used PRA experience at other similar and different NPSs (including those in the U.S.), the expertise of NPS and system designers, and available information on incidents at VVER NPSs including KNPS. In the course of analysis, all operational records were checked for any concealed or unusual interrelations. Thus, a few phenomena were revealed that took place at VVER NPSs and that PRAs usually did not consider. The KNPS PRA model took into account dependencies at the system model level, in accident sequences, and at the IE level. Table 2-3 provides examples of these phenomena.
Table 2-3 Dependencies Learned From Nuclear Power Plant Operation and Safety Analyses Description Applicability to KNPS PRA In accidents involving a loss of offsite power, the process of emergency diesel generator startup may require multiple attempts at startup of the diesel generator protective system. Such a multiple startup process could consume the available compressed air supply. The lack of adequate compressed air could lead to the inability to complete activation of the diesel generators. Such an event occurred at the Kola NPS in 1992.
The control system for diesel generator startup at KNPS precludes the possibility of multiple starts and stops.
In LOCAs, steam generator headers suffer hydro-stroke (water hammer) after the main isolation valves are shut down, resulting in possible leaks from the primary to the secondary circuit.
This type of accident was not confirmed by thermal-hydraulic calculations.
During an accident involving a coolant leak from the primary to the secondary circuit, an SDS-A working on water may fail to close.
This type of accident was considered in the model.
The common tank supplies of boric acid solution for HPECCS, LPECCS, and the containment spray system may result in over usage.
This type of accident was considered in the model.
Steaming or flooding may result in unavailability of equipment in the turbine hall.
This type of accident was considered in the model.
In conditions involving a turbo-generator load of less than 30% of nominal power, the main condenser vacuum may be lost because the main boiler was not disconnected.
This type of accident was considered in the model.
2.3.9 Common Cause Failures The team used the Multiple Greek Letter (MGL) model to analyze CCFs for equipment such as pumps, valves, and diesel generators (Ref. 2.10). For the rest of the equipment subject to CCF analysis, a beta-factor model was applied. The MGL parameters were mainly based on data obtained from the Moscow project institute “Atomenergoproject,” as well as U.S. data. Possible CCF modes were assessed in accordance with the results of the failure mode and event analysis performed during system modeling. The different failure modes of the same component were described as different CCFs (for example, failure-to-open of several SDS-As and operation in the cooldown process). System components were allocated to the same CCF group according to a set of rules that took into account features of the component design, function, and operating conditions. Table 2-4 specifies types of CCF components.

16
Table 2-4 Components Considered in Common Cause Failure Analysis
Component Type System Accumulator batteries DC Power DC breaker DC Power Emergency diesel generator Emergency AC Power Heat exchanger Containment Spray
Auxiliary Feed-Water Containment Spray Service Water HPECCS LPECCS
Motor-driven pump
Primary Make-Up High-Pressure Steam Lines Containment Spray Service Water LPECCS HAs HPECCS Primary Emergency Gas Removal
Motor-driven isolation valve
Primary Make-Up Steam-driven fast-acting isolation valve High-Pressure Steam Lines Motor-driven main steam isolation valve High-Pressure Steam Lines SDS-A High-Pressure Steam Lines SDS-C High-Pressure Steam Lines
HPECCS LPECCS Containment Spray HAs
Check valve
Primary Make-Up Sensor Control Relay Control
2.3.10 Human Reliability Analysis The team applied procedures corresponding to IAEA Safety Series 50-P-10 (Ref. 2.11) to conduct a human reliability analysis (HRA). Only post-initiator errors by unit personnel were modeled. The analysis of maintenance/repair procedures for safety-related systems confirmed a very low probability of pre-accident personnel errors; thus, these errors were not included in the model. Errors that were IEs or part of IEs were analyzed and quantified during IE analysis and not included in the HRA. To save resources, a limited number of significant actions were subjected to a detailed logical and numerical analysis using the decision tree method (Ref. 2.12). Other human errors were conservatively assessed using an expert screening process.

17
The team used the following parameters for the decision tree: • time available • quality of the human-machine interface • influence of the scenario • complexity of decision-making. Dependencies between personnel actions were also analyzed. A list of modeled personnel actions was compiled in the course of ET development. Basic events representing the probabilities of human errors were included into the system FTs. Special logical switches called “house events” were included in the FTs to take into account the specific features of IEs. The switches were activated during PRA model calculation by means of variable change sets. The PRA model presented 28 groups of typical human actions (Ref. 2.1) of varying complexity. Each group of human actions can include a varying number of basic human action events, depending on the IE and conditions of performance. 2.3.11 Characteristics of the Probabilistic Risk Assessment Model The SAPHIRE computer code (Ref. 2.13) was used to develop and run the PRA model. At the request of the NRC, Idaho National Engineering and Environmental Laboratory in the U.S. developed the code. The code can create and analyze ET and FT logic models using a personal computer. Quantitative characteristics of the PRA model are as follows: • The number of IE groups is 40. • Seventy safety functions are presented in 107 ETs, 40 of which are considered “main” (i.e., they
begin with an IE) and 67 of which are considered auxiliary (i.e., they continue the logic of one or several main ETs).
• Of the 6,198 basic events, 371 represent human errors (including 101 for dependent actions) and 1,038 are CCF events.
The probability of reactor core damage was calculated for accident sequences having a probability greater than 1E-9. This limit was selected based on specific analysis of the stability of total CDF values. No restrictions were placed on the number of elements in one minimal cutset (MCS). SAPHIRE allowed selection of appropriate “change and flag sets” (the set of data regarding specific boundary conditions for a particular accident sequence) in calculations for each group of IEs. Special algorithms were applied to account for dependencies in human errors and actual maintenance procedures. 2.4 Results and Conclusions The results of the internal events Level 1 PRA provide a risk profile of Unit 1 of the KNPS and are summarized below. 2.4.1 Core Damage Frequency and Parametric Uncertainty The point estimation assessment of total CDF for a complete set of IE groups is 2.39E-4 per reactor per year (1/RY), including ATWS. Table 2-5 provides some more details regarding input of five IE categories (generalized IE groups) and contribution from the ATWS sequences. The table also presents results of parametric uncertainty analysis, determined by the uncertainty of parameters of basic event models. The

18
analysis was performed on 10,000 samples by statistical trials (Monte Carlo simulation) using SAPHIRE. The total CDF value is between 9.47E-5 and 5.33E-4, with a confidence of 90%.
Table 2-5 Results of Parametric Uncertainty Analysis of Core Damage Frequency (1/RY)
Parametric Uncertainty
IE Categories Point Estimate
5% (Lower) Value
50% (Median)
Value
Mean Value
95% (Upper) Value
CDF from primary LOCA inside containment 1.38E-4 3.43E-5 1.01E-4 1.45E-4 3.77E-4
CDF from transients 8.48E-5 2.64E-5 6.39E-5 8.65E-5 2.18E-4 CDF from leaks in secondary circuit 7.39E-6 1.85E-6 4.89E-6 7.49E-6 1.95E-5 CDF from leaks from primary to secondary circuit 6.64E-6 9.74E-7 4.15E-6 6.67E-6 2.07E-5
CDF from leaks in primary circuit outside containment 1.09E-6 3.50E-7 9.36E-7 1.14E-6 2.60E-6
Total CDF (including ATWS) 2.39E-4 9.47E-5 1.98E-4 2.46E-4 5.33E-4
CDF from all ATWS sequences 3.24E-5 1.87E-6 1.30E-5 3.40E-5 1.18E-4
Figure 2-2 shows relative contributions of the IE groups to CDF. The ordering of IE category contributors to the CDF indicates that core damage risk at the KNPS is dominated by primary system LOCAs inside containment and by transient events, which together account for nearly 93.5% of the CDF. Table 2-6 presents CDF contributions of all IE groups considered in the PRA. As discussed above, the major IE categories are “Primary LOCAs inside containment,” comprising 57.5% of the total CDF, and “Transients,” contributing 36% of total CDF. The CDF results include the contribution of ATWS sequences. In the “Primary system inside containment LOCAs” IE category, the IE groups involving double-sided breaks of 850-mm-diameter pipe contribute approximately 28% to the CDF. As is described below, this feature of the results is caused to a large extent by the influence of the “sump clogging” phenomenon. “Small break LOCA (25 mm<D<70 mm)” is a relatively small contributor, and its CDF contribution is not influenced greatly by sump clogging. In the absence of sump clogging, the major LOCA contributor would be the “Spurious opening of pressurizer safety valves” initiator. In the “Transients” category, the dominant contributor is “Loss of offsite power for more than 0.5 hours,” with a CDF contribution of 10.2% to total CDF. “Secondary steam line breaks,” “Primary breaks outside containment,” and “Primary to secondary leaks” are relatively small contributors to CDF. This small contribution is associated with the high reliability of the decay heat removal systems.

19
Figure 2-2 Contribution of Initiating Event Groups to Total Core Damage Frequency
Primary to secondary LOCAs
2.8%
Secondary side leaks3.1%
Transients36%
Primary LOCAs inside containment
57.5%
Primary side leaks outside
containment0.5%

20
Table 2-6 Input of Initiating Events to Core Damage Frequency
IE Groups
Frequency of an IE Group, 1/RY
CDF, 1/RY
CDF Fraction
Primary LOCAs Inside Containment 1.38E-4 5.75E-1 Double-sided LOCA (D = 850 mm) on loop #1, 2, or 3 that cannot be isolated
5.20E-5 4.51E-5 2.07E-1
Double-sided LOCA (D = 850 mm) on loop #4 that cannot be isolated with dependent failure of one LPECCS train
1.80E-5 1.73E-5 7.24E-2
Spurious opening of pressurizer safety valves 4.24E-2 1.95E-5 8.15E-2 Medium LOCA (70 mm < D < 150 mm) with dependent failure of one HPECCS train
2.63E-4 1.39E-5 5.82E-2
LLOCA (150 mm < D < 300 mm) 6.00E-5 1.08E-5 4.50E-2 LLOCA (150 mm < D < 300 mm) with dependent failure of one HA train and one LPECCS train
5.50E-5 8.84E-6 3.70E-2
Small LOCA (25 mm < D < 70 mm) 2.55E-3 8.62E-6 3.60E-2 Double-sided LOCA (D = 850 mm) on loop #4 that can be isolated with dependent failure of LPECCS train
5.50E-6 9.67E-7 4.04E-3
Medium LOCA (70 mm < D < 150 mm) 8.75E-5 4.63E-6 1.93E-2 LLOCA (150 mm < D < 300 mm) with dependent failure of one LPECCS train
1.80E-5 2.80E-6 1.17E-2
Double-sided LOCA (D = 850 mm) on loop #1, 2, or 3 that can be isolated
1.66E-5 6.06E-7 2.50E-3
Very large LOCA 1.00E-7 1.00E-7 4.18E-4 Transients 8.61E-5 3.60E-1 Loss of offsite power for more than 0.5 hours 1.13E-2 2.44E-5 1.02E-1 Closing of turbine stop valves 7.09E-1 1.28E-5 5.37E-2 Switching off of both main FWPs 2.86E-1 8.79E-6 3.68E-2 Loss of forced circulation in primary circuit 4.29E-1 8.42E-6 3.52E-2 General transient leading to reactor trip and switching off of all main circulation pumps
3.32E-1 6.45E-6 2.70E-2
Complete loss of power supply to the unit 6.11E-6 6.11E-6 2.55E-2 General transient leading to reactor trip 2.87E-1 5.16E-6 2.16E-2 Break of feed-water pipelines 8.94E-2 3.88E-6 1.62E-2 Spurious activation of reactor trip 7.67E-1 3.56E-6 1.49E-2 Loss of offsite power for less than 0.5 hours 4.96E-2 2.18E-6 9.12E-3 Administrative hot shutdown 1.06E+0 1.62E-6 6.79E-3 Administrative cold shutdown 2.10E-1 9.11E-7 3.80E-3 Spurious closing of all primary isolation valves 8.90E-7 8.90E-7 3.72E-3 Uncontrollable water injection into pressurizer 2.55E-3 9.80E-8 4.10E-4 Administrative cold shutdown when safety system trains are unavailable
5.40E-5 8.08E-7 3.38E-3
Spurious closing of secondary fast-acting isolation valves in all steam lines
9.70E-4 1.31E-8 5.47E-5

21
Table 2-6 Input of Initiating Events to Core Damage Frequency (cont’d)
IE Groups
Frequency of an IE Group, 1/RY
CDF, 1/RY
CDF Fraction
Secondary Steam Line Leaks 7.45E-6 3.12E-2 Spurious opening of more than one steam generator safety valve 8.10E-4 2.29E-6 9.58E-3 Small steam line leak (D < 150 mm) inside containment that cannot be isolated
3.37E-2 2.23E-6 9.32E-3
Spurious opening of more than one SDS-A 8.03E-3 1.73E-6 7.23E-3 Large steam line leak (D > 150 mm) outside containment that cannot be isolated
1.05E-4 5.37E-7 2.24E-3
Small steam line leak (D < 150 mm) outside containment that cannot be isolated
8.03E-3 2.39E-7 1.02E-3
Large steam line leak (D > 250 mm) that can be isolated 2.27E-4 2.20E-7 9.21E-4 Small steam line leak (D < 250 mm) that can be isolated 8.03E-3 1.79E-7 7.50E-4 Large steam line leak (D > 150 mm) inside containment that cannot be isolated
5.93E-5 2.89E-8 1.21E-4
Primary LOCAs Outside Containment 1.13E-6 4.73E-3 Medium LOCA outside containment that can be isolated 1.60E-3 1.13E-6 4.73E-3 Leaks from Primary to Secondary Circuit 6.74E-6 2.82E-2 Medium LOCA from primary to secondary 2.00E-3 3.93E-6 1.64E-2 Small LOCA from primary to secondary 5.00E-3 2.71E-6 1.12E-2 Break of steam generator header 1.00E-7 1.00E-7 4.18E-4 Total (for all IEs): 2.39E-4 1.0
Table 2-7 presents the top ten major MCSs and accident sequence contributors to CDF. An MCS represents the set of basic component or human error failures that lead to a core damage end state. These sequences characterize in more detail the failures that lead to the IE CDF contributions. The results demonstrate the significance of the sump clogging phenomenon, which leads to core damage for large and medium LOCAs as a result of inability to return flow to the core. Table 2-7 also shows the contribution of several sequences of reactor trip system failures that lead to ATWS and, by assumption, to core damage end states. The significant role of CCF of the three diesel generators in the “Loss of offsite power” IE is also demonstrated in the table.

22
Table 2-7 Minimal Cutsets of the Most Significant Accident Sequences
No. IE Group
[IE, Cutset and Sequence Code]
Accident Sequence
Cumulative Percent of Total CDF,
%
Percent of Total CDF, %
Frequency, 1/RY
1 “Double-sided LOCA (D = 850 mm) on loop #1, 2, or 3 that cannot be isolated” [IE->850, LPECSUMP850DTBSV, Seq->850, 2]
Containment sump clogs at double-sided LOCA (D = 850 mm) on primary loop #1, #2, or #3 that cannot be isolated. Note: Sump clogging makes it impossible to provide coolant to the reactor vessel and remove heat from the core.
20.3 20.3 4.940E-5
2 “Double-sided LOCA (D = 850 mm) on loop #4 that cannot be isolated with dependent failure of one LPECCS train” [IE->850Z, LPECSUMP850DTBSV, Seq->850Z, 2]
Containment sump clogs at double-sided LOCA (D = 850 mm) on primary loop #4 with dependent failure of one LPECCS train. See note on Item 1.
27.4 7.0 1.710E-5
3 “Medium LOCA (70 mm < D < 150 mm) with dependent failure of one HPECCS train” [IE->S3Z, LPECSUMPMLDT1BSV, Seq->S3Z, 1-2]
Containment sump clogs at medium LOCA (70 mm < D < 150 mm) that cannot be isolated, with dependent failure of one HPECCS train. See note on Item 1.
32.8 5.4 1.315E-5
4 “Closing of turbine stop valves” [IE->SVTG, EPSBBEVENT, Seq->SVTG, 54]
Reactor trip system fails when a turbine generator steam stop valve closes spuriously. As for all ATWS, it is assumed the end state is core damage.
36.7 3.9 6.791E-6
5 “Large LOCA (150 mm < D < 300 mm)” [IE->S4, LPECSUMPLLDT1BSV, Seq->S4, 02]
Containment sump clogs at large LOCA (150 mm < D < 300 mm) on primary circuit inside containment, which cannot be isolated. See note on Item 1.
40.4 3.7 9.000E-6
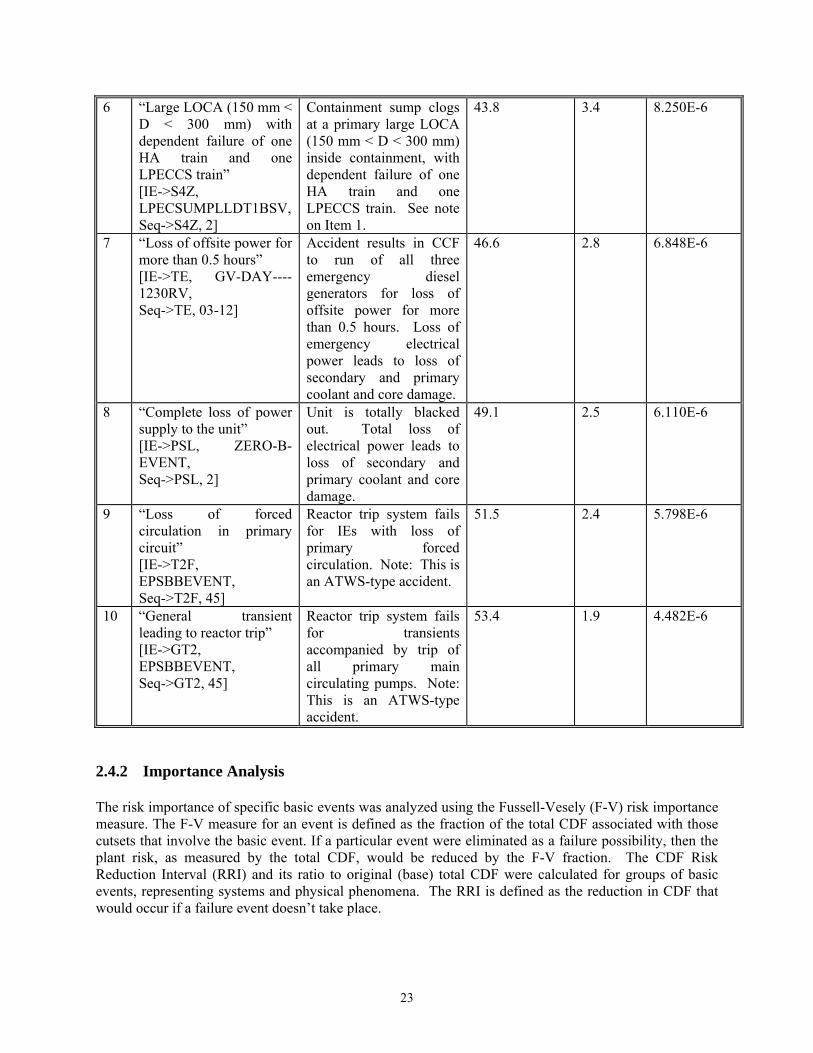
23
6 “Large LOCA (150 mm < D < 300 mm) with dependent failure of one HA train and one LPECCS train” [IE->S4Z, LPECSUMPLLDT1BSV, Seq->S4Z, 2]
Containment sump clogs at a primary large LOCA (150 mm < D < 300 mm) inside containment, with dependent failure of one HA train and one LPECCS train. See note on Item 1.
43.8 3.4 8.250E-6
7 “Loss of offsite power for more than 0.5 hours” [IE->TE, GV-DAY----1230RV, Seq->TE, 03-12]
Accident results in CCF to run of all three emergency diesel generators for loss of offsite power for more than 0.5 hours. Loss of emergency electrical power leads to loss of secondary and primary coolant and core damage.
46.6 2.8 6.848E-6
8 “Complete loss of power supply to the unit” [IE->PSL, ZERO-B-EVENT, Seq->PSL, 2]
Unit is totally blacked out. Total loss of electrical power leads to loss of secondary and primary coolant and core damage.
49.1 2.5 6.110E-6
9 “Loss of forced circulation in primary circuit” [IE->T2F, EPSBBEVENT, Seq->T2F, 45]
Reactor trip system fails for IEs with loss of primary forced circulation. Note: This is an ATWS-type accident.
51.5 2.4 5.798E-6
10 “General transient leading to reactor trip” [IE->GT2, EPSBBEVENT, Seq->GT2, 45]
Reactor trip system fails for transients accompanied by trip of all primary main circulating pumps. Note: This is an ATWS-type accident.
53.4 1.9 4.482E-6
2.4.2 Importance Analysis The risk importance of specific basic events was analyzed using the Fussell-Vesely (F-V) risk importance measure. The F-V measure for an event is defined as the fraction of the total CDF associated with those cutsets that involve the basic event. If a particular event were eliminated as a failure possibility, then the plant risk, as measured by the total CDF, would be reduced by the F-V fraction. The CDF Risk Reduction Interval (RRI) and its ratio to original (base) total CDF were calculated for groups of basic events, representing systems and physical phenomena. The RRI is defined as the reduction in CDF that would occur if a failure event doesn’t take place.

24
Tables 2-8 and 2-9 present risk importance measures of the most significant basic component failure (unavailability) events and human error events. Figure 2-3 shows RRIs defined by different issues. As shown in the figure, accident sequences relating to sump clogging contribute 41.2% to total CDF (RRI ratio to total CDF). The RRI from random failures of components is 4.95E-5 (ratio to base CDF is 19.9%). The ratio of RRI for CDF of failure to close of SDS-Cs is 6.12%. This contribution is primarily a result of conservative modeling of the accident sequences dealing with failure to close the SDS-C and simplified modeling of the SDS-C system. The contribution to CDF can be improved by taking into account such possible recovery actions of the unit personnel as manual (remote) closing of failed SDS-Cs or closing of the SDS-Cs at their location. The RRI for CDF from CCF of components is 4.81E-5 (ratio to base CDF is 19.7%). The greatest contribution to CDF comes from a CCF of diesel generators to run and to start (ratio to base CDF is 6.62%). The RRI for CDF from human errors is 3.68E-5 (ratio to base CDF is 15.1%). If sump clogging is excluded, personnel errors represent 25.7% of the RRI ratio to base CDF. The RRI for CDF from reactor trip system failures is 3.24E-5 (ratio to base CDF is 13.3%). As stated above, lack of results from realistic consequence analysis of these sequences led to the conservative assumption that ATWS is a type of core damage. The RRI for CDF from unavailability of equipment during repairs and scheduled maintenance is 1.09E-5 (ratio to base CDF is 4.5%). Of this unavailability, 35% is caused by scheduled maintenance and 65% by repairs.
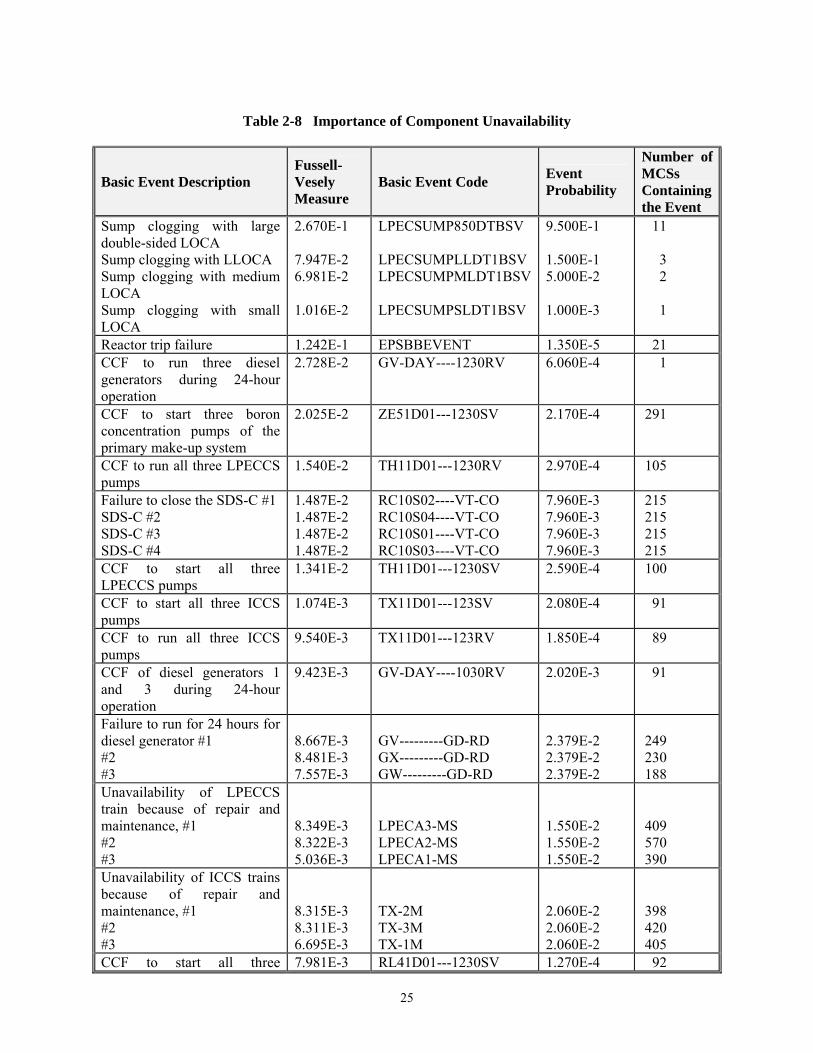
25
Table 2-8 Importance of Component Unavailability
Basic Event Description Fussell-Vesely Measure
Basic Event Code Event Probability
Number of MCSs Containing the Event
Sump clogging with large double-sided LOCA Sump clogging with LLOCA Sump clogging with medium LOCA Sump clogging with small LOCA
2.670E-1 7.947E-2 6.981E-2 1.016E-2
LPECSUMP850DTBSV LPECSUMPLLDT1BSV LPECSUMPMLDT1BSV LPECSUMPSLDT1BSV
9.500E-1 1.500E-1 5.000E-2 1.000E-3
11
3 2
1
Reactor trip failure 1.242E-1 EPSBBEVENT 1.350E-5 21 CCF to run three diesel generators during 24-hour operation
2.728E-2 GV-DAY----1230RV 6.060E-4 1
CCF to start three boron concentration pumps of the primary make-up system
2.025E-2 ZE51D01---1230SV 2.170E-4 291
CCF to run all three LPECCS pumps
1.540E-2 TH11D01---1230RV 2.970E-4 105
Failure to close the SDS-C #1 SDS-C #2 SDS-C #3 SDS-C #4
1.487E-2 1.487E-2 1.487E-2 1.487E-2
RC10S02----VT-CO RC10S04----VT-CO RC10S01----VT-CO RC10S03----VT-CO
7.960E-3 7.960E-3 7.960E-3 7.960E-3
215 215 215 215
CCF to start all three LPECCS pumps
1.341E-2 TH11D01---1230SV 2.590E-4 100
CCF to start all three ICCS pumps
1.074E-3 TX11D01---123SV 2.080E-4 91
CCF to run all three ICCS pumps
9.540E-3 TX11D01---123RV 1.850E-4 89
CCF of diesel generators 1 and 3 during 24-hour operation
9.423E-3 GV-DAY----1030RV 2.020E-3 91
Failure to run for 24 hours for diesel generator #1 #2 #3
8.667E-3 8.481E-3 7.557E-3
GV---------GD-RD GX---------GD-RD GW---------GD-RD
2.379E-2 2.379E-2 2.379E-2
249 230 188
Unavailability of LPECCS train because of repair and maintenance, #1 #2 #3
8.349E-3 8.322E-3 5.036E-3
LPECA3-MS LPECA2-MS LPECA1-MS
1.550E-2 1.550E-2 1.550E-2
409 570 390
Unavailability of ICCS trains because of repair and maintenance, #1 #2 #3
8.315E-3 8.311E-3 6.695E-3
TX-2M TX-3M TX-1M
2.060E-2 2.060E-2 2.060E-2
398 420 405
CCF to start all three 7.981E-3 RL41D01---1230SV 1.270E-4 92

26
Basic Event Description Fussell-Vesely Measure
Basic Event Code Event Probability
Number of MCSs Containing the Event
emergency FWPs CCF of diesel generators #1 and #2 to run during 24-hour operation
7.967E-3 GV-DAY----1200RV 2.020E-3 92
CCF of diesel generators #2 and #3 to run during 24-hour operation
7.427E-3 GW-DAY----0230RV 2.020E-3 89
Table 2-9 Importance of Human Error Events
Basic Event Description Fussell-Vesely Measure
Event Probability
Human Error Event Code
Number of MCSs
Containing Event
Operator fails to close secondary fast-acting isolation valves for transients involving failure to close SDS-Cs.
2.820E-2 8.160E-3 HE-FIVSC-TRANS
360
Operator fails to initiate accelerated emergency reactor cooldown through the secondary circuit when the secondary pressure control unit fails to close during transients.
1.450E-2 4.590E-3 HE-EHRS-FCF-TRANS
124
During transients, operator fails to depressurize pressurizer by means of the primary make-up system and emergency gas removal system.
1.364E-2 3.360E-3 HEM-PRI-2-TRANS-1
182
Operator fails to initiate accelerated emergency reactor cooldown through the secondary circuit when the secondary SDS-As fail to close during spurious opening of steam generator safety valves.
8.442E-3 6.000E-2 HE-EHRS-FCF-SGSV
8
Operator fails to close fast-acting isolation valves for a medium primary-to-secondary leak when SDS-Cs fail to close.
7.611E-3 3.000E-2 HE-FIVSC-V1SG 4
For transients, operator fails to inject boron solution in the primary circuit through the make-up system and HPECCS.
6.964E-3 1.680E-3 HEM-BRI-2-TRANS
43

27
Basic Event Description Fussell-Vesely Measure
Event Probability
Human Error Event Code
Number of MCSs
Containing Event
Operator fails to close fast-acting isolation valves when SDS-C fails to close for a feed-line leak initiator.
6.322E-3 3.000E-2 HE-FIVSC-SP 44
Operator fails to close fast-acting isolation valves when SDS-C fails to close and both main FWPs stop.
5.501E-3 8.160E-3 HE-FIVSC-SF 44
At a small LOCA, operator fails to perform sequential two-mode operation of LPECCS: heat removal mode periodically replaced by injection into primary mode.
5.332E-3 5.310E-2 HE-LPEC-BC-S2 13

28
0.0E+00
5.0E-05
1.0E-04
1.5E-04
2.0E-04
2.5E-04
CD
F R
isk
Red
uctio
n C
ontr
ibut
ion
of E
vent
1 Total CDF2 Containment sump clogging 3 Random failure of components4 CCF of components5 Human errors6 Reactor trip system failure7 Unavailability because of maintenance and repair8 IE leading directly to core damage
1 2 3 4 5 6 7 8
Figure 2-3 Risk Reduction Interval Contributions to Core Damage Frequency for the Primary Contributors
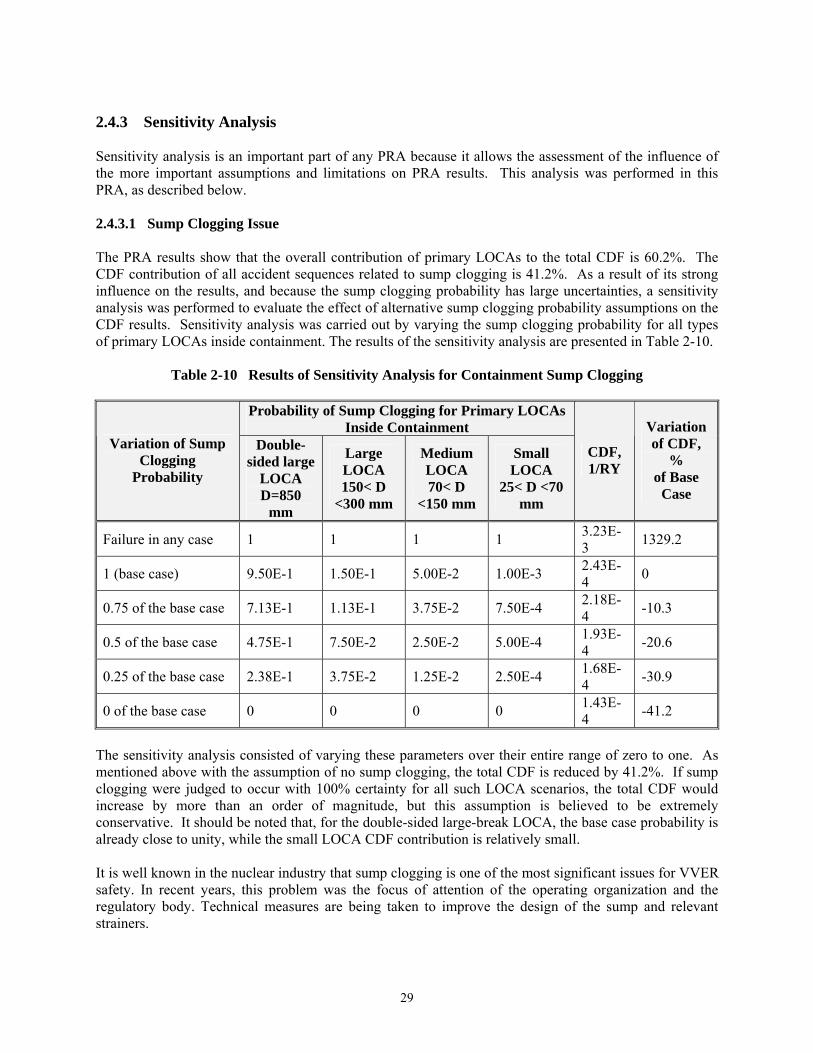
29
2.4.3 Sensitivity Analysis Sensitivity analysis is an important part of any PRA because it allows the assessment of the influence of the more important assumptions and limitations on PRA results. This analysis was performed in this PRA, as described below. 2.4.3.1 Sump Clogging Issue The PRA results show that the overall contribution of primary LOCAs to the total CDF is 60.2%. The CDF contribution of all accident sequences related to sump clogging is 41.2%. As a result of its strong influence on the results, and because the sump clogging probability has large uncertainties, a sensitivity analysis was performed to evaluate the effect of alternative sump clogging probability assumptions on the CDF results. Sensitivity analysis was carried out by varying the sump clogging probability for all types of primary LOCAs inside containment. The results of the sensitivity analysis are presented in Table 2-10.
Table 2-10 Results of Sensitivity Analysis for Containment Sump Clogging
Probability of Sump Clogging for Primary LOCAs Inside Containment
Variation of Sump Clogging
Probability
Double-sided large
LOCA D=850
mm
Large LOCA 150< D
<300 mm
Medium LOCA 70< D
<150 mm
Small LOCA
25< D <70 mm
CDF, 1/RY
Variation of CDF,
% of Base
Case
Failure in any case 1 1 1 1 3.23E-3 1329.2
1 (base case) 9.50E-1 1.50E-1 5.00E-2 1.00E-3 2.43E-4 0
0.75 of the base case 7.13E-1 1.13E-1 3.75E-2 7.50E-4 2.18E-4 -10.3
0.5 of the base case 4.75E-1 7.50E-2 2.50E-2 5.00E-4 1.93E-4 -20.6
0.25 of the base case 2.38E-1 3.75E-2 1.25E-2 2.50E-4 1.68E-4 -30.9
0 of the base case 0 0 0 0 1.43E-4 -41.2
The sensitivity analysis consisted of varying these parameters over their entire range of zero to one. As mentioned above with the assumption of no sump clogging, the total CDF is reduced by 41.2%. If sump clogging were judged to occur with 100% certainty for all such LOCA scenarios, the total CDF would increase by more than an order of magnitude, but this assumption is believed to be extremely conservative. It should be noted that, for the double-sided large-break LOCA, the base case probability is already close to unity, while the small LOCA CDF contribution is relatively small. It is well known in the nuclear industry that sump clogging is one of the most significant issues for VVER safety. In recent years, this problem was the focus of attention of the operating organization and the regulatory body. Technical measures are being taken to improve the design of the sump and relevant strainers.

30
2.4.3.2 Feed-Water Pump Trip Frequency The influence on CDF of reliability of the main turbine-driven FWPs was analyzed as sensitivity to the frequency of the IE “switching-off of two main FWPs.” Operating data on FWP trips at Units 1 and 2 of the KNPS is shown in Figure 2-4. The frequency for FWP trips used in the PRA model was 0.286 events per reactor per year. This number was obtained from a Bayesian analysis of the combined data for seven VVER NPSs and the data for the two KNPS units. The frequency of simultaneous trip of the Kalinin FWPs has decreased over time since plant startup. The frequency of the simultaneous trip of two FWPs was reduced from 1990-1996 as compared to the initial period of plant operation (1983 to 1987). A second Bayesian analysis calculation was performed using the KNPS data for 1990-1996, together with generic data for the seven VVER NPSs. The resulting IE frequency is 0.125 per reactor per year. The resulting updated CDF is 2.36E-4 1/RY, or a reduction in total CDF of 3.1%. The CDF is not greatly sensitive to the frequency of FWP trips.
0
1
2
3
84 85 86 87 88 89 90 91 92 93 94 95 96
Trip of two FWPs Trip of one FWP
Figure 2-4 Number of Feed-Water Pump Trips at Units 1 and 2 of the
Kalinin Nuclear Power Station, 1983 to 1996 2.4.3.3 Emergency Diesel Generator Reliability Three emergency diesel generators are included in the emergency electrical power supply system, which is one of the most important systems to safety. Reliability of the diesel generators is the most essential for IE “Loss of offsite power for more than 0.5 hours,” where failure of the diesel generators results in core damage.

31
Table 2-11 shows results of an assessment of the sensitivity of the computed CDF to diesel generator reliability. The potential importance of the parameter is shown by the “failure any case” result. Here it is assumed, unrealistically, that the failure probability is one. This extremely conservative assumption leads to a very large change in the computed CDF and shows the potential importance of this system to plant safety. When the reliability is changed by 25%, the total CDF changes by about 2%. Over this range of reliability parameter, the CDF is not greatly sensitive to the parameter value. The F-V Importance Measure for diesel generators, based on the base case parameters, is approximately 0.078.
Table 2-11 Results of Core Damage Frequency Sensitivity Analysis for Emergency Diesel Generator Reliability
No. Variation of Diesel Generator Failure Probability Multiplier of Base Case Value CDF Change in CDF, %
of Base Case
1 Failure any case 1.36E-2 5498 2 1.25 2.50E-4 2.58 3 1.0 (base case) 2.43E-4 0 4 0.75 2.38E-4 -2.26 5 0 2.24E-4 -7.81
2.4.4 Conclusions and Recommendations of the Level 1 Probabilistic Risk Assessment for
Internal Initiators The following accomplishments have been achieved as a result of performing the Level 1 PRA considering internal initiators at full-power operation: • The risk associated with the operation of the KNPS, expressed in terms of CDF, has been determined. • The most important contributors to CDF have been identified. • Recommendations for increasing the safety level of the KNPS Unit 1 have been made as a result of
the PRA findings. • Analytical PRA models, and thermal-hydraulic models, have been developed that can be used to
serve as a basis for a “living PRA” to maintain and improve plant safety and efficiency 2.4.4.1 Core Damage Frequency and Major Contributors The PRA provided a measure of plant risk represented by CDF, as well as a numerical estimate of the major contributors to reactor core damage risk. The PRA identified no new or previously unknown safety-related issues. The results of the study as a whole confirmed a fairly good balance among initiating event contributors to CDF for the KNPS Unit 1. Aside from the LOCA IEs that are influenced by sump clogging, no other IE group contributed more than 10% to CDF. The point estimate of reactor core damage probability for KNPS Unit 1 from internal IEs is 2.39E-4. The basic Russian regulatory document “General Provisions of the Nuclear Power Plants Safety Assurance” (OPB-88) (Ref. 2.14) states that efforts should be made to ensure that the probability of severe core damage in “beyond design” accidents should not be higher than 10E-5 per reactor per year. From a perspective of the Russian national regulation, the KNPS obviously has opportunities to improve its safety. A Nuclear Safety Advisory Group of the IAEA in the report INSAG-3 (Ref. 2.15) suggested applying probability of severe accidents as one of the safety goals for NPSs. For operating NPS units, the value of

32
10E-4 per reactor-year was recommended. The point estimate of reactor core damage probability for KNPS Unit 1 slightly exceeds the goal value recommended by the IAEA for operating units. However, the IAEA goal lies within the 5% and 95% values of the computed CDF uncertainty range. The PRA study shows that risk of core damage at the KNPS is largely associated with primary system LOCAs and with transient IEs, which contribute, respectively, 57.5% and 36% to the CDF. The other major IE groups (secondary leaks, primary-to-secondary leaks, and primary system LOCAs outside containment) are only small contributors to risk. The large contribution of LOCAs is, to a great extent, influenced by the assumptions regarding the phenomenon of sump clogging (i.e., the possibility of containment sump strainers being clogged by elements of insulation torn from primary pipes and equipment during primary LOCAs). For the sequences involving sump clogging, the resulting lack of confidence in reliable functioning of LPECCS leads to a LOCA contribution to total CDF of 41.2%. The large uncertainties and their influence on the results were demonstrated in the study. The uncertainties were not resolved at the conclusion of this study, despite some technical measures that were undertaken. This issue, which is also a generic VVER-1000 issue, still remains significant and requires additional attention by the utility. The largest contributor to the transient IE group is the “Loss of offsite power” initiator. The most important contributing failure that is predicted to lead to core damage for this initiator is CCF of the three diesel generators. Sequences of ATWS, which result from failure of reactor trip during a number of IE accidents, lead to a CDF contribution of approximately 13%. This result is attributable to 1) the conservative assumption that failure to trip leads directly to core damage, and 2) conservative modeling of the plant shutdown system. These assumptions should be assessed in future work. 2.4.4.2 Possible Plant Safety Improvement Measures The analysis of CDF IE contributors and the importance and sensitivity analyses suggest that plant safety could possibly be enhanced through plant improvements in a number of areas: • Measures to reduce the likelihood of sump clogging can lead to a significant reduction in CDF. • Human action cutsets contribute 15.1% to CDF. Two event types, closure of fast-acting safety valves
and initiation of emergency reactor cooldown, together contribute approximately 7% to CDF. These actions are candidates for investigation for risk reduction potential.
• Unavailability of safety-related systems because of maintenance and repairs plays a visible role in contributing to core damage. The unavailability of the LPECCS and its subsystems should be analyzed as a means to reduce the impact of maintenance and repair on plant safety.
• Several components contribute measurably to CDF: Cutsets involving failure to close the SDS-C contribute 6.1% to CDF, failure of LPECCS pumps 5.2%, failure of ICCS pumps 3.5%, failure of boron concentration pumps of the primary make-up system 2.3%, and failures of emergency FWPs 1.1%. Improvement of the reliability of these components provides an opportunity for CDF risk reduction.
An effective way to enhance unit safety is to account for these issues through additional technical and organizational activities of the KNPS. 2.4.4.3 Limitations of the PRA Study The PRA was performed using state-of-art methodology, in which best-estimate models and data were used to the maximum extent possible to characterize the performance of equipment and human action.
33
However, the PRA team working for the Russian regulatory body almost always tried to treat assumptions, unresolved doubts, and uncertainties in favor of conservatism in the course of model development. Because of this conservatism, the numerical results of the PRA reflect that dual approach. Consideration of the numerical results of the study, therefore, should take into account the rather large range of uncertainty derived not only from parametric uncertainty, but also from qualitative uncertainty from modeling assumptions. The sump clogging phenomenon and its influence on the PRA results represent the greatest uncertainty of the study. This safety issue could be eliminated through plant improvements. The ATWS contribution to CDF is significant, but the reactor trip failure that leads to ATWS sequences was treated conservatively. The ATWS events were also conservatively assigned to core damage with no mechanistic assessment. Diesel generator CCF is a significant contributor to the CDF, playing an important role, first of all, in the “Loss of offsite power” initiator and in other IEs. CCF is also a contributor to a number of LOCA and transient sequences. The CCF data are largely not plant-specific, as a result of limitations in plant operational data, and were taken from Russian and U.S. data sources. Despite the statements made above regarding the difficulties of total CDF assessment, the numerical results and qualitative results allowed the analysis to weigh safety-related issues and provided insights that allowed recommendations for more effective measures directed at the further enhancement of the unit’s safety. 2.4.5 Basic Directions for PRA Refinement The developed PRA model represents a sound basis for continued improvement and application. This continued effort is in the interest of the KNPS, its operating organization (Rosenergoatom Consortium), and the regulatory body. The tasks related to refinement of the PRA may be divided into two groups. The first group relates to PRA model expansions not requiring significant resources: • Study, model, and include in the PRA scenarios of recovery actions such as restoring availability of
components initially assumed unavailable at onset of IEs or to have failed during an accident. • Explore the use of communications between KNPS Units 1 and 2 for safety purposes and account for
these in the PRA model. • Update the reliability model of the reactor trip system. The second group deals with substantial technical and organizational efforts either at the KNPS or in the operating organization: • Carefully analyze the sump clogging issue along with the technical measures being undertaken to
resolve it at the KNPS. This analysis will allow a refinement of the sump clogging model and a re-estimation of the role of this issue in KNPS safety.
• Develop the logic structure of the accident sequences driven by reactor trip failure (ATWS-type sequences). The basis for this improvement may be the results of carefully modeling accidents using adequate analytical tools that were unavailable to the PRA team.
• Re-estimate frequencies of primary LOCA IEs based on a modern probabilistic method of structural mechanics.
• Update PRA input data. This update requires an improvement in the gathering and analysis of operational data applicable to conduct PRAs. Such an improvement will create a sound basis to

34
assess component reliability data and IE frequencies, and will provide information required to trace and account for implicit dependencies in NPS unit behavior as well as to improve CCF modeling.
• Perform a specific analysis that will allow the PRA model to consider the possibility of structural damage of unit components from thermal impacts (thermal shock and impingement) for some emergency conditions.
2.5 References 2.1 U.S. Nuclear Regulatory Commission and the Federal Environmental, Industrial and Nuclear
Supervision Service of Russia. 2005. Kalinin VVER-1000 Nuclear Power Station Unit 1 PRA. Main Report: Level 1, Internal Initiators. NUREG/IA-0212, Volume 2, Part 1, Proprietary, not available for public distribution.
2.2 U.S. Nuclear Regulatory Commission. 2005. Procedure Guides for a Probabilistic Risk
Assessment, NUREG/CR-6572, Rev. 1. 2.3 International Atomic Energy Agency. 1992. Procedures for Conducting Probabilistic Safety
Assessments of Nuclear Power Plants (Level 1). IAEA Safety Series No. 50-P-4, International Atomic Energy Agency, Vienna.
2.4 International Atomic Energy Agency. 1994. Generic Initiating Events for PSA for VVER Reactors.
IAEA-TECDOC-749, International Atomic Energy Agency, Vienna. 2.5 International Atomic Energy Agency. 1993. Defining Initiating Events for Purposes of
Probabilistic Safety Assessment. IAEA-TECDOC-719, International Atomic Energy Agency, Vienna.
2.6 Scientific and Engineering Center for Nuclear and Radiation Safety. 1999. Project SWISRUS,
Novovoronezh Unit 5 Probabilistic Safety Assessment, Part 1: Level 1 Internal Events, Final Report. Scientific and Engineering Center for Nuclear and Radiation Safety of the Federal Nuclear and Safety Authority of Russia, Moscow.
2.7 U.S. Nuclear Regulatory Commission. 1995. RELAP5/MOD3, Code Manual. NUREG/CR-5535,
INEL-95/0174 (Vol. 4 and 5), Rev. 1. 2.8 International Atomic Energy Agency. 1998. Component Reliability Data for Use in Probabilistic
Safety Assessment. IAEA-TECDOC-478, International Atomic Energy Agency, Vienna. 2.9 U.S. Nuclear Regulatory Commission. 1988. Nuclear Computerized Library for Assessing
Reactor Reliability (NUCLARR). NUREG/CR-4639, U.S. Nuclear Regulatory Commission, (Vol. 1) February 1988, (Vol. 2) September 1988, (Vol. 3) November 1988, (Vol. 4) June 1988, (Vol. 5) June 1988.
2.10 International Atomic Energy Agency. 1992. Procedures for Conducting Common Cause Failure
Analysis in Probabilistic Safety Assessment. IAEA TECDOC Series No. 648, International Atomic Energy Agency, Vienna.
2.11 International Atomic Energy Agency. 1995. Human Reliability Analysis in Probabilistic Safety
Assessment for Nuclear Power Plants. IAEA Safety Series No. 50-P-10, International Atomic Energy Agency, Vienna.
35
2.12 Scientific and Engineering Center for Nuclear and Radiation Safety of the Federal Nuclear and Safety Authority of Russia. 1997. Decision Trees for HRA. SEC-NRS/GAN Report, Scientific and Engineering Center for Nuclear and Radiation Safety of the Federal Nuclear and Safety Authority of Russia, Moscow.
2.13 U.S. Nuclear Regulatory Commission. 2003. Systems Analysis Programs for Hands-On Integrated
Reliability Evaluations (SAPHIRE), Version 7, Reference Manual. 2.14 Federal Nuclear and Radiological Safety Authority of Russia. 1997. “General Provisions of
Nuclear Power Plants Safety Assurance,” in Norms and Rules of Nuclear and Radiological Safety, OPB-88/97, Federal Nuclear and Radiological Safety Authority of Russia, Moscow.
2.15 Publications of the Nuclear Safety Advisory Group. 1988. INSAG-3. Basic Safety Principles for
Nuclear Power Plants. International Atomic Energy Agency, Vienna.

36
3. LEVEL 2 PROBABILISTIC RISK ASSESSMENT The BETA Project team also conducted a Level 2 PRA, which is described in more detail in the following subsections. 3.1 Scope/Objectives The main objective of the Level 2 PRA was to assess containment response to potential loads and to assess characteristics of radiological releases accompanying severe core damage accidents. The results of the PRA Level 2 are expressed in terms of: • containment release categories and their associated frequencies • source terms (defined as quantitative characteristics of radioactive substance releases into the
environment) associated with the identified containment release categories. The results of the Level 1 PRA served as the starting point for the Level 2 PRA. These results present a set of accident sequences and their associated frequencies, including the impact of active containment systems (e.g., containment heat removal systems, containment isolation system, etc.). Accident sequences with similar plant and containment response behavior are thereby combined into PDSs. The PDSs provide the interface between the Level 1 and the Level 2 parts of a PRA. They define the initial and boundary conditions for the Level 2 and, ultimately, the Level 3 PRA. The following activities were within the scope of the BETA Project Level 2 PRA: 1. Developing the interface between the Level 1 and 2 PRA, including identifying PDSs and developing
the PDS matrix 2. Identifying physical phenomena important to containment integrity that could occur in the course of
severe accidents 3. Developing containment ETs and quantifying accident progression event trees (APETs) 4. Defining KNPS Unit 1 release categories 5. Estimating radiological accident source terms 6. Conducting a sensitivity analysis. 3.2 Characteristics of the Level 2 Probabilistic Risk Assessment The following sections summarize Unit 1 and containment design features and their potential impact on the progression of severe accidents and the resulting loads on the containment, describe the interface between the Level 1 and Level 2 PRA, detail the plant and containment system response to severe accident progression (including the containment structure response characteristics, the accident progression analyses, and the release category definition), present radiological source terms, describe the results of sensitivity analysis of containment integrity with regard to potential severe accident management, and present the conclusions of the Level 2 PRA. 3.3 Features of Unit 1 Relevant to the Level 2 Probabilistic Risk
Assessment This subsection presents key data on reactor and containment system design that are the most relevant to the progression of severe accidents for KNPS Unit 1. Additional detailed information on these features is presented in Ref. 3.1.

37
Containment pressure capacity is one of the most important aspects of the plant’s design. A comprehensive structural fragility analysis for KNPS Unit 1 containment (for both static and dynamic loads) has yet to be performed. Such an analysis was beyond the scope of the PRA. Therefore, for the purpose of the PRA, a special approach was used, as described later in this report. Table 3-1 presents the main design features of the reactor plant and the containment for KNPS Unit 1. Similar data for the Zion plant (U.S.), which uses a Westinghouse pressurized-water reactor (PWR), are given for comparison. The main objective of this comparison is to qualitatively verify Level 2 PRA results. The values of conditional probabilities for containment damages identified later in this report should not differ significantly because there are only insignificant differences in characteristics between the two reactors. Table 3-1 shows that the reactor coolant system (RCS) for KNPS Unit 1 is very similar to that of the Zion plant design. However, the following differences should be noted: • The ratio of primary circuit volume to reactor thermal power is about 0.12 m3/MW(t) for KNPS Unit
1, which is about 9% higher than that for the Zion plant. This difference implies that there are slightly higher time margins to coolant boil-down at KNPS Unit 1 as compared with Zion; however, this additional margin is not very significant.
• The ratio of free containment volume to reactor nominal thermal power is about 25m3/MW(t) for KNPS Unit 1, which is about 5% higher than for Zion. This increased volume capacity also provides some additional margin for the pressure build up in containment in the course of severe accidents. In particular, time to reach the same containment pressure during severe accidents is expected to be more at KNPS Unit 1 compared with that of Zion. This difference would allow some additional time for possible accident management actions that could mitigate potential offsite consequences.
• The ratio of fuel mass to containment free volume for KNPS Unit 1 is about 20% lower than that for Zion. This difference means that, given the same melt ejection and dispersal characteristics (which are not expected, as discussed later), the potential loads resulting from direct containment heating (DCH) for KNPS Unit 1 should be less severe compared with DCH loads at Zion.
• In a hypothetical case of oxidation of all zirconium in the cladding at KNPS Unit 1, the total amount of hydrogen released would be about 992 kg. This amount of hydrogen, if burned, would produce a pressure in containment of about 0.54 MPa, which would exceed the containment design pressure (0.46 MPa). Finally, the total amount of hydrogen that potentially could be produced as a result of a severe accident at KNPS Unit 1 is about 10% larger than the amount expected for the Zion plant. Therefore, it is expected that the hydrogen combustion issue may be more risk significant at KNPS Unit 1 than at Zion-type PWRs.
Section 3.5 describes other important features of KNPS Unit 1 design. 3.4 Interface Between Level 1 and Level 2 PRA A detailed description of the investigation of the Level 1 and 2 interface is presented in Ref. 3.2. 3.4.1 Plant Damage State Identification The Level 1 PRA identified the dominant event sequences that lead to core damage, typically characterized by MCSs for each accident sequence. The final stage of the Level 1 ET analysis process can be used to map the dominant MCSs onto PDSs by defining the appropriate PDS attributes for the Level 1/Level 2 interface ETs (which are the natural extension of the Level 1 ETs).

38
Table 3-1 KNPS Unit 1 and Zion Plants Design Features Parameter KNPS Unit 1 Zion Plant Reactor type PWR (VVER-1000) PWR Reactor thermal power, MW(t) 3000 3250 Fuel material Uranium dioxide (UO2) UO2 Fuel cladding material Zr+2.5%Nb Zircaloy Type of coolant-moderator Water Water Volume of RCS water, m3 370 360 Fuel mass (UO2), kg 77,497 98,200 Fuel claddings mass (Zr+2.5%Ni), kg 22,548 20,000 Containment free volume, m3 75,700 77,070 Containment design pressure (overpressure), MPa 0.46 0.42 Mean failure pressure, MPa 0.85 1.02 Ratio of containment free volume to reactor power, m3/MW(t) 25.2 24 Ratio of RCS water volume to reactor power, m3/MW(t) 0.12 0.11 Ratio of fuel mass to containment volume, kg/ m3 1.02 1.3 Maximum mass of hydrogen resulting from 100% oxidation of Zr, kg
992 886
Maximum well-mixed hydrogen concentration in containment as a result of 100% Zr oxidation, 10-3 moles/ m3
6.5 7
Maximum adiabatic burn pressure, MPa 0.54 0.52 Ratio of the adiabatic burn pressure to design pressure 1.10 1.24 Ratio of adiabatic burn pressure to mean failure pressure 0.64 0.51
The PDS analysis involves the identification of detailed PDS categories using multi-state attributes. The resulting number of PDSs is usually large and difficult to manage in an APET quantification process. Therefore, the accident scenarios were grouped into a more manageable number of PDS categories. In the ETs, developed for the system analysis stage (Level 1 PRA), only those events and system failures were examined that were essential to determine whether the accident sequences would lead to core damage. The ETs updated for the Level 2 PRA include the following functional headings: • containment spray injection • containment heat removal by containment spray recirculation • injection from HAs • high-pressure injection (HPECCS in injection mode) • low-pressure injection (LPECCS in injection mode) • low-pressure recirculation system (LPECCS in recirculation mode) • containment isolation. 3.4.2 Plant Damage State Attributes Attributes for PDSs were selected based on factors defining a source term into the environment: • influence on containment integrity • influence on release, transport, deposition, vaporization, and chemical reaction of radionuclides.
39
Main five attributes are used to characterize a PDS. They address the following issues: 1. Accident initiator class (e.g., LLOCA, small LOCA, transient, etc.) 2. Status of RCS at the onset of core damage 3. Status of ECCS 4. Status of containment heat removal system (spray system) 5. Status of containment integrity. Additionally, the special containment bypass factor was considered for direct radionuclide release from primary and secondary circuits into the environment. 3.4.3 Approach to Plant Damage State Matrix Development Table 3-2 and Table 3-3 present the PDS matrix developed based on the above attributes. The following approach was used to calculate frequencies for PDS nodes in the tables: 1. Before binning the Level 1 PRA results into the various PDSs, the accident sequences were divided
into two major groups in accordance with the following two attributes: • IE class • primary system pressure at core damage (in the Level 1 PRA, core damage is defined as
exceeding a fuel rod cladding temperature of 1200°C). 2. Special “bridge event trees” were developed for each of 14 possible combinations of RCS integrity
categories. 3. Each of the Level 1 PRA ETs with an end state of “CD” (core damage) was changed to reflect the
appropriate bridge tree. 4. The bridge trees included the whole set of attributes (described above) that affect containment
behavior and radionuclide releases. 5. Systems models, developed using the SAPHIRE PRA computer code, took into account each
attribute mentioned above. The modeled functions and their success criteria are described in Ref. 3.2. 6. The PRA model was developed using the SAPHIRE PRA computer code, which could be used to
provide an interface between the Level 1 and 2 PRA. 7. The model was quantified, and frequencies of PDS matrix nodes were defined. 8. The initial PDSs underwent additional grouping to reach a final set of PDSs that were convenient for
analysis. This additional PDS grouping was based on qualitative analysis of accident progression for different PDSs, using a conservative approach with regard to radiological releases and containment integrity, and considering results of MELCOR code calculations. PDSs with frequencies lower than 10-7 were screened out.
Figure 3-1 shows an example of a bridge tree, in this case for a LLOCA IE. Tables 3-2 and 3-3 show the results of this work.
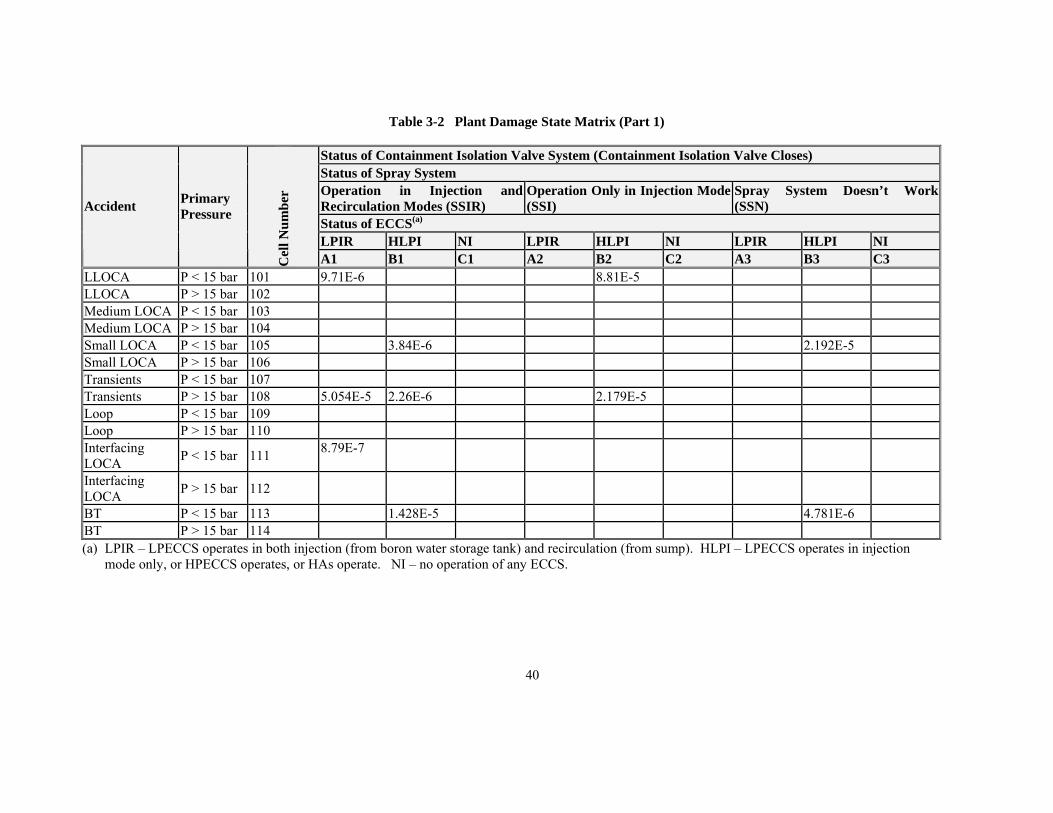
Table 3-2 Plant Damage State Matrix (Part 1)
Status of Containment Isolation Valve System (Containment Isolation Valve Closes) Status of Spray System Operation in Injection and Recirculation Modes (SSIR)
Operation Only in Injection Mode (SSI)
Spray System Doesn’t Work (SSN)
Status of ECCS(a) LPIR HLPI NI LPIR HLPI NI LPIR HLPI NI
Accident Primary Pressure
Cel
l Num
ber
A1 B1 C1 A2 B2 C2 A3 B3 C3 LLOCA P < 15 bar 101 9.71E-6 8.81E-5 LLOCA P > 15 bar 102 Medium LOCA P < 15 bar 103 Medium LOCA P > 15 bar 104 Small LOCA P < 15 bar 105 3.84E-6 2.192E-5 Small LOCA P > 15 bar 106 Transients P < 15 bar 107 Transients P > 15 bar 108 5.054E-5 2.26E-6 2.179E-5 Loop P < 15 bar 109 Loop P > 15 bar 110 Interfacing LOCA P < 15 bar 111 8.79E-7
Interfacing LOCA P > 15 bar 112
BT P < 15 bar 113 1.428E-5 4.781E-6 BT P > 15 bar 114 (a) LPIR – LPECCS operates in both injection (from boron water storage tank) and recirculation (from sump). HLPI – LPECCS operates in injection
mode only, or HPECCS operates, or HAs operate. NI – no operation of any ECCS.
40

41
Table 3-3 Plant Damage State Matrix (Part 2)
Status of Containment Isolation Valve System (Containment Isolation Valve Does Not Close) Status of Spray System Operation in Injection and Recirculation Modes (SSIR)
Operation Only in Injection Mode (SSI)
Spray System Doesn’t Work (SSN)
Status of ECCS LPIR HLPI NI LPIR HLPI NI LPIR HLPI NI
Accident Primary Pressure
Cel
l Num
ber
A1 B1 C1 A2 B2 C2 A3 B3 C3 LLOCA P < 15 bar 201 LLOCA P > 15 bar 202 Medium LOCA P < 15 bar 203 Medium LOCA P > 15 bar 204 Small LOCA P < 15 bar 205 Small LOCA P > 15 bar 206 Transients P < 15 bar 207 Transients P > 15 bar 208 7.8E-7 Loop P < 15 bar 209 Loop P > 15 bar 210 Interfacing LOCA P < 15 bar 211
Interfacing LOCA P > 15 bar 212
BT P < 15 bar 213 BT P > 15 bar 214 (a) LPIR – LPECCS operates in both injection (from boron water storage tank) and recirculation (from sump). HLPI – LPECCS operates in injection mode only, or HPECCS operates, or HAs operate. NI – no operation of any ECCS.

42
A PDF conversion problem has been encountered with this page. A new page will be posted after the conversion is corrected.
BFT-HA
2 of 4 HAoperation
BFT-HPI-3
Train 1 or 2 ofHP ECCS operation
BFT-LPECI
LP ECCSoperation in
injection mode
BFT-LPECIR
LP ECCSoperation in inj. andrecirculation mode
BFT-SSIR
Containment spraysystem operation inrecirculation mode
BFT-SSI
Containment spraysystem operation in
injection mode
BFT-CIS
Containment isolation system
operation
LLOCA-850--LP
transfer
# CONSEQUENCE
1 LLOCA-101A1 2 LLOCA-101B1 3 LLOCA-101B1 4 LLOCA-101B1 5 LLOCA-101C1 6 LLOCA-101A2 7 LLOCA-101B2 8 LLOCA-101B2 9 LLOCA-101B2 10 LLOCA-101C2 11 LLOCA-101A3 12 LLOCA-101B3 13 LLOCA-101B3 14 LLOCA-101B3 15 LLOCA-101C3 16 LLOCA-201A1 17 LLOCA-201B1 18 LLOCA-201B1 19 LLOCA-201B1 20 LLOCA-201C1 21 LLOCA-201A2 22 LLOCA-201B2 23 LLOCA-201B2 24 LLOCA-201B2 25 LLOCA-201C2 26 LLOCA-201A3 27 LLOCA-201B3 28 LLOCA-201B3 29 LLOCA-201B3 30 LLOCA-201C3
LLOCA-850--LP - 2003/08/12 Page 4
Figure 3-1 Bridge Tree for LLOCA-850-LP Initiating Event
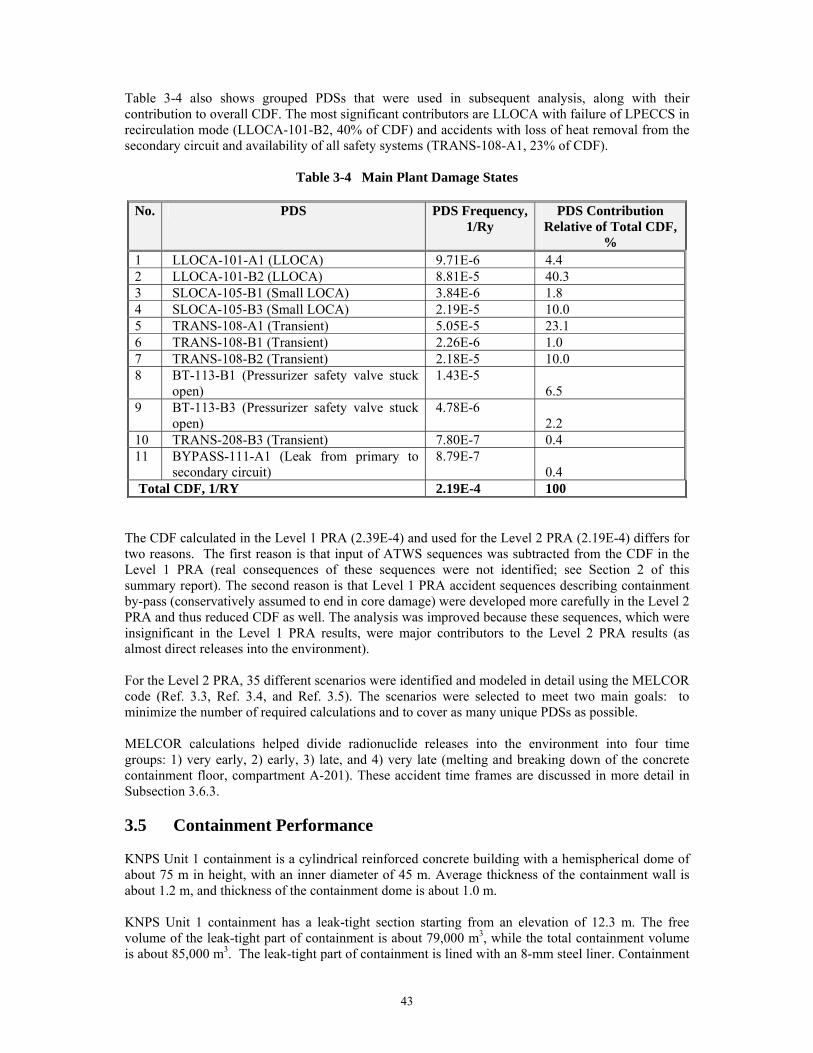
43
Table 3-4 also shows grouped PDSs that were used in subsequent analysis, along with their contribution to overall CDF. The most significant contributors are LLOCA with failure of LPECCS in recirculation mode (LLOCA-101-B2, 40% of CDF) and accidents with loss of heat removal from the secondary circuit and availability of all safety systems (TRANS-108-A1, 23% of CDF).
Table 3-4 Main Plant Damage States
No. PDS PDS Frequency, 1/Ry
PDS Contribution Relative of Total CDF,
% 1 LLOCA-101-A1 (LLOCA) 9.71E-6 4.4 2 LLOCA-101-B2 (LLOCA) 8.81E-5 40.3 3 SLOCA-105-B1 (Small LOCA) 3.84E-6 1.8 4 SLOCA-105-B3 (Small LOCA) 2.19E-5 10.0 5 TRANS-108-A1 (Transient) 5.05E-5 23.1 6 TRANS-108-B1 (Transient) 2.26E-6 1.0 7 TRANS-108-B2 (Transient) 2.18E-5 10.0 8 BT-113-B1 (Pressurizer safety valve stuck
open) 1.43E-5
6.5 9 BT-113-B3 (Pressurizer safety valve stuck
open) 4.78E-6
2.2 10 TRANS-208-B3 (Transient) 7.80E-7 0.4 11 BYPASS-111-A1 (Leak from primary to
secondary circuit) 8.79E-7
0.4 Total CDF, 1/RY 2.19E-4 100
The CDF calculated in the Level 1 PRA (2.39E-4) and used for the Level 2 PRA (2.19E-4) differs for two reasons. The first reason is that input of ATWS sequences was subtracted from the CDF in the Level 1 PRA (real consequences of these sequences were not identified; see Section 2 of this summary report). The second reason is that Level 1 PRA accident sequences describing containment by-pass (conservatively assumed to end in core damage) were developed more carefully in the Level 2 PRA and thus reduced CDF as well. The analysis was improved because these sequences, which were insignificant in the Level 1 PRA results, were major contributors to the Level 2 PRA results (as almost direct releases into the environment). For the Level 2 PRA, 35 different scenarios were identified and modeled in detail using the MELCOR code (Ref. 3.3, Ref. 3.4, and Ref. 3.5). The scenarios were selected to meet two main goals: to minimize the number of required calculations and to cover as many unique PDSs as possible. MELCOR calculations helped divide radionuclide releases into the environment into four time groups: 1) very early, 2) early, 3) late, and 4) very late (melting and breaking down of the concrete containment floor, compartment A-201). These accident time frames are discussed in more detail in Subsection 3.6.3. 3.5 Containment Performance KNPS Unit 1 containment is a cylindrical reinforced concrete building with a hemispherical dome of about 75 m in height, with an inner diameter of 45 m. Average thickness of the containment wall is about 1.2 m, and thickness of the containment dome is about 1.0 m. KNPS Unit 1 containment has a leak-tight section starting from an elevation of 12.3 m. The free volume of the leak-tight part of containment is about 79,000 m3, while the total containment volume is about 85,000 m3. The leak-tight part of containment is lined with an 8-mm steel liner. Containment

44
design pressure and temperature are about 0.46 MPa and 150°C, respectively. Under normal operating conditions, temperature and pressure inside the leak-tight part of containment are, respectively, 40°C to 60°C and 20 to 200 mm of water below the pressure of the environment (i.e., sub-atmospheric). In accordance with containment leak tests, the estimated containment leakage rate is about 0.3 volume-percent per day under the design containment pressure of 0.46 MPa. Containment structural fragility data are necessary to determine the containment failure likelihood under severe accident conditions. Absence of these data for KNPS Unit 1 specifically made it necessary to apply indirect data. Probabilistic fragility analysis for the containment of Balakovo NPS Unit 4 was available and was used for the study (Ref. 3.6). The comparative qualitative analysis of key parameters and characteristics concluded that the Balakovo data were applicable to KNPS Unit 1 containment. A detailed description of the approach used and results of the comparison are presented in Ref. 3.2. Figure 3-2 presents a probabilistic fragility curve used for the Level 2 PRA for KNPS Unit 1.
Figure 3-2 Containment Fragility Curve
3.6 Containment Loads During severe accidents, different physical and chemical processes (phenomena) result in different containment loads. Detailed analysis of specific severe accident phenomena is presented in Ref. 3.2 and Ref. 3.7. Results of this analysis were included in containment APETs. The following subsections describe the various issues considered in the analysis.
0
0.1
0.2
0.3
0.4
0.5
0.6
0.7
0.8
0.9
1
0 0.1 0.2 0.3 0.4 0.5 0.6 0.7 0.8 0.9 1 1.1 1.2 1.3 1.4
Pressure, MPa
Prob
abili
ty

45
3.6.1 In-Vessel Steam Explosions The occurrence of steam explosions in the lower vessel head, leading to energetic failure of the reactor vessel, is strongly dependent on the vessel internal geometry and the configuration of structures within the reactor pressure vessel. The lower plenum of KNPS Unit 1 includes a large number of internal structures (similar to the Western boiling-water reactors). This geometry largely prevents mixing and fragmentation of reactor internals. Therefore, it seems unlikely that energetic steam explosions could lead to energetic failure of the reactor pressure vessel and to subsequent impact on and failure of containment. 3.6.2 Ex-Vessel Steam Explosions Following reactor vessel breach, the relocation of molten core debris from the reactor pressure vessel into the containment cavity water (if any) can lead to ex-vessel steam explosions. If the steam explosion is very energetic, it could lead to containment cavity failure, and, depending on the cavity configuration and the proximity of the containment boundary, to containment failure. The possibility of an ex-vessel steam explosion is strongly dependent on the quantity and temperature (among other things) of water in the reactor cavity. At KNPS Unit 1, the reactor cavity could be filled with water only in a case of large pipe break near the reactor nozzles. The probability of this scenario was assessed as negligible. Therefore, a conditional probability of energetic steam explosions (and containment failure) in the containment/reactor cavity was assessed to be zero. A peculiarity of KNPS Unit 1 design is that instrumentation and control (I&C) compartment A-201 is located under the concrete reactor cavity (compartment A-301). Compartment A-201 has open connections with the containment sump compartment. Therefore, the I&C compartment will be filled with water in accidents without failure of the spray system and LPECCS. After melting-through the reactor cavity floor, the molten core debris and concrete will move to the I&C compartment, which will lead to their interaction with water. It was concluded, however, that at this late stage of accident progression, core and concrete components represent a mixture incapable of being fragmented into small particles in the water. Therefore, the probability is very low of an energetic steam explosion, damage to the I&C compartment floor, and, consequently, containment failure. 3.6.3 Loads from Flammable Gas Combustion Hydrogen and carbon monoxide combustion events were analyzed to determine loads on containment and the likelihood of containment structural failure. Hydrogen is produced as a result of in-vessel and ex-vessel oxidation of Zr and Fe. Carbon monoxide is produced as a result of molten core-concrete interactions. Combustion was analyzed during several accident phases to determine conditional probability of combustion-induced containment failure during the following time frames: • Very early - before reactor pressure vessel failure (time from start of core damage up to about ½
hour before reactor pressure vessel failure). • Early - at about reactor pressure vessel failure (time from ½ hour before reactor pressure vessel
failure to about ½ hour after that). About ½ hour after vessel breach, it is expected that molten core-concrete interactions will be well underway, and carbon monoxide could contribute to any hydrogen combustion event.
• Late - several hours following reactor pressure vessel failure (from about ½ hour after vessel breach to the time when steam concentration in containment is below 55% or concentration of oxygen is less than the value at which hydrogen and carbon monoxide combustion is possible).
• Very late - several hours following failure and melt-through of the reactor pressure vessel. No hydrogen and carbon monoxide calculations were performed for this time frame because there are
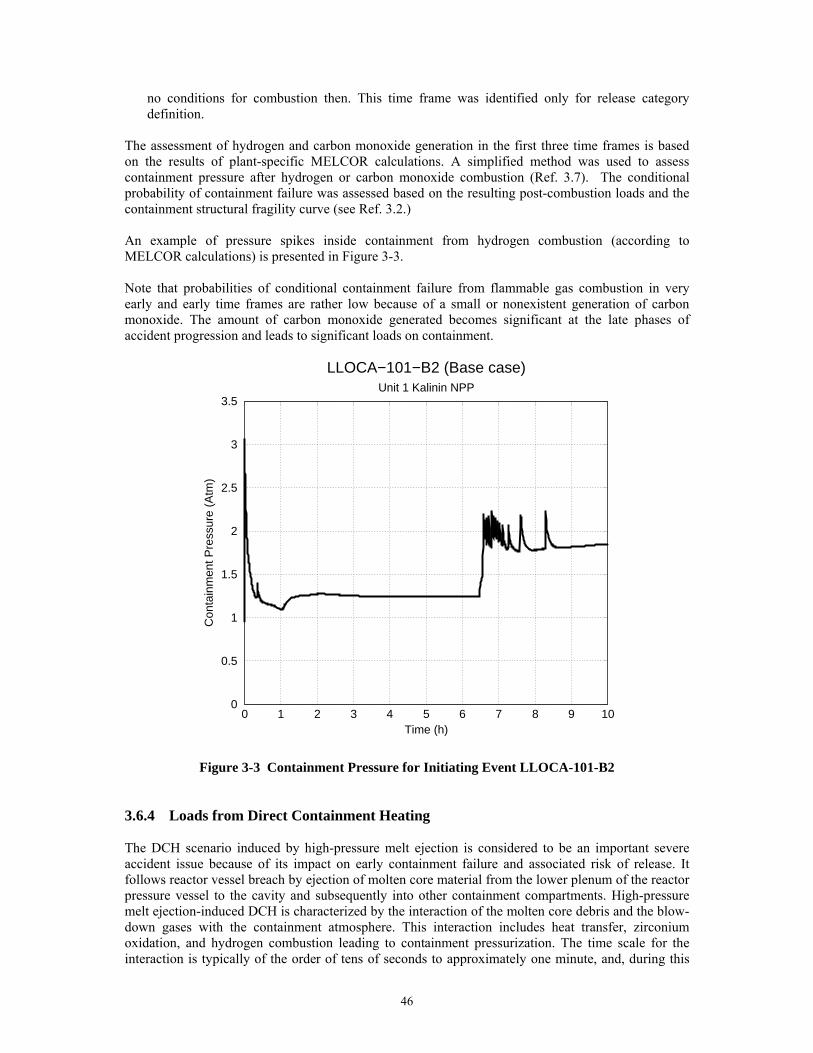
46
no conditions for combustion then. This time frame was identified only for release category definition.
The assessment of hydrogen and carbon monoxide generation in the first three time frames is based on the results of plant-specific MELCOR calculations. A simplified method was used to assess containment pressure after hydrogen or carbon monoxide combustion (Ref. 3.7). The conditional probability of containment failure was assessed based on the resulting post-combustion loads and the containment structural fragility curve (see Ref. 3.2.) An example of pressure spikes inside containment from hydrogen combustion (according to MELCOR calculations) is presented in Figure 3-3. Note that probabilities of conditional containment failure from flammable gas combustion in very early and early time frames are rather low because of a small or nonexistent generation of carbon monoxide. The amount of carbon monoxide generated becomes significant at the late phases of accident progression and leads to significant loads on containment.
0 1 2 3 4 5 6 7 8 9 10Time (h)
0
0.5
1
1.5
2
2.5
3
3.5
Con
tain
men
t Pre
ssur
e (A
tm)
LLOCA−101−B2 (Base case)Unit 1 Kalinin NPP
Figure 3-3 Containment Pressure for Initiating Event LLOCA-101-B2 3.6.4 Loads from Direct Containment Heating The DCH scenario induced by high-pressure melt ejection is considered to be an important severe accident issue because of its impact on early containment failure and associated risk of release. It follows reactor vessel breach by ejection of molten core material from the lower plenum of the reactor pressure vessel to the cavity and subsequently into other containment compartments. High-pressure melt ejection-induced DCH is characterized by the interaction of the molten core debris and the blow-down gases with the containment atmosphere. This interaction includes heat transfer, zirconium oxidation, and hydrogen combustion leading to containment pressurization. The time scale for the interaction is typically of the order of tens of seconds to approximately one minute, and, during this
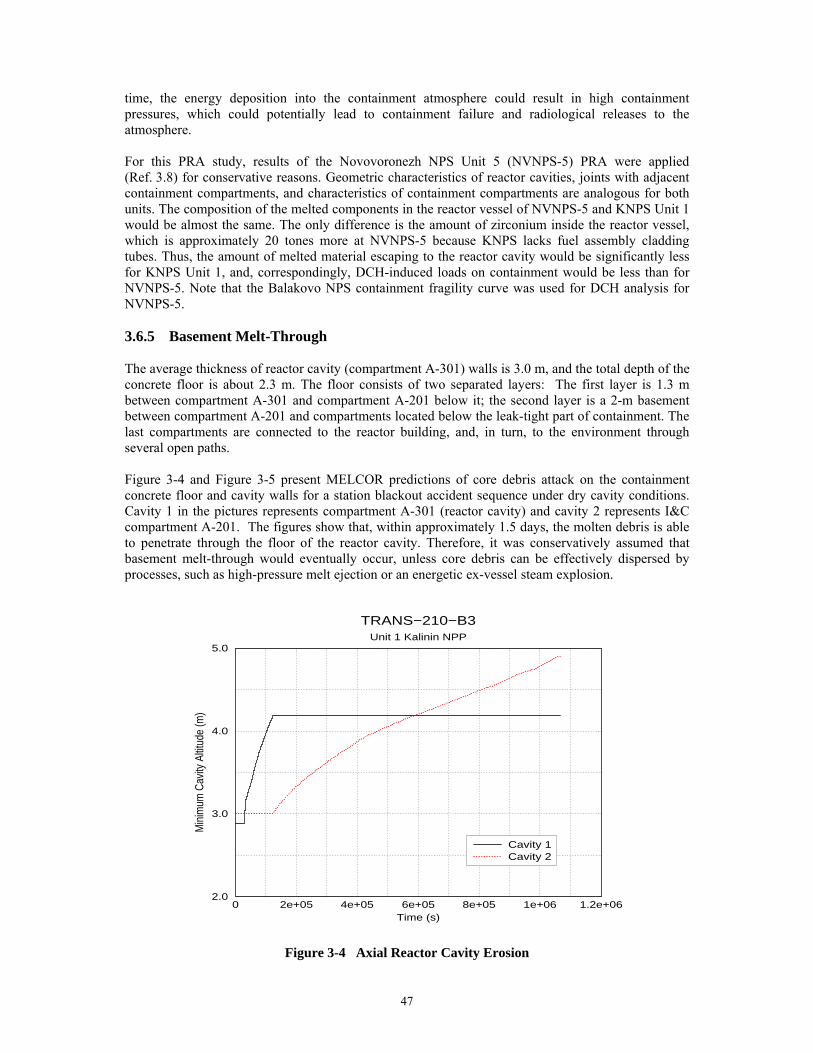
47
time, the energy deposition into the containment atmosphere could result in high containment pressures, which could potentially lead to containment failure and radiological releases to the atmosphere. For this PRA study, results of the Novovoronezh NPS Unit 5 (NVNPS-5) PRA were applied (Ref. 3.8) for conservative reasons. Geometric characteristics of reactor cavities, joints with adjacent containment compartments, and characteristics of containment compartments are analogous for both units. The composition of the melted components in the reactor vessel of NVNPS-5 and KNPS Unit 1 would be almost the same. The only difference is the amount of zirconium inside the reactor vessel, which is approximately 20 tones more at NVNPS-5 because KNPS lacks fuel assembly cladding tubes. Thus, the amount of melted material escaping to the reactor cavity would be significantly less for KNPS Unit 1, and, correspondingly, DCH-induced loads on containment would be less than for NVNPS-5. Note that the Balakovo NPS containment fragility curve was used for DCH analysis for NVNPS-5. 3.6.5 Basement Melt-Through The average thickness of reactor cavity (compartment A-301) walls is 3.0 m, and the total depth of the concrete floor is about 2.3 m. The floor consists of two separated layers: The first layer is 1.3 m between compartment A-301 and compartment A-201 below it; the second layer is a 2-m basement between compartment A-201 and compartments located below the leak-tight part of containment. The last compartments are connected to the reactor building, and, in turn, to the environment through several open paths. Figure 3-4 and Figure 3-5 present MELCOR predictions of core debris attack on the containment concrete floor and cavity walls for a station blackout accident sequence under dry cavity conditions. Cavity 1 in the pictures represents compartment A-301 (reactor cavity) and cavity 2 represents I&C compartment A-201. The figures show that, within approximately 1.5 days, the molten debris is able to penetrate through the floor of the reactor cavity. Therefore, it was conservatively assumed that basement melt-through would eventually occur, unless core debris can be effectively dispersed by processes, such as high-pressure melt ejection or an energetic ex-vessel steam explosion.
0 2e+05 4e+05 6e+05 8e+05 1e+06 1.2e+06Time (s)
2.0
3.0
4.0
5.0
Min
imum
Cav
ity A
ltitu
de (m
)
TRANS−210−B3Unit 1 Kalinin NPP
Cavity 1Cavity 2
Figure 3-4 Axial Reactor Cavity Erosion

48
0 2e+05 4e+05 6e+05 8e+05 1e+06 1.2e+06Time (s)
3.0
4.0
5.0
6.0
7.0
8.0
Max
imum
Cav
ity R
adiu
s (m
)
TRANS−210−B3Unit 1 Kalinin NPP
Cavity 1Cavity 2
Figure 3-5 Radial Reactor Cavity Erosion Note that the presence of water on the cavity floor has a minimal impact on the concrete penetration. Taking into account that the cylindrical cavity is relatively small (a diameter of about 6 m), it was assumed that in any case water would not provide sufficient cooling of the molten core debris. The small cavity leads to a deep debris pool that would result in a high rate of erosion. The design of the basement (i.e., built-in compartments connecting ultimately to the environment) was taken into account in the analyses of source terms. 3.6.6 Vessel Thrust Force During severe accidents that proceed under high primary pressure (which is a probable situation for accidents caused by transient IEs) to vessel breach, there is some likelihood that the vessel thrust forces could lead to reactor pressure vessel lift-off toward the containment boundary. Such a reaction could cause the vessel to fail (i.e., “vessel rocketing”) or to break the leak-tight penetrations of feed-water and steam piping. An analysis of vessel thrust forces documented in Ref. 3.7 showed that this issue does not lead to failure of containment integrity or tightness. 3.6.7 Temperature-Induced Hot Leg, Pressurizer Surge Line, and Steam Generator
Header/Tube Failure During severe accidents under high RCS pressure (e.g., station blackout accidents), there is the potential for extensive heating of the hot leg, pressurizer surge line, and steam generator tubes, as a result of repeated operation of the pressurizer valve and/or natural circulation within the RCS. Under these conditions, the thermal-induced internal stresses of the metallic components of the RCS could exceed the stress limits, leading to primary system failure (i.e., hot leg, surge line, or steam generator tubes), before bottom head failure of the reactor pressure vessel. This scenario has the potential to depressurize the RCS, thus averting the potential impact of high-pressure melt ejection-induced DCH. Steam generator tube ruptures caused by high temperatures could lead to radiological releases directly into the environment, bypassing containment.

49
Detailed analyses (Ref. 3.7) showed that rupture of either the hot leg or the surge line would most likely occur before lower head failure of the reactor pressure vessel and steam generator tubes/header. 3.6.8 Containment Overpressure As an accident progresses, a significant amount of steam is generated as a result of the initial primary leak or after reactor vessel failure (for primary-circuit high-pressure scenarios) and as a result of interaction of core debris and reactor metal internals with water. These phenomena cause containment pressure buildup. When the core debris comes to the reactor cavity, it starts to interact with the concrete floor of the reactor cavity. This interaction generates permanent gases, which also contribute to containment pressure. If the containment spray system is not in operation, containment pressure buildup and containment failure are possible. Using the MELCOR calculations and the probabilistic fragility curve of containment, conditional failure probabilities were calculated. These probabilities are very low at very early, early, and late time frames of the accidents. At the very late time frame, this probability was estimated as equal to one for cases when either containment spray system or LPECCS is unavailable in recirculation mode. 3.6.9 Reactor Vessel Bottom Head Failure Heating and damage of the reactor core and metal reactor structures occur in a case of severe accidents with absence of primary circuit heat removal from the secondary side and accidents with a leak when there is no compensation of primary coolant loss. Damage of the reactor core and metal reactor internals leads to relocation of damaged components to the bottom part of the reactor vessel. After damaged components fall on the reactor vessel bottom head, its heating starts (because of residual heat in the damaged fuel). Increase of the metal temperature of the reactor vessel bottom head leads to degradation of strength properties of the reactor vessel bottom head material. Stresses in the reactor bottom head occur as a result of weight loads (core debris and damaged metal reactor internals) and internal reactor vessel pressure (for accidents under high primary pressure). Depending on temperature of the reactor bottom head metal, these stresses can exceed values that are characteristic for material plastic deformation. As a result, the reactor bottom head fails (is damaged). Reactor bottom head failure can occur under both high reactor vessel pressure (accident scenarios with absence of heat removal from the core) and low reactor vessel pressure (accident scenarios with primary circuit leak). One type of reactor bottom head failure under low reactor vessel pressure, full-size reactor bottom head rupture or forming of a hole of some size, does not affect further accident progression. One type of reactor bottom head failure under high reactor vessel pressure, rocketing effect (reactor pressure vessel lift-up), significantly affects further accident progression. A full-size reactor bottom head rupture is the most probable scenario for reactor bottom head failure at KNPS Unit 1, based on the welded joint of the elliptic reactor bottom head and cylindrical reactor vessel. The elevation of this welded joint is beyond the level of core debris on the reactor bottom head. Circulating flow of core debris in the area of the welded joint would lead to intensive heat and mass exchange (generation of eutectic compounds) near the joint. Moreover, the welded joint is a place of stress concentration. Based on these facts, the team concluded that a full-size reactor bottom head rupture was most probable at the unit. 3.7 Severe Accident Progression Analysis Detailed severe accident progression analysis is presented in Ref. 3.3, Ref. 3.7, and Ref. 3.9 and summarized in the following subsections. 3.7.1 Accident Progression Event Trees Within the framework of the BETA Project, APETs for severe containment accidents for KNPS Unit 1 were developed and analyzed in two ways. One method used previously applied tools (see

50
Ref. 3.8), which are described below. Another method used the SAPHIRE PRA computer code earlier applied for the Level 1 PRA (see Section 2 of this summary report). All of the steps performed for accident progression analysis using the EVNTRE code (see below in this section) also were performed using SAPHIRE version 7.19. The main goal of this work was to develop an integrated model for both the Level 1 and Level 2 PRA. The Level 2 PRA modeling with SAPHIRE allowed the following: • use of multi-branch logic for ET models • use of special partition rules for grouping MCSs of the expanded PRA model3 into PDSs
according to PDS attributes • transfer of PDSs (abbreviation and frequencies) to special containment APETs as IEs • use of dynamic ET rules to take into account additional dependency logic for containment ET
progression • integration of Level 1 and 2 PRA models within the common SAPHIRE model • exclusion of “hand work” mistakes in the Level 1 and 2 PRA interface • provision of sensitivity analysis concerning Level 1 PRA parameters. Details concerning the second method may be found in Section 9 of Ref. 3.2. Section 3.9 of this summary report provides results of the sensitivity study conducted using the SAPHIRE Level 2 PRA model. In the first method, the event progression analysis computer code EVNTRE (Ref. 3.10) was used to develop containment severe APETs for KNPS Unit 1. Severe accident progression was modeled by a sequence of nodal questions in an APET. Each APET included all relevant phases of severe accidents and addressed the potentially most significant severe accident issues relevant to VVER-1000 plants with a large, dry, concrete containment. The APET developed for KNPS Unit 1 consists of 35 nodal questions, as shown in Table 3-5. The selection of the number of special questions balanced two issues: 1) the need to minimize the number of questions to develop easily analyzed containment ETs and 2) the desire to consider all possible events accompanying severe accidents affecting either containment integrity or radioactive releases into the environment. Therefore, the number of nodal questions is reasonable for tracing the containment failure modes through the calculation of the branches and making the results relatively transparent.
3 “Expanded PRA model” means Level 1 PRA model expanded with Level 1 and 2 PRA bridge trees.
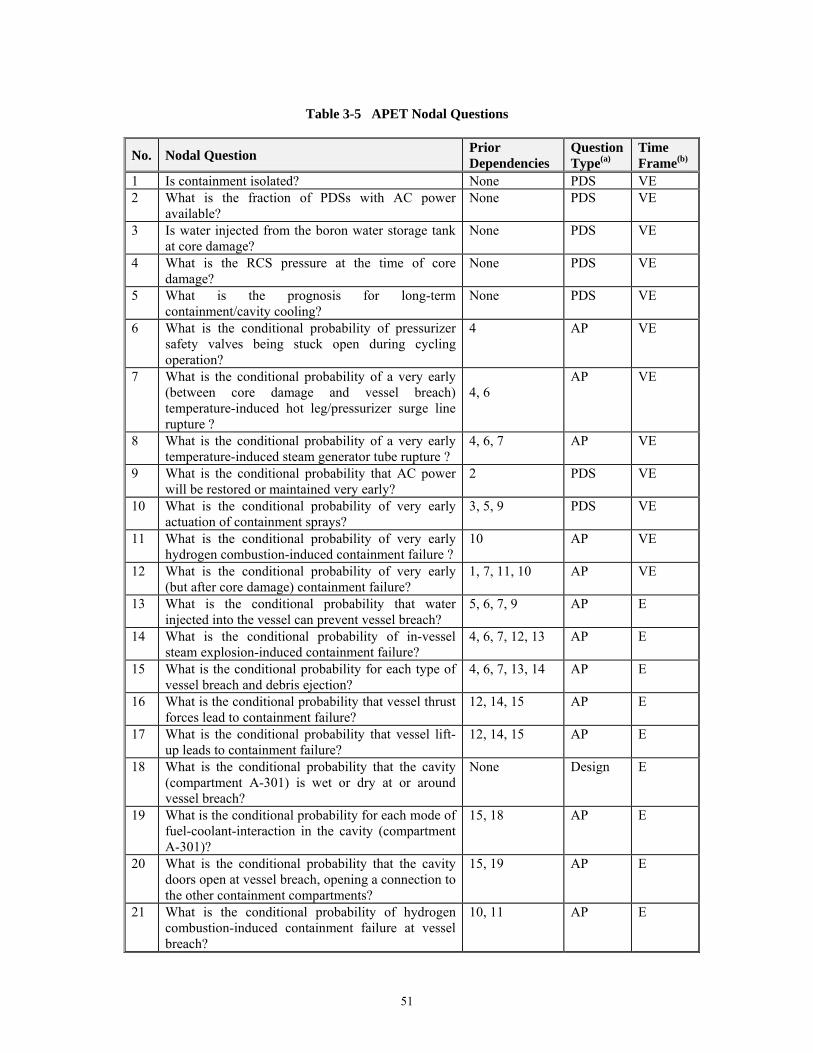
51
Table 3-5 APET Nodal Questions
No. Nodal Question Prior Dependencies
Question Type(a)
Time Frame(b)
1 Is containment isolated? None PDS VE 2 What is the fraction of PDSs with AC power
available? None PDS VE
3 Is water injected from the boron water storage tank at core damage?
None PDS VE
4 What is the RCS pressure at the time of core damage?
None PDS VE
5 What is the prognosis for long-term containment/cavity cooling?
None PDS VE
6 What is the conditional probability of pressurizer safety valves being stuck open during cycling operation?
4 AP VE
7 What is the conditional probability of a very early (between core damage and vessel breach) temperature-induced hot leg/pressurizer surge line rupture ?
4, 6
AP VE
8 What is the conditional probability of a very early temperature-induced steam generator tube rupture ?
4, 6, 7 AP VE
9 What is the conditional probability that AC power will be restored or maintained very early?
2
PDS VE
10 What is the conditional probability of very early actuation of containment sprays?
3, 5, 9 PDS VE
11 What is the conditional probability of very early hydrogen combustion-induced containment failure ?
10 AP VE
12 What is the conditional probability of very early (but after core damage) containment failure?
1, 7, 11, 10 AP VE
13 What is the conditional probability that water injected into the vessel can prevent vessel breach?
5, 6, 7, 9 AP E
14 What is the conditional probability of in-vessel steam explosion-induced containment failure?
4, 6, 7, 12, 13 AP E
15 What is the conditional probability for each type of vessel breach and debris ejection?
4, 6, 7, 13, 14 AP E
16 What is the conditional probability that vessel thrust forces lead to containment failure?
12, 14, 15 AP E
17 What is the conditional probability that vessel lift-up leads to containment failure?
12, 14, 15 AP E
18 What is the conditional probability that the cavity (compartment A-301) is wet or dry at or around vessel breach?
None Design E
19 What is the conditional probability for each mode of fuel-coolant-interaction in the cavity (compartment A-301)?
15, 18 AP E
20 What is the conditional probability that the cavity doors open at vessel breach, opening a connection to the other containment compartments?
15, 19 AP E
21 What is the conditional probability of hydrogen combustion-induced containment failure at vessel breach?
10, 11 AP E

52
No. Nodal Question Prior Dependencies
Question Type(a)
Time Frame(b)
22 What is the conditional probability of early containment failure?
1, 8, 12, 13, 14, 15, 16, 17, 19, 20, 21
AP E
23 What is the conditional probability that AC power will be restored or maintained late?
9 PDS L
24 What is the conditional probability that the sprays are available late?
5, 10, 23 PDS L
25 What is the conditional probability that the emergency support functions are available late?
23, 24 PDS L
26 What is the conditional probability that core debris is in a coolable configuration?
5, 15, 19, 24 AP L
27 What is the conditional probability of late hydrogen and carbon monoxide combustion?
11, 21, 25 AP L
28 What is the conditional probability of late containment failure?
1, 8, 12, 13, 19, 22, 25, 27
AP L
29 What is the conditional probability of hermetic (floor of compartment A-301) basement melt-through?
1, 8, 12, 13, 22, 26, 28
AP L
30 What is the conditional probability that the cavity (compartment A-201) is wet or dry late?
None AP, PDS L
31 What is the conditional probability of very late containment failure from overpressurization?
1, 3, 5, 24 AP L
32 What is the conditional probability for each mode of basement (floor of compartment A-201) failure?
29, 30 AP L
33 What is the summary of final containment status? 1, 8, 12, 13, 17, 22, 28, 31, 32
AP L
34 What is the time of core damage? None AP VE 35 What is the IE type? None PDS VE
(a) PDS - plant damage state, AP - accident progression. (b) E - early time frame, L - late time frame, VE - very early time frame. Three time phases are included in this APET structure: 1. Accident progression from initiation of core damage to the time of debris relocation into the
reactor vessel lower plenum 2. Phenomena occurring from the time of debris relocation into the lower plenum until soon after
reactor pressure vessel breach 3. Phenomena occurring several hours after vessel breach and during extensive core-concrete
interaction. Containment severe APETs (which served as part of the input deck for the EVNTRE computer code) are sequences of interconnected severe accident events actualized by Boolean algebra equations. The end states of these APETs were gathered in release categories by developing a special input deck for the EVNTRE code. The EVNTRE code calculated conditional probabilities of the release categories. Input decks for the EVNTRE code (the containment severe APETs and rules for end state gathering) are presented in Ref. 3.9.

53
3.7.2 Accident Progression Event Tree Quantification Severe accident analysis requires the investigation of a large number of physical and chemical phenomena, possible recovery actions, and safety system states. Based on MELCOR calculations and special analysis, there are an enormous number of possible sequences of severe accident progression to be considered in the analysis, along with uncertainty in the effects of different phenomena. The EVNTRE code can account for different accident progressions to calculate the probabilities of various radiological releases (see Section 3.7.3) into the environment. The PDSs presented in Table 3-4 and associated frequencies were used for APET quantification. The quantification was based on the following: • results of the Level 1 PRA • information from PDSs • expert estimation • international experience (Ref. 3.11) • design features of KNPS Unit 1 • severe accident phenomena analysis and the impact of severe accidents on containment integrity • dependency between phenomena • MELCOR calculations. Details of severe accident progression nodal questions and fractional conditional probabilities of accident sequences are described in Ref. 3.2. 3.7.3 Fission Product Release Categories The results of APET analysis led to a large number of end states, which needed to be binned for source term analysis. This process is similar to the binning process used for the PDS definition. The outcome of APET analysis was classified into a manageable number of release categories (classes, bins) characterized by similarities in accident progression and source terms. Definitions of release categories contain information on the accident sequence identity and status of containment systems. However, because the possible number of release bins to be evaluated increases drastically with the degree of detail included in the bin definitions, the release attributes needed to be limited and focused on the important aspects of the accidents. Release category definitions based on the MELCOR calculations results (Ref. 3.3) were used. The quantity of radionuclide releases into the environment (for each radioactive class), which MELCOR calculated, were normalized relative to initial core inventory (i.e., at the time of reactor scram). The range of fractional releases was split into several categories. The fractional releases of isotopes of iodine and cesium were used as base characteristics for release category definitions. These isotopes were chosen based on the following: 1. Isotopes of iodine and cesium are the most significant contributors to early and latent human
fatalities. 2. Fractional release of these isotopes into the environment could be considered a quantitative
measure of accident severity. 3. Isotopes of iodine and cesium are the most volatile in fuel (except noble gases) and are released
earlier and in larger amounts than other radionuclides. The process by which the release categories were defined from results of the MELCOR calculations is illustrated in Figure 3-6 and Figure 3-7. These figures plot cesium and iodine release fractions from each of 27 MELCOR calculations on a logarithmic scale. The wide range of values was divided in several orders-of-magnitude. Review of accident progression features in each of the calculations allowed the team to identify characteristic that drive observed differences in magnitudes of fission

54
product releases. Once these characteristics were identified, they were used as criteria to group similar accident progressions in the APETs and equate them to the proper release category. The characteristics are presented in Table 3-6.
1.0E-06
1.0E-05
1.0E-04
1.0E-03
1.0E-02
1.0E-01
1.0E+00
0 1 2 3 4 5 6 7 8 9 10 11 12 13 14 15 16 17 18 19 20 21 22 23 24 25 26 27 28 29
1-TRANS-108-A1 2-TRANS-108-A1-VE 3-TRANS-108-A1-E 4-TRANS-108-A1-L 5-TRANS-108-B1 6-TRANS-108-B1-VE 7-TRANS-108-B1-E 8-TRANS-108-B1-L 9-TRANS-108-B2 10-TRANS-108-B2-E 11-TRANS-210-A1 12-TRANS-210-B3 13-BYPASS-111-A3 14-LLOCA-101-B2 15-LLOCA-101-B2-E 16-LLOCA-101-B2-L 17-SLOCA-105-B1 18-SLOCA-105-B1-E 19-SLOCA-105-B3 20-SLOCA-105-B3-E 21-SLOCA-105-B3-L 22-BT-113-B1 23-BT-113-B1-E 24-BT-113-B1-L 25-BT-113-B3 26-BT-113-B3-E 27-BT-113-B1-L
Figure 3-6 Iodine Release Fractions from MELCOR Calculations
1.0E-08
1.0E-07
1.0E-06
1.0E-05
1.0E-04
1.0E-03
1.0E-02
1.0E-01
1.0E+00
0 1 2 3 4 5 6 7 8 9 10 11 12 13 14 15 16 17 18 19 20 21 22 23 24 25 26 27 28 29
1-TRANS-108-A1 2-TRANS-108-A1-VE 3-TRANS-108-A1-E 4-TRANS-108-A1-L 5-TRANS-108-B1 6-TRANS-108-B1-VE 7-TRANS-108-B1-E 8-TRANS-108-B1-L 9-TRANS-108-B2 10-TRANS-108-B2-E 11-TRANS-210-A1 12-TRANS-210-B3 13-BYPASS-111-A3 14-LLOCA-101-B2 15-LLOCA-101-B2-E 16-LLOCA-101-B2-L 17-SLOCA-105-B1 18-SLOCA-105-B1-E 19-SLOCA-105-B3 20-SLOCA-105-B3-E 21-SLOCA-105-B3-L 22-BT-113-B1 23-BT-113-B1-E 24-BT-113-B1-L 25-BT-113-B3 26-BT-113-B3-E 27-BT-113-B3-L
Figure 3-7 Cesium Release Fractions from MELCOR Calculations
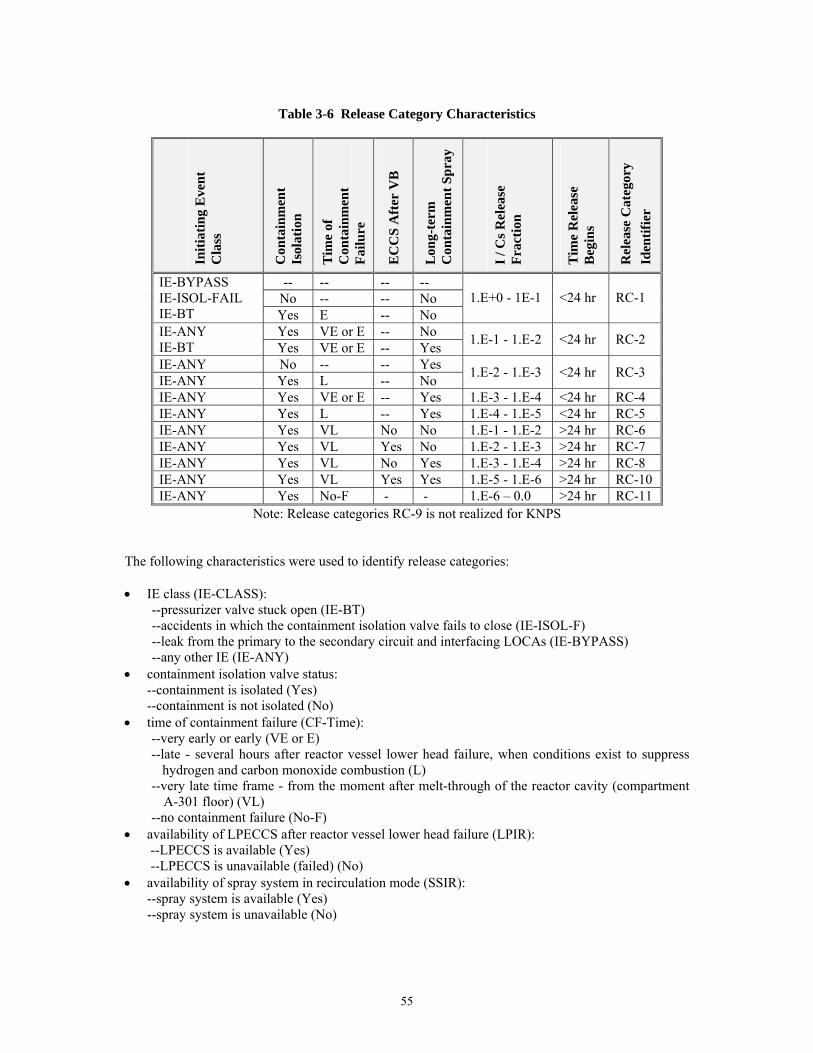
55
Table 3-6 Release Category Characteristics
Initi
atin
g E
vent
C
lass
Con
tain
men
t Is
olat
ion
Tim
e of
C
onta
inm
ent
Failu
re
EC
CS
Aft
er V
B
Lon
g-te
rm
Con
tain
men
t Spr
ay
I / C
s Rel
ease
Fr
actio
n
Tim
e R
elea
se
Beg
ins
Rel
ease
Cat
egor
y Id
entif
ier
-- -- -- -- No -- -- No
IE-BYPASS IE-ISOL-FAIL IE-BT Yes E -- No
1.E+0 - 1E-1 <24 hr RC-1
Yes VE or E -- No IE-ANY IE-BT Yes VE or E -- Yes 1.E-1 - 1.E-2 <24 hr RC-2
IE-ANY No -- -- Yes IE-ANY Yes L -- No 1.E-2 - 1.E-3 <24 hr RC-3
IE-ANY Yes VE or E -- Yes 1.E-3 - 1.E-4 <24 hr RC-4 IE-ANY Yes L -- Yes 1.E-4 - 1.E-5 <24 hr RC-5 IE-ANY Yes VL No No 1.E-1 - 1.E-2 >24 hr RC-6 IE-ANY Yes VL Yes No 1.E-2 - 1.E-3 >24 hr RC-7 IE-ANY Yes VL No Yes 1.E-3 - 1.E-4 >24 hr RC-8 IE-ANY Yes VL Yes Yes 1.E-5 - 1.E-6 >24 hr RC-10 IE-ANY Yes No-F - - 1.E-6 – 0.0 >24 hr RC-11
Note: Release categories RC-9 is not realized for KNPS The following characteristics were used to identify release categories: • IE class (IE-CLASS):
--pressurizer valve stuck open (IE-BT) --accidents in which the containment isolation valve fails to close (IE-ISOL-F) --leak from the primary to the secondary circuit and interfacing LOCAs (IE-BYPASS) --any other IE (IE-ANY)
• containment isolation valve status: --containment is isolated (Yes) --containment is not isolated (No)
• time of containment failure (CF-Time): --very early or early (VE or E) --late - several hours after reactor vessel lower head failure, when conditions exist to suppress
hydrogen and carbon monoxide combustion (L) --very late time frame - from the moment after melt-through of the reactor cavity (compartment А-301 floor) (VL)
--no containment failure (No-F) • availability of LPECCS after reactor vessel lower head failure (LPIR):
--LPECCS is available (Yes) --LPECCS is unavailable (failed) (No)
• availability of spray system in recirculation mode (SSIR): --spray system is available (Yes)
--spray system is unavailable (No)
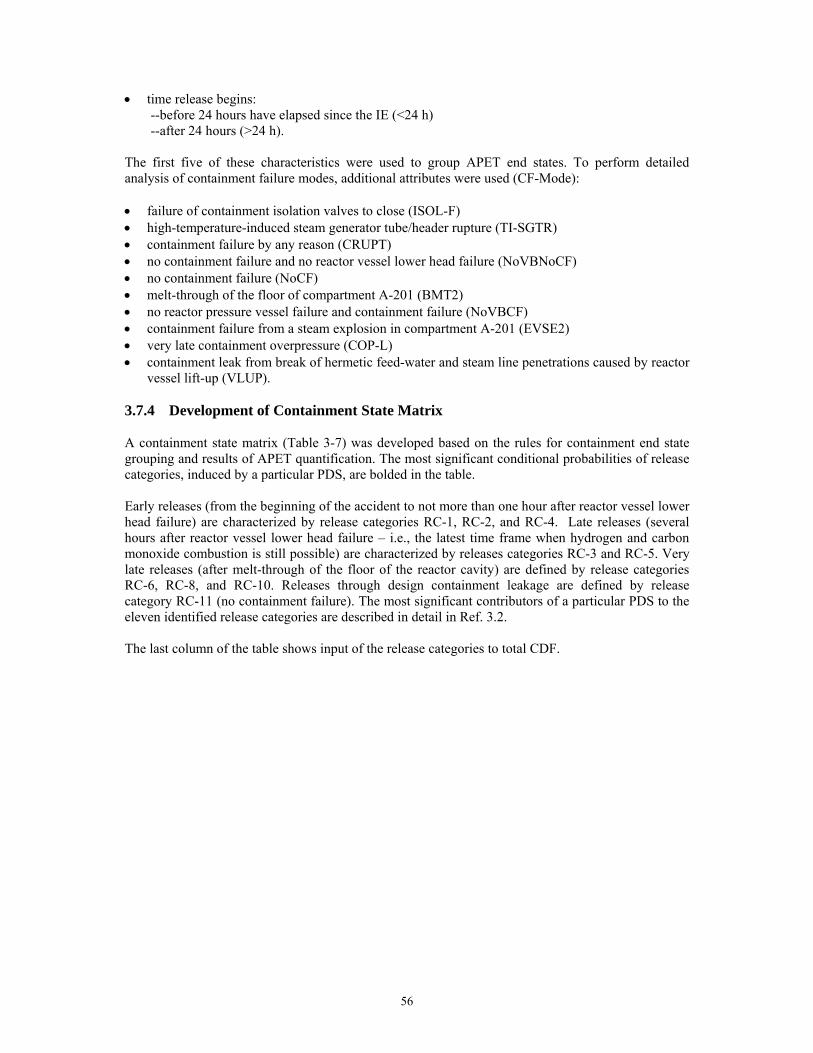
56
• time release begins: --before 24 hours have elapsed since the IE (<24 h) --after 24 hours (>24 h).
The first five of these characteristics were used to group APET end states. To perform detailed analysis of containment failure modes, additional attributes were used (CF-Mode): • failure of containment isolation valves to close (ISOL-F) • high-temperature-induced steam generator tube/header rupture (TI-SGTR) • containment failure by any reason (CRUPT) • no containment failure and no reactor vessel lower head failure (NoVBNoCF) • no containment failure (NoCF) • melt-through of the floor of compartment А-201 (BMT2) • no reactor pressure vessel failure and containment failure (NoVBCF) • containment failure from a steam explosion in compartment А-201 (EVSE2) • very late containment overpressure (COP-L) • containment leak from break of hermetic feed-water and steam line penetrations caused by reactor
vessel lift-up (VLUP). 3.7.4 Development of Containment State Matrix A containment state matrix (Table 3-7) was developed based on the rules for containment end state grouping and results of APET quantification. The most significant conditional probabilities of release categories, induced by a particular PDS, are bolded in the table. Early releases (from the beginning of the accident to not more than one hour after reactor vessel lower head failure) are characterized by release categories RC-1, RC-2, and RC-4. Late releases (several hours after reactor vessel lower head failure – i.e., the latest time frame when hydrogen and carbon monoxide combustion is still possible) are characterized by releases categories RC-3 and RC-5. Very late releases (after melt-through of the floor of the reactor cavity) are defined by release categories RC-6, RC-8, and RC-10. Releases through design containment leakage are defined by release category RC-11 (no containment failure). The most significant contributors of a particular PDS to the eleven identified release categories are described in detail in Ref. 3.2. The last column of the table shows input of the release categories to total CDF.

57
Table 3-7 Containment State Matrix
Release Category PDS RC-1 RC-2 RC-3 RC-4 RC-5 RC-6 RC-7 RC-8 RC-9 RC-10 RC-11 PDS
Frequency, 1/RY/ % of Total CDF
Conditional Probabilities LLOCA-101-A1 -- -- -- -- -- -- -- -- -- -- 1.0 9.71E-6/4.4 LLOCA-101-B2 -- 0.1 0.14 -- -- 0.76 -- -- -- -- -- 8.81E-5/40.3SLOCA-105-B1 -- -- -- 0.008 0.9 -- -- 0.089 -- -- -- 3.84E-6/1.8 SLOCA-105-B3 -- 0.041 0.31 -- -- 0.65 -- -- -- -- -- 2.19E-5/10.0TRANS-108-A1 <1.0E-3 <1.0E-3 -- <1.0E-3 0.057 -- -- -- -- 0.18 0.76 5.05E-5/23.1TRANS-108-B1 <1.0E-3 0.002 -- <1.0E-3 0.37 -- -- 0.63 -- -- <1.0E-3 2.26E-6/1.0 TRANS-108-B2 0.05 0.016 0.26 -- -- 0.67 -- -- -- -- -- 2.18E-5/10.0BT-113-B1 -- 5.00E-04 -- -- 0.44 -- -- 0.56 -- -- -- 1.43E-5/6.5 BT-113-B3 0.004 -- 0.28 -- -- 0.72 -- -- -- -- -- 4.78E-6/2.2 TRANS-208-B3 1.0 -- -- -- -- -- -- -- -- -- -- 7.80E-7/0.4 Bypass 1.0 -- -- -- -- -- -- -- -- -- -- 8.79E-7/0.4 Frequency, 1/RY
2.9E-6 1.01E-5 2.65E-5 3.8E-8 1.35E-5 9.88E-5 -- 9.77E-6 0 9.1E-6 4.82E-5 2.19E-4/100
Contribution to overall fission product release frequency
0.013 0.046 0.121 Negligible 0.062 0.452 -- 0.045 -- 0.042 0.220 1

58
Table 3-8 presents release categories in order of importance relative to total CDF.
Table 3-8 Release Categories in Order of Importance Relative to Total Core Damage Frequency
Release Category Description
Frequency of Release
Category, 1/RY
Contribution Release Category to Overall
Fission Product Release Frequency, %
RC-6 Very late CF, no spray, no ECCS 9.88E-5 45.1 RC-11 No CF 4.82E-5 22 RC-3 Late CF, no spray 2.65E-5 12.1 RC-5 Late CF, spray operation 1.35E-5 6.2 RC-2 Early CF, spray operation for BT or no
spray for transients and LOCAs 1.01E-5 4.6
RC-8 Very late CF, spray operation, no ECCS 9.77E-6 4.5 RC-10 Very late CF, spray operation, ECCS
operation 9.11E-6 4.2
RC-1 Early CF and no spray for BT(a), containment bypass, or containment isolation failure
2.86E-6 1.3
RC-4 Early CF, spray operation 3.82E-8 Negligible contributor RC-7 No releases 0 0 RC-9 No releases 0 0 Total Core Damage Frequency, 1/RY 2.19E-4 (a) BT – PDS for pressurizer safety valves. Release categories were additionally grouped based on the following characteristics: • time release begins:
--early --late --very late
• containment status: --containment failure --no containment failure.
Grouping results are presented in Table 3-9.
Table 3-9 Main Characteristics of Release Category Groups
Release Category
Group Name
Release Categories Included in Group
Frequency of Release Category Group,
1/RY
Contribution of Release Category Group to Overall
Fission Product Release Frequency, %
Early Release RC-1, RC-2, RC-4 1.3E-5 5.9 Late Release RC-3, RC-5 3.99E-5 18.2 Very Late Release
RC-6, RC-8, RC-10 1.18E-4 53.9
No Containment Failure
RC-11 4.82E-5 22

59
Data in Table 3-9 show that the main contributor to overall release is “very late releases” caused by containment failure from containment overpressure and concrete floor melt-through (53.9%). The next most significant contributor is “no containment failure” (22%). The late stage of containment failure, characterized by releases as a result of containment failure from inside pressure increasing hydrogen and carbon monoxide combustion contributes 18.2%. Early releases (caused by leaks from the primary to the secondary circuit, containment isolation valves that fail to close, or containment failure as a result of hydrogen combustion) contribute 5.9%. The results of MELCOR calculations for the most important PDS contributors were used to define the qualitative and quantitative structure of the release categories. Peculiarities and interrelations of different accident sequences progression were taken into account during release category analysis. For example, the scenario “transient with stuck open pressurizer safety valve” was treated as an accident “small LOCA with stuck open pressurizer safety valve.” 3.8 Accident Source Terms This section discusses the approach to assess environmental release quantities (source term) associated with each release category. Many design and operational characteristics of a plant and its containment systems influence the magnitude and characteristics of source terms. These characteristics include reactor core design, core power density and distribution, reactor coolant pressure, availability of cooling water, composition, temperature, concrete aggregate, containment design, geometric configuration, and the leakage and/or rupture pathways for the containment and primary and secondary coolant systems. In the study, the MELCOR (version 1.8.5) computer code was used to analyze the radiological source terms. 3.8.1 Grouping of Various Fission Products Twelve radiological groups were used to characterize the core radiological inventories and their release into the environment for KNPS Unit 1. The radiological groups are based on similarities in the thermodynamic and chemical properties of the various radionuclides. Initial core inventories of fission products for KNPS Unit 1 are presented in Ref. 3.2 and accepted according to Ref. 3.12. The main classes of radioactive materials used to characterize releases were cesium and iodine. The following subsections summarize behavior and main physical phenomena of radioactive material transportation. Detailed MELCOR calculation results are presented in Ref. 3.3. 3.8.2 In-Vessel Releases Small quantities of fission products created inside the fuel are released from the fuel pellets during normal operation. These fission products reside inside the gap between the fuel pellets and the cladding. The gap release by itself is not a significant contributor to severe accident source terms. During severe accidents, additional fission products are released by vaporization or some other thermally activated processes resulting from the heat-up of the fuel, and control and structural material inside the reactor core. Most of the fuel inventory of noble gases and volatile fission products are released as the core degrades. The release of Te is strongly controlled by the extent of Zr cladding oxidation. Accident sequences involving enhanced oxidation of Zr involve larger releases of Te. The release of semi-volatile (Sr-Ba) and refractory (Ru-La-Ce) radionuclides requires the fuel to stay at elevated temperatures (more than 2,000°C and more than 2,500°C, respectively) for a considerable length of time (Ref. 3.13).

60
3.8.3 Fission Product Transport in the Reactor Coolant System Following their release from fuel, fission products are carried along with the flow of steam and hydrogen, both as vapors and as aerosols. Fission product vapors can condense on cooler surfaces as well as on other aerosol particles during their passage through the RCS into containment or the environment. Fission product aerosols can agglomerate with other radioactive and nonradioactive aerosols to form larger particles, which can in turn settle on structural surfaces or water pools. Chemical interactions between fission product vapors or aerosols and metal surfaces lead to a slow heat-up of structural surfaces, which can increase the surface temperatures beyond those required for the revaporization of chemically unbound volatile fission products previously deposited. Another important issue, which often dominates the source terms for late containment failure scenarios, is the RCS revaporization fraction, following reactor pressure vessel breach. The revaporization component becomes important for high-pressure scenarios. 3.8.4 Ex-Vessel Releases Only a partial release of fission products occurs during the in-vessel phase of severe accidents. After debris ejection or relocation onto the cavity/containment floor, if a coolable core debris configuration is not maintained, high core debris temperatures are sustained as the melt interacts with the concrete basement. These high temperatures can potentially lead to release of more fission products into the containment atmosphere. Most of the core inventory of volatile fission products is released in-vessel; nevertheless, the remaining volatile (most notably Te) and some of the refractory fission products (lanthanides and actinides) are also released during interactions with the concrete. The quantity of fission products released during the ex-vessel phase of severe accidents is a function of the core debris temperature, Zr content of the core debris, the chemical activity of various species and compounds, and the gaseous content of the decomposing concrete. A large Zr content of core debris would lead to an increased rate of chemical energy addition to the melt from exothermic oxidation of Zr. This type of reaction leads to increases in melt temperature, concrete ablation, and gas generation rate. It subsequently results in higher generation of fission product aerosols. 3.8.5 Fission Product Transport Inside Containment Aerosol transport and deposition in containment are governed by several phenomena, including gravitational settling, thermophoresis, diffusiophoresis, and aerosol agglomeration and plate-out on vertical and horizontal surfaces. Most deposition processes are a function of aerosol particle size distribution and the ratio of deposition surfaces to containment volume. Spray system operation has a significant impact of fission product aerosol deposition. 3.8.6 Results of Radionuclide Releases into the Environment Table 3-10 summarizes results of source term calculations for specific severe accident scenarios, as calculated by the MELCOR computer code. Detailed results of releases calculations are presented in Ref. 3.3. Table 3-11 shows the most significant release categories for potential offsite consequences in term of “risk of activity.”

61
Table 3-10 Fractional Release of Radionuclides for Various Release Categoriesc
Release Categories
Characteristic RC-1 RC-2 RC-3 RC-5 RC-6 RC-8 RC-10 RC-11
Time release starts(a), h 3.0(b) 7.1 15.6 21.5 237 58.5 232 0.2 Release category frequency, 1/RY
2.86E-6 1.01E-5 2.65E-5 1.35E-5 9.88E-5 9.77E-6 9.11E-6 4.82E-5
Conditional probability 0.013 0.046 0.12 0.062 0.45 0.045 0.042 0.22 Radionuclide Group Xe 0.99 0.95 0.98 0.13 1.0 0.37 0.59 6.8E-4 Cs 0.8 0.005 0.009 1.4E-6 0.027 3.2E-4 2.4E-7 2.1E-8 Ba 0.57 0.038 0.048 1.4E-5 0.005 4.9E-4 4.4E-6 4.5E-8 I 0.82 0.011 0.016 0.005 0.036 0.002 8.8E-6 1.8E-5 Te 0.47 0.046 0.059 4.0E-5 0.029 0.002 8.4E-8 7.2E-9 Ru 0.12 0.006 5.9E-4 1.1E-7 4.51E-5 6.6E-6 2.6E-7 3.5E-9 Mo 0.18 0.001 4.8E-5 2.4E-6 0.087 2.3E-6 0.067 6.5E-9 Ce 0.033 0.007 1.1E-4 3.7E-7 5.6E-5 1.0E-5 1.4E-7 1.8E-7 La 0.5 0.057 0.015 5.0E-7 4.5E-5 3.4E-4 7.9E-8 6.3E-10 U 0.029 0.012 1.9E-4 7.0E-8 4.9E-5 2.5E-6 3.4E-6 1.2E-5 Cd 0.6 0.039 0.032 1.2E-5 0.013 1.8E-4 0.001 6.7E-9 Sn 0.58 0.047 0.003 5.4E-6 0.027 5.5E-4 0.002 2.7E-7
(a) Beginning of release corresponds to the time of containment failure, beginning of releases into the environment for accidents with primary to secondary circuit leakage, or beginning of releases in accidents in which containment isolation valves fail to close. For release category RC-11 (no containment failure), beginning of release corresponds to the moment of radioactivity release from the fuel rod gas gap. (b) For release category RC-1, time release begins (for activity calculation) corresponds to the time releases begin for accident TRANS-210-B3. (c) A review of the radionuclide release results was performed immediately prior to publication of this report. As a result of this review it is observed that the release fractions presented in Table 3-10 for refractory metals (La, Ce and U in particular) are considerably higher than would be expected, based upon previous studies, for release categories RC-1, RC-2 and RC-3. In addition, the release fractions for iodine and cesium are lower than those for tellurium and barium, a result that is also unexpected based upon previous experience. This observation would affect Tables 3-11 and 3-14 as well. These issues should be addressed in future work.

62
Table 3-11 Fractional Risk of Release Activitiesa
Release Category
Fractional Risk of Release Activity Relative to Total Risk of Activity, %
Contribution to Risk of Significant Accident Scenario Activity for Particular Release Category, %
Most Significant Physical Phenomena in Release Category
TRANS-108-B2 - “transient” with pressurizer safety valve stuck open
41 Hydrogen combustion
BYPASS-111-A1 - leak from primary to secondary circuit 31 IE
RC-1 44
TRANS-208-B3 - “transient” with containment isolation valve failure to close
27 IE
LLOCA-101-B2 - LLOCA with spray system failure 88 Hydrogen combustion SLOCA-105-B3 - small LOCA with spray system failure 9 Hydrogen combustion
RC-2 20
TRANS-108-B2 - high-pressure “transient” (spray system operates)
3 Hydrogen combustion
LLOCA-101-B2 - LLOCA with spray system failure 48 Hydrogen and carbon monoxide combustion
SLOCA-105-B3 - small LOCA with spray system failure 25 Hydrogen and carbon monoxide combustion
TRANS-108-B2 - low-pressure “transient” (pressurizer safety valve stuck open and spray system failure)
21 Hydrogen and carbon monoxide combustion
RC-3 20
BT-113-B3 – pressurizer safety valve stuck open and spray system failure
5 Hydrogen and carbon monoxide combustion
LLOCA-101-B2 - LLOCA with spray system failure 67 Containment overpressure as a result of steam and noncondensable gas production
TRANS-108-B2 - “transient” with spray system failure 14 Containment overpressure as a result of steam and noncondensable gas production
SLOCA-105-B3 - small LOCA with spray system failure 14 Containment overpressure as a result of steam and noncondensable gas production
RC-6 14
BT-113-B3 - pressurizer safety valve stuck open and spray system failure
4 Containment overpressure as a result of steam and noncondensable gas production
(a) See note (c) in Table 3-10.

63
The results show that spray system operation reduces the release of all aerosols for early, late and very late scenarios. A larger retention is noted for late containment failure scenarios, where there is more time for sprays to be effective in washing the aerosols from the atmosphere (RC-8). For accidents in which containment does not fail (RC-11), releases are relatively small, and they result from the design leakage from containment. Accidents with leaks from the primary to the secondary circuit, leaks from containment that cannot be isolated, or pressurizer safety valves stuck open (no spray system) result in a relatively high source term, but the associated frequency is relatively small. Significant radioactive releases into the environment for RC-1 are explained by the existence of direct paths for releases into the environment (leak from the primary to the secondary circuit and accidents in which containment isolation valves fail to close). For accidents in which the pressurizer safety valve is stuck open and the spray system fails (also representative of RC-1), significant releases are explained by the very close location of the source of radioactivity (bubbler tank) to the containment break (formation of a hole). For accidents involving late and very late containment failure, the releases of aerosols during melting core-concrete interaction are gradual, and thus more aerosols are retained in containment. Release activities were calculated to qualitatively estimate the importance of the release categories to potential offsite consequences. “Risk of activity” (defined as release frequency multiplied by associated activity) was used as a characteristic of the importance. The results of ORIGEN computer code calculations for standard PWRs, normalized on reactor core thermal power, were used to define the KNPS Unit 1 core inventory (in term of isotopic activity). Sixty isotopes were considered. To calculate release category activity, radioactive decay of isotopes was taken into account from the moment of reactor scram until releases into the environment begin. Complete results of release category activity are presented in Ref. 3.2. 3.9 Sensitivity Study The Level 1 and Level 2 PRA demonstrated that two issues result in significant impact on KNPS Unit 1 safety: 1) the high probability of containment sump clogging in LOCAs and 2) flammable gas combustion events challenging containment. Therefore, a sensitivity study was performed for these issues for the Level 2 PRA using the SAPHIRE model (see Section 3.7.1). This study is even more valuable because KNPS is installing a hydrogen control system inside containment and reconstructing sumps to minimize sump strainer failure. These two efforts were analyzed in the sensitivity study, as follows: • Case 1 - Hydrogen Control in Containment. A spatially well-placed hydrogen control system (e.g.,
igniters, catalytic recombines, etc.) would prevent containment failure caused by rapid overpressurization from hydrogen and carbon monoxide combustion. For the purposes of this sensitivity study, combustion of hydrogen and carbon monoxide that could result in containment failure was suppressed in the SAPHIRE quantification process.
• Case 2 – Sump Reconstruction Effect. For the purpose of this sensitivity study, the whole quantification process was performed (from Level 1 PRA quantification to containment ET quantification), taking into account improved features of the sump.
Identified release categories were reassessed to determine the potential impact of these issues on estimated containment failure probabilities. The results of calculations presented in the three figures below show the following impact of judicious implementation of planned plant-specific modifications:
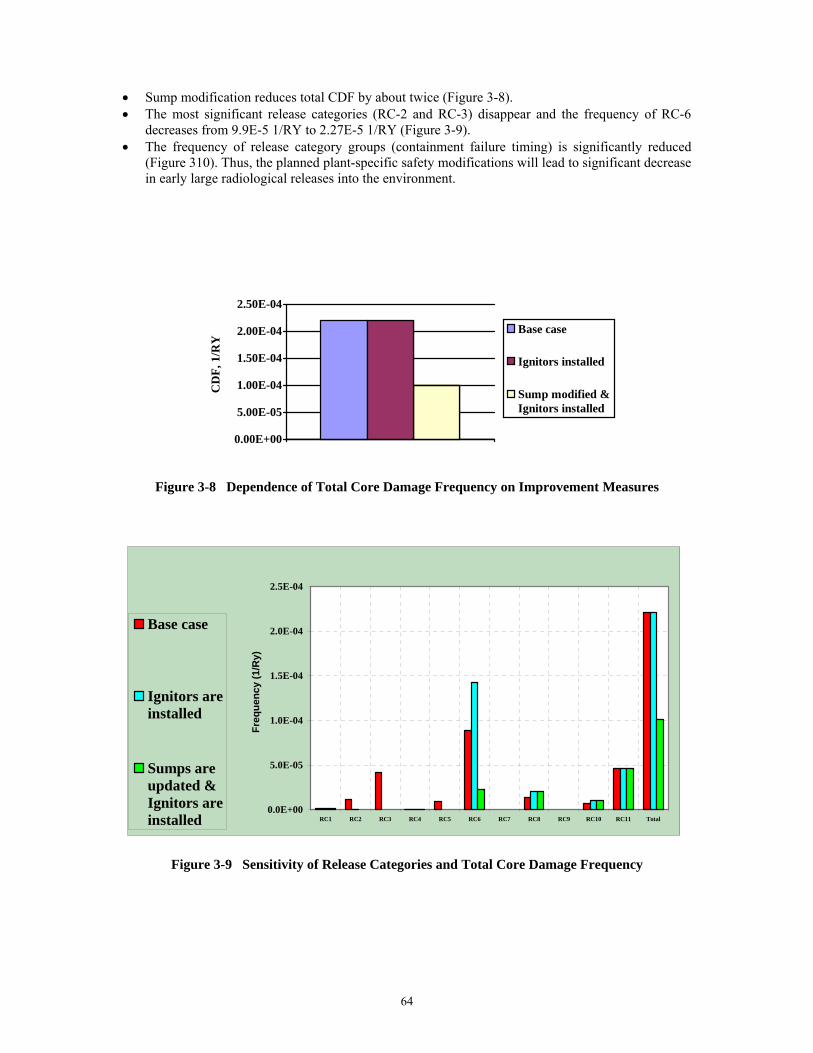
64
• Sump modification reduces total CDF by about twice (Figure 3-8). • The most significant release categories (RC-2 and RC-3) disappear and the frequency of RC-6
decreases from 9.9E-5 1/RY to 2.27E-5 1/RY (Figure 3-9). • The frequency of release category groups (containment failure timing) is significantly reduced
(Figure 310). Thus, the planned plant-specific safety modifications will lead to significant decrease in early large radiological releases into the environment.
0.00E+00
5.00E-05
1.00E-04
1.50E-04
2.00E-04
2.50E-04
CD
F, 1
/RY
Base case
Ignitors installed
Sump modified &Ignitors installed
Figure 3-8 Dependence of Total Core Damage Frequency on Improvement Measures
0.0E+00
5.0E-05
1.0E-04
1.5E-04
2.0E-04
2.5E-04
RC1 RC2 RC3 RC4 RC5 RC6 RC7 RC8 RC9 RC10 RC11 Total
Freq
uenc
y (1
/Ry)
Base case
Ignitors areinstalled
Sumps areupdated &Ignitors areinstalled
Figure 3-9 Sensitivity of Release Categories and Total Core Damage Frequency

65
0.0E+00
5.0E-05
1.0E-04
1.5E-04
2.0E-04
2.5E-04
Early Release Late ContainmentFailure
Very LateContainment Failure
No Containment Failure
Total CDF
Freq
uenc
y (1
/RY
)
1 Base case
2 Ignitors are installed
3 Sumps are updated & Ignitors are installed
Figure 3-10 Sensitivity of Frequencies of Release Category Groups (Containment Failure Timing) and Total Core Damage Frequency
3.10 Results and Conclusions The main purpose of the Level 2 PRA was to evaluate the performance of KNPS Unit 1 containment during severe accidents and to assess the magnitude of potential radiological releases into the environment. The plant response to various severe accident phenomenological issues, which can challenge containment integrity, was analyzed. The phenomenological issues included: • in-vessel and ex-vessel steam explosions • high-pressure melt ejection-induced DCH • reactor pressure vessel thrust forces at high pressure • failure of steam and feed-water line penetrations • hydrogen and carbon monoxide combustion • ex-vessel debris coolability and basement melt-through • temperature-induced steam generator tube/header rupture • containment overpressure • failure of reactor pressure vessel lower head. Grouping of PDSs, the interface between Level 1 and Level 2 PRAs, and the basis for APETs were provided and justified. The containment failure modes as well as source terms were also estimated. The important results of the completed Level 2 PRA are summarized in the following subsections. 3.10.1 Plant Damage States The results of the extended Level 1 PRA were grouped into PDSs. The contributions of the important PDSs to the total CDF for internal events are shown in Table 3-4. The main initiators that contribute to total CDF are as follows:

66
• large LOCAs (LLOCA-101-A1 and LLOCA-101-B2) • small LOCAs (SLOCA-105-B1 and SLOCA-105-B3) • high-pressure transients (TRANS-108-A1, TRANS-108-B1, and TRANS-108-B2) • stuck open pressurizer safety valve (BT-113-B1 and BT-113-B3) • failure to close of containment isolation valves (TRANS-208-B3) • leakage from the primary to the secondary circuit (BYPASS-111-A1). 3.10.2 Containment Performance The calculated conditional probability for KNPS Unit 1 containment failure is shown in Table 3-7. A total of eleven containment release categories were identified. The dominant contributor to the identified release categories (or containment failure modes) is very late containment failure without operation of spray and ECC systems (RC-6). This containment failure mode is mostly caused by containment overpressurization (from steam and noncondensable gas production) and containment basement melt-through (which contributes about 45% to failure probability). Several severe accidents will not lead to containment failure (i.e., the conditional probability for intact containment is about 22%). This mode is characterized by the availability of a supply of water for injection after core damage, if the primary system is depressurized, thus preventing vessel breach with some likelihood. It should be noted that, at KNPS Unit 1, the releases via the design leakage pathways under intact containment conditions are not significant. The next most significant release category contributor (RC-3) is late containment failure as a result of inside containment pressure increasing hydrogen and carbon monoxide combustion. The contribution of this release category is about 12% relative to total CDF. The contribution of the following release categories is distributed relatively equally: • Late containment failure (with spray system operation) caused by hydrogen and carbon monoxide
combustion (6%). • Early containment failure with pressurizer safety valves stuck open (with spray system operation),
“transients,” or LOCAs with spray system failure. Containment failure for this release category would be induced by containment pressure as a result of hydrogen combustion (4.6%).
• Very late containment failure with spray system operation and LPECCS failure. Containment failure would be mostly induced by containment concrete floor melt-through (4.5%).
• Very late containment failure with spray system operation and LPECCS operation. Containment failure would be mostly induced by containment concrete floor melt-through (4.2%).
The least significant contributor (1.3%) in terms of release frequency, but most important in terms of the quantity of radioactive materials released into the environment, is RC-1. This release category included accidents with leaks from the primary to the secondary circuit, accidents with containment isolation valves that fail to close, and accidents with pressurizer safety valves stuck open (with containment spray system failure). All remaining containment failure modes identified in the present study are not as significant:

67
• Early containment failure caused by hydrogen combustion (with or without the operation of the containment spray system) led to significant loads.
• The probability of containment failure from an in-vessel steam explosion is negligibly small as a result of the low probability of an in-vessel steam explosion.
• Ex-vessel steam explosions are possible for KNPS Unit 1, but the conditional probability of containment failure as a result of this phenomenon is negligible.
• Detailed analysis of containment failure from DCH was not performed in this study. DCH loads were estimated using results from Ref. 3.9. The conditional probability of DCH-induced containment failure is relatively low and provides no significant impact on containment.
Other physical phenomena considered in the study did not lead to significant loads on containment. Figures 3-11 and 3-12 show the contribution of release categories and release category groups to total CDF (see also Table 3-9). The latter figure shows that the most important release group is “very late containment failure” (54%) induced by containment overpressure and containment concrete floor melt-through. The second most important group is “no containment failure” (22%). Environmental releases for this group are defined by containment design leakage and the degree of fuel rod damage. Contributions of the other two groups (early and late releases) are : 6% and 18%, respectively.
12%22%
6%
4%
4%
46%
5%1%
RC-1 (1 - E-1, < 24 h) - Early CF, No Spray (Freq = 2.86E-6 1/RY) RC-2 (1E-1 - 1E-2, < 24 h) - Early CF, Spray Operation for BT (Freq = 1.01E-5 1/RY) RC-3 (1E-2 - 1E-3, < 24 h) - Late CF, No Spray (Freq = 2.65E-5 1/RY) RC-5 (1E-4 - 1E-5, < 24 h) - Late CF, Spray Operation (Freq = 1.35E-5 1/RY) RC-6 (1E-1 - 1E-2, > 24 h) - Very Late CF, No Spray, No ECCS (Freq = 1.35E-5 1/RY) RC-8 (1E-3 - 1E-4), > 24 h) - Very Late CF, Spray Operation, No ECCS (Freq = 9.77E-6 1/RY) RC-10 (1E-5 - 1E-6, > 24 h) - Very Late CF, Spray Operation, ECCS Operation (Freq = 9.11E-6 1/RY) RC-11 (1E-6 - 0, > 24 h) - No CF (Freq = 4.82E-5 1/RY)
Figure 3-11 Contribution of Various Release Categories to Overall Containment Failure Frequency (Base Case)

68
54%
22%
18%6%
Early Release - Frequency = 1.3E-5 1/RY Late Release - Frequency = 3.9E-5 1/RYVery Late Release - Frequency = 1.18E-4 1/RYNo Containment Failure - Frequency = 4.82E-5 1/RY
Figure 3-12 Contribution of Various Release Category Groups to Overall Containment Failure
Frequency (Base Case) The most important release categories for offsite consequences (risk of activity) are shown in Figure 3-13 and are as follows: 1. RC-1, characterized by early containment failure (44%) 2. RC-2, characterized by early containment failure (20%) 3. RC-3, characterized by late containment failure (20%) 4. RC-6, characterized by late containment failure (14% 5. Other release categories (2%)). Figure 3-13 illustrates that the contribution to risk of activity is approximately equal for RC-2 and RC-3. The main contributor to containment failure is hydrogen combustion at early and late stages and containment overpressure at very late stages.

69
Figure 3-13 Fractional Risk of Activity of Release Relative to Total Risk of Activity for Key Release Categories
3.10.3 Radiological Releases Figure 3-14 compares release fractions for various groups and containment release categories. The most important contributor to the amount of radioactive releases into the environment is RC-1 (leak from the primary to the secondary circuit, accidents with containment isolation valves that fail to close, and scenarios with pressurizer safety valves stuck open and no spray system operation). 3.10.4 Sensitivity Analysis A sensitivity study was performed for two issues significant to KNPS Unit 1 safety: containment sump clogging in LOCAs and flammable gas combustion events challenging containment (see Section 3.9). Results of the analysis (Figures 3-8 to 3-10) show that sump modification reduces total CDF by about twice. In addition, resolving both issues would cause the most significant release categories to disappear or significantly decrease and result in a significant reduction in the frequency of release category groups (containment failure timing) and in early large radiological releases into the environment. 3.10.5 Observations on Containment Performance Based on the results of the Level 2 PRA, several weaknesses were identified in containment for KNPS Unit 1. These weaknesses, in decreasing order of importance for frequency of release, are as follows:
44%
20%
14%
2%
20%
RC-1 (1 - 1E-1, < 24 h) - Early CF, No Spray (Freq = 2.86E-6 1/RY) RC-2 (1E-1 - 1E-2, < 24 h) - Early CF, Spray Operation for BT (Freq = 1.01E-5 1/RY) RC-3 (1E-2 - 1E-3, < 24 h) - Late CF, No Spray (Freq = 2.65E-5 1/RY) RC-6 (1E-1 - 1E-2, > 24 h) - Very Late CF, No Spray, No ECCS (Freq = 1.35E-5 1/RY)Other Release Categories

70
Figure 3-14 Comparison of Various Release Groups and Containment Release Categories [see note (c) in Table 3-10]
0.00
0.10
0.20
0.30
0.40
0.50
0.60
0.70
0.80
0.90
1.00 R
elat
ive
Rel
ease
of R
adio
nucl
ides
(%
of C
ore
Inve
ntor
y)
RC-1 RC-2 RC-3 RC-5 RC-6 RC-8 RC-10 RC-11
Containment Release Category
Xe
Cs
Ba
I
Te
Ru
Mo
Ce
La
U
Cd
Sn
71
• Overpressure from interaction between core debris, water, and concrete could cause very late
containment failure. • Hydrogen and carbon monoxide combustion could cause late containment failure. • A leak from the primary to the secondary circuit could cause containment bypass, or failure of a
containment isolation valve could cause early containment failure, or hydrogen combustion for events in which the pressurizer safety valve is stuck open could cause containment failure.
The most significant release category for offsite consequences is containment failure as a result of an IE with a leak from the primary to the secondary circuit, containment isolation valves that fail to close, or containment failure from hydrogen combustion (RC-1). Based on the results of the Level 2 PRA, the following actions are recommended: • Further evaluate the potential benefits of installing igniters or other combustible gas control measures. • Realize sump improvement measures. 3.11 References 3.1 Engineering and Technical Data Base for the MELCOR Code of Kalinin NPP Unit 1. 2002. Kalinin
NPP, Udomlia. 3.2 U.S. Nuclear Regulatory Commission and the Environmental, Industrial and Nuclear Supervision
Service of Russia. 2005. Kalinin VVER-1000, Nuclear Power Station Unit 1 PRA, Main Report: Level 2, Internal Initiators, NUREG/IA-0212, Volume 2, Part 2, Proprietary, not available for public distribution.
3.3 U.S. Nuclear Regulatory Commission and Federal Nuclear and Radiation Safety Authority of the
Russian Federation. 2005. Appendix A to Ref. 3.2, “MELCOR Input Deck Description and Calculation Results of the Severe Accident Analysis.”
3.4 U.S. Nuclear Regulatory Commission. 2000. MELCOR Computer Code Manual. Vol. 1: Primer and
Users’ Guide. Version 1.8.5. NUREG/CR-6119, Vol.1, Rev. 2, SAND-2000 -2417/1. 3.5 U.S. Nuclear Regulatory Commission. 2000. MELCOR Computer Code Manual. Vol.2: Reference
Manual. Version 1.8.5. NUREG/CR-6119, Vol. 2, Rev. 2, SAND-2000 -2417/2. 3.6 International Atomic Energy Agency. 2003. Balakovo Level 2 PSA main issues. IAEA Workshop.
Harmonization of Level 2 PSAs for VVER-Type Reactors. 20 – 24 October 2003, Sofia, Bulgaria. 3.7 U.S. Nuclear Regulatory Commission and the Federal Environmental, Industrial and Nuclear
Supervision Service of Russia. 2005. Appendix B to Ref. 3.2, “Containment Performance and Severe Accident Phenomena.”
3.8 SEC NRS. 1999. SWISRUS Project: Novovoronezh Unit 5 Probabilistic Safety Assessment. Main
Report. Part II: Level 2/Level 3 (Internal Initiating Events). 3.9 U.S. Nuclear Regulatory Commission and the Federal Environmental, Industrial and Nuclear
Supervision Service of Russia. 2005. Appendix C to Ref. 3.2, “Containment Event Tree Input Deck and Containment Event Tree End States Binning Input Deck for Event Progression Analysis Code.”

72
3.10 U.S. Nuclear Regulatory Commission. 1989. A Reference Manual for the Event Progression Analysis
Code (EVNTRE). NUREG/CR-5174, SAND88-1607. 3.11 U.S. Nuclear Regulatory Commission. 1989. Severe Accident Risk: An Assessment for Five U.S.
Nuclear Power Plants. NUREG-1150, Vol.2. 3.12 Characteristics of Irradiated Nuclear Fuel Reference Book. 1983. Energoatomizdat, Moscow. 3.13 U.S. Nuclear Regulatory Commission. 1989. “Severe Accident Risk: An Assessment of Five U. S.
Nuclear Power Plants,” Summary Report of NUREG-1150.

73
4. INTERNAL FIRE, FLOOD, AND SEISMIC ANALYSES
This section summarizes the limited-scope analyses performed for fire, flood, and seismic initiators for KNPS Unit 1 in the framework of the BETA Project. Detailed information is presented in Ref. 4.1. 4.1 Internal Fire Analysis 4.1.1 Objectives The objective of the internal fire analysis was to perform a limited-scope analysis of the influence of internal fires on the Level 1 PRA CDF of KNPS Unit 1. This work provided training for the Russian team in all aspects of fire analysis, from fire incident data gathering to estimating CDF resulting from a fire initiated in the reactor unit. The fire analysis consisted of the following tasks: • gathering KNPS data on internal fires (from design data and a special plant walkdown) to help with CDF
estimation • conducting KNPS fire incident analysis and developing a specific database with event descriptions
gained from the above data • developing fire scenarios • quantitatively assessing the impact of a fire in the Main Control Room (MCR) on CDF. 4.1.2 Fire Initiation Frequency Evaluation The approach to assess fire initiation frequency followed the guidelines provided by NRC experts. The approach called for estimates of fire occurrence frequencies to be based on VVER experience. Data from VVER plants other than KNPS were used to establish “VVER generic” prior distributions. KNPS experience was then used to formulate a set of updated fire frequency distributions. These distributions, in turn, were used to support the determination of the initiating frequency of specific fire scenarios. The approach used to assess fire initiation frequencies for fire zones was mainly “component-based.” The frequencies were defined per component for each component type considered as potential ignition sources, and the total frequency for fire zones was defined as a sum of frequencies from all component ignition sources located in the fire zone. Available information on fire incidents at Russian NPPs equipped with VVER and RBMK reactors was analyzed to estimate room fire hazards. Similar information available for fire incidents at PWR NPPs was analyzed as well (Ref. 4.2, Ref. 4.3, and Ref. 4.4). KNPS staff developed a specific database on fire incidents and fires at the KNPS (Ref. 4.5). Another specific database on fire incidents and fires at the Novovoronezh NPS was also used (Ref. 4.6). (Unit 5 of Novovoronezh NPS is the prototype of KNPS Unit 1). Information on U.S. NPPs was used to preliminarily assess fire occurrences at particular fire zones (rooms or a joint number of rooms) (Ref. 4.7).

74
4.1.3 Selection and Assessment of Compartments Based on design documentation, 32 compartments initially were selected for the analysis. Compartment screening and simplified assessment included walkdown and qualitative analysis of fire scenarios. As a result of this screening process, a list of 27 rooms was developed that would require further quantitative fire analysis. This quantitative analysis was carried using the SAPHIRE Level 1 PRA model for internal initiators to estimate the CDF impact from a fire within a particular room. Table 4-1 lists the rooms that were computed to contribute more than 1% to the internal event PRA CDF. A set of these rooms would require more detailed fire analysis, based on a more careful examination of the detailed contents of the room, but this task was beyond the scope of the project.
Table 4-1 List of Rooms with Fire Potential That Contribute More Than 1% to Core Damage Frequency for Internal Initiating Events
Room Identification CDFfire/CDFint Boric concentrate pumps room VC019 1.6% MCR-1 E-319/1 4.6% Steam generator room A-406 11.7% Make-up pumps room VC150 19.20% Make-up pumps oil system room VC018/1,2,3 19.20% Deaerator rack, cable semi stores under MCR E-205, E-207, E-209,
209/1,2, E-210 101%
Deaerator rack, cable semi stores under KRU-6/0.4-kV switchgear
E-003/1, E-003/6, E-004, E-004/1
101%
4.1.4 Main Control Room Fire Analysis As an important example, the MCR of Unit 1 was selected as the region of the KNPS for which a detailed, integrated analysis of the impact of the fire initiator on CDF would be performed. In the initial phase of this analysis, transient fuel fires resulting from a collection of combustibles in the MCR were considered. Based on estimates of the likelihood of such events, this scenario was dropped from consideration (Ref. 4.8). As a result, the fire scenario considered in the MCR fire analysis is that of fires initiating within the MCR “panel segments.” A panel segment is defined as a section of the control panel that is bounded by a solid metal front, two side partition walls, and the room floor. It was assumed that the extent of direct damage from a fire inside a control panel segment would be limited to the material within the segment. It was further assumed that the fire would occur in only one panel segment and would not propagate to other segments. The MCR was divided into segments, and information required for the probabilistic fire assessment was gathered for each segment. For each panel, an accident scenario was defined. Potential IEs were identified for each segment; ETs were taken from the internal events PRA. In some cases, new ETs were constructed. The effect of fire on the performance of human actions required to avoid core damage was modeled. The frequency of fire initiation within each segment was estimated. The SAPHIRE code was used to quantify the CDF for each IE that was identified within each panel segment. 4.1.5 Results and Conclusions A limited-scope fire analysis was performed for the KNPS Unit 1 VVER-1000. A fire hazard and safety screening analysis, including a special plant walkdown, led to identification of a number of compartments for more detailed analysis. A database of fire incident data at the KNPS was developed, and fire frequencies

75
were quantified on the basis of Unit 1 compartments. Preliminary qualitative analysis led to identification of 27 scenarios that required screening-level quantitative assessment and finally to 7 compartments, including the Unit 1 MCR, that required detailed quantitative analysis. An analysis of fire in the MCR panels was carried out, and the fire frequency and CDF contribution as a result of such fires was calculated. The total MCR fire frequency is 8.5E-3 1/RY, and the CDF is 7.01E-6 1/RY. 4.2 Internal Flood Analysis 4.2.1 Objectives The objective of the internal flood analysis was to perform a limited-scope analysis of the influence of internal flooding on the Level 1 PRA CDF for KNPS Unit 1. This work provided training for the Russian team in key aspects of internal flood analysis, from collection of flooding incident data to quantitative analysis of flooding scenarios. The flood analysis consisted of the following tasks: • gathering KNPS data (both from design data and a special plant walkdown) to help with CDF estimation • developing flood scenarios • calculating the CDF contribution of selected flood scenarios for specific locations. 4.2.2 Selection and Assessment of Compartments The work started with a review of available information on flooding incidents at Russian NPPs, as well as information available on PWR NPPs, to estimate the flooding hazard for the plant. KNPS staff developed a specific database on flooding incidents at the KNPS (Ref. 4.9). To preliminarily assess flooding occurrences at particular flooding zones, a U.S. NPP flooding database was used (Ref. 4.10). To select rooms for flood analysis, the layout of KNPS and its premises was studied. A walkdown of rooms was conducted for selected rooms and preliminary room characteristics data were collected. It was assumed that flooding in a room would lead to failure of all equipment with electrical drives located in the given room. A room was excluded from further consideration (i.e., no quantitative flooding analysis for the room was carried out) if all the following requirements were met: • Flooding inside the plant premises does not influence Unit 1 operation (i.e., flooding does not lead to an
IE from a list of internal IEs considered in the Level 1 PRA or to IE excluded from the list of IEs because of its low probability).
• Flooding in the plant premises does not influence the operation of systems modeled in internal IEs in the Level 1 PRA.
• Flooding in the plant premises has no influence on the performance of operator actions modeled in internal IEs in the Level 1 PRA.
4.2.3 Method Used to Analyze Flooding Scenarios Scenarios left after the qualitative selection were chosen for preliminary assessment of flooding frequencies. For each selected room, a set of IEs were identified that would be caused by a flood in that room. All equipment was identified that would be disabled, and the flooding frequency was applied to the SAPHIRE Level 1 PRA. CDF was then estimated.

76
More detailed quantitative analysis of flood scenarios was recommended for all rooms that contributed more than 1% to CDF from internal events. These rooms are listed in Table 4-2. The detailed quantitative analysis was beyond the scope of the PRA project.
Table 4-2 List of Rooms With Flooding Potential That Contribute More Than 1% to Core Damage Frequency for Internal Initiating Events
Room Identification Contribution to CDF for Internal IEs Generator relay board room E-120 1.2% Concentrated boric acid storage tank room
VC-414 4.9%
ECCS intermediate circuit room A006 5.1% Boric concentrate pumps room VC019 8.9% Emergency systems room A002 13.1% MCR E-319/1 17.7% Emergency feed-water pumps room E007 57.5% Deaerator rack, elevation mark 34.2 E-702/1 84% Safety systems panel room E-206, E-407, E-
528/2 100%
4.2.4 Results and Conclusions A limited-scope flood analysis was performed for KNPS Unit 1. A screening analysis of 32 potential flooding areas was based on a simplified hazard assessment of compartments, which included a plant walkdown. Of these areas, 27 were the subject of a simplified quantitative assessment, and 9 compartments were identified for specific quantitative analysis (Ref. 4.11). 4.3 Seismic Analysis 4.3.1 Objectives The objective of this activity was to perform key tasks of a PRA seismic analysis for KNPS Unit 1. This work provided training for the Russian team in major aspects of seismic analysis, from data gathering to quantitative analysis of structural responses of selected components. Project plans for seismic analysis included the following tasks: • gathering KNPS data (both from design data and a special plant walkdown) necessary to conduct a
seismic PRA • developing an earthquake hazard curve for the KNPS site • conducting soil response analysis • developing some examples of structural response • conducting a fragility analysis of the Unit 1 stack as an example. 4.3.2 Hazard Study Extensive data on seismicity of the KNPS site were collected to develop a seismic hazard curve. Developing this curve required development of seismological and geological databases as well as development of a

77
seismotectonic model. The data contain earthquake catalogues for local and remote source zones. Frequency parameters for source zones as well as for individual sources were estimated. Local maps showing seismogenic sources also were available. The gathered data provide the basis for seismic hazard curves at various confidence levels. Figure 4-1 presents the median hazard curve for the KNPS site (Ref. 4.12). 4.3.3 Studies on Soil Response The data on soil layers for selected buildings of the site were collected, including soil profile data and soil geotechnical parameters required to develop impedance characteristics of foundations as well as to determine seismic input at the level of foundations. Using the collected data, team members developed idealized horizontally layered soil foundation models for the following site buildings: reactor building, turbine building, ECCS Intermediate Cooling Circuit Building, and pumphouse. The SHAKE computer code was used to deconvolve free-field surface spectrum to rock and back to surface at the site. Only one soil case was considered, which means that soil properties were not varied. The resulting spectra were narrow-banded at about 5 Hz (eigenfrequency of the soil column). 4.3.4 Building and Structure Response and Fragility Studies A few buildings and structures important to safety were chosen to perform response analysis. A response and fragility analysis was completed for the KNPS stack.
Figure 4-1 Median Hazard Curve for the Kalinin Nuclear Power Station
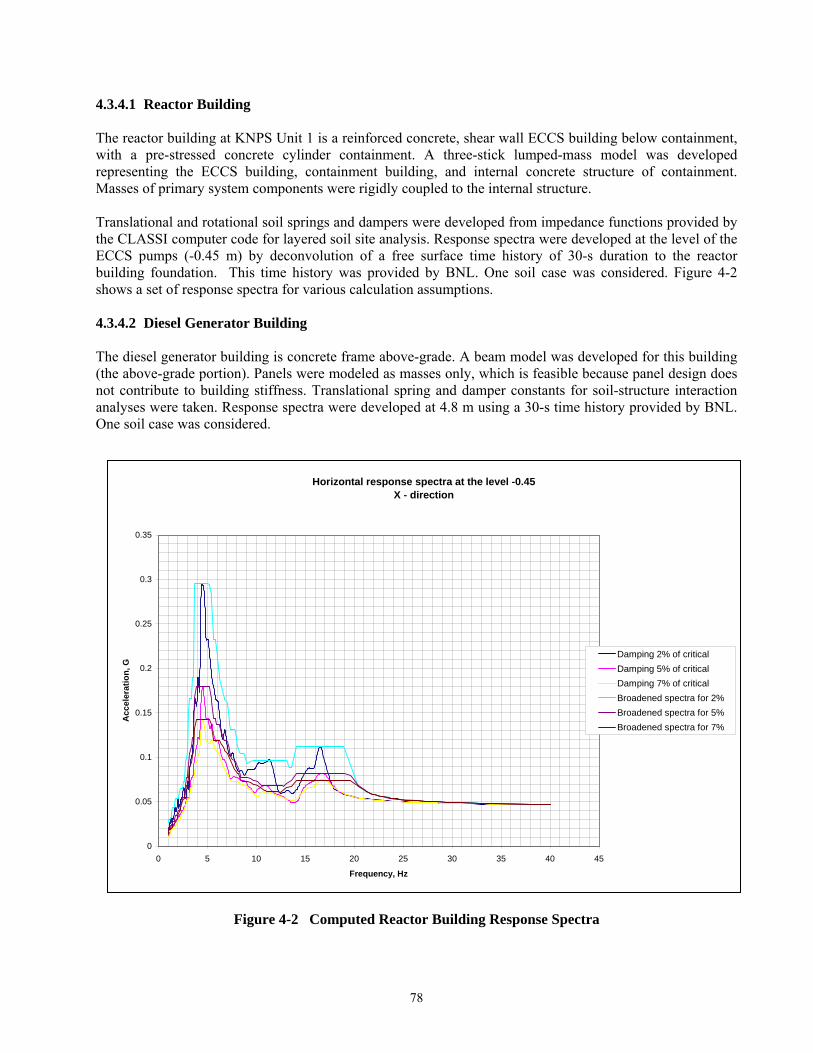
78
4.3.4.1 Reactor Building The reactor building at KNPS Unit 1 is a reinforced concrete, shear wall ECCS building below containment, with a pre-stressed concrete cylinder containment. A three-stick lumped-mass model was developed representing the ECCS building, containment building, and internal concrete structure of containment. Masses of primary system components were rigidly coupled to the internal structure. Translational and rotational soil springs and dampers were developed from impedance functions provided by the CLASSI computer code for layered soil site analysis. Response spectra were developed at the level of the ECCS pumps (-0.45 m) by deconvolution of a free surface time history of 30-s duration to the reactor building foundation. This time history was provided by BNL. One soil case was considered. Figure 4-2 shows a set of response spectra for various calculation assumptions. 4.3.4.2 Diesel Generator Building The diesel generator building is concrete frame above-grade. A beam model was developed for this building (the above-grade portion). Panels were modeled as masses only, which is feasible because panel design does not contribute to building stiffness. Translational spring and damper constants for soil-structure interaction analyses were taken. Response spectra were developed at 4.8 m using a 30-s time history provided by BNL. One soil case was considered.
Figure 4-2 Computed Reactor Building Response Spectra
Horizontal response spectra at the level -0.45X - direction
0
0.05
0.1
0.15
0.2
0.25
0.3
0.35
0 5 10 15 20 25 30 35 40 45
Frequency, Hz
Acc
eler
atio
n, G
Damping 2% of criticalDamping 5% of criticalDamping 7% of criticalBroadened spectra for 2%Broadened spectra for 5%Broadened spectra for 7%

79
4.3.4.3 ECCS Intermediate Cooling Circuit Building The ECCS Intermediate Cooling Circuit Building is a concrete frame with steel roof trusses and concrete panels (which do not contribute to building stiffness) founded at grade. A beam model was developed for frame and roof trusses. Three borated water tanks are located at 5-m elevations, and they were modeled with an impulsive and convective mode of fluid response. Six soil springs and six dampers (translational and rotational) were developed from CLASSI computer code analysis impedance functions for one soil case. 4.3.4.4 Turbine Building The turbine building is a steel frame structure consisting of turbine hall, equipment gallery, and electrical gallery. Columns rest on individual footings. To simplify the model, the turbine hall top frame structure was replaced by equivalent beams (substructuring approach). Frame joints were classified into moment and momentless joints. 4.3.4.5 Pumphouse The pumphouse is a concrete frame structure, above-grade, that housing pumps; columns rest on individual footings. Both walkdown and review of design drawings confirm that the building appears to have very low longitudinal and lateral load resistance. Frame joints were classified into moment and momentless joints in the building model. 4.3.4.6 Stack The Unit 1 stack is a separate, reinforced concrete structure, 100 m high. If the structure collapsed, the emergency diesel generator building could possibly be damaged. This power source is required to mitigate loss of offsite power during seismic events. All required data were collected, and a three-dimensional finite element model of the stack was developed. Soil springs and dampers were developed using procedures given in Russian structural design code. Response spectra were analyzed, and the stack strength was checked. 4.3.5 Results and Conclusions Seismic analysis of KNPS Unit 1 was of limited scope. The site seismicity curve was developed, plant structural data required for seismic analysis were collected, and response of a few selected structures was analyzed. The plant stack structural response to earthquake loadings was computed. Full-scope fragility analysis of structures was out of the project’s scope. In general, this process allowed the PRA team to study key issues of a seismic PRA for a NPP. 4.4 References 4.1 U.S. Nuclear Regulatory Commission and the Environmental, Industrial and Nuclear Supervision
Service of Russia. 2005. Kalinin Nuclear Power Station Unit 1 PRA. Main Report: Other Events Analysis, NUREG/IA-0212, Volume 2, Part 3, Proprietary, not available for public distribution.
4.2 Mickeev, A. K. 1999. Fire-Prevention Protection NPP. Energoproekt, Moscow. 4.3 Obninsk Institute of Atomic Power. 1992. Accidents and Incidents on Nuclear Power Plants.
80
4.4 Ho, V., K. Paxton, and D. Johnson. 1996. Lessons Learned from U.S. Nuclear Power Plant Fires. Paper presented at PSAM III International Conference, June 24-28, 1996. Crete, Greece.
4.5 Mironenko, E., A. Pestrikov, et al. 1997. Fire-Specific Database on KNPP, Unit 1. ID_Fire. Kalinin
Nuclear Power Station, Udomlya. 4.6 Kuzmina, I., S. Makarov, et al. 1998. Fire-Specific Data Base on NVNPP, Unit 5 . ID_ Fire.
NVNPP-5, Novovoronezh. 4.7 Johnson, D. 1998. Letter to NRC on U.S. fire data base, dated January 2, 1998. 4.8 Appendix 4 of Ref. 4.1. 2005. “Scenario List for MCR Fires (Full Equipment). U.S. Nuclear
Regulatory Commission, Washington, D.C., and the Federal Environmental, Industrial and Nuclear Supervision Service of Russia, Moscow.
4.9 Mironenko, E., A. Pestrikov, et al. 1997. Flood-Specific Data Base on KNPP, Unit 1. ID_ Flood.
Kalinin Nuclear Power Station, Udomlya. 4.10 Kazarinans & Associates. 1995. A Short Course on Flooding Risk Analysis for Nuclear Power Plant.
Ref.548.R02.0. 4.11 Appendix 2 of Ref. 4.1. 2005. “Quantitative Analysis of Flood Scenarios.” U.S. Nuclear Regulatory
Commission, Washington, D.C., and the Federal Environmental, Industrial and Nuclear Supervision Service of Russia, Moscow.
4.12 Kuznetsov, Y., and V. Turilov. 1998. Kalinin NPS Seismic Hazard Curve. Project BETA. Report,
Nizhny Novgorod Project Institute “Atomenergoproject,” (in Russian).

81
5. CLOSURE As this summary report documents, the international U.S./Russian PRA study of KNPS Unit 1 achieved its goals. The project promoted the transfer of state-of-the-art PRA techniques to Russian specialists and established a good technical understanding among representatives from different Russian organizations involved in designing, operating, and regulating NPPs in Russia. The project also helped establish a sound basis for the objective assessment of strong and weak features of the PRA as a potential comprehensive tool for safety evaluation. It helped form a regulatory basis and regulatory application of the PRA. During the project, Russian participants guided by U.S. experts carried out more than the PRA technical work. Members of the PRA team representing the Russian regulatory body developed a set of national regulatory PRA guides. Their colleagues from the nuclear power industry were involved in this development. This work will continue to benefit the safe use of nuclear power. Establishing a good understanding of the PRA among U.S. and Russian regulators provides an excellent opportunity to continue cooperation in the development and application of risk-informed approaches to improve nuclear safety and regulatory effectiveness.