Embed Size (px)
Citation preview

INTERNAL LOADS
SHEAR FORCE & BENDING
MOMENT DIAGRAMSSamantha Ramirez, MSE
1

BEAMS
Beams are long straight members that carry loads
perpendicular to their longitudinal axis
Beams are classified by the way they are supported
Simply Supported Beam
Cantilever Beam
Overhanging Beam
2

Shear and bending moment diagrams are graphical
representations of the internal shears and moments within a beam.
They can be constructed by establishing a sign convention.
Positive Distributed Load
Positive Internal Shear
Causes a clockwise rotation
Positive Internal Moment
Compression on top
Can hold water
SHEAR FORCE & BENDING MOMENT
DIAGRAMS
3

SHEAR FORCE & BENDING MOMENT
DIAGRAMS: METHOD COMPARISON
Reactions
Free-Body Diagrams
Best for very complex
beam loadings
Reactions
Derivative & Integral
Relationships
Quick method for
simpler beam loadings
Equation Method Graphical Method
4

HOW TO ANALYZE V & M DIAGRAMS:
THE EQUATION METHOD
1. Statics
FBD
Reactions
2. Solids
Cut between concentrated forces or moments
Note distance, x, from the beam’s left end
FBD of each section
Solve for V and M
3. Shear & Moment Diagrams
Table of coordinates for x, V, and M
Plot the shear diagram (V vs x)
Plot the moment diagram (M vs x)
5

EXAMPLE 1: EQUATION METHOD
Draw the shear and moment diagrams for the
beam.
6

EXAMPLE 2: EQUATION METHOD
Draw the shear and moment diagrams for the
beam and determine the shear and moment in
the beam as functions of x, where 4 ft < x < 10 ft.
9

EXAMPLE 3: EQUATION METHOD
The beam is bolted or pinned at A and rests on a
bearing pad at B that exerts a uniform
distributed loading on the beam over its 2-ft
length. Draw the shear and moment diagrams for
the beam if it supports a uniform loading of 2
kip/ft.
10

EXAMPLE 4: EQUATION METHOD
Draw the shear and moment diagrams for the
overhang beam.
11

GRAPHICAL METHOD FOR CONSTRUCTING
V & M DIAGRAMS
The slope of the shear curve isequal to the negative of theintensity of the distributed load.
The slope of the moment curve isequal to the intensity of theshear force.
The change of shear is equal tothe negative of the area underthe distributed load.
The change of moment is equalto the area under the sheardiagram.
𝑑𝑉
𝑑𝑥= −𝑤(𝑥)
𝑑𝑀
𝑑𝑥= 𝑉(𝑥)
∆𝑉 = න−𝑤 𝑥 𝑑𝑥
∆𝑀 = න𝑉 𝑥 𝑑𝑥
14

DISCONTINUITIES
Discontinuities (jumps) at points where
concentrated loads or moments are applied are
present in V & M diagrams.
15

HOW TO ANALYZE V & M DIAGRAMS:
THE GRAPHICAL METHOD
1. Statics
FBD
Reaction Forces
2. Establish V & M at the ends of the member
3. Use 4 relations to draw the diagrams
V vs x
M vs x
16
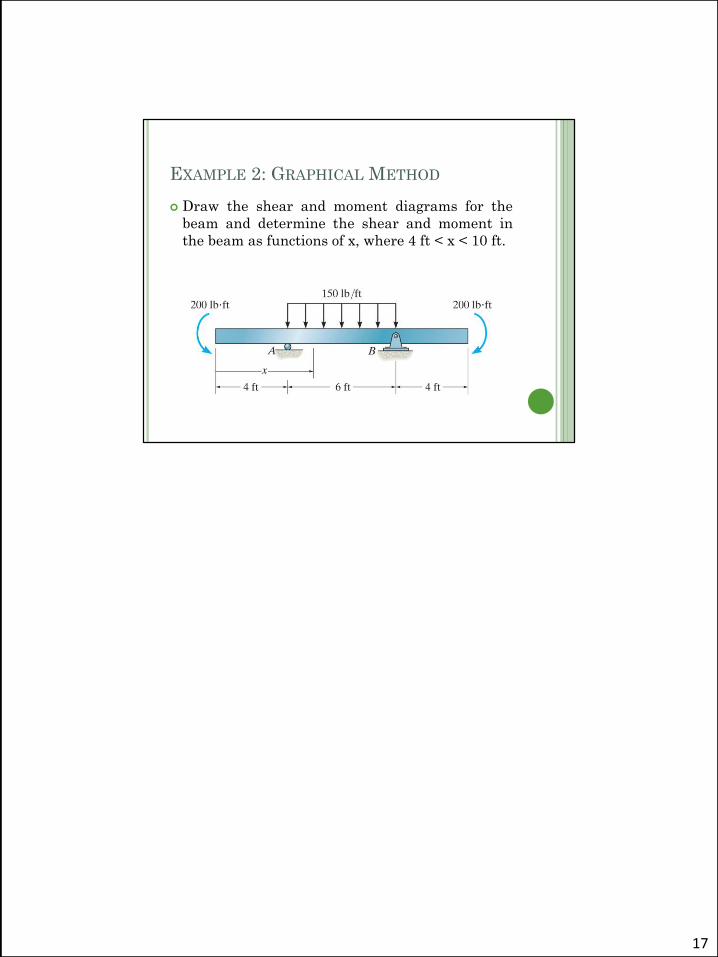
EXAMPLE 2: GRAPHICAL METHOD
Draw the shear and moment diagrams for the
beam and determine the shear and moment in
the beam as functions of x, where 4 ft < x < 10 ft.
17

EXAMPLE 3: GRAPHICAL METHOD
The beam is bolted or pinned at A and rests on a
bearing pad at B that exerts a uniform
distributed loading on the beam over its 2-ft
length. Draw the shear and moment diagrams for
the beam if it supports a uniform loading of 2
kip/ft.
18

EXAMPLE 5
Draw the shear and moment diagrams for the
beam shown.
22

EXAMPLE 6
Draw the shear and moment diagrams for the
beam shown.
23

EXAMPLE 7
Draw the shear and moment diagrams for the
beam shown.
24


![[9] shear force n bending moment](https://img.dokumen.tips/doc/110x75/553af101550346f92f8b4613/9-shear-force-n-bending-moment.jpg)


