Embed Size (px)
Citation preview

INTERNAL AXIAL CORROSION
IN OFFSHORE PIPELINES:
INSPECTION & ASSESSMENT
Dr. Christoph Jäger & Abdullahi Atto
PPSA Seminar 2014
19th November 2014, Aberdeen, UK
12/5/2014Copyright © 2013 | NDT Global 1

AGENDATopics
19.11.2014Copyright © 2014 | NDT Global 2
1. Introduction: Long Axial Corrosion
2. Impacts of Long Axial Corrosion on ILI and FFP
3. DNV Method: Assessment of Long Axial Corrosion Defects
4. Summary & Conclusions
LONG AXIAL CORROSION
19.11.2014Copyright © 2014 | NDT Global 3
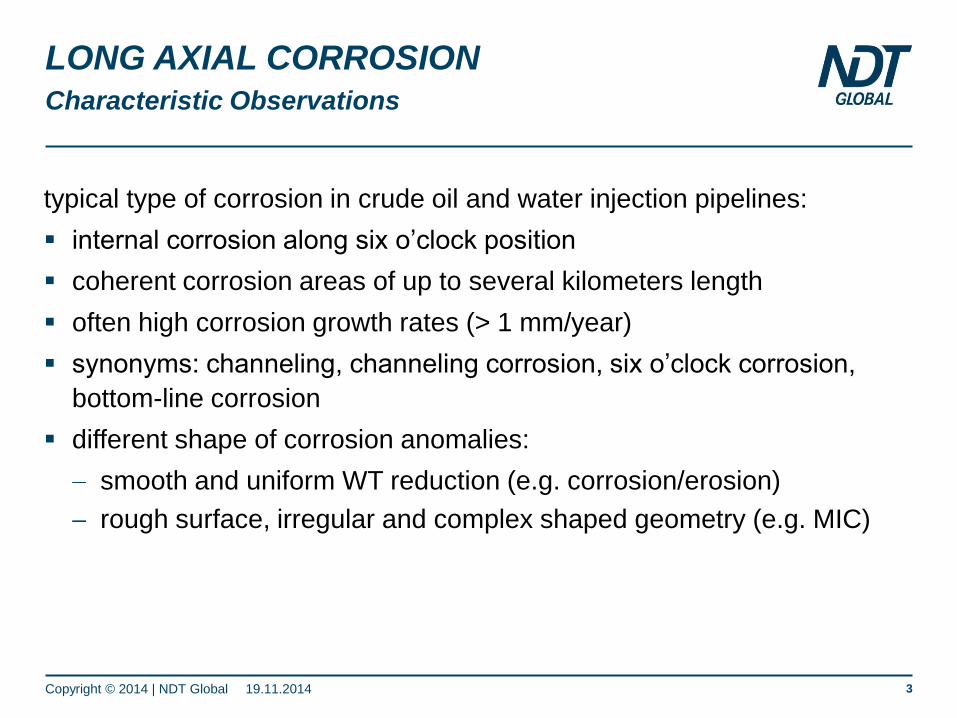
typical type of corrosion in crude oil and water injection pipelines:
internal corrosion along six o’clock position
coherent corrosion areas of up to several kilometers length
often high corrosion growth rates (> 1 mm/year)
synonyms: channeling, channeling corrosion, six o’clock corrosion,
bottom-line corrosion
different shape of corrosion anomalies:
smooth and uniform WT reduction (e.g. corrosion/erosion)
rough surface, irregular and complex shaped geometry (e.g. MIC)
Characteristic Observations

LONG AXIAL CORROSION: EXAMPLE 1
19.11.2014Copyright © 2014 | NDT Global 4
Smooth and Regular Shape, Groove-like

LONG AXIAL CORROSION: EXAMPLE 2
19.11.2014Copyright © 2014 | NDT Global 5
Rough Surface, Irregular and Complex Shape

LONG AXIAL CORROSION: EXAMPLE 3
19.11.2014Copyright © 2014 | NDT Global 7
Chain of Corrosion Pits (Early Stage of Channeling)

IMPACTS OF LONG AXIAL CORROSION…
19.11.2014Copyright © 2014 | NDT Global 8
characteristics of channeling corrosion
impacts on ILI and assessment:
ILI technology
UT
cleaning
modification of standard procedures
re-processing/filtering of ILI data
eliminate outliers
reporting & assessment
next slides
… on ILI and Assessment

IMPACTS OF LONG AXIAL CORROSION
19.11.2014Copyright © 2014 | NDT Global 9
coherent corrosion over several km: usually reported as one anomaly
per pipe joint (length = joint length, depth = peak depth)
Reporting of Detected Anomalies
0
2
4
6
8
10
0 20 40 60 80 100 120
Wall
Th
ickn
ess
Distance
uncorroded WT anomaly 1
feature box girth weld position
dep
th D
length L

IMPACTS OF LONG AXIAL CORROSION
19.11.2014Copyright © 2014 | NDT Global 10
coherent corrosion over several km, usually reported as one anomaly
per pipe joint (length = joint length, depth = peak depth)
peak depth & length: no meaningful description of complex anomalies
Reporting of Detected Anomalies
0
2
4
6
8
10
0 20 40 60 80 100 120
Wall
Th
ickn
ess
Distance
uncorroded WT anomaly 1 anomaly 2
feature box girth weld position
dep
th D
length L

IMPACTS OF LONG AXIAL CORROSION
19.11.2014Copyright © 2014 | NDT Global 11
different codes/standards for calculation of safe operating pressure
Psafe of metal loss anomalies
list-based methods:
e.g. B31.G, DNV-RP-F101 single
input: maximum depth, total length
same Psafe for anomalies 1 & 2
data-based methods:
e.g. RSTRENG (Effective Area), DNV-RP-F101 complex
anomalies described by actual remaining wall thickness profile
(river-bottom profile, RBP)
well suited for assessing complex shaped anomalies
all conventional methods: impact of continuous metal loss ( many
bad joints) on system PoF not accounted for
Assessment of Detected Anomalies
0
2
4
6
8
10
0 20 40 60 80 100 120
Wall
Th
ickn
ess
Distance
uncorroded WT anomaly 1 anomaly 2
feature box girth weld position
dep
th D
length L

AGENDATopics
19.11.2014Copyright © 2014 | NDT Global 12
1. Introduction: Long Axial Corrosion
2. Impacts of Long Axial Corrosion on ILI and FFP
Inspection Technology
Cleaning
Data Processing
Reporting
Assessment
3. DNV Method: Assessment of Long Axial Corrosion Defects
Main Ideas
Application Examples
4. Summary & Conclusions

ASSESSMENT OF LONG AXIAL CORROSION
19.11.2014Copyright © 2014 | NDT Global 13
JIP (DNV, Statoil, DONG Energy) “Assessment of long axial
corrosion defects – Specification”
DNV Method: Overview
results will be incorporated in revised
DNV-RP-F101
NDT Global involved in testing &
reviewing of algorithms
DNV method gives guidance on
extraction of RBPs from UT ILI data
calculation of pipeline pressure capacity
determination of corrosion growth rates
extrapolation of pressure capacity

ASSESSMENT OF LONG AXIAL CORROSION
19.11.2014Copyright © 2014 | NDT Global 14
JIP (DNV, Statoil, DONG Energy) “Assessment of long axial
corrosion defects – Specification”
DNV Method: Overview
results will be incorporated in revised
DNV-RP-F101
NDT Global involved in testing &
reviewing of algorithms
DNV method gives guidance on
extraction of RBPs from UT ILI data
calculation of pipeline pressure capacity
determination of corrosion growth rates
extrapolation of pressure capacity

ASSESSMENT OF LONG AXIAL CORROSION
19.11.2014Copyright © 2014 | NDT Global 15
rugged corrosion anomalies and rough internal pipe surface
echo loss (missing data) and/or outliers in UT WT data
important: identification & replacement of erroneous WT values before
calculation of RBPs
use of stand-off (SO) data:
strong signal (1st echo)
usually no echo loss/outliers
WTSO = WT + SO
= distance sensor – outer pipe wall, ideally constant
WT missing or outlier WTSO outside tolerance band
WT replaced by RWTSO = WTSOmedian – SO
Filtering of WT Data & Extraction of RBPs
WTSO
SO
WT
SO
WT

ASSESSMENT OF LONG AXIAL CORROSION
19.11.2014Copyright © 2014 | NDT Global 16
Filtering of WT Data & Extraction of RBPs: Example
original WT
SO

ASSESSMENT OF LONG AXIAL CORROSION
19.11.2014Copyright © 2014 | NDT Global 17
Filtering of WT Data & Extraction of RBPs: Example
original WT
processed WT
SO

ASSESSMENT OF LONG AXIAL CORROSION
19.11.2014Copyright © 2014 | NDT Global 18
Filtering of WT Data & Extraction of RBPs: Example
river-bottom profile
processed WT

ASSESSMENT OF LONG AXIAL CORROSION
19.11.2014Copyright © 2014 | NDT Global 19
JIP (DNV, Statoil, DONG Energy) “Assessment of long axial
corrosion defects – Specification”
DNV Method: Overview
results will be incorporated in revised
DNV-RP-F101
NDT Global involved in testing &
reviewing of algorithms
DNV method gives guidance on
extraction of RBPs from UT ILI data
calculation of pipeline pressure
capacity
determination of corrosion growth rates
extrapolation of pressure capacity

ASSESSMENT OF LONG AXIAL CORROSION
19.11.2014Copyright © 2014 | NDT Global 20
Requirements:
complex corrosion anomalies
assessment based on RBPs
standard methods:
Psafe (pipeline) = Psafe(worst joint)
however: minimum Psafe not sufficient to
describe condition of pipeline
example: Psafe histograms with same
minimum Psafe but different number of
“bad” joints
many bad joints (e.g. channeling)
“system effect” higher PoF
Calculation of Pipeline Pressure Capacity
0
10
20
30
40
50
60
70
80
60 70 80 90 100 110 120 130
Nu
mb
er
of
an
om
ali
es
Pressure capacity Psafe [bar]
0
10
20
30
40
50
60
70
80
60 70 80 90 100 110 120 130
Nu
mb
er
of
an
om
ali
es
Pressure capacity Psafe [bar]

ASSESSMENT OF LONG AXIAL CORROSION
19.11.2014Copyright © 2014 | NDT Global 21
Requirements:
assessment based on RBPs
account for potential increase in PoF
DNV Method:
basis: DNV-RP-F101 Complex Shaped Defects Method (Part A)
affected area divided into subsections
Psafe calculated for all subsections
Psafe(section i) PoF(section i) for considered assessment pressure
total PoF(pipeline) calculated from PoF of all sections i
PoF(pipeline) vs. max. allowable PoF (safety class)
Psafe(pipeline)
Calculation of Pipeline Pressure Capacity
ASSESSMENT OF LONG AXIAL CORROSION
19.11.2014Copyright © 2014 | NDT Global 22
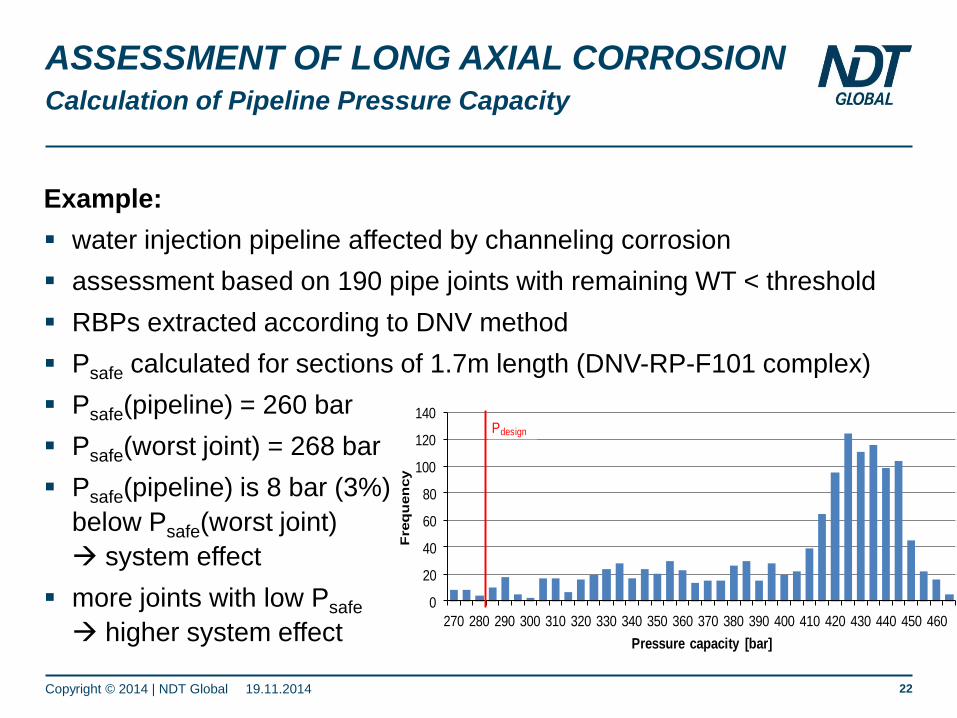
Example:
water injection pipeline affected by channeling corrosion
assessment based on 190 pipe joints with remaining WT < threshold
RBPs extracted according to DNV method
Psafe calculated for sections of 1.7m length (DNV-RP-F101 complex)
Psafe(pipeline) = 260 bar
Psafe(worst joint) = 268 bar
Psafe(pipeline) is 8 bar (3%)
below Psafe(worst joint)
system effect
more joints with low Psafe
higher system effect
Calculation of Pipeline Pressure Capacity
0
20
40
60
80
100
120
140
270 280 290 300 310 320 330 340 350 360 370 380 390 400 410 420 430 440 450 460
Fre
qu
en
cy
Pressure capacity [bar]
Pdesign

ASSESSMENT OF LONG AXIAL CORROSION
19.11.2014Copyright © 2014 | NDT Global 23
JIP (DNV, Statoil, DONG Energy) “Assessment of long axial
corrosion defects – Specification”
DNV Method: Overview
results will be incorporated in revised
DNV-RP-F101
NDT Global involved in testing &
reviewing of algorithms
DNV method gives guidance on
extraction of RBPs from UT ILI data
calculation of pipeline pressure capacity
determination of corrosion growth
rates
extrapolation of pressure capacity
ASSESSMENT OF LONG AXIAL CORROSION
19.11.2014Copyright © 2014 | NDT Global 24
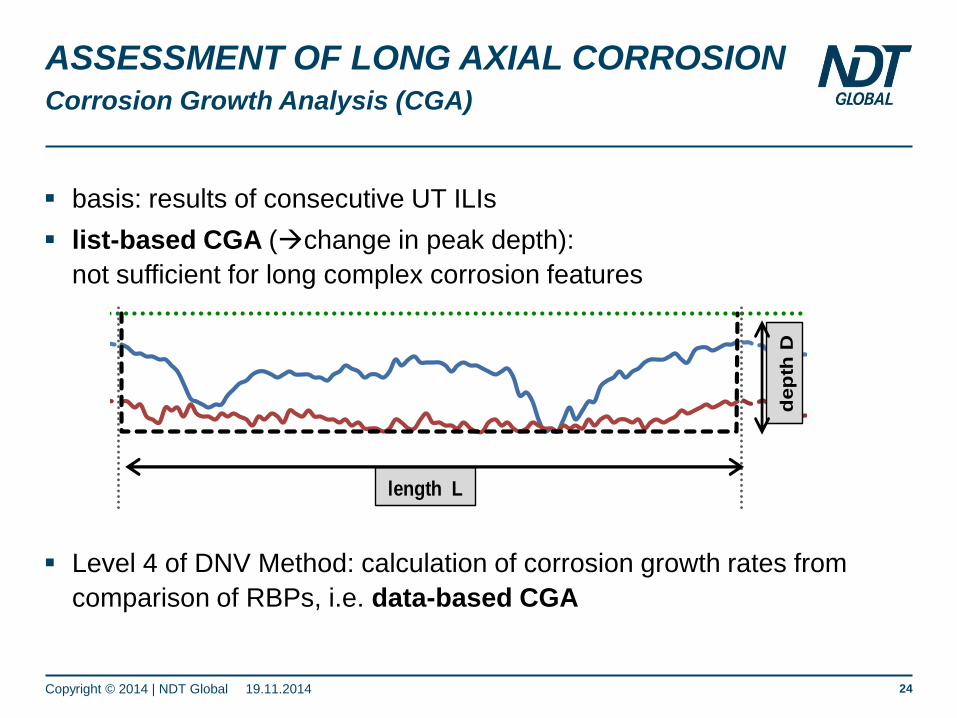
basis: results of consecutive UT ILIs
list-based CGA (change in peak depth):
not sufficient for long complex corrosion features
Level 4 of DNV Method: calculation of corrosion growth rates from
comparison of RBPs, i.e. data-based CGA
Corrosion Growth Analysis (CGA)
0
2
4
6
8
10
0 20 40 60 80 100 120
Wall
Th
ickn
ess
Distance
uncorroded WT anomaly 1 anomaly 2
feature box girth weld position
dep
th D
length L

ASSESSMENT OF LONG AXIAL CORROSION
19.11.2014Copyright © 2014 | NDT Global 25
Corrosion Growth Analysis: One Pipe Joint
13
14
15
16
17
18
19
0 2 4 6 8 10 12
Wal
l th
ickn
ess
[mm
]
Distance to USGW [m]
RBP(2014)

ASSESSMENT OF LONG AXIAL CORROSION
19.11.2014Copyright © 2014 | NDT Global 26
Corrosion Growth Analysis: One Pipe Joint
13
14
15
16
17
18
19
0 2 4 6 8 10 12
Wall
th
ickn
ess [
mm
]
Distance to USGW [m]
RBP(2014)
CWT(2014)

ASSESSMENT OF LONG AXIAL CORROSION
19.11.2014Copyright © 2014 | NDT Global 27
Corrosion Growth Analysis: One Pipe Joint
13
14
15
16
17
18
19
0 2 4 6 8 10 12
Wall
th
ickn
ess [
mm
]
Distance to USGW [m]
RBP(2014) RBP(2011)
CWT(2014) CWT(2011)

ASSESSMENT OF LONG AXIAL CORROSION
19.11.2014Copyright © 2014 | NDT Global 28
Corrosion Growth Analysis: One Pipe Joint
13
14
15
16
17
18
19
0 2 4 6 8 10 12
Wal
l thi
ckne
ss [
mm
]
Distance to USGW [m]
RBP(2014) RBP(2011)
CWT(2014) CWT(2011)
0
0.1
0.2
0.3
0.4
0.5
0.6
0 2 4 6 8 10 12
Co
rro
sio
n g
row
th r
ate
[mm
/yea
r]
Distance to USGW [m]
2011->2014

13
14
15
16
17
18
19
0 2 4 6 8 10 12
Wal
l thi
ckne
ss [
mm
]
Distance to USGW [m]
RBP(2014) RBP(2011) RBP(2010)
CWT(2014) CWT(2011) CWT(2010)
ASSESSMENT OF LONG AXIAL CORROSION
19.11.2014Copyright © 2014 | NDT Global 29
Corrosion Growth Analysis: One Pipe Joint
0
0.1
0.2
0.3
0.4
0.5
0.6
0 2 4 6 8 10 12
Co
rro
sio
n g
row
th r
ate
[mm
/yea
r]
Distance to USGW [m]
2010->2011
2011->2014

ASSESSMENT OF LONG AXIAL CORROSION
19.11.2014Copyright © 2014 | NDT Global 30
Corrosion Growth Analysis: Results for 190 Pipe Joints
0.0
0.1
0.2
0.3
0.4
0.5
0 1 2 3 4 5 6 7 8 9
Co
rro
sio
n g
row
th r
ate
[m
m/y
ea
r]
Distance [km]
average 95% quantile section joint avg moving avg.

50
100
150
200
250
300
350
400
450
0.0
0.1
0.2
0.3
0.4
0.5
0.6
0.7
0.8
0 1 2 3 4 5 6 7 8 9
Ps
afe
[b
ar]
Co
rro
sio
n g
row
th r
ate
[m
m/y
ea
r]
Distance [km]
growth rate (section) growth rate (joint avg.) Psafe
ASSESSMENT OF LONG AXIAL CORROSION
19.11.2014Copyright © 2014 | NDT Global 31
Extrapolation of Pressure Capacity: Psafe vs. Growth Rate
low Psafe + high growth rates!

50
100
150
200
250
300
350
400
450
0.0
0.1
0.2
0.3
0.4
0.5
0.6
0.7
0.8
0 1 2 3 4 5 6 7 8 9
Ps
afe
[b
ar]
Co
rro
sio
n g
row
th r
ate
[m
m/y
ea
r]
Distance [km]
growth rate (section) growth rate (joint avg.) Psafe
ASSESSMENT OF LONG AXIAL CORROSION
19.11.2014Copyright © 2014 | NDT Global 32
Extrapolation of Pressure Capacity: Results
150
170
190
210
230
250
270
0 1 2 3 4 5 6 7 8 9 10 11 12 13 14 15
Pip
eli
ne p
ressu
re c
ap
acit
y [
bar]
Time after latest ILI [years]
joint avg.
0.22 mm/year
0.32 mm/year
MAOP
Psafe(pipeline) reaches MAOP
5.2 – 7.5 years after latest ILI

SUMMARY & CONCLUSIONS
19.11.2014Copyright © 2014 | NDT Global 33
long axial corrosion impacts on ILI & assessment
can be reliably detected & sized using UT ILI
feature list information not sufficient to characterize complex anomalies
data-based assessment methods (pressure & corrosion growth)
required
methodology specifically designed for assessment of long axial
corrosion was developed by DNV:
filtering of WT using SO, especially helpful in case of non-optimum
data quality
accounts for higher PoF resulting when many pipe spools are
affected by severe corrosion
NDT experience: DNV method proved good applicability

NDT Global GmbH & Co. KG
Friedrich-List-Str. 1
76297 Stutensee, Germany
www.ndt-global.com
THANK YOU!
![AUT QUALIFICATION OF APPLUS+ RTD IWEX SYSTEM ...1a1b8052-a937-4261-9a38...DNV GL AS, and follows the requirements of DNVGL-ST-F101 [1] and DNVGL-RP-F118 [2]. DNV GL has witnessed all](https://img.dokumen.tips/doc/110x75/6102fcc2f64e88228972191f/aut-qualification-of-applus-rtd-iwex-system-1a1b8052-a937-4261-9a38-dnv.jpg)


![Branislav REŤKOVSKÝ* Model rizika plynovodných potrubí … · ASME B31.G [2] alebo DNV RP - F101. Následné posúdenie - cieľom kro-ku je na základe výsledkov priameho prieskumu](https://img.dokumen.tips/doc/110x75/5ae3cdab7f8b9a0d7d8e1a52/branislav-retkovsk-model-rizika-plynovodnch-potrub-b31g-2-alebo-dnv-rp.jpg)