Embed Size (px)
Citation preview

MeVis Medical Solutions AGMedical imaging software - Detect what matters. 2015
Q 3Interim ReportInterim Report

Interim Report Q3 2015
Page 1 MeVis Medical Solutions AG
KEY FIGURES (IFRS)
FIGURES IN € k Jan 1 - Sept 30, 2015
Jan 1 - Sept 30, 2014 Change
Revenues 11,933 9,661 24 %
of which segment Digital Mammography 9,454 7,280 30 %
Other Diagnostics 2,479 2,381 4 %
of which billing currency1 Euro 1,242 548 20 %
US-Dollar 10,691 9,113 24 %
EBITDA 5,109 4,373 17 %
EBITDA margin 43 % 45 %
EBIT 3,620 3,150 15 %
EBIT margin 30 % 33 %
Net financial result 603 775 -22 %
EBT 4,223 3,925 8 %
Net profit for the period 2,964 3,456 -14 %
Earnings per share in € (basic) 1.66 2.01 -17 %
Earnings per share in € (diluted) 1.65 2.01 -18 % Sept 30, 2015 Dec 31, 2014 Change
Equity capital 34,583 30,270 14 % Intangible assets 14,261 15,621 -9 %
Non-current and current liabilities 10,232 7,984 28 % Balance sheet total 44,815 38,254 17 %
Equity ratio in % 77 % 79 % Liquid funds2 22,042 17,511 26 %
Employees3 93 94 -1 %
1 Revenues are allocated to the currency according to the location of the customer; comprised of indirect sales via industry customers as
well as sales to clinical end customers in the segment Distant Services. 2 Comprising cash, cash equivalents and securities available for sale. 3 Full-time equivalents as of balance sheet date.
KEY SHARE DATA
As at September 30, 2015
Industry sector Software / Medical Technology
Subscribed capital € 1,820,000.00
No. of shares 1,820,000
Last quotation on December 31, 2014 € 18.11
Last quotation on September 30, 2015 € 23.01
High/low in 2015 € 24.23 / € 17.65
Market capitalization € 41.878 m
Treasury stock 0 (0 %)
Free float 23.5 %
Prime Standard (Regulated market) Frankfurt and Xetra
Over-the-counter markets Berlin, Dusseldorf, Munich, Stuttgart
Indices CDAX, PrimeAS, TechnologyAS, DAXsector Soft-ware, DAXsubsector Software, GEX
ISIN / WKN / Ticker symbol DE000A0LBFE4 / A0LBFE / M3V

Interim Report Q3 2015
MeVis Medical Solutions AG Page 2
CONTENT
KEY FIGURES (IFRS) ........................................................................................................................ 1
LETTER TO THE SHAREHOLDERS .................................................................................................... 3
THE MEVIS SHARE ........................................................................................................................... 5
INTERIM MANAGEMENT REPORT Q3/2015 .................................................................................... 7 Basics of the company ....................................................................................................................... 7
Structure ....................................................................................................................................... 7 Short summary of business activities ................................................................................................ 7 Reporting segments ........................................................................................................................ 8
Economic report ................................................................................................................................ 9 Earnings position ............................................................................................................................ 9 Financial position .......................................................................................................................... 10 Asset position ............................................................................................................................... 10
Material events occurring after the balance sheet date ....................................................................... 11 Opportunities and risk report ............................................................................................................ 11 Outlook .......................................................................................................................................... 11
INCOME STATEMENT Q1 TO Q3 2015............................................................................................12
STATEMENT OF COMPREHENSIVE INCOME ..................................................................................12
STATEMENT OF FINANCIAL POSITIONS .......................................................................................14
STATEMENT OF CASH FLOW ..........................................................................................................15
STATEMENT OF CHANGES IN EQUITY ...........................................................................................16
NOTES TO THE FINANCIAL STATEMENTS AS OF SEPTEMBER 30, 2015 .......................................17 Basic information ............................................................................................................................ 17
General disclosures ....................................................................................................................... 17 Recognition and measurement methods ......................................................................................... 17 Effects of new accounting standards .............................................................................................. 17
Selected notes on the balance sheet and income statement ................................................................ 18 1. Revenues ........................................................................................................................ 18 2. Income from the capitalization of development costs .......................................................... 18 3. Staff costs ...................................................................................................................... 18 4. Other operating expenses ................................................................................................ 18 5. Depreciation and amortization .......................................................................................... 19 6. Net financial result ........................................................................................................... 19 7. Income taxes .................................................................................................................. 19 8. Interest in associated companies ...................................................................................... 19 9. Current other financial assets ........................................................................................... 19 10. Shareholders´ equity ....................................................................................................... 20 11. Other financial liabilities ................................................................................................... 21 12. Transactions with related parties ...................................................................................... 21 13. Contingent receivables and contingent liabilities ................................................................. 21 14. Earnings per share .......................................................................................................... 21 15. Segment information ....................................................................................................... 22 16. Post balance sheet events ................................................................................................ 22
RESPONSIBILITY STATEMENT ......................................................................................................23
DISCLAIMER ..................................................................................................................................24
FINANCE CALENDAR 2015 .............................................................................................................25

Interim Report Q3 2015
Page 3 MeVis Medical Solutions AG
LETTER TO THE
SHAREHOLDERS
Dear Shareholders, Customers, Business Associates and Employees,
The trend seen at MeVis in 2015 continued in the third quarter: a sharp increase in sales in both the new license and maintenance businesses driven primarily by the strong US dollar and the development services for Hologic contained in sales, on the one hand, and rising operating expenses on the other. In the third quarter, 80 % of sales were generated with Hologic, there-by further increasing dependency on this business.
The domination and profit and loss transfer agreement concluded on August 10, 2015 between VMS Deutschland Holdings GmbH as the controlling company and MeVis Medical Solutions AG as the controlled
company was entered into the Commercial Register of the Local Court of Bremen on October 20, 2015 and
thus became legally effective. The shareholders of MeVis Medical Solutions AG approved the agreement at the extraordinary shareholders’ meeting on September 29, 2015 by a large majority.
Our performance in detail: Sales generated in the third quarter of 2015 amounted to € 4,795 k, a consider-
able 33 % increase compared to the third quarter of 2014 (€ 3,599 k). As a result, sales in the first nine months likewise rose significantly year on year to € 11,933 k (prev. year: € 9,661 k). The change in the US
dollar exchange rate is largely responsible for sales growth of € 2,272 k, and contributed € 1,781 k. Soft-
ware development services totaling € 522 k (prev. year: € 0 k) following the agreement concluded with Hologic in September 2014 are also included in sales for the first nine months of 2015. Including the posi-
tive effect of the strong US dollar, sales in the new license business improved by 16 % to € 5,901 k while
sales in the maintenance business grew by 19 % to € 5,093 k, accounting for 43 % of total sales. Sales in the Digital Mammography segment were up by 30 % to € 9,454 k (prev. year: € 7,280 k), while sales in the
Other Diagnostics segment grew slightly by 4 % to € 2,479 k (prev. year: € 2,381 k).
Operating costs in the third quarter of 2015 rose considerably due to slightly higher staff costs, but in par-ticular on the back of other operating expenses. Staff costs increased according to plan by a cumulative
total of 3 % in the first nine months. Primarily due to increased consulting costs in connection with the dom-
ination and profit and loss transfer agreement, other operating expenses rose in the third quarter in a year-
on-year comparison to € 916 k (prev. year: € 572 k), and, cumulated for the first nine months of 2015, increased by 24 %.
Development costs (prev. year: € 1,163 k) were capitalized for the last time in the fourth quarter of 2014.
Despite the discontinued capitalization of development costs, cumulated EBITDA (earnings before interest, taxes, depreciation and amortization) increased considerably by 17 % year on year from € 4,373 k to
€ 5,109 k due to the improvement in sales.
from left: Marcus Kirchhoff, Dr. Robert Hannemann
Interim Report Q3 2015
MeVis Medical Solutions AG Page 4
Depreciation and amortization came to € 1,489 k (up 22 % year on year primarily due to higher scheduled
write-downs on capitalized development costs), resulting in EBIT (earnings before interest and taxes) of
€ 3,620 k (up a significant 15 % on the previous year’s figure of € 3,150 k) for the reporting period and a corresponding EBIT margin of 30 % (prev. year: 33 %).
The financial result decreased by € 172 k year on year to € 603 k. At the same time, the slight improvement
in earnings at MeVis BreastCare GmbH & Co. KG was overcompensated by effects from the development of the US dollar. Tax expenses increased by € 790 k to € 1,259 k, which is largely due to deferred taxes.
After-tax earnings consequently fell by € 492 k to € 2,964 k, which is equivalent to undiluted earnings per
share of € 1.66 (prev. year: € 2.01).
Cash and cash equivalents rose by € 4,531 k to € 22,042 k as of September 30, 2015 compared to the
end of 2014. This includes € 1,707 k from the disposal of treasury shares to VMS Deutschland Holdings
GmbH in April 2015.
In view of the development of business so far, we reiterate our forecast for the year adjusted on Septem-
ber 7. According to this forecast, we expect sales to grow to between € 14.5 and € 15.0 million. The Digital
Mammography business segment will remain the main sales contributor with at least 75 %. Earnings before interest and taxes (EBIT) are expected to be between € 3.5 million and € 4.0 million (prev. year: € 3.9 mil-
lion). Liquidity is expected to rise to between € 23.0 million and € 24.0 million in 2015 as a result of sus-
tained positive cash flows and the payment of € 1.7 million received in April 2015 for the sale of treasury shares. As in the reporting period, we will regularly review and adjust our guidance during the course of the
fiscal year according to business developments.
In light of the continued high degree of dependency on business with Hologic and the considerable decline
in sales with our key customers that we anticipate for 2017, we continue to welcome the affiliation with Varian Medical Systems, which provides us with opportunities for further diversifying our business activities.
The domination and profit and loss transfer agreement, which went into legal effect when it was entered
into the commercial register on October 20, marked another milestone in the integration process.
We would like to take this opportunity to once again thank all employees for their exceptional performance
as well as our business associates, customers and shareholders for their confidence in us!
Marcus Kirchhoff Dr. Robert Hannemann
Chairman & CEO Member of the Executive Board
Interim Report Q3 2015
Page 5 MeVis Medical Solutions AG
THE MEVIS SHARE
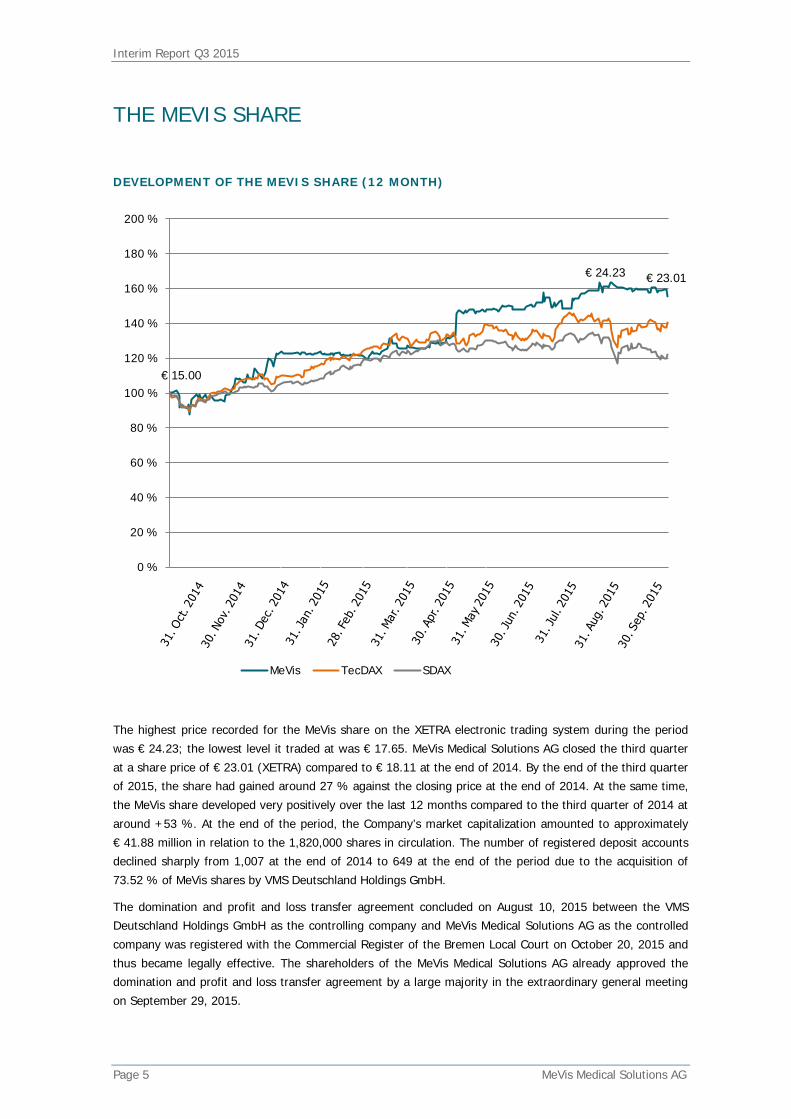
DEVELOPMENT OF THE MEVIS SHARE (12 MONTH)
The highest price recorded for the MeVis share on the XETRA electronic trading system during the period
was € 24.23; the lowest level it traded at was € 17.65. MeVis Medical Solutions AG closed the third quarter
at a share price of € 23.01 (XETRA) compared to € 18.11 at the end of 2014. By the end of the third quarter of 2015, the share had gained around 27 % against the closing price at the end of 2014. At the same time,
the MeVis share developed very positively over the last 12 months compared to the third quarter of 2014 at
around +53 %. At the end of the period, the Company’s market capitalization amounted to approximately
€ 41.88 million in relation to the 1,820,000 shares in circulation. The number of registered deposit accounts declined sharply from 1,007 at the end of 2014 to 649 at the end of the period due to the acquisition of
73.52 % of MeVis shares by VMS Deutschland Holdings GmbH.
The domination and profit and loss transfer agreement concluded on August 10, 2015 between the VMS Deutschland Holdings GmbH as the controlling company and MeVis Medical Solutions AG as the controlled
company was registered with the Commercial Register of the Bremen Local Court on October 20, 2015 and
thus became legally effective. The shareholders of the MeVis Medical Solutions AG already approved the domination and profit and loss transfer agreement by a large majority in the extraordinary general meeting
on September 29, 2015.
0 %
20 %
40 %
60 %
80 %
100 %
120 %
140 %
160 %
180 %
200 %
MeVis TecDAX SDAX
€ 15.00
€ 23.01 € 24.23

Interim Report Q3 2015
MeVis Medical Solutions AG Page 6
KEY INDICATORS OF THE MEVIS SHARE
DEVELOPMENT OF THE SHAREHOLDER STRUCTURE
The shareholder structure has not changed since the end of the second quarter. The VMS Deutschland Hold-
ings GmbH, based in Darmstadt, an affiliate of Varian Medical Systems, Inc., Palo Alto, California, USA, has
acquired the majority of shares in MeVis Medical Solutions AG in April 2015 in accordance with a voluntary
public takeover offer and now owns 1,337,995 shares (equivalent to 73.52 % of the total share capital).
Another institutional shareholder, Oppenheim Asset Management Services S.à.r.l, holds approximately 3.01
% of the shares in accordance with the shareholder notifications received by us and around 23.47 % is free
float.
Fig.: Shareholder structure as at September 30, 2015 (In accordance with the shareholder notifications received by us.)
73.52 %
3.01 %
23.47 %
VMS Deutschland Holdings GmbH
Oppenheim Asset Management Services S.à.r.l.
Free Float
9 M
Sept 30, 2015 6 M
June 30, 2015 3M
Mar 31, 2015 12 M
Dec 31, 2014 Closing price in € 23.01 22.50 18.62 18.11 Period high in € 24.23 22.50 19.50 22.95
Period low in € 17.65 17.65 17.65 12.93 Market capitalization in million € (XETRA ultimo)
41.9 41.0
31.2
31.2
Number of shares 1,820,000 1,820,000 1,820,000 1,820,000
Treasury stock 0 0 97,553 97,553 Price-to-earnings ratio (XETRA ultimo) 10.40 15.63 12.58 8.38
Earnings per share in € (basic) 1.66 0.72 0.37 2.16 Earnings per share in € (diluted) 1.65 0.71 0.37 2.16

Interim Report Q3 2015
Page 7 MeVis Medical Solutions AG
INTERIM MANAGEMENT REPORT Q3/2015
BASICS OF THE COMPANY
STRUCTURE
Through a joint venture with Siemens Healthcare GmbH, Munich (hereafter: "Siemens"), MeVis Medical Solutions AG (hereafter: "MMS AG", "MeVis" or "Company") holds 51 % of MeVis BreastCare GmbH & Co.
KG (hereafter: "MBC" or "MBC KG").
SHORT SUMMARY OF BUSINESS ACTIVITIES
MMS AG develops innovative software for analyzing and evaluating image data and marketing it to equip-
ment manufacturers of medical devices and providers of medical IT platforms.
MeVis’ clinical focuses are image-based early detection and diagnosis of epidemiologically important diseas-es such as breast, lung, prostate and colon cancer as well as neurological disorders. The software applica-
tions support all the imaging modalities available. These not only include X-ray modalities such as computed
tomography, digital mammography or digital tomosynthesis, but also magnetic resonance imaging, digital
sonography and the simultaneous use of multiple modalities (multimodality). Then there are the more
modern imaging modalities, such as positron emission tomography (PET), sonoelastography and molecular
imaging. MeVis supplies technologies and applications for global medical industry leaders, meeting their
needs and helping them to strengthen their leadership positions.
MeVis also offers image-based support for planning and conducting surgical interventions in the form of
MeVis Distant Services, which provides customized services to automate the processing, quantitative analy-
sis and patient-specific visualization of radiological image data. It also offers an internationally unparalleled process for planning complex operations on the liver and other organs is offered. Sales and marketing activi-
ties are directly addressed towards clinical end users (B2C).
In addition, MeVis is expanding its offer for clinical end users in the area of online training. MeVis Online Academy offers interactive online training to improve the diagnostic capabilities of clinical end users. The
product range of online services will be expanded gradually.

Interim Report Q3 2015
MeVis Medical Solutions AG Page 8
REPORTING SEGMENTS
For reporting purposes and internal governance, MeVis has two operating segments (“Digital Mammog-raphy” and “Other Diagnostics”).
The Digital Mammography segment develops and markets software products which support breast diag-
nostic imaging and intervention. Aside from the original products for digital mammography, new software
applications for other imaging modalities such as ultrasound, magnetic resonance imaging and tomosynthesis were added. These products are distributed to the industrial customer Hologic.
In addition to the breast diagnostics business based on magnetic resonance imaging conducted with Invivo
Corporation, the Other Diagnostics segment also includes digital radiology products (e.g. magnetic reso-nance imaging (MRI), computed tomography (CT), etc.) for other types of diseases such as lung, prostate
and intestinal disorders as well as general image-based analysis and diagnostics of radiology images. Fur-
thermore, the business with Vital Images for lung diagnostics and general analysis of MR-image data is included in this segment. Other main activities in this segment include image and risk analysis for planning
liver surgery and tumor diagnostics in connection with clinical studies of pharmaceutical companies (Distant
Services business segment).
The MMS AG differentiates the geographical areas USA and Europe due to the local distribution of realized
sales.

Interim Report Q3 2015
Page 9 MeVis Medical Solutions AG
ECONOMIC REPORT
EARNINGS POSITION
Sales of € 4,795 k in the third quarter of 2015 were up approximately 33 % on the level of the previous year (€ 3,599 k). At € 636 k, sales growth of € 1,196 k is primarily attributable to the change in the US dollar
exchange rate. The annual adjustment of the maintenance agreements with Hologic also positively affected
sales. Both the maintenance business, which was up 33 % to € 2,013 k (prev. year: € 1,513 k), and the new license business, which increased by 29 % to € 2,575 k (prev. year: € 1,999 k), recorded considerable gains
in the third quarter compared to the previous year’s period.
Revenues in the first three quarters of 2015 amounted to € 11,933 k and increased by approximately 24 %
from the level of the previous year (prev. year: € 9,661 k). The sales increase of € 2,272 k includes a posi-tive exchange rate effect of € 1,781 k. At € 522 k, sales related to the development services for Hologic also
contributed to improved sales figures. Revenues are broken down into the segments Digital Mammography
at € 9,454 k (prev. year: € 7,280 k) and Other Diagnostics at € 2,479 k (prev. year: € 2,381 k). At 79 % (prev. year: 75 %); the Digital Mammography segment continues to be the main source of revenues in the
Company.
The installed base of software licenses once again led to consistently high maintenance and service reve-nues. In the first three quarters of 2015, the share of sales accounted for by maintenance and service
amounted to 43 % (prev. year: 44 %).
The 3 % rise in personnel expenses to € 5,370 k (prev. year: € 5,208 k) is largely due to minor salary in-creases. MMS AG had 106 employees on average in the first three quarters of 2015. This corresponds to 93
full-time equivalents (prev. year: 107 employees or 94 full-time equivalents).
Development costs were capitalized for the last time in the fourth quarter of 2014. This reduced capitalized development costs in the period under review to € 0 k (prev. year: € 1,163 k). Other operating expenses
increased year on year and amounted to € 1,918 k (prev. year: € 1,542 k), which is particularly attributable
to the costs of the takeover by VMS Deutschland Holdings GmbH and the costs associated with concluding
the domination and profit and loss transfer agreement. The expense mainly comprised legal and consulting costs of € 631 k (prev. year: € 91 k), rental expenses/leasing costs of € 444 k (prev. year: € 378 k), travel
expenses of € 138 k (prev. year: € 150 k), maintenance/repair costs of € 92 k (prev. year: € 211 k) and
accounting and auditing expenses of € 74 k (prev. year: € 65 k).
EBITDA (earnings before interest, taxes, depreciation and amortization) totaled € 5,109 k in the period
under review (prev. year: € 4,373 k). Accordingly, the EBITDA margin experienced a slight decrease to
43 % (prev. year: 45 %).
Depreciation, amortization and impairments of intangible assets and property, plant and equipment in-
creased sharply as planned by 27 % to € 1,489 k (prev. year: € 1,223 k), while amortization of development
services rose by € 191 k to € 1,015 k (prev. year: € 824 k) and amortization of intangible assets increased by € 90 k to € 364 k (prev. year: € 274 k).
Earnings before interest and taxes (EBIT) amounted to € 3,620 k in the reporting period (prev.
year: € 3,150 k). Accordingly, the EBIT margin (return on sales) decreased slightly to 30 % compared to a previous year value of 33 %.
The financial result decreased in the reporting period to € 603 k (prev. year: € 775 k). In comparison to the
previous year, there were significant changes in the balance of income and expenses from exchange rate differences of € 32 k (prev. year: € 520 k), in the improved earnings of the 51 % share in MeVis BreastCare
GmbH & Co. KG of € 314 k (prev. year: € 289 k), which is recognized at equity, as well as in the change in
value of financial instruments of € 157 k (prev. year: € 275 k).

Interim Report Q3 2015
MeVis Medical Solutions AG Page 10
Earnings before taxes (EBT) came to € 4,223 k in the reporting period (prev. year: € 3,925 k). Accordingly,
the EBT margin declined to 35 % compared to 41 % in the previous year.
After-tax earnings are impacted by income taxes and the deferred tax expenses of € 1,259 k reported here (prev. year: € 469 k), amounting to € 2,964 k in the period under review (prev. year: € 3,456 k). The higher
expenses for deferred taxes result from the lower capitalization of loss carry forwards in view of the con-
cluded domination and profit and loss transfer agreement.
Undiluted earnings per share fell to € 1.66 (prev. year: € 2.01).
FINANCIAL POSITION
Cash flow from current operating activities came to € 3,242 k (prev. year: € 2,510 k) in the period under review. This comprised earnings before interest and taxes (EBIT) of € 3,620 k (prev. year: € 3,150 k), ad-
justed for depreciation in the amount of € 1,489 k (prev. year: € 1,223 k), changes in provisions of € 401 k
(prev. year: € 6 k), the total of all non-cash expenses and income of € -421 k (prev. year: € 154 k), the total of interest paid and received of € 127 k (prev. year: € 157 k), the total of taxes paid and received in the
amount of € -63 k (prev. year: € 18 k), changes in trade receivables and other assets of € -2,728 k (prev.
year: € -1,594 k), and changes in trade payables and other liabilities of € 817 k (prev. year: € -604 k).
In the period under review, cash flow from investing activities came to € -248 k (prev. year: € -4,810 k) and
mainly consisted of payments for the acquisition of securities of € 3,186 k (prev. year: € 9,205 k) as well as
payments received for the disposal of securities in the amount of € 3,013 k (prev. year: € 5,148 k).
Cash flow from financing activities came to € 1,634 k (prev. year: € -9 k) in the period under review and
mainly consisted of payments received for the disposal of treasury stock of € 1,707 k (prev. year: € 0 k) as
well as dividend payments of € 73 k (prev. year: € 0 k).
The change in cash and cash equivalents in the period under review came to € 4,707 k (prev. year: € -2,359 k).
ASSET POSITION
Liquid funds amounted to € 22,042 k (December 31, 2014: € 17,511 k) as of the balance sheet date. This comprised cash and cash equivalents of € 13,974 k (December 31, 2014: € 9,267 k) and securities available
for sale in the short term of € 8,068 k (December 31, 2014: € 8,244 k).
Total assets increased by € 6,561 k to € 44,815 k (December 31, 2014: € 38,254 k) as of the end of the third quarter and the balance sheet structure remained largely unchanged compared to the end of fiscal
year 2014. The equity ratio dropped slightly to 78 % (December 31, 2014: 79 %). Equity covered 210 % of
fixed assets (December 31, 2014: € 172 %), and fixed assets amounted to 58 % of current assets (Decem-ber 31, 2014: 85 %). Fixed assets fell slightly to 37 % compared to total assets (December 31, 2014:
46 %).
The increase in assets is largely attributable to the rise in liquidity. Furthermore, trade receivables increased by € 2,894 k to € 5,627 k (December 31, 2014: € 2,733 k). This sharp increase is largely due to the report-
ing date, but also includes receivables from development services for Hologic that will first be recognized
starting in 2017.
Equity was up 14 % to € 34,583 k (December 31, 2014: € 30,270 k) on the back of net profit for the period. Other significant changes in liabilities related to income tax liabilities, which increased by € 538 k to
€ 1,277 k (December 31, 2014: € 739 k), to deferred taxes, which rose by € 520 k to € 2,964 k (December
31, 2014: € 2,444 k), as well as to deferred income, which increased by € 852 k to € 3,195 k (December 31, 2014: € 2,343 k).

Interim Report Q3 2015
Page 11 MeVis Medical Solutions AG
MATERIAL EVENTS OCCURRING AFTER THE BALANCE SHEET
DATE
The domination and profit and loss transfer agreement concluded on August 10, 2015 between the VMS
Deutschland Holdings GmbH as the controlling company and MeVis Medical Solutions AG as the controlled
company was registered with the Commercial Register of the Bremen Local Court on October 20, 2015 and thus became legally effective. The registration in the Commercial Register was published by the Bremen
Local Court on October 21, 2015. The shareholders of the MeVis Medical Solutions AG already approved the
domination and profit and loss transfer agreement by a large majority in the extraordinary general meeting on September 29, 2015.
OPPORTUNITIES AND RISK REPORT
No material changes have occurred with regard to the risk situation of the Company since the beginning of
the fiscal year. Therefore, the statements made in the opportunities and risk report of the annual financial
statements as of December 31, 2014 remain valid.
OUTLOOK
In view of the development of business so far, we reiterate our forecast for the year adjusted on September 7. We forecast sales growth of between € 14.5 million and € 15.0 million. For 2015, we expect earnings
before interest and taxes (EBIT) between € 3.5 million and € 4.0 million that is a stable development com-
pared to the previous year's figure of € 3.9 million. Liquidity is expected to between € 23.0 million and € 24.0 million in 2015 as a result of sustained positive cash flows and the payment of € 1.7 million received
in April 2015 for the sale of treasury shares. As in the reporting period, we will regularly review and adjust
our guidance during the course of the fiscal year according to business developments.
Bremen, November 19, 2015
Marcus Kirchhoff Dr. Robert Hannemann
Chairman & CEO Member of the Executive Board

Interim Report Q3 2015
MeVis Medical Solutions AG Page 12
INCOME STATEMENT Q1 TO Q3 2015
for the period January 1 through September 30, 2015
FIGURES IN € k Notes Jan 1 - Sept 30,
2015 Jan 1 - Sept 30,
2014 Revenues 1 11,933 9,661 Income from capitalization of development expenses 2 0 1,163 Other operating income 804 789 Cost of material -340 -490 Staff costs 3 -5,370 -5,208 Other operating expenses 4 -1,918 -1,542 Earnings before interest, taxes, depreciation and amortization (EBITDA)
5,109 4,373
Depreciation, amortization and impairment of intangible and tangible assets
5 -1,489 -1,223
Earnings before interest and tax (EBIT) 3,620 3,150 Share of profit of associates 314 289 Interest income 127 162 Interest expenses -4 -17 Other net financial result 166 341 Net financial result 6 603 775 Earnings before tax (EBT) 4,223 3,925 Income tax 7 -1,259 -469 Net profit for the period 2,964 3,456 Earnings per share in € 14
Basic 1.66 2.01 Diluted 1.65 2.01
STATEMENT OF COMPREHENSIVE INCOME
for the period January 1 through September 30, 2015
FIGURES IN € k Notes Jan 1 - Sept 30,
2015 Jan 1 - Sept 30,
2014 Net profit for the period 2,964 3,456 Changes in fair value of available-for-sale financial instruments -436 346 Deferred tax on changes in fair value 139 -108 Other comprehensive income -297 238 Total comprehensive income 2,667 3,694

Interim Report Q3 2015
Page 13 MeVis Medical Solutions AG
INCOME STATEMENT Q3 2015
for the period July 1 through September 30, 2015
FIGURES IN € k Notes July 1 - Sept 30,
2015 July 1 - Sept 30,
2014 Revenues 1 4,795 3,599 Income from capitalization of development expenses 2 0 322 Other operating income 439 206 Cost of material -141 -146 Staff costs 3 -1,735 -1,641 Other operating expenses 4 -916 -572 Earnings before interest, taxes, depreciation and amortization (EBITDA)
2,442 1,768
Depreciation, amortization and impairment of intangible and tangible assets
5 -449 -407
Earnings before interest and tax (EBIT) 1,993 1,361 Share of profit of associates 126 221 Interest income 41 52 Interest expenses -4 -5 Other net financial result 12 350 Net financial result 6 175 618 Earnings before tax (EBT) 2,168 1,979 Income tax 7 -472 -250 Net profit for the period 1,696 1,729 Earnings per share in € 14
Basic 0.93 1.00 Diluted 0.92 1.00
STATEMENT OF COMPREHENSIVE INCOME
for the period July 1 through September 30, 2015
FIGURES IN € k Notes July 1 - Sept 30,
2015 July 1 - Sept 30,
2014 Net profit for the period 1,696 1,729 Changes in fair value of available-for-sale financial instruments -200 108 Deferred tax on changes in fair value 64 -34 Other comprehensive income -136 74 Total comprehensive income 1,560 1,803

Interim Report Q3 2015
MeVis Medical Solutions AG Page 14
STATEMENT OF FINANCIAL POSITIONS
As of September 30, 2015
FIGURES IN € k Notes Sept 30, 2015 Dec 31, 2014 Non-current assets Intangible assets 14,261 15,621 Property, plant and equipment 318 374 Interest in associated companies 8 1,884 1,571 16,463 17,566 Current assets Trade receivables 5,627 2,733 Other financial assets 9 8,509 8,441 Other assets 242 247 Cash and cash equivalents 13,974 9,267 28,352 20,688 ASSETS 44,815 38,254 Equity capital 10 Subscribed capital 1,820 1,820 Capital reserve 8,203 9,784 Revaluation reserve 429 507 Treasury stock 0 -3,300 Cumulated fair value changes of available-for-sale financial instruments
-143 154
Retained earnings 24,274 21,305 34,583 30,270 Non-current liabilities Provisions 158 158 Deferred taxes 2,964 2,444 3,122 2,602 Current liabilities Provisions 706 305 Trade payables 225 579 Other financial liabilities 11 1,162 1,105 Deferred income 3,195 2,343 Other liabilities 545 311 Income tax liabilities 1,277 739 7,110 5,382 EQUITY AND LIABILITIES 44,815 38,254

Interim Report Q3 2015
Page 15 MeVis Medical Solutions AG
STATEMENT OF CASH FLOW
for the period January 1 through September 30, 2015
FIGURES IN € k Notes Jan 1 - Sept 30,
2015 Jan 1 - Sept 30,
2014
Earnings before interest and tax (EBIT) 3,620 3,150 + Depreciation and amortization and impairments 5 1,489 1,223
+/- Increase/decrease in provisions 401 6 +/- Other non-cash expenses/income -421 154 + Interest received 127 160
- Interest paid 0 -3 + Tax received
0 51
- Tax paid -63 -33
+/- Decrease/increase in trade receivables and other assets -2,728
-1,594
-/+ Decrease/increase in trade payables and other liabilities 817
-604
= Cash flow from operating activities 3,242 2,510
- Purchase of property, plant and equipment -56 -55
- Purchase of intangible assets (excl. development cost) -19
-35
- Payments for capitalized development cost 0 -1,163 + Proceeds from sale of subsidiaries
0 500
- Payments for the acquisition for marketable secu-rities
-3,186
-9,205
+ Proceeds from sale of marketable securities 3,013 5,148 = Cash flow from investing activities -248 -4,810
- Repayment of finance lease liabilities 0 -9 + Proceeds from sale of own shares
1,707 0
- Payment for dividend
-73 0 = Cash flow from financing activities 1,634 -9
Change in cash and cash equivalents 4,628 -2,309
Effect of exchange rates on cash and cash equivalents 79
209
+
Cash and cash equivalents at the beginning of the period 9,267
9,299
= Cash and cash equivalents at the end of the period
13,974 7,199

Interim Report Q3 2015
MeVis Medical Solutions AG Page 16
STATEMENT OF CHANGES IN EQUITY
for the period January 1 through September 30, 2015
FIGURES IN € k Subscribed
capital Capital reserve
Re-valuation
reserve Treasury
shares
Cumula-tive
change in fair value
for sale of available
assets Retained earnings Total
Balance on Jan 1, 2014 1,820 9,768 611 -3,300 -15 17,561 26,445 Transfer to retained earnings according to amortization 0 0 -78 0 0 78 0
Net result 0 0 0 0 238 3,456 3,694
Balance on Sept 30, 2014 1,820 9,768 533 -3,300 223 21,095 30,139
Balance on Jan 1, 2015 1,820 9,784 507 -3,300 154 21,305 30,270
Issue of stock options 0 12 0 0 0 0 12 Transfer to retained earnings according to amortization 0 0 -78 0 0 78 0
Sale of treasury stock
0 -1,593 0 3,300 0 0 1,707
Dividend payment
0 0 0 0 0 -73 -73
Net result 0 0 0 0 -297 2,964 2,667
Balance on Sept 30, 2015 1,820 8,203 429 0 -143 24,274 34,583

Interim Report Q3 2015
Page 17 MeVis Medical Solutions AG
NOTES TO THE FINANCIAL STATEMENTS AS OF SEPTEMBER 30, 2015
BASIC INFORMATION
GENERAL DISCLOSURES
MeVis Medical Solutions AG (“MMS AG” for short) was incorporated at the end of 1997 and commenced business in 1998. It has its registered office in Bremen/Germany. Its office address is Caroline-Herschel-Str.
1, 28359 Bremen.
The interim financial report of MeVis was prepared in accordance with the provisions of § 37x (3) of the German Securities Trading Act (WpHG) along with interim financial statements and a management report.
The interim financial statements of MeVis Medical Solutions AG, Bremen (MMS AG) as at September, 2015
were prepared in accordance with Section 315a (1) of the German Commercial Code (HGB) in line with the rules and regulations in force on the balance sheet date and approved by the European Union of the Inter-
national Financial Reporting Standards (IFRS) published by the International Accounting Standards Board
(IASB) as well as the interpretations of the International Financial Reporting Interpretations Committee (IFRIC). Accordingly, this interim report as at September 30, 2015 was prepared in conformity with IAS 34
“Interim Reporting”. The notes to the interim financial statements are presented in abridged form in line
with the option provided by IAS 34. The interim financial statements and interim management report have
neither been audited nor subjected to accounting review.
RECOGNITION AND MEASUREMENT METHODS
The interim financial statements from January 1 to September 30, 2015 use the same recognition and
measurement policies as the separate financial statement according to IFRS for the financial year 2014. The interim financial statements as of September 30, 2015 must therefore be read in conjunction with the sepa-
rate financial statement according to IFRS as of December 31, 2014.
EFFECTS OF NEW ACCOUNTING STANDARDS
MMS AG’s interim financial statements as of September 30, 2015 including the previous year’s figures have
been prepared in accordance with IFRS as endorsed by the European Union as of December 31, 2014. The
same accounting and valuation principles were applied that were used in preparing the separate financial statement according to IFRS as at December 31, 2014; in addition, IAS 34 “Interim reporting” was applied.
At the same time according to the new regulations of IFRS 11 applicable in the EU from 1 January 2014, as
already mentioned in the separate financial statement according to IFRS as of December 31, 2014, the jointly controlled entities MeVis BreastCare GmbH & Co. KG and MeVis BreastCare Verwaltungsgesellschaft
mbH are recognized in the interim report using the equity method. New announcements of the IASB appli-
cable as at September 30, 2015 had no material impacts on the MeVis financial statements.

Interim Report Q3 2015
MeVis Medical Solutions AG Page 18
SELECTED NOTES ON THE BALANCE SHEET AND INCOME STATEMENT
1. REVENUES
Revenues break down by type as follows:
FIGURES IN € k Jan 1 - Sept 30,
2015 Jan 1 - Sept 30,
2014 Software and licenses 5,901 5,067 Maintenance (software service contracts) 5,093 4,293 Services 934 289 Hardware 5 12 11,933 9,661
2. INCOME FROM THE CAPITALIZATION OF DEVELOPMENT COSTS
In the period under review, expenditures on research and development came to € 2.632 k (prev. year:
€ 2.752 k). Development costs (prev. year: € 1,163 k) were capitalized for the last time in the fourth quarter
of 2014.
3. STAFF COSTS
The average headcount was 106 (prev. year: 107). This is equivalent to an average of 93 full-time positions (prev. year: 94). The average figures include 9 testers (as a rule, students employed on a negligible part-
time basis) (prev. year: 10).
4. OTHER OPERATING EXPENSES
FIGURES IN € k Jan 1 - Sept 30,
2015 Jan 1 - Sept 30,
2014 Legal and consulting costs 631 91 Rental/leasing expenses 444 378 Travel expenses 138 150 Maintenance/repairs 92 211 Cost of preparing and auditing financial statements 74 65 Supervisory Board remuneration 60 59 Vehicle costs 59 56 Energy costs 57 64 Training costs 49 64 Internet expenses 32 30 Cleaning expenses 31 30 Stationary 28 68 Insurance costs 27 41 Events/Congresses 24 22 Catering expenses 21 23 Others 151 190
1,918 1.542
Interim Report Q3 2015
Page 19 MeVis Medical Solutions AG
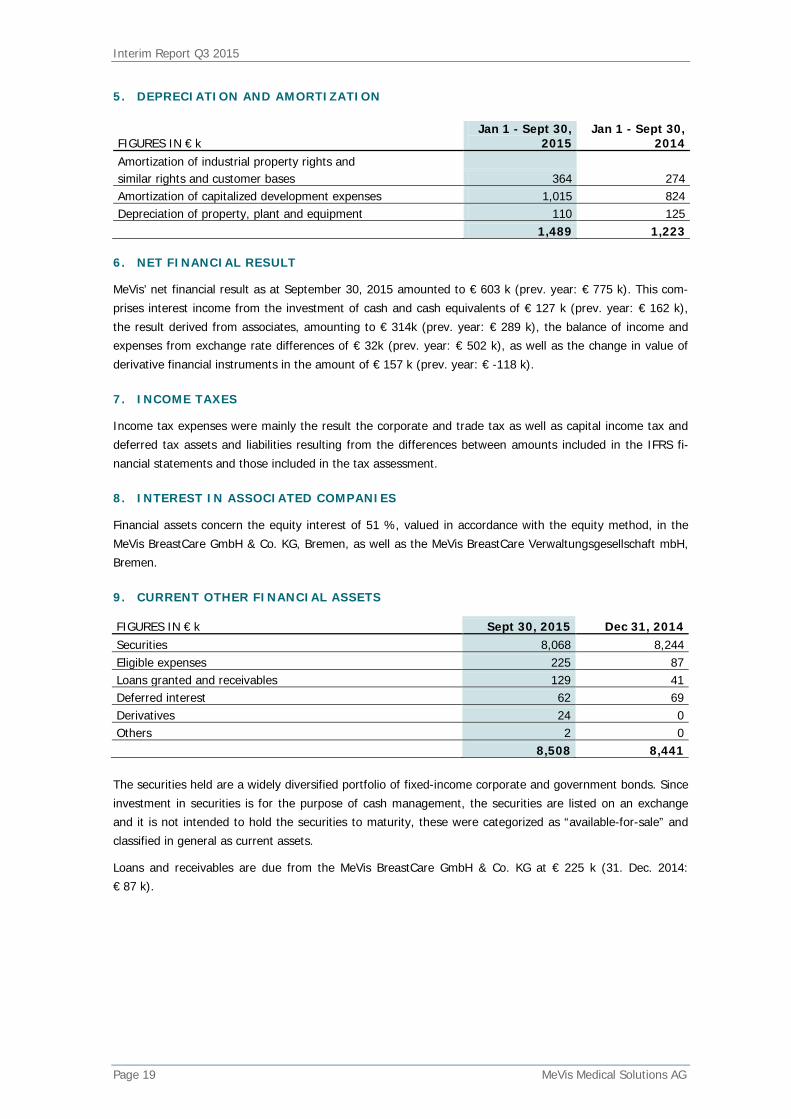
5. DEPRECIATION AND AMORTIZATION
6. NET FINANCIAL RESULT
MeVis’ net financial result as at September 30, 2015 amounted to € 603 k (prev. year: € 775 k). This com-
prises interest income from the investment of cash and cash equivalents of € 127 k (prev. year: € 162 k),
the result derived from associates, amounting to € 314k (prev. year: € 289 k), the balance of income and expenses from exchange rate differences of € 32k (prev. year: € 502 k), as well as the change in value of
derivative financial instruments in the amount of € 157 k (prev. year: € -118 k).
7. INCOME TAXES
Income tax expenses were mainly the result the corporate and trade tax as well as capital income tax and
deferred tax assets and liabilities resulting from the differences between amounts included in the IFRS fi-
nancial statements and those included in the tax assessment.
8. INTEREST IN ASSOCIATED COMPANIES
Financial assets concern the equity interest of 51 %, valued in accordance with the equity method, in the
MeVis BreastCare GmbH & Co. KG, Bremen, as well as the MeVis BreastCare Verwaltungsgesellschaft mbH, Bremen.
9. CURRENT OTHER FINANCIAL ASSETS
FIGURES IN € k Sept 30, 2015 Dec 31, 2014 Securities 8,068 8,244 Eligible expenses 225 87 Loans granted and receivables 129 41 Deferred interest 62 69 Derivatives 24 0 Others 2 0 8,508 8,441
The securities held are a widely diversified portfolio of fixed-income corporate and government bonds. Since
investment in securities is for the purpose of cash management, the securities are listed on an exchange and it is not intended to hold the securities to maturity, these were categorized as “available-for-sale” and
classified in general as current assets.
Loans and receivables are due from the MeVis BreastCare GmbH & Co. KG at € 225 k (31. Dec. 2014: € 87 k).
FIGURES IN € k Jan 1 - Sept 30,
2015 Jan 1 - Sept 30,
2014 Amortization of industrial property rights and
similar rights and customer bases 364 274 Amortization of capitalized development expenses 1,015 824 Depreciation of property, plant and equipment 110 125
1,489 1,223

Interim Report Q3 2015
MeVis Medical Solutions AG Page 20
10. SHAREHOLDERS´ EQUITY
Revaluation reserve
In connection with the acquisition of the 49 % interest in MeVis BreastCare Solutions GmbH & Co. KG (hereafter: "MBS KG") from Siemens AG and the subsequent full consolidation of MBS KG in 2008, the as-
sets and liabilities of MBS KG, which were accrued to MMS AG with the official registration of the merger of
MeVis BreastCare Solutions Verwaltungs-GmbH on August 1, 2013, were completely revaluated. Where this increase was attributable to the 51 % interest in MBS KG already held by the Company, the difference was
recognized within the revaluation reserve. The amount of € 1,688 k comprises intangible assets of
€ 2,411 k net of deferred taxes of € 723 k. Amounts equaling the depreciation and amortization recognized on these assets are reclassified as retained earnings on a proportionate basis.
FIGURES IN € k 2015 2014 Status as at January 1 507 611 -Transfer of the amount corresponding to write-downs and the associated deferred taxes to retained earnings, without an im-pact on profit and loss -78 -78 Status as at September 30 429 533 Treasury stock
In accordance with a new resolution passed by the shareholders at the annual general meeting on Septem-
ber 28, 2007 concerning the acquisition of the Company’s own stock in accordance with Section 71 (1) No. 8
of the German Stock Corporation Act (AktG), the Company was authorized to acquire up to 10 % of its cur-rent share capital (€ 1,300 k) on or before March 27, 2009. MMS AG already held 37,800 treasury shares on
December 31, 2007. On March 4, 2008 the Executive Board decided to initially buy back up to a further
53,200 of the Company’s own shares on the stock market by August 30, 2008. As part of this stock buyback program, the Company acquired 53,200 of its own shares for a total amount of € 1,502 k as of June 17,
2008.
In the course of acquiring the software product Colotux for a total of € 220 k on October 23, 2008, half of the first purchase price installment of € 110 k was settled in mid-November 2008 by the transfer of treasury
shares (a total of 1,832 treasury shares with a market value of € 55 k).
In accordance with a new resolution passed by the shareholders at the annual general meeting on July 9,
2008 concerning the acquisition of the Company’s own shares in accordance with Section 71 (1) No. 8 of the German Stock Corporation Act (AktG), the Company was authorized to acquire up to 10 % of its current
share capital (€ 1,820 k) on or before January 8, 2010. On November 4, 2008, the Executive Board decided
to buy up to a further 91,000 of the Company’s own shares on the stock market. As part of this stock buy-back program, the Company acquired 33,682 of its own shares for a total amount of € 1,163 k as of March
31, 2009. When the stock buyback program was concluded on March 31, 2009, MMS AG held a total of
122,850 treasury shares (6.75 % of share capital). A total of 18,726 treasury shares were transferred to the seller as part of the second stage in the acquisition of Medis shares on May 31, 2010. The second purchase
price installment for the acquisition of the Colotux software product was paid in advance on April 15, 2011.
The seller was paid a total of 6,571 treasury shares, among other things.
On February 18, 2015, the Company tendered all of its treasury shares (97,553) based on the voluntary
public takeover offer of VMS Deutschland Holdings GmbH at the offer price of € 17.50 per share. The tender
was accepted by VMS Deutschland Holdings GmbH on April 21, 2015.
Thus, as of September 30, 2015 there are no treasury shares.

Interim Report Q3 2015
Page 21 MeVis Medical Solutions AG
11. OTHER FINANCIAL LIABILITIES
Current other financial liabilities
Staff liabilities primarily comprise the cost of accrued vacation entitlements, bonuses and the 13th salary.
12. TRANSACTIONS WITH RELATED PARTIES
With reference to business transacted with related parties, there have been no material changes since De-cember 31, 2014.
13. CONTINGENT RECEIVABLES AND CONTINGENT LIABILITIES
In comparison with the contingent receivables and contingent liabilities presented the separate financial statement according to IFRS for 2014, no changes occurred in the first half of the current fiscal year.
14. EARNINGS PER SHARE
Earnings per share equal the profit on continuing activities or profit (after tax) divided by the weighted av-erage number of shares outstanding during the financial year. Earnings per share (fully diluted) are calculat-
ed on the assumption that all securities, stock options and stock awards with a potentially dilutive effect are
converted or exercised.
As the criteria for exercising the options have been satisfied as of the balance sheet date, it can be assumed that the options will be exercised by the employees. Accordingly, they are included in the calculation of the
diluted earnings per share.
The weighted average of shares outstanding is determined by taking account of shares redeemed and reis-sued subject to a chronological weighting.
Sept 30, 2015 Dec 31, 2014
Net result for the period in € k 2,964 3,456 Weighted average of the number of no-par-value shares out-standing during the period under review 1,780,693 1,722,447 Basic earnings per share in € 1.66 2.01 Diluted earnings per share in € 1.65 2.01
FIGURES IN € k Sept 30, 2015 Dec 31, 2014 Staff liabilities 1,155 815 Derivative financial instruments 7 7 Liability from 49 % acquisition of MBS KG 0 150 Derivatives 0 133
1,162 1,105

Interim Report Q3 2015
MeVis Medical Solutions AG Page 22
15. SEGMENT INFORMATION
As of September 30, 2015 the activities of the Company were still subdivided into the reportable segments
of Digital Mammography and Other Diagnostics.
Segment net profit and loss, which corresponds to earnings before interest and tax (EBIT), constitutes the
key benchmark for assessing and controlling the earnings position of a particular segment.
The segments break down as follows:
16. POST BALANCE SHEET EVENTS
The domination and profit and loss transfer agreement concluded on August 10, 2015 between the VMS
Deutschland Holdings GmbH as the controlling company and MeVis Medical Solutions AG as the controlled
company was registered with the Commercial Register of the Bremen Local Court on October 20, 2015 and thus became legally effective. The shareholders of the MeVis Medical Solutions AG already approved the
domination and profit and loss transfer agreement by a large majority in the extraordinary general meeting
on September 29, 2015.
Bremen, November 19, 2015
Marcus Kirchhoff Dr. Robert Hannemann
Chairman & CEO Member of the Executive Board
Digital
Mammography Other
Diagnostics Total
Jan 1 – Sept 30 Jan 1 – Sept 30 Jan 1 – Sept 30
FIGURES IN € k 2015 2014 2015 2014 2015 2014
Revenues 9,454 7,280 2,479 2,381 11,933 9,661
Grants 0 0 399 310 399 310
Total segment revenues 9,454 7,280 2,878 2,691 12,332 9,971
Capitalized development costs 0 1,163 0 0 0 1,163
Depreciation and amortization -1.362 -1,107 -127 -116 -1,489 -1,223
Operating expenses -2,757 -2,609 -2,953 -3,089 -5,710 -5,698
Result of operating activites 5,335 4,727 -202 -514 5,133 4,213
Other operating income 275 169 130 310 405 479
Other operating expenses -973 -347 -945 -1,195 -1,918 -1,542
Segment net profit/loss 4,637 4,549 -1,017 -1,399 3,620 3,150

Interim Report Q3 2015
Page 23 MeVis Medical Solutions AG
RESPONSIBILITY STATEMENT („BILANZEID“)
Responsibility statement required by section 37x no. 1 of the Wertpapierhandelsgesetz (WpHG – German
Securities Trading Act) in conjunction with sections 264(2) sentence 3 and 289(1) sentence 5 or 6 of the
Handelsgesetzbuch (HGB – German Commercial Code) for the financial statements and the management report:
“To the best of our knowledge, and in accordance with the applicable reporting principles, the financial
statements give a true and fair view of the assets, liabilities, financial position and profit or loss of the Com-pany, and the management report includes a fair review of the development and performance of the busi-
ness and the position of the Company, together with a description of the principal opportunities and risks
associated with the expected development of the Company.”
Bremen, November 19, 2015
MeVis Medical Solutions AG
Marcus Kirchhoff Dr. Robert Hannemann
Chairman & CEO Member of the Executive Board

Interim Report Q3 2015
MeVis Medical Solutions AG Page 24
DISCLAIMER
FORWARD-LOOKING STATEMENT
This report contains forward-looking statements which are based on management’s current estimates of future developments. Such statements are subject to risks and uncertainties, which MeVis Medical Solutions
AG is not able to control or estimate with any precision, e.g. future market conditions and the general eco-
nomic environment, the behavior of other market participants, the successful integration of new acquisitions and government acts. If any of these uncertainties or imponderabilities materialize or if the assumptions on
which these statements are based prove to be incorrect, this may cause actual results to deviate materially
from those expressly or implicitly contained in these statements. MeVis Medical Solutions AG does not intend
and is under no obligation to update the forward-looking statements in the light of any events or develop-ments occurring after the date of this report.
DEVIATIONS FOR TECHNICAL REASONS
Deviations may occur between the accounting data contained in this report and that submitted to the Bundesanzeiger for technical reasons (e.g. conversion of electronic formats). In the case of any doubt, the
version submitted to the Bundesanzeiger will prevail.
This report is also available in a German-language version. In case of any doubt, the German-language version takes priority over the English-language one.
The report is available for downloading in both languages in the internet at:
http://www.mevis.de/en/investor-relations/financial-reports/

Interim Report Q3 2015
Page 25 MeVis Medical Solutions AG
FINANCE CALENDAR 2015
Date Event
April 23, 2015 Annual Report 2014 May 21, 2015 Interim Report for Q1 2015
June 9, 2015 Annual General Meeting
August 11, 2015 Interim Report for H1 2015 Aug. 31 - Sept. 2, 2015 Small Cap Conference, Frankfurt am Main
September 29, 2015 Extraordinary General Meeting
November 19, 2015 Interim Report for Q3 2015

www.mevis.de
MeVis Medical Solutions AGCaroline-Herschel-Str. 128359 BremenGermany
Phone +49 421 22495 0Fax +49 421 22495 [email protected]