Embed Size (px)
Citation preview
LKAB INTERIM REPORT Q1/2017 1
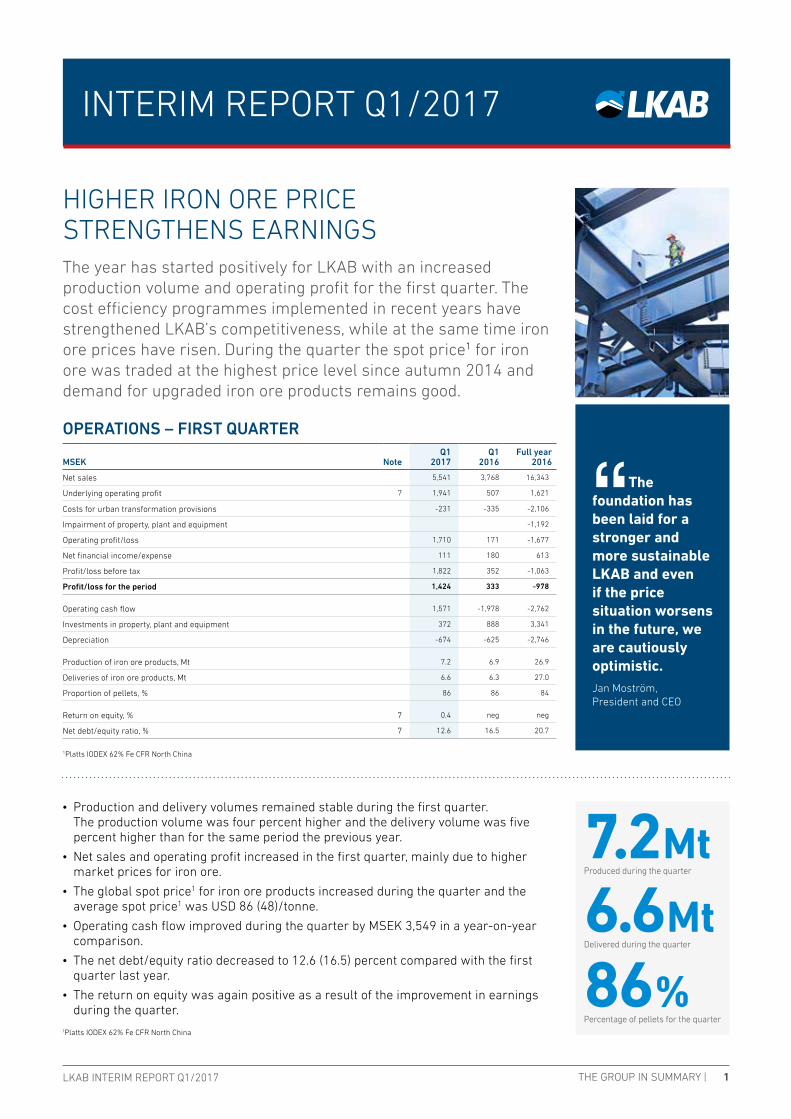
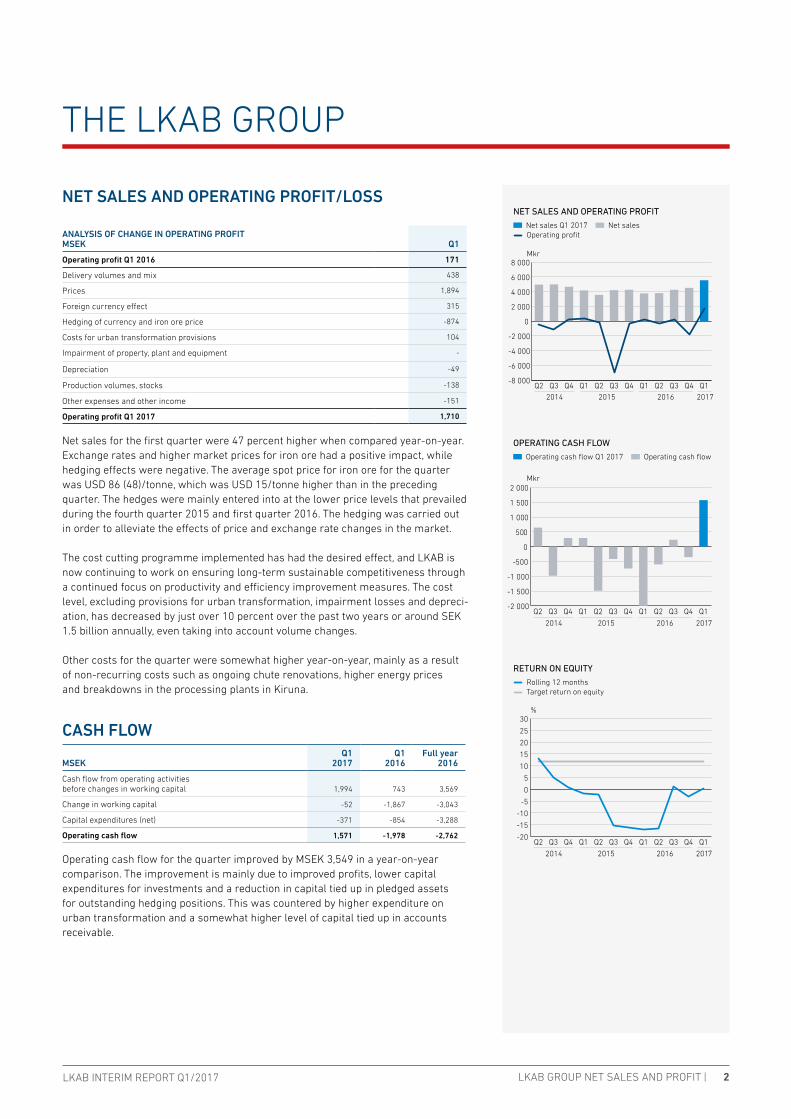
The year has started positively for LKAB with an increased production volume and operating profit for the first quarter. The cost efficiency programmes implemented in recent years have strengthened LKAB’s competitiveness, while at the same time iron ore prices have risen. During the quarter the spot price1 for iron ore was traded at the highest price level since autumn 2014 and demand for upgraded iron ore products remains good.
OPERATIONS – FIRST QUARTER
MSEK NoteQ1
2017Q1
2016Full year
2016
Net sales 5,541 3,768 16,343
Underlying operating profit 7 1,941 507 1,621
Costs for urban transformation provisions -231 -335 -2,106
Impairment of property, plant and equipment -1,192
Operating profit/loss 1,710 171 -1,677
Net financial income/expense 111 180 613
Profit/loss before tax 1,822 352 -1,063
Profit/loss for the period 1,424 333 -978
Operating cash flow 1,571 -1,978 -2,762
Investments in property, plant and equipment 372 888 3,341
Depreciation -674 -625 -2,746
Production of iron ore products, Mt 7.2 6.9 26.9
Deliveries of iron ore products, Mt 6.6 6.3 27.0
Proportion of pellets, % 86 86 84
Return on equity, % 7 0.4 neg neg
Net debt/equity ratio, % 7 12.6 16.5 20.7
1Platts IODEX 62% Fe CFR North China
THE GROUP IN SUMMARY |
7.2MtProduced during the quarter
6.6MtDelivered during the quarter
86%Percentage of pellets for the quarter
HIGHER IRON ORE PRICE STRENGTHENS EARNINGS
INTERIM REPORT Q1/2017
The foundation has been laid for a stronger and more sustainable LKAB and even if the price situation worsens in the future, we are cautiously optimistic.Jan Moström, President and CEO
• Production and delivery volumes remained stable during the first quarter. The production volume was four percent higher and the delivery volume was five percent higher than for the same period the previous year.
• Net sales and operating profit increased in the first quarter, mainly due to higher market prices for iron ore.
• The global spot price1 for iron ore products increased during the quarter and the average spot price1 was USD 86 (48)/tonne.
• Operating cash flow improved during the quarter by MSEK 3,549 in a year-on-year comparison.
• The net debt/equity ratio decreased to 12.6 (16.5) percent compared with the first quarter last year.
• The return on equity was again positive as a result of the improvement in earnings during the quarter.
1Platts IODEX 62% Fe CFR North China
LKAB INTERIM REPORT Q1/2017 2 LKAB GROUP NET SALES AND PROFIT |
THE LKAB GROUP
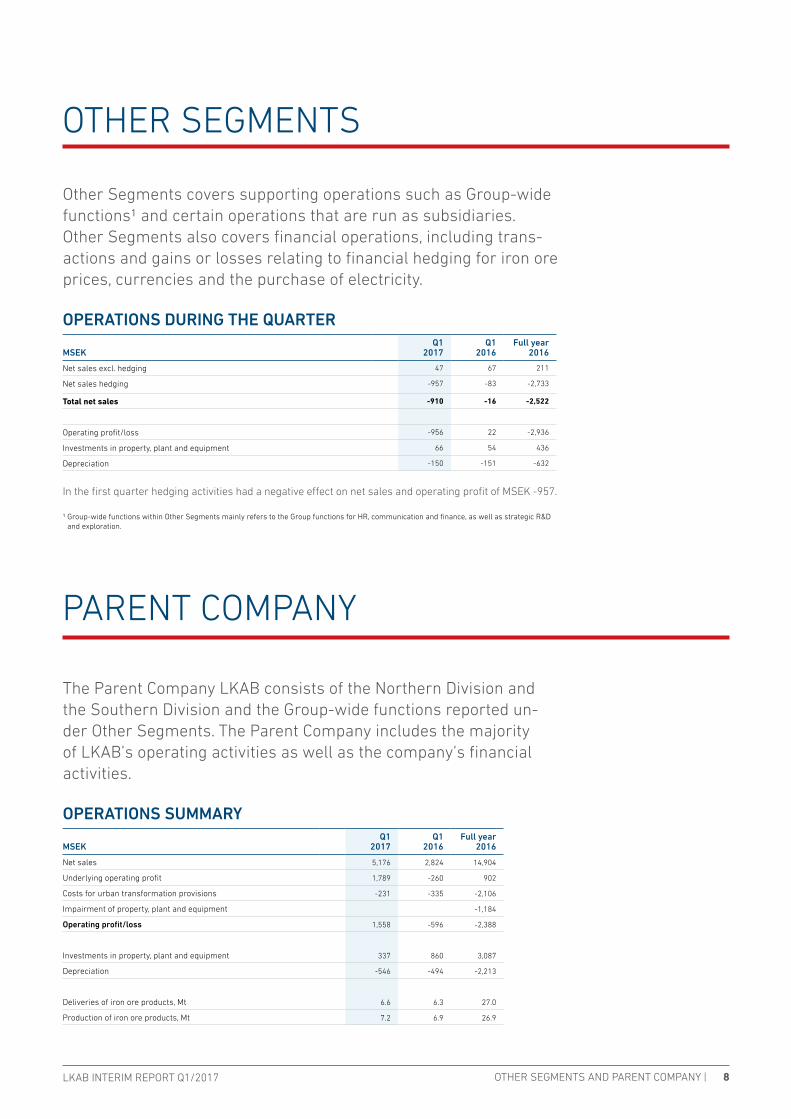
NET SALES AND OPERATING PROFIT/LOSS
ANALYSIS OF CHANGE IN OPERATING PROFITMSEK Q1
Operating profit Q1 2016 171
Delivery volumes and mix 438
Prices 1,894
Foreign currency effect 315
Hedging of currency and iron ore price -874
Costs for urban transformation provisions 104
Impairment of property, plant and equipment -
Depreciation -49
Production volumes, stocks -138
Other expenses and other income -151
Operating profit Q1 2017 1,710
Net sales for the first quarter were 47 percent higher when compared year-on-year. Exchange rates and higher market prices for iron ore had a positive impact, while hedging effects were negative. The average spot price for iron ore for the quarter was USD 86 (48)/tonne, which was USD 15/tonne higher than in the preceding quarter. The hedges were mainly entered into at the lower price levels that prevailed during the fourth quarter 2015 and first quarter 2016. The hedging was carried out in order to alleviate the effects of price and exchange rate changes in the market.
The cost cutting programme implemented has had the desired effect, and LKAB is now continuing to work on ensuring long-term sustainable competitiveness through a continued focus on productivity and efficiency improvement measures. The cost level, excluding provisions for urban transformation, impairment losses and depreci-ation, has decreased by just over 10 percent over the past two years or around SEK 1.5 billion annually, even taking into account volume changes.
Other costs for the quarter were somewhat higher year-on-year, mainly as a result of non-recurring costs such as ongoing chute renovations, higher energy prices and breakdowns in the processing plants in Kiruna.
CASH FLOW
MSEKQ1
2017Q1
2016Full year
2016
Cash flow from operating activities before changes in working capital 1,994 743 3,569
Change in working capital -52 -1,867 -3,043
Capital expenditures (net) -371 -854 -3,288
Operating cash flow 1,571 -1,978 -2,762
Operating cash flow for the quarter improved by MSEK 3,549 in a year-on-year comparison. The improvement is mainly due to improved profits, lower capital expenditures for investments and a reduction in capital tied up in pledged assets for outstanding hedging positions. This was countered by higher expenditure on urban transformation and a somewhat higher level of capital tied up in accounts receivable.
NET SALES AND OPERATING PROFIT
Net sales Q1 2017 Net sales Operating profit
RETURN ON EQUITY
Rolling 12 months Target return on equity
-20
-15
-10
-5
0
5
10
15
20
25
30
Q1Q4Q3Q2Q1Q4Q3Q2Q1Q4Q3Q2
%
2014 2015 2016 2017
-8 000
-6 000
-4 000
-2 000
0
2 000
4 000
6 000
8 000
Q1Q4Q3Q2Q1Q4Q3Q2Q1Q4Q3Q2
Mkr
2014 2015 2016 2017
OPERATING CASH FLOW
Operating cash flow Q1 2017 Operating cash flow
-2 000
-1 500
-1 000
-500
0
500
1 000
1 500
2 000
Q1Q4Q3Q2Q1Q4Q3Q2Q1Q4Q3Q2
Mkr
2014 2015 2016 2017

LKAB INTERIM REPORT Q1/2017 3 NET FINANCIAL INCOME/EXPENSE AND FINANCIAL POSITION |
THE LKAB GROUP
NET FINANCIAL INCOME/EXPENSE AND NET FINAN-CIAL INDEBTEDNESSNet financial income/expense for the first quarter was MSEK 111 (180). An improved return on financial investments made a positive contribution year-on-year. Lower financial income from hedging activities is having a negative effect.
The net debt/equity ratio decreased to 12.6 (16.5) percent as a result of lower net financial indebtedness and higher equity. Equity increased mainly as a result of the improvement in earnings.
CREDIT FACILITIES
MSEK NominalUtilized
(nominal) Available
Commercial paper programme, maturing within one year 5,000 800 4,200
Bond programme 7,000 4,009
Maturing December 2019 1,991
Maturing June 2021 1,000
Other bond financing 250 250
Credit facility 5,000 5,000
Total 17,250 4,041 13,209
There were no changes in nominal credit facilities during the quarter. All credit facilities are subject to 100 percent retention of title.
OUTLOOK FOR 2017LKAB expects the market situation to remain largely unchanged, which puts pres-sure on iron ore prices and thus also on LKAB’s profitability. Demand for LKAB’s pellets continues to be strong, and the strategy of maximizing pellet production remains in place. LKAB is continuing its adaptation work, focusing on profitability, productivity improvements and cost cutting in order to increase competitiveness. Work on the urban transformation is moving into a more intensive phase with con-tinued provisions and an increased number of acquisitions, which means increased expenditure over the coming year.
SEGMENT REPORTING With effect from the first quarter 2017 LKAB Berg & Betong AB, LKAB Mekaniska AB and LKAB Kimit AB are being reported in the Special Products Division, rather than under Other Segments as in 2016. Earlier periods have been restated in accordance with the change.
Note 8 provides an overall summary of earnings for each division and for other operating segments, as well as for the Group.
NET FINANCIAL INDEBTEDNESS
Net financial indebtedness
NET DEBT/EQUITY RATIO
Net debt/equity ratio
MSEK
%
-10
-5
0
5
10
15
20
25
Q1Q4Q3Q2Q1Q4Q3Q2Q1Q4Q3Q2
2014 2015 2016 2017
-4 000
-2 000
0
2 000
4 000
6 000
8 000
1 0000
Q1Q4Q3Q2Q1Q4Q3Q2Q1Q4Q3Q2
2014 2015 2016 2017

LKAB INTERIM REPORT Q1/2017 4 MARKET DEVELOPMENT |
MARKET DEVELOPMENT
THE STEEL AND IRON ORE MARKET
THE GLOBAL STEEL AND IRON ORE INDUS-TRYGlobal production of crude steel increased in the first quarter by six percent compared with the same period last year. During the quarter steel prices remained stable. Steel exports by China reduced as a result of increased domestic demand and continued trade barriers, particularly in the USA and Europe.
Demand for LKAB’s iron ore products remains strong. Demand for pellets from LKAB’s European, US and MENA customers is higher than contracted due to a continued poor supply of pellets on the market.
EuropeProduction of crude steel within the EU28 increased in Q1 by four percent compared with the same period last year. The automo-tive industry remains strong and is the sector that is driving demand for steel in Europe.
Middle East and North Africa (MENA)Production of crude steel increased by 15 percent during Q1 compared with the same period last year. The trend in oil prices turned around and began moving down-wards during the quarter, while the political unrest in the region remains. Demand for DR pellets remains high.
USAIn the USA production of crude steel increased by four percent during Q1 compared with the same period last year. In early 2017 capacity utilization in the US steel industry increased. This is a trend that is expected to continue because of improved demand and continued tariffs on imported steel. Steel prices continued to develop positively during the quarter.
ChinaChina’s production of crude steel increased in the first quarter by five percent com-pared with the same period last year. China’s iron ore imports remain stable, amounting to 271 Mt in Q1, an increase of 12 percent compared with the same period last year. Port inventories of iron ore contin-ued to increase, reaching 132 Mt at the end of the quarter.
Iron ore spot price developmentsQ1 began with a spot price of USD 78/tonne. The price then increased and settled at a level of around USD 85–90. The spot price peaked at USD 95/tonne during the quarter. The average for Q1 was USD 86/tonne, which was USD 15/tonne higher than in the preceding quarter. Quoted pellet premiums for blast furnace pellets and DR pellets increased at the start of the year to USD 45/tonne and USD 54/tonne respectively and remained there throughout
the quarter. The pellet premium in China continued to decrease during the quarter. The price difference between Platts IODEX 65% Fe and 62% Fe remained substantial, peaking at USD 5/tonne per % Fe unit. This reflects continued increased demand for high quality iron ore products.
THE INDUSTRIAL MINERALS MARKETThe market for gas pipeline projects contin-ues to have a high demand for iron ore for the production of heavy concrete. The price level of iron ore is affecting the compet-itive situation, since more operators are interested in the market when the iron ore price falls. Competitiveness is affected not just by quality, but also by logistics costs. The water treatment market continues to offer stable demand, with certain opportu-nities for increased sales. The construction market, which is project-based and regional in nature, also remains important and can be developed.
IRON ORE SPOT PRICE DEVELOPMENTS
1 January 2011 – 31 March 2017Source: PLATTS IODEX 62% Fe CFR North China
USD/tonne
0
50
100
150
200
250
2017201620152014201320122011
1Platts iodex 62% fe cfr north china

LKAB INTERIM REPORT Q1/2017 5
The Northern Division comprises mines and processing plants in Kiruna.
OPERATIONS SUMMARY
MSEK NoteQ1
2017Q1
2016Full year
2016
Net sales 3,716 2,141 10,376
Underlying operating profit 7 1,750 409 2,891
Costs for urban transformation provisions -231 -330 -1,727
Operating profit/loss 1,519 79 1,164
Investments in property, plant and equipment 139 199 884
Depreciation -308 -301 -1,264
Deliveries of iron ore products, Mt 4.0 3.8 15.5
Proportion of pellets, % 92 92 90
Production of iron ore products, Mt 4.1 4.0 15.2
Production remained stable during the quarter. In the processing plants, production was restricted somewhat as a result of a number of breakdowns in the pelletizing plants. The production volume for the first quarter increased by three percent and deliveries increased by five percent compared with the same period last year.
Sales for the quarter increased by 74 percent year-on-year, which was mainly an effect of higher iron ore prices. Higher delivery volumes and a stronger dollar exchange rate also contributed to the increased sales.
Costs, excluding provisions for urban transformation, were 14 percent higher than in the same period last year, which was primarily an effect of higher volumes, higher energy prices, ongoing chute renovations and breakdowns. Underlying oper-ating profit for the first quarter increased by MSEK 1,341 compared with Q1 2016.
NORTHERN DIVISION |
NORTHERN DIVISION
FACTS
0
500
1 000
1 500
2 000
2 500
3 000
3 500
4 000
4 500
Q4Q3Q2Q1
• The Northern Division mines and pro-cesses iron ore products in Kiruna.
• The mining takes place in the Kiruna underground mine, which has an in-clined slab of magnetite that is around 80 metres wide, four kilometres long and extends around two kilometres underground.
• The ore is processed above ground in three concentrating plants and three pelletizing plants.
• The Northern Division produces both blast furnace pellets and pellets for steel production via direct reduction, known as DR pellets.
• The processed iron ore products are transported along the Malmbanan and Ofotbanen ore railway to the port in Narvik, for shipment to steelmill customers around the world.
• The iron ore operations have a sales organization for the markets in Europe, Asia and the Middle East.
Production of iron ore (k tonnes), Northern Division
2017 2016

LKAB INTERIM REPORT Q1/2017 6 SOUTHERN DIVISION |
SOUTHERN DIVISION
The Southern Division covers mines and processing plants in Malmberget and Svappavaara.
OPERATIONS SUMMARY
MSEK NoteQ1
2017Q1
2016Full year
2016
Net sales 2,360 1,347 7,162
Underlying operating profit 7 1,057 2 1,293
Costs for urban transformation provisions -5 -379
Impairment of property, plant and equipment -1,192
Operating profit/loss 1,057 -3 -278
Investments in property, plant and equipment 162 630 1,997
Depreciation -201 -154 -782
Deliveries of iron ore products, Mt 2.7 2.5 11.5
Proportion of pellets, % 77 77 76
Production of iron ore products, Mt 3.1 2.9 11.7
Production remained stable in the first quarter of the year and the production volume increased by seven percent. Deliveries increased by eight percent, with the proportion of pellets at 77 (77) percent.
Sales for the quarter increased by 75 percent, mainly as an effect of higher iron ore prices, but higher delivery volumes and a stronger dollar exchange rate also contributed to the increased sales.
Costs, excluding provisions for urban transformation, were three percent lower than last year, which was mainly an effect of cost-cutting measures implemented. Underlying operating profit for the first quarter improved by MSEK 1,055 in a year-on-year comparison.
• The Southern Division mines and pro-cesses iron ore products in Malmberget and Svappavaara.
• The mining takes place in Malmberget’s underground mine and the Svappavaara open-pit mines.
• Magnetite is mainly mined in the Malm-berget mine, but also hematite. The mine has around 20 orebodies, of which around 10 are currently mined.
• In Svappavaara ore is mined in the Leveäniemi and Gruvberget open-pit mines.
• The ore is processed above ground in two concentrating and pelletizing plants in Malmberget and in one concentrating and pelletizing plant in Svappavaara.
• The Southern Division produces both blast furnace pellets and fines.
• The processed iron ore products are transported along the Malmbanan ore railway, mainly to the port in Luleå and on to European steelmill customers.
• The iron ore operations have a sales organization for the markets in Europe, Asia and the Middle East.
FACTS
Production of iron ore (k tonnes), Southern Division
2017 2016
0
500
1 000
1 500
2 000
2 500
3 000
3 500
4 000
Q4Q3Q2Q1

LKAB INTERIM REPORT Q1/2017 7 SPECIAL PRODUCTS DIVISION |
SPECIAL PRODUCTS DIVISION
The Special Products Division provides products and services to LKAB, such as drilling systems, mechanical services, contract work and rockwork. These products and services are also marketed to external customers. LKAB Minerals has operations in 12 countries and the company is a leading global supplier of industrial minerals, with a major focus on our own minerals of magnetite, mica and huntite.
OPERATIONS SUMMARY
MSEKQ1
2017Q1
2016Full year
2016
Net sales 739 741 3,364
Operating profit/loss 82 50 351
Investments in property, plant and equipment 6 5 25
Depreciation -15 -19 -68
Net sales for the first quarter of the year are at the same level as in the first quarter last year, amounting to MSEK 739 (741). Increased sales volumes and a changed sales mix during the quarter contributed to increased operating profit, which amounted to MSEK 82 (50).
During the quarter two major deliveries of the magnetite product MagnaDense were sent to Mexico and the Tuxpan gas pipeline project.
• The Special Products Division covers LKAB Minerals, LKAB Wassara, LKAB Berg & Betong, LKAB Kimit and LKAB Mekaniska.
• LKAB Minerals mines and sells miner-als and also processes and sells iron ore for applications outside the steel industry. The business has sales offices and production units in Europe, the US and Asia.
• LKAB Wassara develops and manufac-tures water-powered precision drilling systems for mining, construction and ex-ploration drilling as well as dam building and geothermal energy. Customers are located throughout the world.
• LKAB Berg & Betong is a leading group offering full service solutions for the mining and construction industries. LKAB Berg & Betong is also the world’s largest producer of sprayed concrete.
• LKAB Kimit supplies explosives to the mining and construction industries.
• LKAB Mekaniska is a quality-conscious engineering company offering services throughout the supply chain, from plan-ning and design to final inspection.
FACTS
LKAB INTERIM REPORT Q1/2017 8 OTHER SEGMENTS AND PARENT COMPANY |
OTHER SEGMENTS
Other Segments covers supporting operations such as Group-wide functions1 and certain operations that are run as subsidiaries. Other Segments also covers financial operations, including trans-actions and gains or losses relating to financial hedging for iron ore prices, currencies and the purchase of electricity.
OPERATIONS DURING THE QUARTER
MSEKQ1
2017Q1
2016Full year
2016
Net sales excl. hedging 47 67 211
Net sales hedging -957 -83 -2,733
Total net sales -910 -16 -2,522
Operating profit/loss -956 22 -2,936
Investments in property, plant and equipment 66 54 436
Depreciation -150 -151 -632
In the first quarter hedging activities had a negative effect on net sales and operating profit of MSEK -957.
1 Group-wide functions within Other Segments mainly refers to the Group functions for HR, communication and finance, as well as strategic R&D and exploration.
PARENT COMPANY
The Parent Company LKAB consists of the Northern Division and the Southern Division and the Group-wide functions reported un-der Other Segments. The Parent Company includes the majority of LKAB’s operating activities as well as the company’s financial activities.
OPERATIONS SUMMARY
MSEKQ1
2017Q1
2016Full year
2016
Net sales 5,176 2,824 14,904
Underlying operating profit 1,789 -260 902
Costs for urban transformation provisions -231 -335 -2,106
Impairment of property, plant and equipment -1,184
Operating profit/loss 1,558 -596 -2,388
Investments in property, plant and equipment 337 860 3,087
Depreciation -546 -494 -2,213
Deliveries of iron ore products, Mt 6.6 6.3 27.0
Production of iron ore products, Mt 7.2 6.9 26.9
LKAB INTERIM REPORT Q1/2017 9 SIGNATURE |
SIGNATURE
This report was not subject to review by the company’s auditors.
Luleå, 27 April 2017Luossavaara-Kiirunavaara AB (publ)
Jan MoströmPresident and CEO
FINANCIAL INFORMATION
Interim Report Q2 2017 15 August 2017
Interim Report Q3 2017 27 October 2017
Year-end Report 2017 February 2018
Annual General Meeting April 2018
Reports are available at www.lkab.com
Any questions concerning the Interim Report may be directed to Jan Moström, President and CEO, or to Peter Hansson, Senior Vice President, Finance, +46 920 381 00.

LKAB INTERIM REPORT Q1/2017 10 LKAB – GROUP |
LKAB – GROUP
CONSOLIDATED INCOME STATEMENT
MSEKQ1
2017Q1
2016Full year
2016
Net sales 5,541 3,768 16,343
Cost of goods sold -3,608 -3,350 -17,116
Gross profit/loss 1,933 418 -773
Selling expenses -31 -38 -143
Administrative expenses -114 -125 -464
Research and development expenses -64 -51 -245
Other operating income 57 55 227
Other operating expenses -72 -87 -279
Operating profit/loss 1,710 171 -1,677
Financial income 184 264 898
Financial expense -73 -84 -285
Net financial income/expense 111 180 613
Profit/loss before tax 1,822 352 -1,063
Tax -398 -19 85
Profit/loss for the period 1,424 333 -978
Attributable to Parent Company shareholders 1,424 333 -978
Earnings per share before and after dilution (SEK) 2,034 476 -1,397
Number of shares 700,000 700,000 700,000
CONSOLIDATED STATEMENT OF COMPREHENSIVE INCOME
MSEKQ1
2017Q1
2016Full year
2016
Profit/loss for the period 1,424 333 -978
Other comprehensive income for the period
Items that will not be reclassified to profit or loss
Actuarial gains and losses 49 -38 -79
Tax attributable to actuarial gains and losses -11 7 17
Total items that will not be reclassified to profit for the year 38 -31 -62
Items that may be reclassified subsequently to profit or loss
Gains/losses on translation of foreign operations for the period
-33 18 67
Change in fair value of available-for-sale financial assets for the period
17 82 345
Changes in fair value of cash flow hedges for the period -142 -860 -969
Changes in fair value of cash flow hedges transferred to profit for the year
598 -88 -232
Tax attributable to components of cash flow hedges -100 208 264
Total items reclassified to profit or loss 340 -640 -525
Other comprehensive income 378 -671 -587
Total comprehensive income for the period attributable to the Parent Company shareholders
1,802 -338 -1,565
LKAB INTERIM REPORT Q1/2017 11 LKAB – GROUP |
LKAB – GROUP
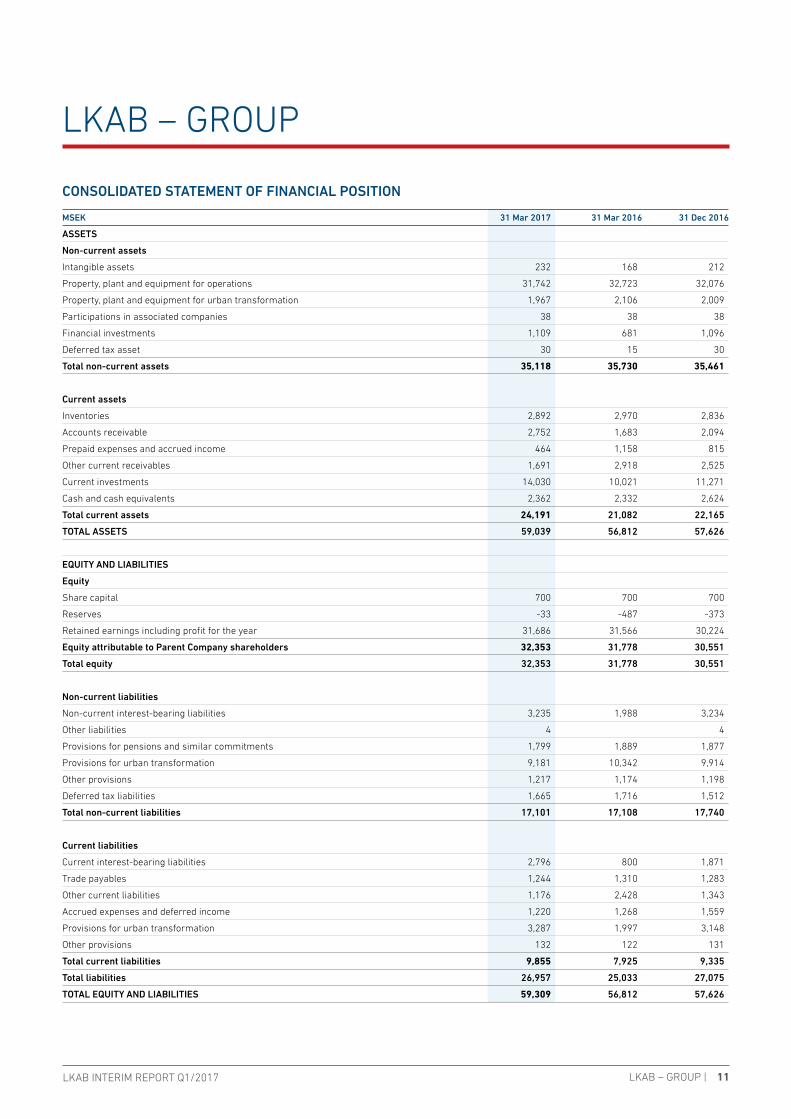
CONSOLIDATED STATEMENT OF FINANCIAL POSITION
MSEK 31 Mar 2017 31 Mar 2016 31 Dec 2016
ASSETS
Non-current assets
Intangible assets 232 168 212
Property, plant and equipment for operations 31,742 32,723 32,076
Property, plant and equipment for urban transformation 1,967 2,106 2,009
Participations in associated companies 38 38 38
Financial investments 1,109 681 1,096
Deferred tax asset 30 15 30
Total non-current assets 35,118 35,730 35,461
Current assets
Inventories 2,892 2,970 2,836
Accounts receivable 2,752 1,683 2,094
Prepaid expenses and accrued income 464 1,158 815
Other current receivables 1,691 2,918 2,525
Current investments 14,030 10,021 11,271
Cash and cash equivalents 2,362 2,332 2,624
Total current assets 24,191 21,082 22,165
TOTAL ASSETS 59,039 56,812 57,626
EQUITY AND LIABILITIES
Equity
Share capital 700 700 700
Reserves -33 -487 -373
Retained earnings including profit for the year 31,686 31,566 30,224
Equity attributable to Parent Company shareholders 32,353 31,778 30,551
Total equity 32,353 31,778 30,551
Non-current liabilities
Non-current interest-bearing liabilities 3,235 1,988 3,234
Other liabilities 4 4
Provisions for pensions and similar commitments 1,799 1,889 1,877
Provisions for urban transformation 9,181 10,342 9,914
Other provisions 1,217 1,174 1,198
Deferred tax liabilities 1,665 1,716 1,512
Total non-current liabilities 17,101 17,108 17,740
Current liabilities
Current interest-bearing liabilities 2,796 800 1,871
Trade payables 1,244 1,310 1,283
Other current liabilities 1,176 2,428 1,343
Accrued expenses and deferred income 1,220 1,268 1,559
Provisions for urban transformation 3,287 1,997 3,148
Other provisions 132 122 131
Total current liabilities 9,855 7,925 9,335
Total liabilities 26,957 25,033 27,075
TOTAL EQUITY AND LIABILITIES 59,309 56,812 57,626

LKAB INTERIM REPORT Q1/2017 12 LKAB – GROUP |
LKAB – GROUP
CONSOLIDATED STATEMENT OF CHANGES IN EQUITY
EQUITY ATTRIBUTABLE TO PARENT COMPANY SHAREHOLDERS
Reserves
MSEK Share capitalTranslation
reserveFair value
reserveHedging reserve
Retained earnings
including profit for the year Total equity
Opening equity 1 Jan 2016 700 -150 197 105 31,264 32,116
Loss for the year -978 -978
Other comprehensive income for the year 67 345 -937 -62 -587
Comprehensive income for the year 67 345 -937 -1,040 -1,565
Dividend
Closing equity 31 Dec 2016 700 -83 542 -832 30,224 30,551
EQUITY ATTRIBUTABLE TO PARENT COMPANY SHAREHOLDERS
Reserves
MSEK Share capitalTranslation
reserveFair value
reserveHedging reserve
Profit brought forward
including profit for the year Total equity
Opening equity 1 Jan 2017 700 -83 542 -832 30,224 30,551
Profit/loss for the period 1,424 1,424
Other comprehensive income for the period -33 17 356 38 378
Comprehensive income for the period -33 17 356 1,462 1,802
Dividend
Closing equity 31 Mar 2017 700 -116 559 -476 31,686 32,353
LKAB INTERIM REPORT Q1/2017 13 LKAB – GROUP |
LKAB – GROUP
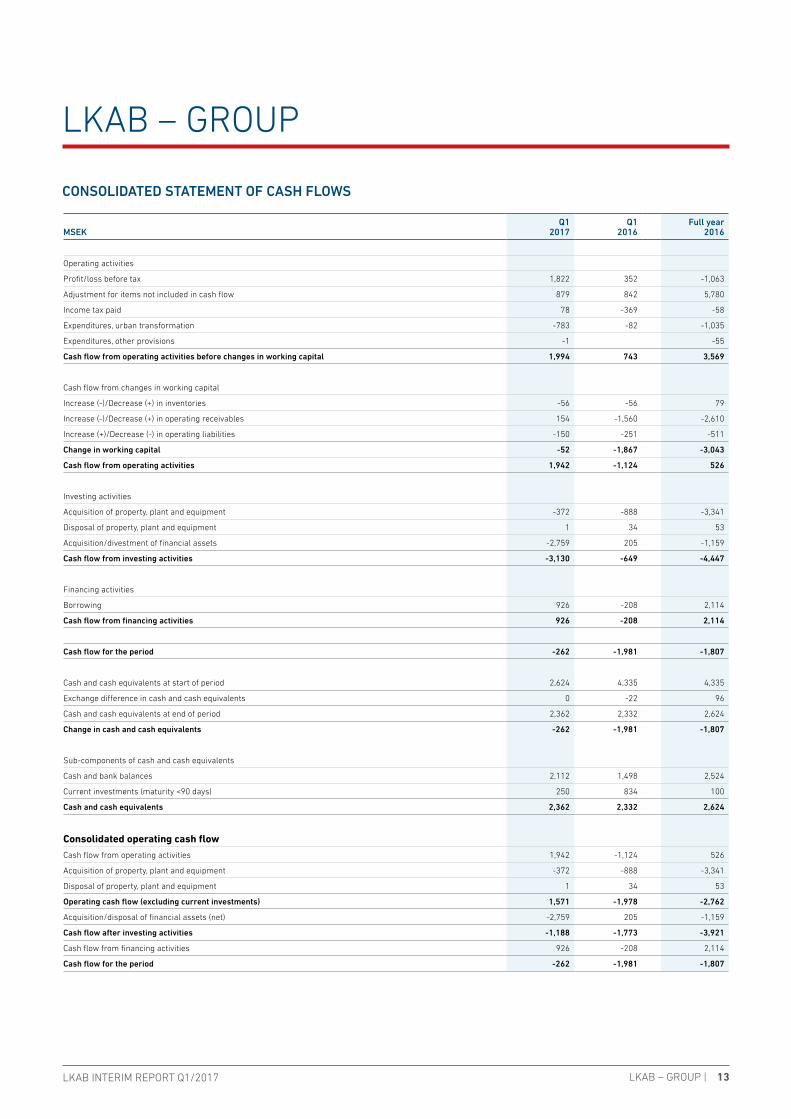
CONSOLIDATED STATEMENT OF CASH FLOWS
MSEKQ1
2017Q1
2016Full year
2016
Operating activities
Profit/loss before tax 1,822 352 -1,063
Adjustment for items not included in cash flow 879 842 5,780
Income tax paid 78 -369 -58
Expenditures, urban transformation -783 -82 -1,035
Expenditures, other provisions -1 -55
Cash flow from operating activities before changes in working capital 1,994 743 3,569
Cash flow from changes in working capital
Increase (-)/Decrease (+) in inventories -56 -56 79
Increase (-)/Decrease (+) in operating receivables 154 -1,560 -2,610
Increase (+)/Decrease (-) in operating liabilities -150 -251 -511
Change in working capital -52 -1,867 -3,043
Cash flow from operating activities 1,942 -1,124 526
Investing activities
Acquisition of property, plant and equipment -372 -888 -3,341
Disposal of property, plant and equipment 1 34 53
Acquisition/divestment of financial assets -2,759 205 -1,159
Cash flow from investing activities -3,130 -649 -4,447
Financing activities
Borrowing 926 -208 2,114
Cash flow from financing activities 926 -208 2,114
Cash flow for the period -262 -1,981 -1,807
Cash and cash equivalents at start of period 2,624 4,335 4,335
Exchange difference in cash and cash equivalents 0 -22 96
Cash and cash equivalents at end of period 2,362 2,332 2,624
Change in cash and cash equivalents -262 -1,981 -1,807
Sub-components of cash and cash equivalents
Cash and bank balances 2,112 1,498 2,524
Current investments (maturity <90 days) 250 834 100
Cash and cash equivalents 2,362 2,332 2,624
Consolidated operating cash flow
Cash flow from operating activities 1,942 -1,124 526
Acquisition of property, plant and equipment -372 -888 -3,341
Disposal of property, plant and equipment 1 34 53
Operating cash flow (excluding current investments) 1,571 -1,978 -2,762
Acquisition/disposal of financial assets (net) -2,759 205 -1,159
Cash flow after investing activities -1,188 -1,773 -3,921
Cash flow from financing activities 926 -208 2,114
Cash flow for the period -262 -1,981 -1,807
LKAB INTERIM REPORT Q1/2017 14
MSEKQ1
2017Q1
2016Full year
2016
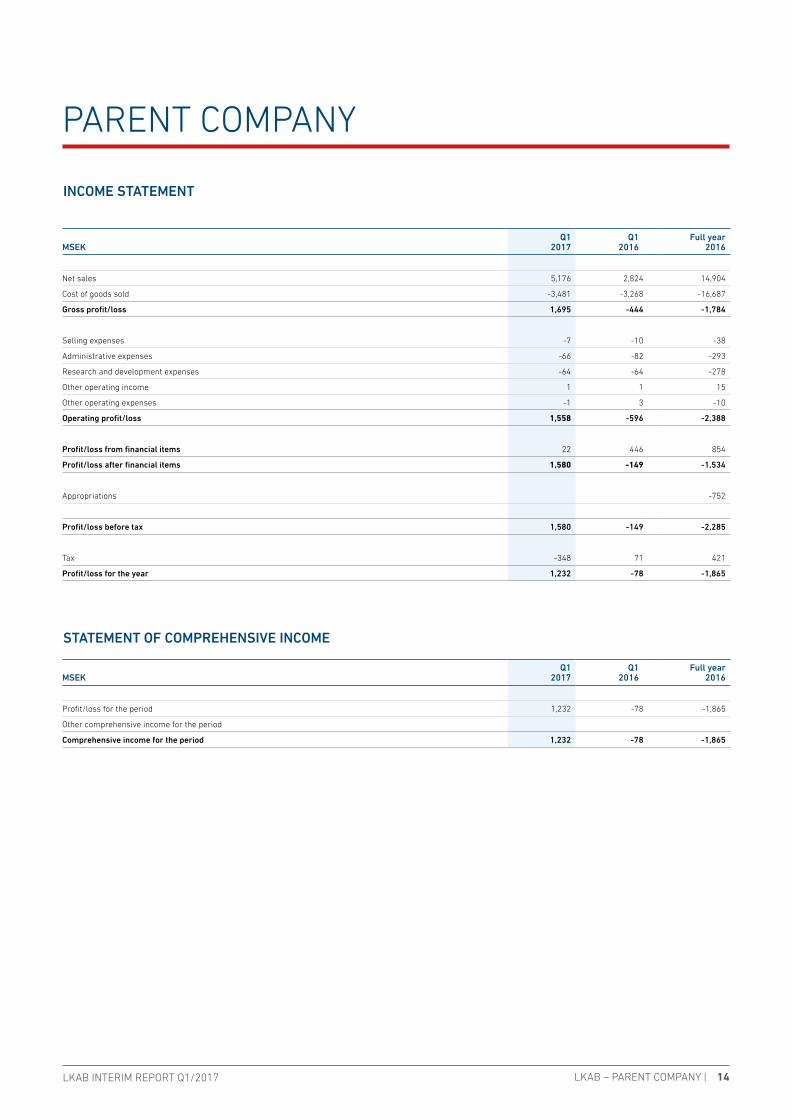
Profit/loss for the period 1,232 -78 -1,865
Other comprehensive income for the period
Comprehensive income for the period 1,232 -78 -1,865
LKAB – PARENT COMPANY |
PARENT COMPANY
INCOME STATEMENT
STATEMENT OF COMPREHENSIVE INCOME
MSEKQ1
2017Q1
2016Full year
2016
Net sales 5,176 2,824 14,904
Cost of goods sold -3,481 -3,268 -16,687
Gross profit/loss 1,695 -444 -1,784
Selling expenses -7 -10 -38
Administrative expenses -66 -82 -293
Research and development expenses -64 -64 -278
Other operating income 1 1 15
Other operating expenses -1 3 -10
Operating profit/loss 1,558 -596 -2,388
Profit/loss from financial items 22 446 854
Profit/loss after financial items 1,580 -149 -1,534
Appropriations -752
Profit/loss before tax 1,580 -149 -2,285
Tax -348 71 421
Profit/loss for the year 1,232 -78 -1,865
LKAB INTERIM REPORT Q1/2017 15 LKAB – PARENT COMPANY |
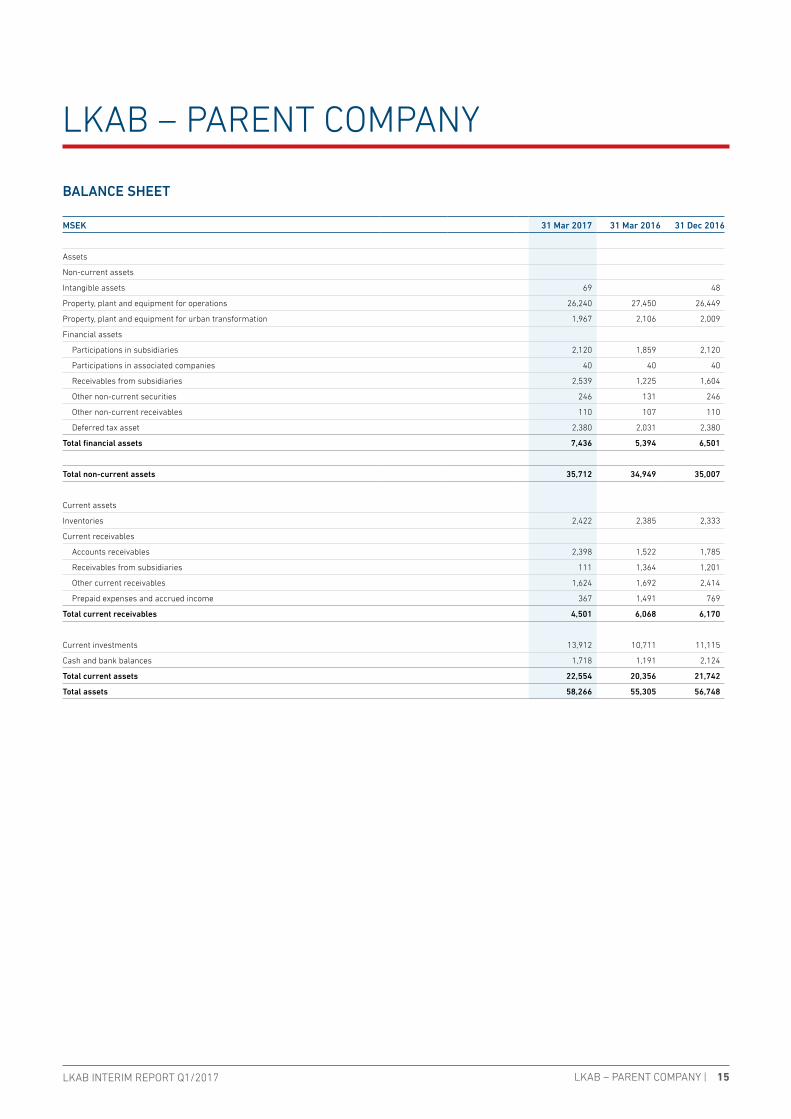
LKAB – PARENT COMPANY
BALANCE SHEET
MSEK 31 Mar 2017 31 Mar 2016 31 Dec 2016
Assets
Non-current assets
Intangible assets 69 48
Property, plant and equipment for operations 26,240 27,450 26,449
Property, plant and equipment for urban transformation 1,967 2,106 2,009
Financial assets
Participations in subsidiaries 2,120 1,859 2,120
Participations in associated companies 40 40 40
Receivables from subsidiaries 2,539 1,225 1,604
Other non-current securities 246 131 246
Other non-current receivables 110 107 110
Deferred tax asset 2,380 2,031 2,380
Total financial assets 7,436 5,394 6,501
Total non-current assets 35,712 34,949 35,007
Current assets
Inventories 2,422 2,385 2,333
Current receivables
Accounts receivables 2,398 1,522 1,785
Receivables from subsidiaries 111 1,364 1,201
Other current receivables 1,624 1,692 2,414
Prepaid expenses and accrued income 367 1,491 769
Total current receivables 4,501 6,068 6,170
Current investments 13,912 10,711 11,115
Cash and bank balances 1,718 1,191 2,124
Total current assets 22,554 20,356 21,742
Total assets 58,266 55,305 56,748
LKAB INTERIM REPORT Q1/2017 16 LKAB – PARENT COMPANY |
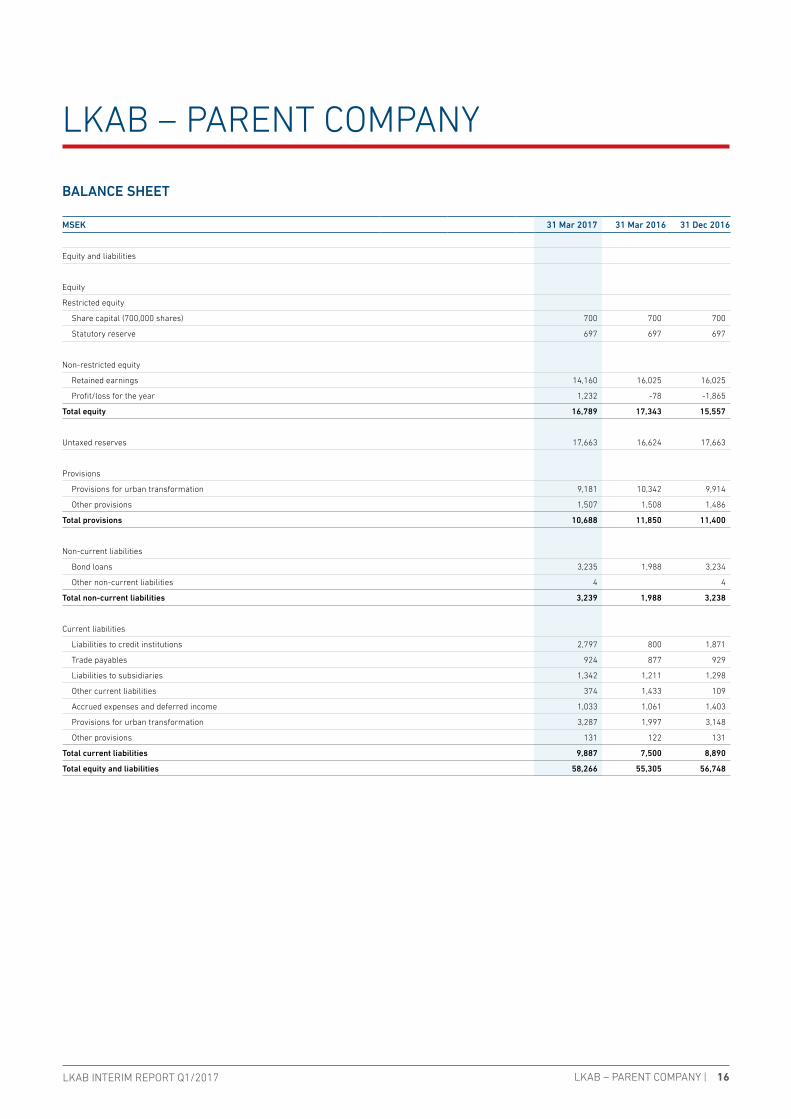
LKAB – PARENT COMPANY
BALANCE SHEET
MSEK 31 Mar 2017 31 Mar 2016 31 Dec 2016
Equity and liabilities
Equity
Restricted equity
Share capital (700,000 shares) 700 700 700
Statutory reserve 697 697 697
Non-restricted equity
Retained earnings 14,160 16,025 16,025
Profit/loss for the year 1,232 -78 -1,865
Total equity 16,789 17,343 15,557
Untaxed reserves 17,663 16,624 17,663
Provisions
Provisions for urban transformation 9,181 10,342 9,914
Other provisions 1,507 1,508 1,486
Total provisions 10,688 11,850 11,400
Non-current liabilities
Bond loans 3,235 1,988 3,234
Other non-current liabilities 4 4
Total non-current liabilities 3,239 1,988 3,238
Current liabilities
Liabilities to credit institutions 2,797 800 1,871
Trade payables 924 877 929
Liabilities to subsidiaries 1,342 1,211 1,298
Other current liabilities 374 1,433 109
Accrued expenses and deferred income 1,033 1,061 1,403
Provisions for urban transformation 3,287 1,997 3,148
Other provisions 131 122 131
Total current liabilities 9,887 7,500 8,890
Total equity and liabilities 58,266 55,305 56,748

LKAB INTERIM REPORT Q1/2017 17 NOTES |
NOTES
NOTE 1 Accounting principles This interim report was prepared in accordance with IAS 34, Interim Financial Reporting, and applicable regulations in the Annual Accounts Act. Disclosures in accordance with IAS 34 are provided both in notes and elsewhere in the interim report. The interim report for the Parent Company was prepared in accordance with Chapter 9 of the Annual Accounts Act, Interim Reporting.
All amounts in this interim report are presented in SEK millions (MSEK) unless otherwise indicated. Rounding differences may occur.
The accounting principles applied in this interim report conform with the ac-counting principles applied in the preparation of the 2016 Annual Report. New and amended standards and interpretations from the IASB have had no impact on consolidated earnings, financial position or formulation of the interim report. With effect from the first quarter 2017 LKAB Berg och Betong AB, LKAB Mekaniska AB and LKAB Kimit AB are being reported in the Special Products Division, rather than under Other Segments as in 2016. Earlier periods have been restated in accord-ance with the change.
NOTE 2 Risks and uncertainties LKAB is exposed to various risks. Risk management plays a vital part in minimiz-ing the impact of factors that lie beyond the Group’s control. The Group employs methods for evaluating and limiting these risks by ensuring that they are managed according to approved guidelines and methods.
LKAB works actively to identify, analyze and control how various types of risks affect the business and how LKAB can best avoid or confront them. Effective risk management is a business-critical success factor.
Major risks are LKAB’s access to land for the mining operations, volume de-pendency, the price of iron ore products and transaction exposure in USD.
For further information concerning risks, please refer to LKAB’s 2016 Annual Report.
NOTE 3 Significant assumptions and estimates The preparation of financial statements requires management and the Board of Directors to make assessments and assumptions that affect recognized assets, liabilities, income and expenses and other information provided, such as contingent liabilities. For further information concerning these, please refer to LKAB’s 2016 Annual Report.
NOTE 4 Events after the end of the reporting period There are no significant events after the end of the reporting period to report.
NOTE 5 Transactions with related parties No transactions that have significantly affected the company’s financial position and earnings took place between LKAB and related parties.
NOTE 6 Disclosures regarding financial instruments The table below shows the financial instruments measured at fair value in the statement of financial position. Group, 31 Mar 2017
(MSEK) Level 1 Level 2 Level 3 Total
Shares, financial assets 755 755
Shares, current holdings 3,918 3,918
Interest-bearing instruments 10,112 10,112
Cash and cash equivalents (short-term invest-ments with maturities under three months) 250 250
Derivatives -500 -165 -665
Total 255 14,115 14,370 Group, 31 Dec 2016
(MSEK) Level 1 Level 2 Level 3 Total
Shares, financial assets 738 738
Shares, current holdings 3,496 3,496
Interest-bearing instruments 7,775 7,775
Cash and cash equivalents (short-term invest-ments with maturities under three months)
100
100
Derivatives -911 -189 -1,100
Total -173 11,182 11,009
Fair value calculationThe following summarizes the methods and assumptions mainly used in deter-mining the fair value of financial instruments reported in the table above.
Level 1Quoted prices (unadjusted) on active markets for identical assets or liabilities.
Level 2Inputs other than quoted market prices included within Level 1 that are observa-ble for the asset or liability, either directly (i.e. as prices) or indirectly (i.e. derived from prices).
Level 3Inputs for the asset or liability that are not based on observable market data (unobservable inputs).
Interest-bearing instrumentsThe value of interest-bearing instruments is calculated using data from the inter-est-bearing securities market, obtained from Bloomberg.
Shares and alternative investmentsThe value of these investments is calculated using data from the stock market or received directly from brokers.
DerivativesThe fair values of derivative contracts are calculated using official quotations obtained from Bloomberg.
No transfers have been made between Levels 1 and 2.
Fair value of other receivables and liabilitiesThe carrying amount of other receivables and liabilities is estimated to be a reasonable approximation of fair value.
LKAB INTERIM REPORT Q1/2017 18 NOTES |
NOTES
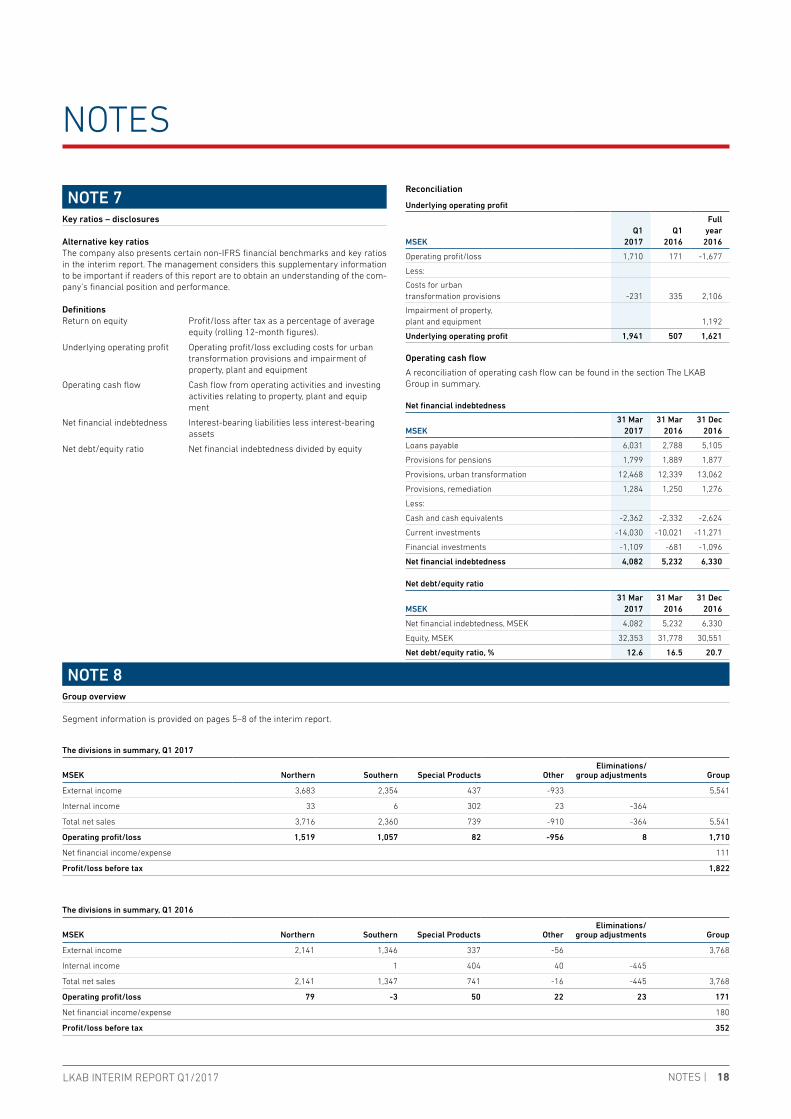
NOTE 7 Key ratios – disclosures Alternative key ratiosThe company also presents certain non-IFRS financial benchmarks and key ratios in the interim report. The management considers this supplementary information to be important if readers of this report are to obtain an understanding of the com-pany’s financial position and performance.
DefinitionsReturn on equity Profit/loss after tax as a percentage of average equity (rolling 12-month figures).
Underlying operating profit Operating profit/loss excluding costs for urban transformation provisions and impairment of property, plant and equipment
Operating cash flow Cash flow from operating activities and investing activities relating to property, plant and equip ment
Net financial indebtedness Interest-bearing liabilities less interest-bearing assets
Net debt/equity ratio Net financial indebtedness divided by equity
NOTE 8 Group overview Segment information is provided on pages 5–8 of the interim report.
The divisions in summary, Q1 2017
MSEK Northern Southern Special Products OtherEliminations/
group adjustments Group
External income 3,683 2,354 437 -933 5,541
Internal income 33 6 302 23 -364
Total net sales 3,716 2,360 739 -910 -364 5,541
Operating profit/loss 1,519 1,057 82 -956 8 1,710
Net financial income/expense 111
Profit/loss before tax 1,822
The divisions in summary, Q1 2016
MSEK Northern Southern Special Products OtherEliminations/
group adjustments Group
External income 2,141 1,346 337 -56 3,768
Internal income 1 404 40 -445
Total net sales 2,141 1,347 741 -16 -445 3,768
Operating profit/loss 79 -3 50 22 23 171
Net financial income/expense 180
Profit/loss before tax 352
Reconciliation
Underlying operating profit
MSEKQ1
2017Q1
2016
Full year
2016
Operating profit/loss 1,710 171 -1,677
Less:
Costs for urban transformation provisions -231 335 2,106
Impairment of property, plant and equipment 1,192
Underlying operating profit 1,941 507 1,621
Operating cash flow
A reconciliation of operating cash flow can be found in the section The LKAB Group in summary.
Net financial indebtedness
MSEK31 Mar
201731 Mar
201631 Dec
2016
Loans payable 6,031 2,788 5,105
Provisions for pensions 1,799 1,889 1,877
Provisions, urban transformation 12,468 12,339 13,062
Provisions, remediation 1,284 1,250 1,276
Less:
Cash and cash equivalents -2,362 -2,332 -2,624
Current investments -14,030 -10,021 -11,271
Financial investments -1,109 -681 -1,096
Net financial indebtedness 4,082 5,232 6,330
Net debt/equity ratio
MSEK31 Mar
201731 Mar
201631 Dec
2016
Net financial indebtedness, MSEK 4,082 5,232 6,330
Equity, MSEK 32,353 31,778 30,551
Net debt/equity ratio, % 12.6 16.5 20.7

LKAB INTERIM REPORT Q1/2017 19 NOTES |
NOTE 10 Quarterly data for the Group The table below shows the performance of the LKAB Group by quarter.
Quarterly data LKAB Group
MSEK NoteQ1
2017Q4
2016Q3
2016Q2
2016Q1
2016Q4
2015Q3
2015Q2
2015
Net sales 5,541 4,517 4,258 3,800 3,768 4,252 4,203 3,567
Underlying operating profit 1,941 527 762 -174 507 128 798 23
Costs for urban transformation provisions -231 -1,179 -489 -103 -335 -479 -613 -251
Impairment of property, plant and equipment -1,192 -7,136
Operating profit/loss 1,710 -1,844 273 -277 171 -351 -6,951 -228
Net financial income/expense 111 -34 359 108 180 156 -313 -320
Profit/loss before tax 1,822 -1,878 632 -169 352 -195 -7,264 -548
Operating cash flow 1,571 -356 214 -644 -1,978 -736 -417 -1,488
Investments in property, plant and equipment 372 756 673 1,024 888 1,793 1,369 1,595
Deliveries of iron ore products, Mt 6.6 6.8 7.2 6.7 6.3 6.8 6.2 5.3
Proportion of pellets, % 86 84 84 83 86 82 83 84
Production of iron ore products, Mt 7.2 7.1 6.8 6.1 6.9 6.7 5.9 5.8
Return on equity 0.4 neg 1.2 neg neg neg neg neg
Net debt/equity ratio 12.6 20.7 17.2 17.6 16.5 10.0 7.0 3.7
NOTES
NOTE 9 Pledged assets and contingent liabilities
Pledged assets
MSEK31 Mar
201731 Mar
201631 Dec
2016
As pledged assets forown liabilities and provisions
Company-owned endowment insurance 110 107 110
Deposit of cash and cash equivalents 121 121 121
Collateral provided, derivatives 883 773 1,465
Pledged assets, bonds 1,996 103 1,071
Total pledged assets 3,110 1,104 2,767
Contingent liabilities
MSEK31 Mar
201731 Mar
201631 Dec
2016
Guarantees, FPG/PRI 15 14 14
Guarantees, GP plan 4 5 5
Guarantees, Swedish Tax Agency 115 76 76
Surety given for subsidiaries 32 45 49
Collateral, remediation 65 79 72
Total contingent liabilities 231 219 216

LKAB INTERIM REPORT Q1/2017 20 LKAB IN BRIEF |
EUROPELKAB is the EU’s largest
iron ore producer and mines around 78 percent of all iron
ore within the EU 2LKAB is the world’s
second largest supplier of iron ore pellets
SINCE 1890LKAB is one of Sweden’s
oldest industrial companies and has customer
relationships dating back more than a century
84%of LKAB’s revenue comes
from pellet sales
LKAB is organized into 3 divisions
4,224Total number of
employees in the Group
Luleå
Ore Railway
Malmberget
SvappavaaraKiruna
Narvik
LKAB IN BRIEF
NORTHERN DIVISION Kiruna
SOUTHERN DIVISION Malmberget and Svappavaara
SPECIAL PRODUCTS DIVISION LKAB Minerals, LKAB Wassara
and LKAB Berg & Betong
ARCTIC CIRCLE