Embed Size (px)
Citation preview
H1 Group adjusted EBITDA of €1.8 billion // Outstanding energy trading performance // RWE raises 2021 earnings forecast: expected Group adjusted EBITDA between €3.0 billion and €3.4 billion // First RWE green bond successfully issued
Interim report on the first half of 2021
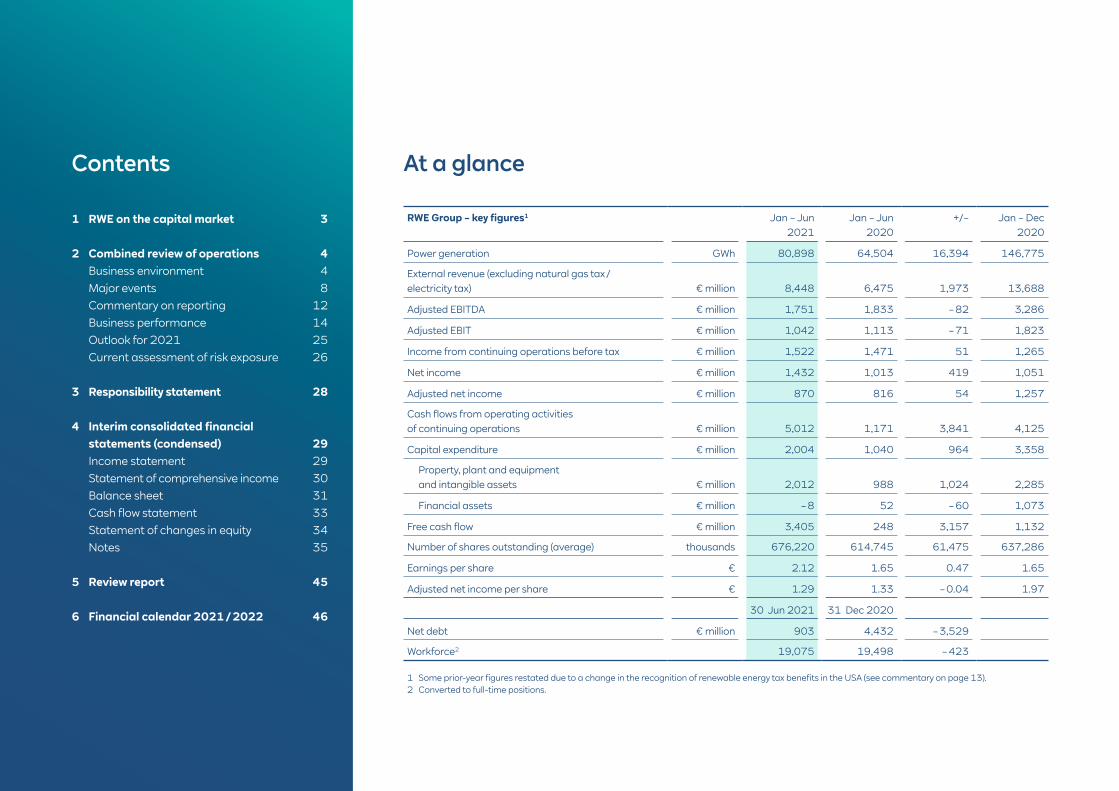
At a glance
1 Some prior-year figures restated due to a change in the recognition of renewable energy tax benefits in the USA (see commentary on page 13).2 Converted to full-time positions.
Contents
1 RWE on the capital market 3
2 Combined review of operations 4 Business environment 4 Major events 8 Commentary on reporting 12 Business performance 14 Outlook for 2021 25 Current assessment of risk exposure 26
3 Responsibility statement 28
4 Interim consolidated financial statements (condensed) 29 Income statement 29
Statement of comprehensive income 30 Balance sheet 31 Cash flow statement 33 Statement of changes in equity 34 Notes 35 5 Review report 45
6 Financial calendar 2021 / 2022 46
RWE Group – key figures1 Jan – Jun 2021
Jan – Jun 2020
+/– Jan – Dec 2020
Power generation GWh 80,898 64,504 16,394 146,775
External revenue (excluding natural gas tax / electricity tax) € million 8,448 6,475 1,973 13,688
Adjusted EBITDA € million 1,751 1,833 – 82 3,286
Adjusted EBIT € million 1,042 1,113 – 71 1,823
Income from continuing operations before tax € million 1,522 1,471 51 1,265
Net income € million 1,432 1,013 419 1,051
Adjusted net income € million 870 816 54 1,257
Cash flows from operating activities of continuing operations € million 5,012 1,171 3,841 4,125
Capital expenditure € million 2,004 1,040 964 3,358
Property, plant and equipment and intangible assets € million 2,012 988 1,024 2,285
Financial assets € million – 8 52 – 60 1,073
Free cash flow € million 3,405 248 3,157 1,132
Number of shares outstanding (average) thousands 676,220 614,745 61,475 637,286
Earnings per share € 2.12 1.65 0.47 1.65
Adjusted net income per share € 1.29 1.33 – 0.04 1.97
30 Jun 2021 31 Dec 2020
Net debt € million 903 4,432 – 3,529
Workforce2 19,075 19,498 – 423
RWE on the capital market
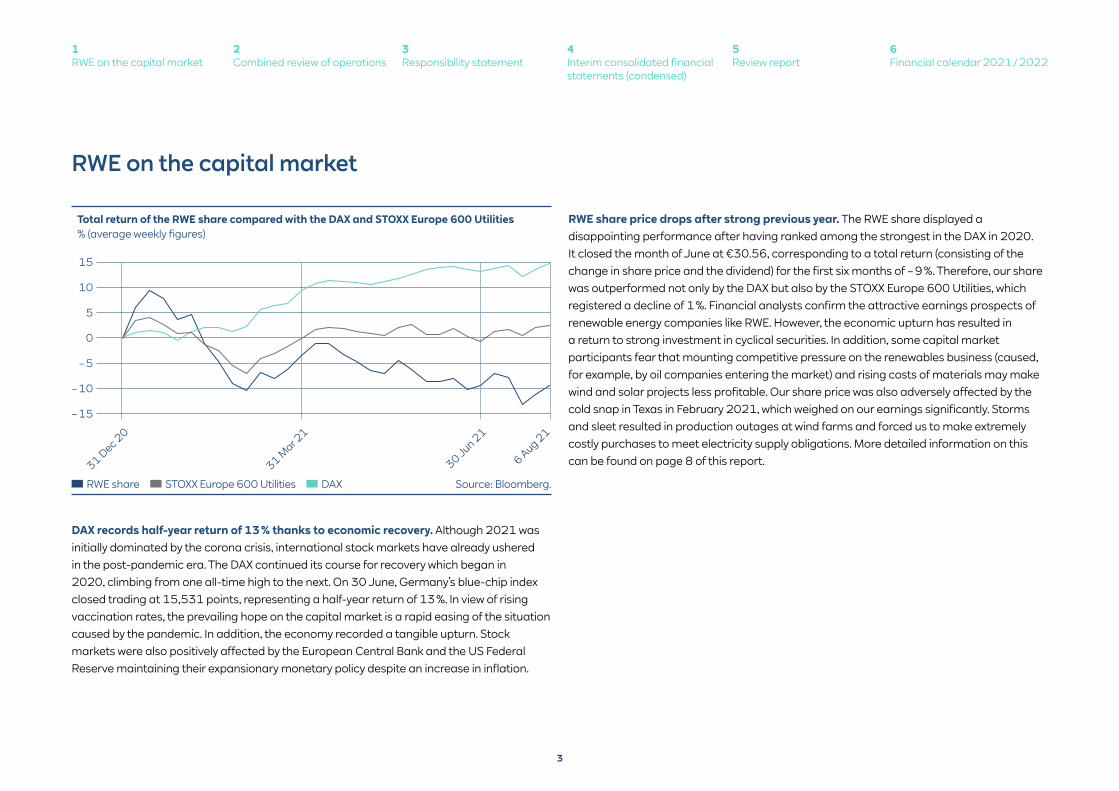
RWE share price drops after strong previous year. The RWE share displayed a disappointing performance after having ranked among the strongest in the DAX in 2020. It closed the month of June at €30.56, corresponding to a total return (consisting of the change in share price and the dividend) for the first six months of – 9 %. Therefore, our share was outperformed not only by the DAX but also by the STOXX Europe 600 Utilities, which registered a decline of 1 %. Financial analysts confirm the attractive earnings prospects of renewable energy companies like RWE. However, the economic upturn has resulted in a return to strong investment in cyclical securities. In addition, some capital market participants fear that mounting competitive pressure on the renewables business (caused, for example, by oil companies entering the market) and rising costs of materials may make wind and solar projects less profitable. Our share price was also adversely affected by the cold snap in Texas in February 2021, which weighed on our earnings significantly. Storms and sleet resulted in production outages at wind farms and forced us to make extremely costly purchases to meet electricity supply obligations. More detailed information on this can be found on page 8 of this report.
DAX records half-year return of 13 % thanks to economic recovery. Although 2021 was initially dominated by the corona crisis, international stock markets have already ushered in the post-pandemic era. The DAX continued its course for recovery which began in 2020, climbing from one all-time high to the next. On 30 June, Germany’s blue-chip index closed trading at 15,531 points, representing a half-year return of 13 %. In view of rising vaccination rates, the prevailing hope on the capital market is a rapid easing of the situation caused by the pandemic. In addition, the economy recorded a tangible upturn. Stock markets were also positively affected by the European Central Bank and the US Federal Reserve maintaining their expansionary monetary policy despite an increase in inflation.
RWE share STOXX Europe 600 Utilities DAX
31 Dec 2
0
31 Mar 2
1
30 Jun 21
6 Aug 21
Total return of the RWE share compared with the DAX and STOXX Europe 600 Utilities% (average weekly figures)
Source: Bloomberg.
15
10
5
0
– 5
– 10
– 15
3
1RWE on the capital market
3Responsibility statement
2Combined review of operations
5Review report
4Interim consolidated financial statements (condensed)
6Financial calendar 2021 / 2022
Business environment
Regulatory framework
EU increases 2030 emission reduction target to 55 %. On 21 April 2021, the European Parliament and Council reached an agreement on the new EU Climate Protection Act, enshrining the goal of becoming climate neutral by 2050 in law. With the new Act, the institutions of the EU and its member states have committed to establishing the prerequisites for reducing greenhouse gas emissions to net zero by the middle of the century. In the past, there was no consensus, in particular regarding the emission reduction target for 2030. The Commission had suggested raising the bar from 40 % to 55 % compared to 1990. The Council also voted in favour, whereas the Parliament proposed a 60 % reduction. Following a series of trilogue talks, the representatives of the institutions formed a consensus on 55 %. It was also agreed that a 15-member expert committee be formed, referred to as the Climate Council, to determine a greenhouse gas budget as a basis for formulating an interim target for 2040. On 24 June, the Parliament approved the agreement reached by the trilogue. Formal acceptance from the Council came on 25 June, and the Act will probably enter into force in the autumn.
The European Commission specified the tools for achieving the climate target for 2030 in its ‘Fit for 55’ legislative package, which was presented on 14 July. It contains a series of proposals, e. g. for improving energy efficiency, reducing carbon dioxide emissions in the transportation, building and agricultural sectors, taxing energy products in line with climate targets, expanding natural carbon sinks, and social cushioning of climate protection costs. The objective is to accelerate the expansion of renewable energy to cover 40 % of the EU’s primary energy consumption by as early as 2030. The current target stands at 32 %. Furthermore, the Commission intends to reform the European Emissions Trading System (EU ETS). To this end, the number of emission allowances placed on the market is set to be reduced significantly. So far, the EU ETS has included companies from the energy, industrial and aviation sectors. A similar system is envisaged for transportation and heating.
Moreover, the Commission seeks to establish a Carbon Border Adjustment Mechanism (CBAM) ensuring that goods produced in the EU are not subjected to higher carbon pricing than imports. This will protect domestic companies from competitive disadvantages and disincentivise them from moving manufacturing to non-EU countries. The Fit for 55 package is currently the subject of a consultation among the EU member states and in the European Parliament, a process that might last several months. As with the Climate Protection Act, ratification of these laws requires the Council and Parliament to reach consensus.
New Climate Protection Act: Germany seeks to be climate neutral as early as 2045. On 24 June, the German Lower House of Parliament decided to introduce stricter provisions to the country’s Climate Protection Act. Clearance by the Upper House of Parliament was issued on the following day. Germany’s current goal is to become climate neutral by 2045, five years earlier than envisaged in the 2019 Climate Protection Act. By 2030, greenhouse gas emissions are to be reduced by 65 % compared to 1990, replacing the previous goal of 55 %. A reduction target for 2040 was established for the first time and set at 88 %. The Act specifies limits by branch of industry. The energy sector is forced to achieve the largest additional emission reductions, with its carbon dioxide emissions being capped at 108 million metric tons in 2030. The sector’s former emission budget was 175 million metric tons. It remains to be seen how the additional savings will be made. This issue must be addressed after the elections to the Lower House of Parliament on 26 September.
In amending the Act, the federal government reacted to a decision by the German Constitutional Court published at the end of April finding that the Climate Protection Act of 2019 was insufficient and demanding more specific rules for the period after 2030. The Court identified the risk of substantial emission reductions being shifted to future generations, placing too heavy a burden on them.
4
1RWE on the capital market
3Responsibility statement
2Combined review of operationsBusiness environment
5Review report
4Interim consolidated financial statements (condensed)
6Financial calendar 2021 / 2022
New law on German nuclear phaseout compensation passed. On 10 June, Germany’s Lower House of Parliament adopted the 18th amendment to the German Nuclear Energy Act. The new provisions determine how German nuclear power plant operators are compensated for the accelerated nuclear phaseout. This will result in RWE receiving a payment of €880 million from the state. The compensation rules replace the provisions of the 16th amendment to the Nuclear Energy Act dating back to 2018, which were declared null and void by the German Constitutional Court in September 2020. We have provided background information on this on page 39 of the 2020 Annual Report. The new law is scheduled to come into force on 31 October 2021. It will be flanked by a public law contract between the Federal Republic of Germany and the operator companies, which was approved by the Federal Cabinet and signed by the contracting parties at the end of March. We expect to receive the compensatory payment before the end of 2021. In the half-year financial statements, we have already recorded a corresponding receivable, which has a positive effect on the non-operating result, but is not considered in net debt.
UK launches national emissions trading system. The UK’s new scheme for trading CO2 emission allowances entered into force at the beginning of the year. The first 6.1 million certificates (UK Allowances – UKAs) were auctioned on 19 May, and at £44 (€ 51), the auction price was twice as high as the auction floor. A UKA confers the right to emit one metric ton of carbon dioxide. A series of further auctions was held every two weeks thereafter. The UK government intends to auction a total of about 83 million emission allowances for 2021 and has earmarked some 39 million UKAs for free allocation. The United Kingdom introduced its own emissions trading system due to its exit from the EU: the UK withdrew from the European Emissions Trading System at the end of 2020. So far, the two systems have not been linked, making it impossible to use EU Allowances (EUAs) in the UK and UKAs in the EU. Despite this, prices of EUAs and UKAs have not differed greatly from each other (see page 7). In addition to a number of renewable energy assets, our generation portfolio in the United Kingdom includes ten gas-fired power plants with a total capacity of 7.0 GW. Last year, the carbon dioxide emissions of these stations amounted to 9.1 million metric tons.
Netherlands limits coal usage in power plants. On 18 May, the Dutch Parliament passed an amendment to the country’s Coal Phaseout Act, which introduces further restrictions to coal utilisation in electricity generation. In early July, the Dutch Senate also voted to pass the amendment. Based on the amendment to the law, annual coal firing in power stations will be limited to 35 % of the theoretically possible level. The regulation will expire at the end of 2024. RWE operates two hard coal power plants in the Netherlands: Amer 9 and Eemshaven. As Amer 9 has 80 % biomass co-firing, the cap does not affect this station. By contrast, the Act restricts utilisation significantly at Eemshaven, where biomass only accounts for 15 % of the fuel used. Compensatory payments, the level and terms of which are yet to be decided, are envisaged to offset economic disadvantages. The Dutch Parliament is expected to address the matter in September. Only once the compensation rules enter into force will the 35 % cap become effective.
The first version of the Coal Phaseout Act entered into force in 2019. The law forbids us from using hard coal at Amer 9 and Eemshaven after 2024 and 2029, respectively. This provision is still in force. Unlike with the 35 % ceiling, no compensation is envisaged for the early exit from coal-fired generation. We accept the phaseout roadmap, but believe that it is unlawful not to remunerate companies for violating their ownership rights. We entered into a dialogue with policymakers, seeking compensation for our financial disadvantages. So far, this request has not been granted. We therefore initiated arbitration proceedings against the Netherlands under the Energy Charter Treaty in early 2021 before the International Centre for Settlement of Investment Disputes in Washington, USA.
5
1RWE on the capital market
3Responsibility statement
2Combined review of operationsBusiness environment
5Review report
4Interim consolidated financial statements (condensed)
6Financial calendar 2021 / 2022
Market environment
Strong economic growth in all RWE core markets. Following the significant economic downturn caused by COVID-19 last year, the world economy has embarked on a clear course for recovery. Based on estimates, global economic output in the first half of 2021 was 8 % higher than in the same period in 2020. The increase in the Eurozone probably amounted to about 6 %. Current data for Germany and the Netherlands, our two most important markets in the currency area, indicate a gain of roughly 3 %. The heavily service-oriented UK economy, which was especially hard hit by the coronavirus, posted 8 % growth. Dynamic development was also displayed by the USA, where gross domestic product rose by approximately 6 %.
German power consumption 5 % higher year on year. In the first six months of 2021, economic output drove up demand for energy. According to initial data from the German Association of Energy and Water Industries (BDEW), German electricity usage in the first half of the year was roughly 5 % up on the same period in 2020. Experts estimate growth of 2 % for the Netherlands, 3 % for the United Kingdom, and 4 % for the USA.
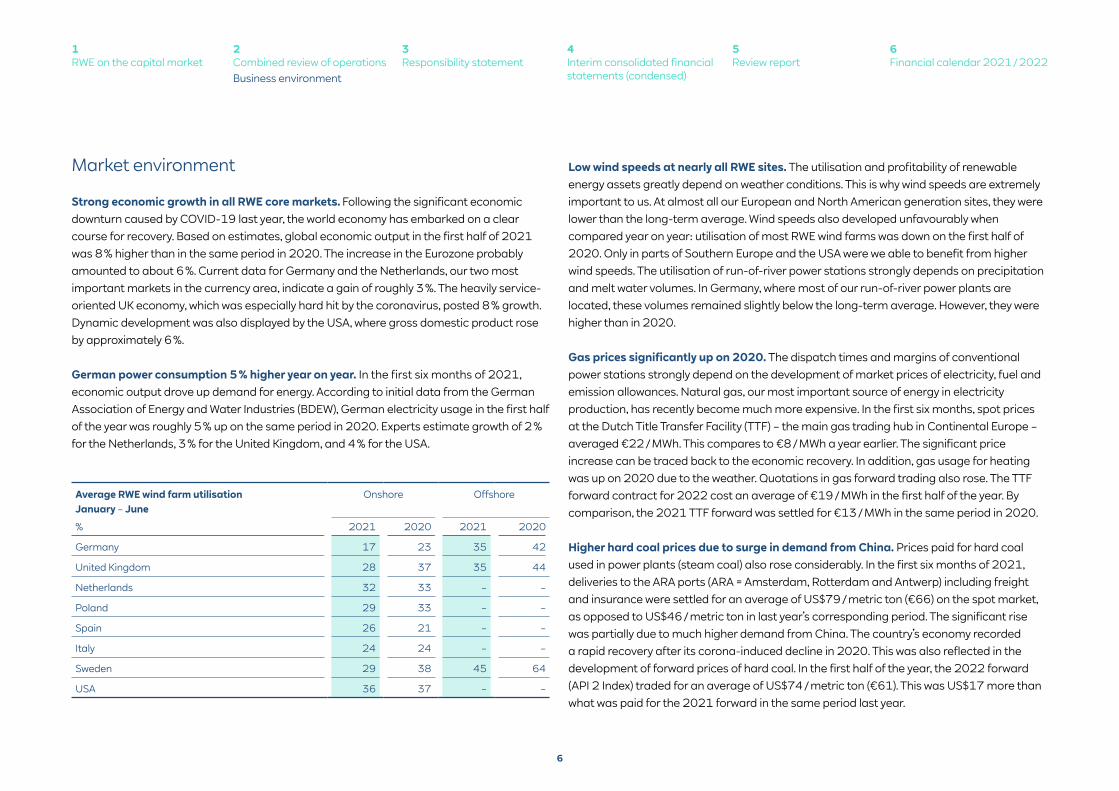
Low wind speeds at nearly all RWE sites. The utilisation and profitability of renewable energy assets greatly depend on weather conditions. This is why wind speeds are extremely important to us. At almost all our European and North American generation sites, they were lower than the long-term average. Wind speeds also developed unfavourably when compared year on year: utilisation of most RWE wind farms was down on the first half of 2020. Only in parts of Southern Europe and the USA were we able to benefit from higher wind speeds. The utilisation of run-of-river power stations strongly depends on precipitation and melt water volumes. In Germany, where most of our run-of-river power plants are located, these volumes remained slightly below the long-term average. However, they were higher than in 2020.
Gas prices significantly up on 2020. The dispatch times and margins of conventional power stations strongly depend on the development of market prices of electricity, fuel and emission allowances. Natural gas, our most important source of energy in electricity production, has recently become much more expensive. In the first six months, spot prices at the Dutch Title Transfer Facility (TTF) – the main gas trading hub in Continental Europe – averaged €22 / MWh. This compares to €8 / MWh a year earlier. The significant price increase can be traced back to the economic recovery. In addition, gas usage for heating was up on 2020 due to the weather. Quotations in gas forward trading also rose. The TTF forward contract for 2022 cost an average of €19 / MWh in the first half of the year. By comparison, the 2021 TTF forward was settled for €13 / MWh in the same period in 2020.
Higher hard coal prices due to surge in demand from China. Prices paid for hard coal used in power plants (steam coal) also rose considerably. In the first six months of 2021, deliveries to the ARA ports (ARA = Amsterdam, Rotterdam and Antwerp) including freight and insurance were settled for an average of US$79 / metric ton (€66) on the spot market, as opposed to US$46 / metric ton in last year’s corresponding period. The significant rise was partially due to much higher demand from China. The country’s economy recorded a rapid recovery after its corona-induced decline in 2020. This was also reflected in the development of forward prices of hard coal. In the first half of the year, the 2022 forward (API 2 Index) traded for an average of US$74 / metric ton (€61). This was US$17 more than what was paid for the 2021 forward in the same period last year.
Average RWE wind farm utilisation January – June
Onshore Offshore
% 2021 2020 2021 2020
Germany 17 23 35 42
United Kingdom 28 37 35 44
Netherlands 32 33 – –
Poland 29 33 – –
Spain 26 21 – –
Italy 24 24 – –
Sweden 29 38 45 64
USA 36 37 – –
6
1RWE on the capital market
3Responsibility statement
2Combined review of operationsBusiness environment
5Review report
4Interim consolidated financial statements (condensed)
6Financial calendar 2021 / 2022
CO2 emissions trading: more ambitious EU climate target drives up prices. A price factor of mounting importance for fossil fuel-fired power plants is the procurement of emission allowances. An EU Allowance (EUA), entitling the holder to emit one metric ton of carbon dioxide, was traded at an average of €44 in the first half of 2021, twice as much as in the same period last year. This figure is based on a contract for delivery that matures in December of the following year. After the price collapsed in March 2020, due to the corona crisis, EUAs were occasionally quoted below €16. Since then, EUAs have been on the rise: by the end of 2020, they hit an all-time high of €33, before jumping from one record to the next. As of the balance-sheet date (30 June), an EUA traded for €57. The rise in price was partly driven by the more ambitious European greenhouse gas reduction goal for 2030; to hit this target, the EU must sharply reduce the number of emission allowances offered to the market. Therefore, many participants in the EU Emissions Trading System (EU ETS) expect the supply of EUAs to become even tighter despite continued CO2 savings in sectors covered by the EU ETS.
As set out on page 5, the United Kingdom launched its own CO2 emissions trading system in 2021 as a result of Brexit. UK Allowances have been traded on the secondary market since the first auction in May. As of the balance-sheet date, quotations on that market averaged £48 (€55).
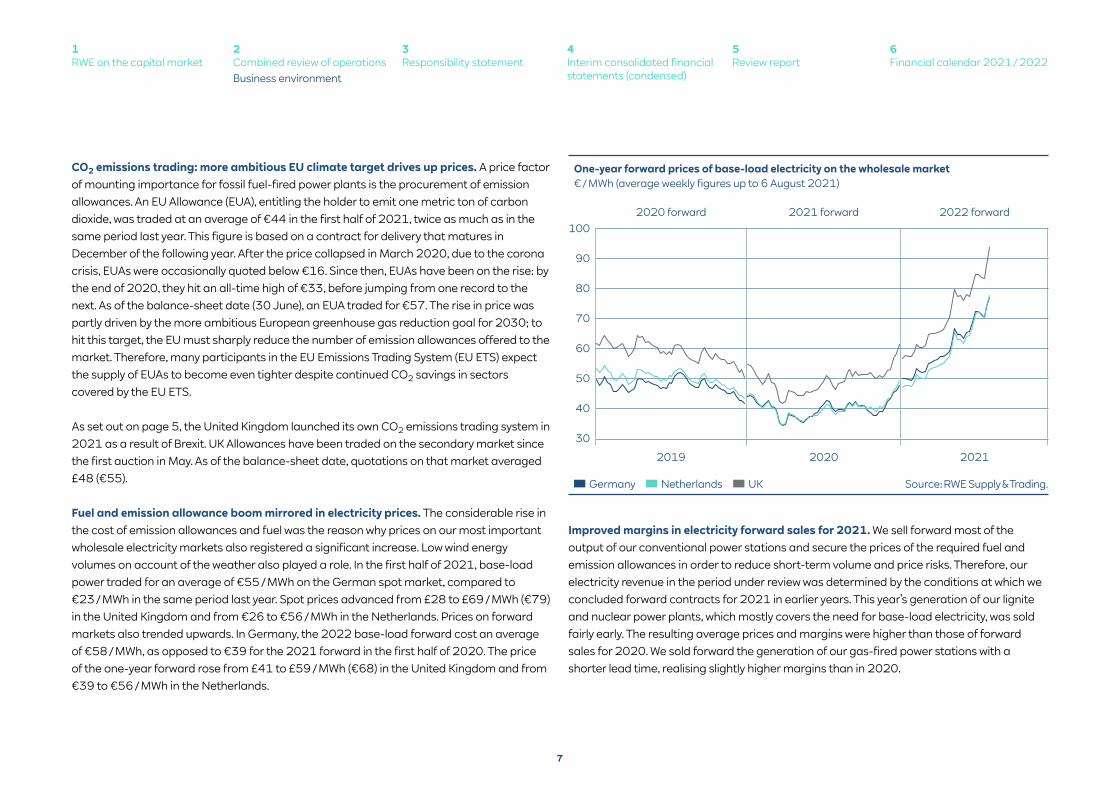
Fuel and emission allowance boom mirrored in electricity prices. The considerable rise in the cost of emission allowances and fuel was the reason why prices on our most important wholesale electricity markets also registered a significant increase. Low wind energy volumes on account of the weather also played a role. In the first half of 2021, base-load power traded for an average of €55 / MWh on the German spot market, compared to €23 / MWh in the same period last year. Spot prices advanced from £28 to £69 / MWh (€79) in the United Kingdom and from €26 to €56 / MWh in the Netherlands. Prices on forward markets also trended upwards. In Germany, the 2022 base-load forward cost an average of €58 / MWh, as opposed to €39 for the 2021 forward in the first half of 2020. The price of the one-year forward rose from £41 to £59 / MWh (€68) in the United Kingdom and from €39 to €56 / MWh in the Netherlands.
Improved margins in electricity forward sales for 2021. We sell forward most of the output of our conventional power stations and secure the prices of the required fuel and emission allowances in order to reduce short-term volume and price risks. Therefore, our electricity revenue in the period under review was determined by the conditions at which we concluded forward contracts for 2021 in earlier years. This year’s generation of our lignite and nuclear power plants, which mostly covers the need for base-load electricity, was sold fairly early. The resulting average prices and margins were higher than those of forward sales for 2020. We sold forward the generation of our gas-fired power stations with a shorter lead time, realising slightly higher margins than in 2020.
Germany Netherlands UK
2019 2020 2021
One-year forward prices of base-load electricity on the wholesale market€ / MWh (average weekly figures up to 6 August 2021)
Source: RWE Supply & Trading.
100
90
80
70
60
50
40
30
2020 forward 2021 forward 2022 forward
7
1RWE on the capital market
3Responsibility statement
2Combined review of operationsBusiness environment
5Review report
4Interim consolidated financial statements (condensed)
6Financial calendar 2021 / 2022
Major events
In the period under review
RWE wins rights to develop new offshore wind sites in the British North Sea. At an auction held in February 2021, RWE secured the rights to develop 3,000 MW of offshore wind capacity across two neighbouring locations in the UK North Sea. In return, we will pay an annual option fee of £82,552 / MW (plus inflation adjustment) until we make a final investment decision. The sites are situated on Dogger Bank in a shallow region of the North Sea. The 1,400 MW Sofia wind farm, which we decided to build in March, will also be located in the vicinity. First, all the new sites will be subjected to a plan-level Habitats Regulations Assessment. Given a positive result, we will start developing the project. Only then will we be obligated to pay the option fee. However, we have already paid an annual fee in advance. As soon as the necessary permits have been obtained, we can participate in an auction for a subsidy contract, after which we can make a final investment decision. Then the option fee will be replaced by a much lower lease payment. Subject to a timely connection to the grid, the new wind farms could be commissioned towards the end of the decade.
Development rights to a total of six offshore sites on which wind farms with a capacity of up to 7,980 MW can be built were auctioned by The Crown Estate. Some of the participants which also secured option rights submitted much higher bids than us. RWE will pay the lowest average annual option fee per megawatt among all successful bidders.
Stake in Rampion wind farm in the British North Sea increased to 50.1 %. As of 1 April, we acquired a 20 % interest in the UK Rampion offshore wind farm from E.ON. The purchase price was paid in December 2020. As a result of the transaction, we now own 50.1 % of the 400 MW wind farm and can fully consolidate it. Rampion is located off the coast of Sussex and has been operating commercially since 2018.
Go-ahead for construction of Sofia wind farm in the North Sea. In March 2021, RWE made the final investment decision to build the Sofia wind farm in the UK North Sea, one of the largest offshore wind projects in the world. We hold a 100 % stake in Sofia, which will be located 195 kilometres off the coast of North East England. It will consist of 100 turbines with a total installed capacity of 1,400 MW, capable of supplying green electricity to approximately 1.2 million homes in the UK. June saw the start of onshore construction, with offshore work scheduled to begin in 2023. According to current plans, Sofia could take its full capacity online by 2026. In 2019, we won a subsidy contract for electricity generated by the wind farm guaranteeing that we will receive £39.65 / MWh. This amount is based on the 2012 price level and will be subject to an upward adjustment for inflation. We anticipate investing about £3 billion in Sofia. This includes expenditure on the grid connection, which we will sell on completion to comply with competition law.
Considerable drop in earnings due to the worst cold snap in Texas in a century. In February 2021, an extreme cold front in parts of the USA caused substantial supply outages. Winter storms and sleet forced some RWE wind farms in Texas to go offline for several days. We had sold forward a portion of the generation of these assets and therefore had to buy electricity in order to meet our supply obligations. Due to the tight supply situation and statutory price regulations, we had to pay up to US$9,000 / MWh for these purchases. This curtailed earnings in the Onshore Wind / Solar segment by approximately €400 million.
8
1RWE on the capital market
3Responsibility statement
2Combined review of operationsMajor events
5Review report
4Interim consolidated financial statements (condensed)
6Financial calendar 2021 / 2022
Completion of Scioto Ridge onshore wind farm in the US. At the end of May, Scioto Ridge, our first onshore wind farm in the US state of Ohio, started operating commercially after about two-and-a-half years of construction. It consists of 75 turbines with a total capacity of 250 MW, enough to supply green electricity to more than 60,000 homes. We invested approximately €270 million in the project.
RWE sells stakes in three Texan wind farms. In January 2021, we divested shares in our Texan onshore wind farms Stella (201 MW), Cranell (220 MW) and East Raymond (200 MW). The buyers are a subsidiary of Canadian energy utility Algonquin Power & Utilities and UK investor Greencoat, which took interests of 51 % and 24 % in the wind farms. RWE remains the operator of the assets. As we only retain 25 % ownership of the wind farms, we stopped consolidating them fully and instead account for them using the equity method. The sale of the shareholdings was agreed at the end of 2020. As part of the transaction, we will also divest stakes of 51 % and 24 % in the West Raymond wind farm (240 MW). The sale had not been completed when this interim report was finalised.
Alliances to expand offshore wind forged. In May, we concluded two partnership agreements with multinational energy groups for the joint implementation of offshore wind projects. Our partner in the first alliance is National Grid Ventures, a subsidiary of UK electricity and gas network operator National Grid. Together, we will explore investment options in the USA. One of the envisaged joint projects is participation in the upcoming New York Bight seabed lease auction. National Grid is already active in the northeast of the USA as a network operator.
The objective of the second partnership, which we concluded with Norway-based Equinor and Hydro, is the development of a wind energy project in the Norwegian North Sea. The targeted area is Sørlige Nordsjø II, one of two areas classified for such purposes by the Norwegian Oil and Energy Ministry. Sørlige Nordsjø II neighbours Danish waters and has excellent wind conditions. The favourable site would enable the partners to sell electricity both within and outside of Norway.
RWE wins subsidy contract for Polish offshore wind farm. We have taken a major step forward in implementing our first wind energy project in the Polish Baltic Sea. In April, the government in Warsaw committed to subsidise our FEW Baltic II project. It is envisaged that the wind farm be built on the Słupsk sandbank and have a capacity of 350 MW. The Polish government established the legal framework for subsidising offshore wind power just recently, in January 2021. Wind farms with a total of 5.9 GW in generation capacity can qualify for regulated compensation in an initial phase. We were successful in doing so with FEW Baltic II. A decision on the level of the subsidy will be reached at a later date. The subsidies will be granted in the form of two-sided contracts for difference which guarantee that we receive a fixed payment per megawatt hour for the generation volume of 100,000 full load hours. If the market price is lower than this amount, the state pays the difference. If it is higher, the operators are obliged to make a payment. The subsidy period is limited to 25 years. The guaranteed payment is set administratively for projects in the first phase. Thereafter, auctions decide which projects qualify for contracts for difference and the amount of the subsidy. Tenders for up to 2.5 GW in generation capacity are planned for both 2025 and 2027.
Green light for the construction of two large battery storage systems in Germany. We will contribute to safeguarding security of supply in future with two high-capacity battery storage units at our power plant sites in Werne and Lingen. This decision was taken in June. The battery storage units have envisaged capacities of 79 MWh (Werne) and 49 MWh (Lingen) and are scheduled to go into operation as early as the end of 2022. We intend to invest some €50 million in total.
KELAG purchases RWE hydropower plants in France. Austrian energy utility KELAG acquired twelve French hydroelectric power stations from us, which have a total installed capacity of 45 MW. The transaction was concluded at the end of April. We signed the corresponding contract in December 2020. The agreement also includes KELAG buying several hydroelectric power plants and several wind turbines in Portugal from us. These assets have a combined capacity of 20 MW (RWE’s pro-rata share). They are scheduled to be transferred during this year. KELAG is a leading hydropower producer. We hold a 37.9 % stake in the company.
9
1RWE on the capital market
3Responsibility statement
2Combined review of operationsMajor events
5Review report
4Interim consolidated financial statements (condensed)
6Financial calendar 2021 / 2022
RWE successful in British capacity market auction for 2024 / 2025. At the beginning of March, RWE assets totalling 6,544 MW in secured generation capacity – primarily gas-fired power plants – qualified for a payment at a capacity market auction in Great Britain. The bidding process related to the period from 1 October 2024 to 30 September 2025. Stations with a total capacity of 40.8 GW won a contract. In the aforementioned period, these assets will be remunerated for being online and contributing to electricity supply. The capacity payment of £18.00 / kW (plus inflation adjustment), established in the bidding process, was the highest in a long time. The payments for the three preceding 12-month periods (October 2021 to September 2024) are £8.40, £6.44 and £15.97 (plus inflation adjustment).
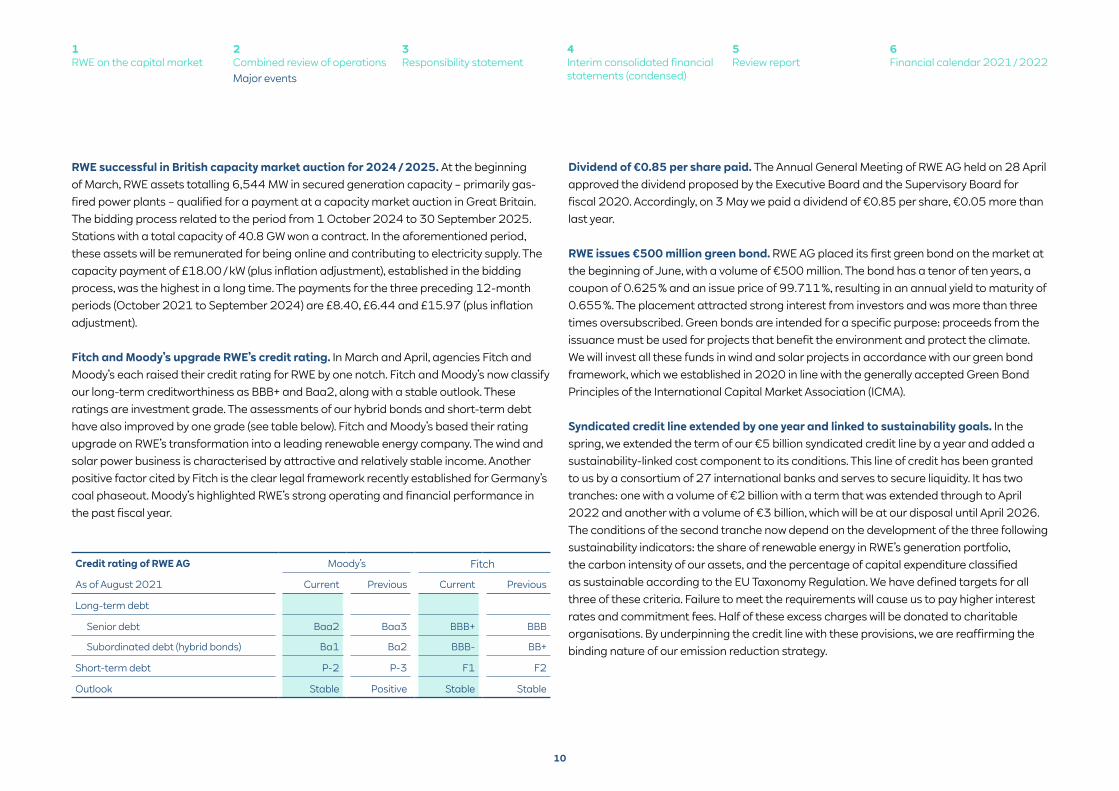
Fitch and Moody’s upgrade RWE’s credit rating. In March and April, agencies Fitch and Moody’s each raised their credit rating for RWE by one notch. Fitch and Moody’s now classify our long-term creditworthiness as BBB+ and Baa2, along with a stable outlook. These ratings are investment grade. The assessments of our hybrid bonds and short-term debt have also improved by one grade (see table below). Fitch and Moody’s based their rating upgrade on RWE’s transformation into a leading renewable energy company. The wind and solar power business is characterised by attractive and relatively stable income. Another positive factor cited by Fitch is the clear legal framework recently established for Germany’s coal phaseout. Moody’s highlighted RWE’s strong operating and financial performance in the past fiscal year.
Dividend of €0.85 per share paid. The Annual General Meeting of RWE AG held on 28 April approved the dividend proposed by the Executive Board and the Supervisory Board for fiscal 2020. Accordingly, on 3 May we paid a dividend of €0.85 per share, €0.05 more than last year.
RWE issues €500 million green bond. RWE AG placed its first green bond on the market at the beginning of June, with a volume of €500 million. The bond has a tenor of ten years, a coupon of 0.625 % and an issue price of 99.711 %, resulting in an annual yield to maturity of 0.655 %. The placement attracted strong interest from investors and was more than three times oversubscribed. Green bonds are intended for a specific purpose: proceeds from the issuance must be used for projects that benefit the environment and protect the climate. We will invest all these funds in wind and solar projects in accordance with our green bond framework, which we established in 2020 in line with the generally accepted Green Bond Principles of the International Capital Market Association (ICMA).
Syndicated credit line extended by one year and linked to sustainability goals. In the spring, we extended the term of our €5 billion syndicated credit line by a year and added a sustainability-linked cost component to its conditions. This line of credit has been granted to us by a consortium of 27 international banks and serves to secure liquidity. It has two tranches: one with a volume of €2 billion with a term that was extended through to April 2022 and another with a volume of €3 billion, which will be at our disposal until April 2026. The conditions of the second tranche now depend on the development of the three following sustainability indicators: the share of renewable energy in RWE’s generation portfolio, the carbon intensity of our assets, and the percentage of capital expenditure classified as sustainable according to the EU Taxonomy Regulation. We have defined targets for all three of these criteria. Failure to meet the requirements will cause us to pay higher interest rates and commitment fees. Half of these excess charges will be donated to charitable organisations. By underpinning the credit line with these provisions, we are reaffirming the binding nature of our emission reduction strategy.
Credit rating of RWE AG Moody’s Fitch
As of August 2021 Current Previous Current Previous
Long-term debt
Senior debt Baa2 Baa3 BBB+ BBB
Subordinated debt (hybrid bonds) Ba1 Ba2 BBB- BB+
Short-term debt P-2 P-3 F1 F2
Outlook Stable Positive Stable Stable
10
1RWE on the capital market
3Responsibility statement
2Combined review of operationsMajor events
5Review report
4Interim consolidated financial statements (condensed)
6Financial calendar 2021 / 2022
After the period under review
RWE sites affected by catastrophic floods in western Germany. In mid-July, severe weather events in parts of Germany led to disastrous floods resulting in a large number of fatalities and substantial damage to property. Rhineland-Palatinate and the south of North Rhine-Westphalia were the most devastated regions. The extreme weather also affected our company and its employees. In the Rhenish lignite mining area, water ingress at the Inden opencast mine brought production to a temporary halt, reducing generation at the Weisweiler power station, which is supplied by Inden. We are deeply saddened that an employee of a partner company was swept away by the current and could not be saved despite a major rescue operation. Southwest of Cologne, in Erftstadt-Blessem, the Erft river burst its banks, flooding a gravel pit operated by a subsidiary of RWE Power. Nearly all RWE-operated run-of-river power plants in the Eifel and on the Mosel, Saar and Ruhr rivers were forced to interrupt operations for several days due to the floodwater. We currently estimate the financial burdens resulting from production outages, mitigation and clean-up work and repairs will total up to a medium double-digit million euro amount. RWE initiated a €1 million emergency relief programme to help people directly affected by the floods.
Hard coal power stations at Hamm and Ibbenbüren permanently closed since July. At the beginning of July, our last German hard coal units, Westfalen E at Hamm (764 MW) and Ibbenbüren B (794 MW), were closed for good. Last year, we successfully participated in the first nationwide shutdown auction for hard coal-fired power plants. We will receive €216 million in compensation for their early decommissioning. This year, we were forbidden from selling electricity generated by these assets, but were obligated to keep them on standby to ensure security of supply. During this period, the Westfalen power plant went online 13 times at the request of the transmission system operator. The station is envisaged to continue to contribute to security of supply, albeit without using hard coal. As the German Network Agency has classified the power plant as system-relevant, we will convert the generator to a rotary phase shifter to produce reactive power to maintain voltage, an important element in stabilising the electricity grid. Conversely, Ibbenbüren B has been deemed to be not system-relevant and will be fully decommissioned.
11
1RWE on the capital market
3Responsibility statement
2Combined review of operationsMajor events
5Review report
4Interim consolidated financial statements (condensed)
6Financial calendar 2021 / 2022
Commentary on reporting
Group structure features five segments. In our financial reporting, we divide the RWE Group into the five following segments: (1) Offshore Wind, (2) Onshore Wind / Solar, (3) Hydro / Biomass / Gas, (4) Supply & Trading and (5) Coal / Nuclear. Segments (1) to (4) represent our core business. This is where we want to grow. In (5), we have pooled our German power generation from coal and nuclear fuel, which will lose importance due to exit roadmaps established by the state.
The individual segments comprise the following activities:
• Offshore Wind: Our business involving offshore wind power generation is subsumed here. It is overseen by our Group company RWE Renewables.
• Onshore Wind / Solar: This is where we pool our onshore wind and solar activities as well as parts of our battery storage business. Here again, operating responsibility lies with RWE Renewables.
• Hydro / Biomass / Gas: This segment encompasses our run-of-river, pumped storage, biomass and gas power stations. It also includes the Dutch Amer 9 and Eemshaven power plants, which run on hard coal and biomass, some battery storage systems as well as the project management and engineering consulting company RWE Technology International. These activities are overseen by the Group company RWE Generation, which has also been responsible for the design and implementation of RWE’s hydrogen strategy since the beginning of 2021. Our 37.9 % stake in Austrian energy utility KELAG is also assigned to this segment.
• Supply & Trading: This is where we report proprietary trading of energy commodities. The segment is managed by RWE Supply & Trading, which also acts as an intermediary for gas, supplies key accounts with energy, and undertakes a number of additional trading-related activities. Our German and Czech gas storage facilities also form part of this segment.
• Coal / Nuclear: Our German electricity generation from coal and nuclear fuel as well as our lignite production in the Rhenish mining region to the west of Cologne are subsumed in this segment. This is also where we report our investments in Dutch nuclear power plant operator EPZ (30 %) and Germany-based URANIT (50 %), which holds a 33 % stake in uranium enrichment specialist Urenco. The aforementioned activities and investments are mainly overseen by our Group company RWE Power, while RWE Generation is responsible for our two German hard coal-fired power stations, Westfalen E and Ibbenbüren B, which have been shut down.
Group companies with cross-segment tasks such as the corporate headquarters RWE AG are stated as part of the core business under ‘other, consolidation’. This also applies to our stakes of 25.1 % in German transmission system operator Amprion and 15 % in E.ON. However, the dividends we receive from E.ON are recognised in the financial result. Furthermore, ‘other, consolidation’ contains consolidation effects.
12
1RWE on the capital market
3Responsibility statement
2Combined review of operationsCommentary on reporting
5Review report
4Interim consolidated financial statements (condensed)
6Financial calendar 2021 / 2022
Changed recognition of tax benefits for renewable energy in the USA. At the start of this fiscal year, we changed the accounting treatment of tax benefits we receive for US wind and solar projects. As set out on page 37 of the 2020 Annual Report, renewable energy is subsidised via tax credits in the USA. Furthermore, plant operators can benefit from accelerated depreciation, referred to as tax benefits. Until 2020, we recognised them in taxes on income. By contrast, the advantages of tax credits are considered in other operating income. For the sake of consistency, we have now taken this approach for tax benefits as well. It has a positive impact on adjusted EBITDA. To ensure comparability, we restated the prior-year figures. More information on this issue can be found on pages 35 et seqq. in the Notes.
Forward-looking statements. This interim report contains forward-looking statements regarding the future development of the RWE Group and its companies as well as economic and political developments. These statements are assessments that we have made based on information available to us at the time this document was prepared. In the event that the underlying assumptions do not materialise or unforeseen risks arise, actual developments can deviate from the developments expected at present. Therefore, we cannot assume responsibility for the correctness of forward-looking statements.
13
1RWE on the capital market
3Responsibility statement
2Combined review of operationsCommentary on reporting
5Review report
4Interim consolidated financial statements (condensed)
6Financial calendar 2021 / 2022
Business performance
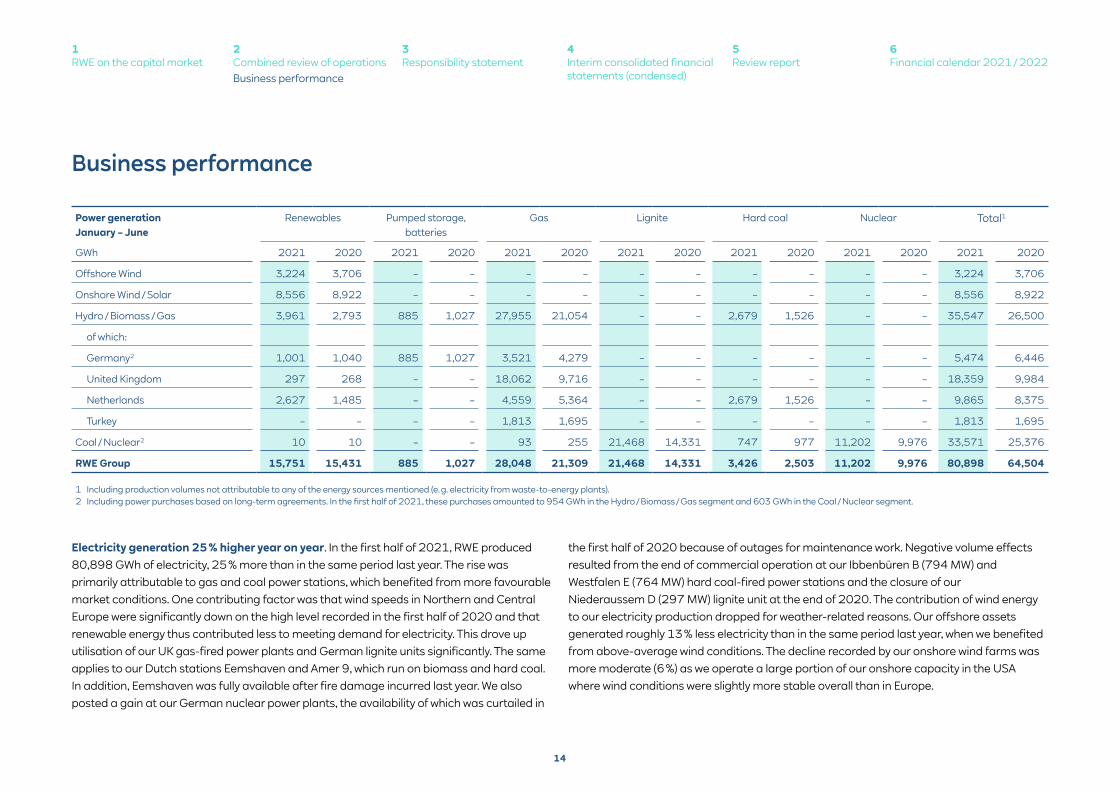
Electricity generation 25 % higher year on year. In the first half of 2021, RWE produced 80,898 GWh of electricity, 25 % more than in the same period last year. The rise was primarily attributable to gas and coal power stations, which benefited from more favourable market conditions. One contributing factor was that wind speeds in Northern and Central Europe were significantly down on the high level recorded in the first half of 2020 and that renewable energy thus contributed less to meeting demand for electricity. This drove up utilisation of our UK gas-fired power plants and German lignite units significantly. The same applies to our Dutch stations Eemshaven and Amer 9, which run on biomass and hard coal. In addition, Eemshaven was fully available after fire damage incurred last year. We also posted a gain at our German nuclear power plants, the availability of which was curtailed in
the first half of 2020 because of outages for maintenance work. Negative volume effects resulted from the end of commercial operation at our Ibbenbüren B (794 MW) and Westfalen E (764 MW) hard coal-fired power stations and the closure of our Niederaussem D (297 MW) lignite unit at the end of 2020. The contribution of wind energy to our electricity production dropped for weather-related reasons. Our offshore assets generated roughly 13 % less electricity than in the same period last year, when we benefited from above-average wind conditions. The decline recorded by our onshore wind farms was more moderate (6 %) as we operate a large portion of our onshore capacity in the USA where wind conditions were slightly more stable overall than in Europe.
1 Including production volumes not attributable to any of the energy sources mentioned (e. g. electricity from waste-to-energy plants).2 Including power purchases based on long-term agreements. In the first half of 2021, these purchases amounted to 954 GWh in the Hydro / Biomass / Gas segment and 603 GWh in the Coal / Nuclear segment.
Power generation January – June
Renewables Pumped storage, batteries
Gas Lignite Hard coal Nuclear Total1
GWh 2021 2020 2021 2020 2021 2020 2021 2020 2021 2020 2021 2020 2021 2020
Offshore Wind 3,224 3,706 – – – – – – – – – – 3,224 3,706
Onshore Wind / Solar 8,556 8,922 – – – – – – – – – – 8,556 8,922
Hydro / Biomass / Gas 3,961 2,793 885 1,027 27,955 21,054 – – 2,679 1,526 – – 35,547 26,500
of which:
Germany2 1,001 1,040 885 1,027 3,521 4,279 – – – – – – 5,474 6,446
United Kingdom 297 268 – – 18,062 9,716 – – – – – – 18,359 9,984
Netherlands 2,627 1,485 – – 4,559 5,364 – – 2,679 1,526 – – 9,865 8,375
Turkey – – – – 1,813 1,695 – – – – – – 1,813 1,695
Coal / Nuclear2 10 10 – – 93 255 21,468 14,331 747 977 11,202 9,976 33,571 25,376
RWE Group 15,751 15,431 885 1,027 28,048 21,309 21,468 14,331 3,426 2,503 11,202 9,976 80,898 64,504
14
1RWE on the capital market
3Responsibility statement
2Combined review of operationsBusiness performance
5Review report
4Interim consolidated financial statements (condensed)
6Financial calendar 2021 / 2022
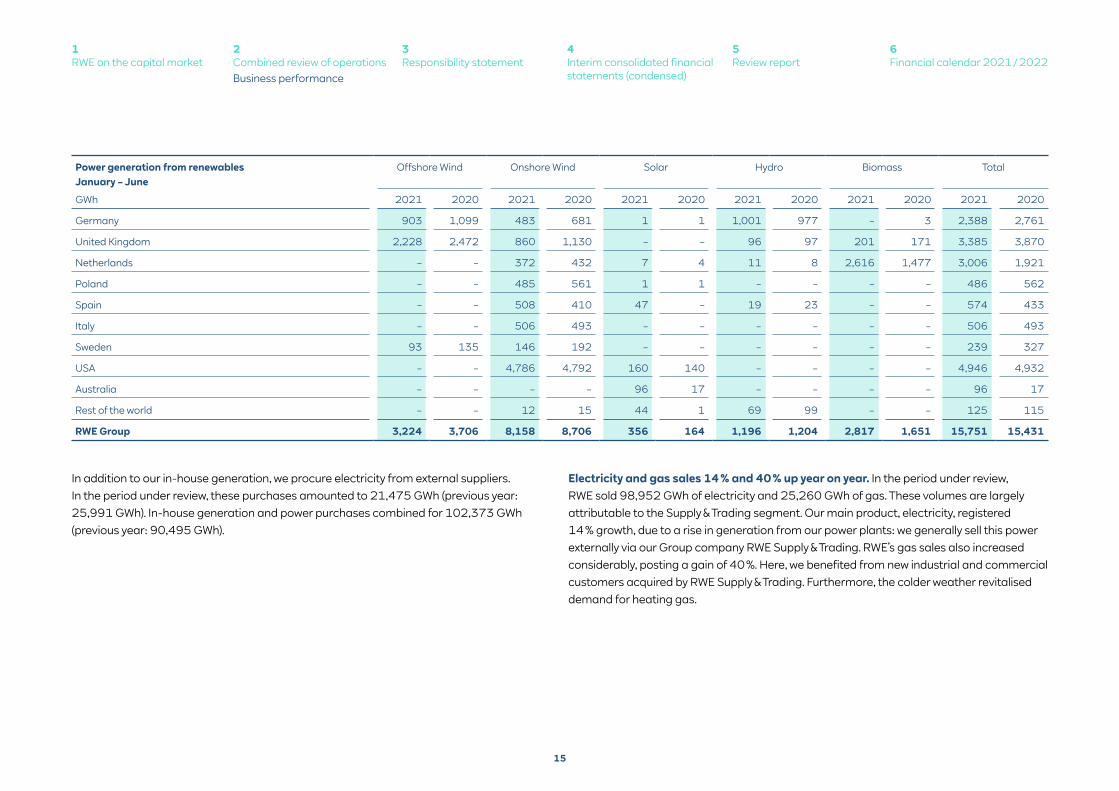
In addition to our in-house generation, we procure electricity from external suppliers. In the period under review, these purchases amounted to 21,475 GWh (previous year: 25,991 GWh). In-house generation and power purchases combined for 102,373 GWh (previous year: 90,495 GWh).
Electricity and gas sales 14 % and 40 % up year on year. In the period under review, RWE sold 98,952 GWh of electricity and 25,260 GWh of gas. These volumes are largely attributable to the Supply & Trading segment. Our main product, electricity, registered 14 % growth, due to a rise in generation from our power plants: we generally sell this power externally via our Group company RWE Supply & Trading. RWE’s gas sales also increased considerably, posting a gain of 40 %. Here, we benefited from new industrial and commercial customers acquired by RWE Supply & Trading. Furthermore, the colder weather revitalised demand for heating gas.
Power generation from renewables January – June
Offshore Wind Onshore Wind Solar Hydro Biomass Total
GWh 2021 2020 2021 2020 2021 2020 2021 2020 2021 2020 2021 2020
Germany 903 1,099 483 681 1 1 1,001 977 – 3 2,388 2,761
United Kingdom 2,228 2,472 860 1,130 – – 96 97 201 171 3,385 3,870
Netherlands – – 372 432 7 4 11 8 2,616 1,477 3,006 1,921
Poland – – 485 561 1 1 – – – – 486 562
Spain – – 508 410 47 – 19 23 – – 574 433
Italy – – 506 493 – – – – – – 506 493
Sweden 93 135 146 192 – – – – – – 239 327
USA – – 4,786 4,792 160 140 – – – – 4,946 4,932
Australia – – – – 96 17 – – – – 96 17
Rest of the world – – 12 15 44 1 69 99 – – 125 115
RWE Group 3,224 3,706 8,158 8,706 356 164 1,196 1,204 2,817 1,651 15,751 15,431
15
1RWE on the capital market
3Responsibility statement
2Combined review of operationsBusiness performance
5Review report
4Interim consolidated financial statements (condensed)
6Financial calendar 2021 / 2022
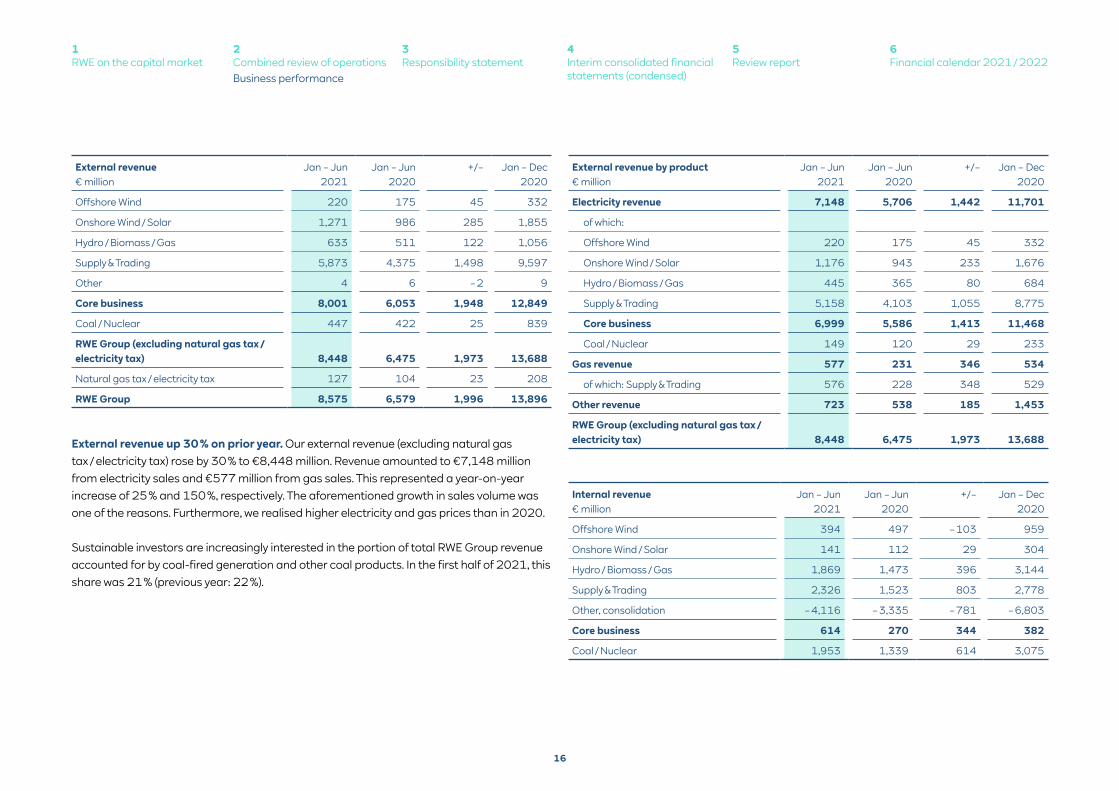
External revenue up 30 % on prior year. Our external revenue (excluding natural gas tax / electricity tax) rose by 30 % to €8,448 million. Revenue amounted to €7,148 million from electricity sales and €577 million from gas sales. This represented a year-on-year increase of 25 % and 150 %, respectively. The aforementioned growth in sales volume was one of the reasons. Furthermore, we realised higher electricity and gas prices than in 2020.
Sustainable investors are increasingly interested in the portion of total RWE Group revenue accounted for by coal-fired generation and other coal products. In the first half of 2021, this share was 21 % (previous year: 22 %).
External revenue€ million
Jan – Jun 2021
Jan – Jun 2020
+/– Jan – Dec 2020
Offshore Wind 220 175 45 332
Onshore Wind / Solar 1,271 986 285 1,855
Hydro / Biomass / Gas 633 511 122 1,056
Supply & Trading 5,873 4,375 1,498 9,597
Other 4 6 – 2 9
Core business 8,001 6,053 1,948 12,849
Coal / Nuclear 447 422 25 839
RWE Group (excluding natural gas tax / electricity tax) 8,448 6,475 1,973 13,688
Natural gas tax / electricity tax 127 104 23 208
RWE Group 8,575 6,579 1,996 13,896
External revenue by product€ million
Jan – Jun 2021
Jan – Jun 2020
+/– Jan – Dec 2020
Electricity revenue 7,148 5,706 1,442 11,701
of which:
Offshore Wind 220 175 45 332
Onshore Wind / Solar 1,176 943 233 1,676
Hydro / Biomass / Gas 445 365 80 684
Supply & Trading 5,158 4,103 1,055 8,775
Core business 6,999 5,586 1,413 11,468
Coal / Nuclear 149 120 29 233
Gas revenue 577 231 346 534
of which: Supply & Trading 576 228 348 529
Other revenue 723 538 185 1,453
RWE Group (excluding natural gas tax / electricity tax) 8,448 6,475 1,973 13,688
Internal revenue € million
Jan – Jun 2021
Jan – Jun 2020
+/– Jan – Dec 2020
Offshore Wind 394 497 – 103 959
Onshore Wind / Solar 141 112 29 304
Hydro / Biomass / Gas 1,869 1,473 396 3,144
Supply & Trading 2,326 1,523 803 2,778
Other, consolidation – 4,116 – 3,335 – 781 – 6,803
Core business 614 270 344 382
Coal / Nuclear 1,953 1,339 614 3,075
16
1RWE on the capital market
3Responsibility statement
2Combined review of operationsBusiness performance
5Review report
4Interim consolidated financial statements (condensed)
6Financial calendar 2021 / 2022
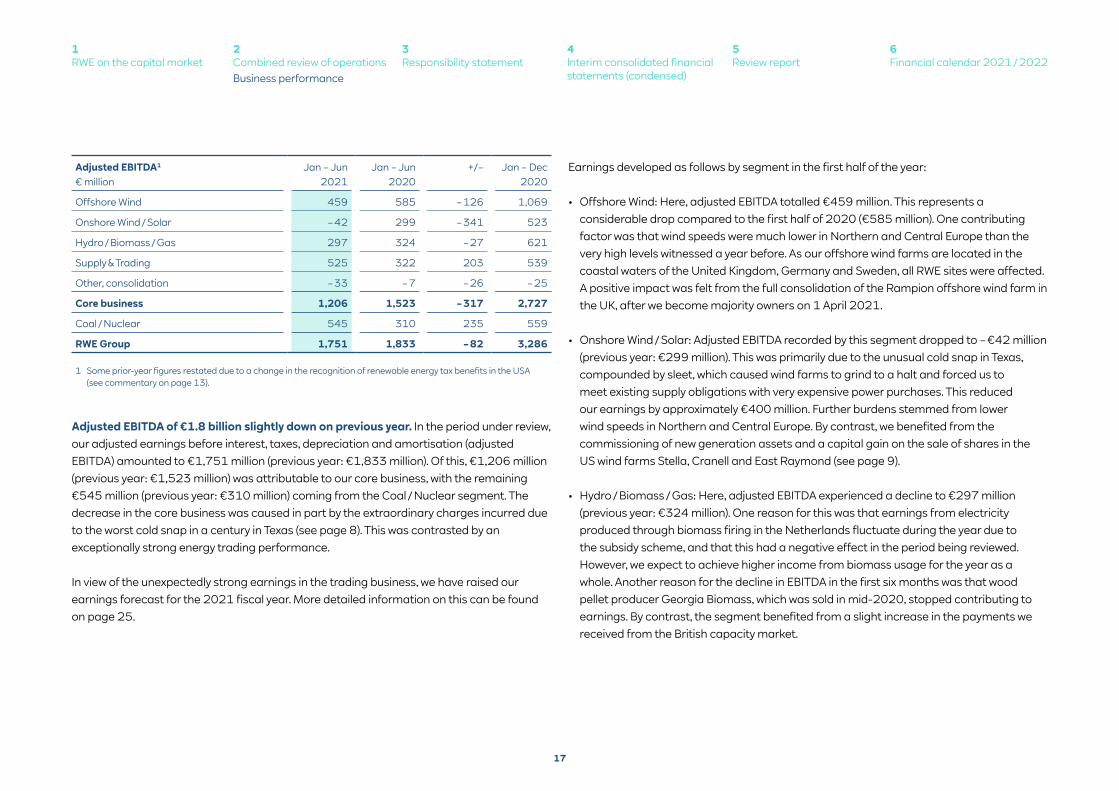
Adjusted EBITDA of €1.8 billion slightly down on previous year. In the period under review, our adjusted earnings before interest, taxes, depreciation and amortisation (adjusted EBITDA) amounted to €1,751 million (previous year: €1,833 million). Of this, €1,206 million (previous year: €1,523 million) was attributable to our core business, with the remaining €545 million (previous year: €310 million) coming from the Coal / Nuclear segment. The decrease in the core business was caused in part by the extraordinary charges incurred due to the worst cold snap in a century in Texas (see page 8). This was contrasted by an exceptionally strong energy trading performance.
In view of the unexpectedly strong earnings in the trading business, we have raised our earnings forecast for the 2021 fiscal year. More detailed information on this can be found on page 25.
Earnings developed as follows by segment in the first half of the year:
• Offshore Wind: Here, adjusted EBITDA totalled €459 million. This represents a considerable drop compared to the first half of 2020 (€585 million). One contributing factor was that wind speeds were much lower in Northern and Central Europe than the very high levels witnessed a year before. As our offshore wind farms are located in the coastal waters of the United Kingdom, Germany and Sweden, all RWE sites were affected. A positive impact was felt from the full consolidation of the Rampion offshore wind farm in the UK, after we become majority owners on 1 April 2021.
• Onshore Wind / Solar: Adjusted EBITDA recorded by this segment dropped to – €42 million (previous year: €299 million). This was primarily due to the unusual cold snap in Texas, compounded by sleet, which caused wind farms to grind to a halt and forced us to meet existing supply obligations with very expensive power purchases. This reduced our earnings by approximately €400 million. Further burdens stemmed from lower wind speeds in Northern and Central Europe. By contrast, we benefited from the commissioning of new generation assets and a capital gain on the sale of shares in the US wind farms Stella, Cranell and East Raymond (see page 9).
• Hydro / Biomass / Gas: Here, adjusted EBITDA experienced a decline to €297 million (previous year: €324 million). One reason for this was that earnings from electricity produced through biomass firing in the Netherlands fluctuate during the year due to the subsidy scheme, and that this had a negative effect in the period being reviewed. However, we expect to achieve higher income from biomass usage for the year as a whole. Another reason for the decline in EBITDA in the first six months was that wood pellet producer Georgia Biomass, which was sold in mid-2020, stopped contributing to earnings. By contrast, the segment benefited from a slight increase in the payments we received from the British capacity market.
1 Some prior-year figures restated due to a change in the recognition of renewable energy tax benefits in the USA (see commentary on page 13).
Adjusted EBITDA1 € million
Jan – Jun 2021
Jan – Jun 2020
+/– Jan – Dec 2020
Offshore Wind 459 585 – 126 1,069
Onshore Wind / Solar – 42 299 – 341 523
Hydro / Biomass / Gas 297 324 – 27 621
Supply & Trading 525 322 203 539
Other, consolidation – 33 – 7 – 26 – 25
Core business 1,206 1,523 – 317 2,727
Coal / Nuclear 545 310 235 559
RWE Group 1,751 1,833 – 82 3,286
17
1RWE on the capital market
3Responsibility statement
2Combined review of operationsBusiness performance
5Review report
4Interim consolidated financial statements (condensed)
6Financial calendar 2021 / 2022
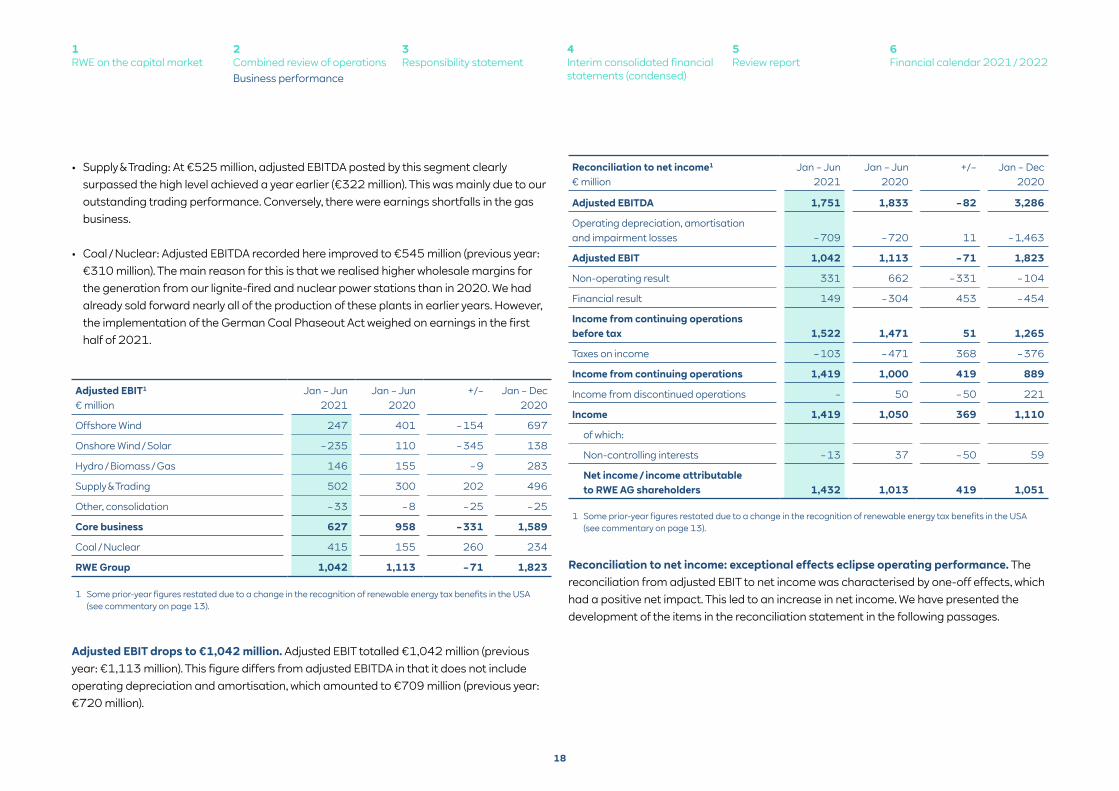
Adjusted EBIT drops to €1,042 million. Adjusted EBIT totalled €1,042 million (previous year: €1,113 million). This figure differs from adjusted EBITDA in that it does not include operating depreciation and amortisation, which amounted to €709 million (previous year: €720 million).
1 Some prior-year figures restated due to a change in the recognition of renewable energy tax benefits in the USA (see commentary on page 13).
1 Some prior-year figures restated due to a change in the recognition of renewable energy tax benefits in the USA (see commentary on page 13).
• Supply & Trading: At €525 million, adjusted EBITDA posted by this segment clearly surpassed the high level achieved a year earlier (€322 million). This was mainly due to our outstanding trading performance. Conversely, there were earnings shortfalls in the gas business.
• Coal / Nuclear: Adjusted EBITDA recorded here improved to €545 million (previous year: €310 million). The main reason for this is that we realised higher wholesale margins for the generation from our lignite-fired and nuclear power stations than in 2020. We had already sold forward nearly all of the production of these plants in earlier years. However, the implementation of the German Coal Phaseout Act weighed on earnings in the first half of 2021.
Reconciliation to net income: exceptional effects eclipse operating performance. The reconciliation from adjusted EBIT to net income was characterised by one-off effects, which had a positive net impact. This led to an increase in net income. We have presented the development of the items in the reconciliation statement in the following passages.
Adjusted EBIT1 € million
Jan – Jun 2021
Jan – Jun 2020
+/– Jan – Dec 2020
Offshore Wind 247 401 – 154 697
Onshore Wind / Solar – 235 110 – 345 138
Hydro / Biomass / Gas 146 155 – 9 283
Supply & Trading 502 300 202 496
Other, consolidation – 33 – 8 – 25 – 25
Core business 627 958 – 331 1,589
Coal / Nuclear 415 155 260 234
RWE Group 1,042 1,113 – 71 1,823
Reconciliation to net income1
€ millionJan – Jun
2021Jan – Jun
2020+/– Jan – Dec
2020
Adjusted EBITDA 1,751 1,833 – 82 3,286
Operating depreciation, amortisation and impairment losses – 709 – 720 11 – 1,463
Adjusted EBIT 1,042 1,113 – 71 1,823
Non-operating result 331 662 – 331 – 104
Financial result 149 – 304 453 – 454
Income from continuing operations before tax 1,522 1,471 51 1,265
Taxes on income – 103 – 471 368 – 376
Income from continuing operations 1,419 1,000 419 889
Income from discontinued operations – 50 – 50 221
Income 1,419 1,050 369 1,110
of which:
Non-controlling interests – 13 37 – 50 59
Net income / income attributable to RWE AG shareholders 1,432 1,013 419 1,051
18
1RWE on the capital market
3Responsibility statement
2Combined review of operationsBusiness performance
5Review report
4Interim consolidated financial statements (condensed)
6Financial calendar 2021 / 2022
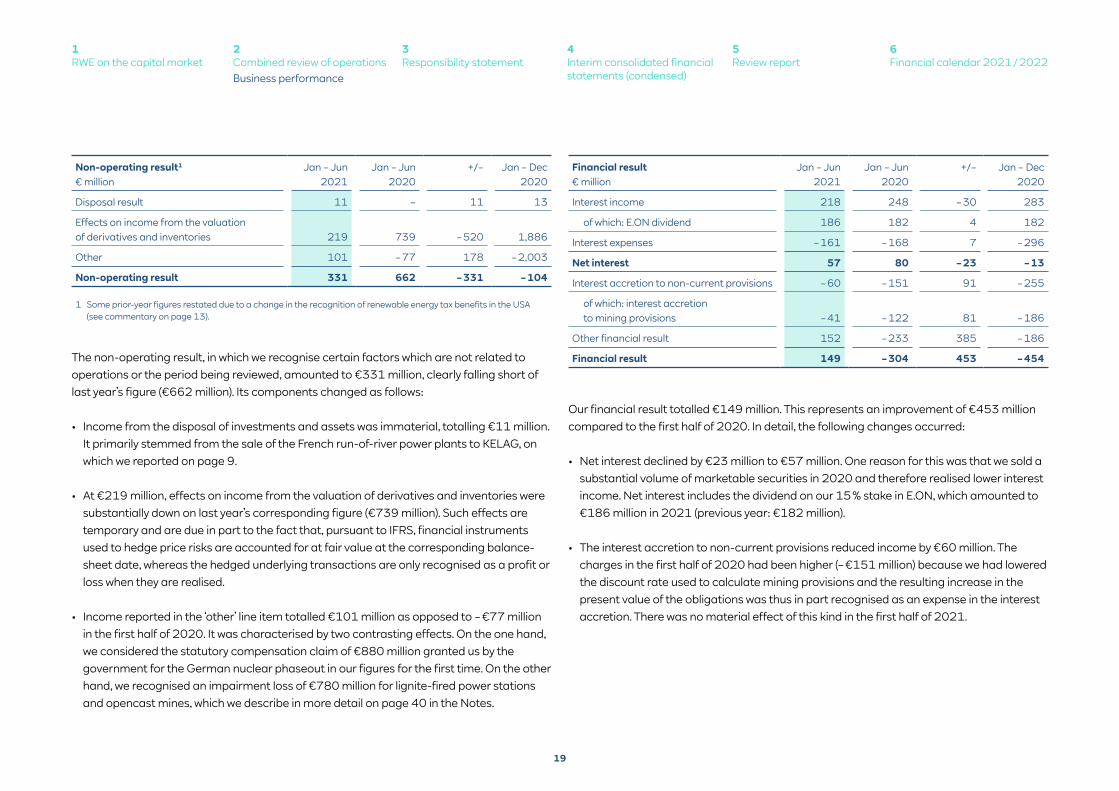
Our financial result totalled €149 million. This represents an improvement of €453 million compared to the first half of 2020. In detail, the following changes occurred:
• Net interest declined by €23 million to €57 million. One reason for this was that we sold a substantial volume of marketable securities in 2020 and therefore realised lower interest income. Net interest includes the dividend on our 15 % stake in E.ON, which amounted to €186 million in 2021 (previous year: €182 million).
• The interest accretion to non-current provisions reduced income by €60 million. The charges in the first half of 2020 had been higher (– €151 million) because we had lowered the discount rate used to calculate mining provisions and the resulting increase in the present value of the obligations was thus in part recognised as an expense in the interest accretion. There was no material effect of this kind in the first half of 2021.
1 Some prior-year figures restated due to a change in the recognition of renewable energy tax benefits in the USA (see commentary on page 13).
The non-operating result, in which we recognise certain factors which are not related to operations or the period being reviewed, amounted to €331 million, clearly falling short of last year’s figure (€662 million). Its components changed as follows:
• Income from the disposal of investments and assets was immaterial, totalling €11 million. It primarily stemmed from the sale of the French run-of-river power plants to KELAG, on which we reported on page 9.
• At €219 million, effects on income from the valuation of derivatives and inventories were substantially down on last year’s corresponding figure (€739 million). Such effects are temporary and are due in part to the fact that, pursuant to IFRS, financial instruments used to hedge price risks are accounted for at fair value at the corresponding balance-sheet date, whereas the hedged underlying transactions are only recognised as a profit or loss when they are realised.
• Income reported in the ‘other’ line item totalled €101 million as opposed to – €77 million in the first half of 2020. It was characterised by two contrasting effects. On the one hand, we considered the statutory compensation claim of €880 million granted us by the government for the German nuclear phaseout in our figures for the first time. On the other hand, we recognised an impairment loss of €780 million for lignite-fired power stations and opencast mines, which we describe in more detail on page 40 in the Notes.
Non-operating result1
€ millionJan – Jun
2021Jan – Jun
2020+/– Jan – Dec
2020
Disposal result 11 – 11 13
Effects on income from the valuation of derivatives and inventories 219 739 – 520 1,886
Other 101 – 77 178 – 2,003
Non-operating result 331 662 – 331 – 104
Financial result € million
Jan – Jun 2021
Jan – Jun 2020
+/– Jan – Dec 2020
Interest income 218 248 – 30 283
of which: E.ON dividend 186 182 4 182
Interest expenses – 161 – 168 7 – 296
Net interest 57 80 – 23 – 13
Interest accretion to non-current provisions – 60 – 151 91 – 255
of which: interest accretion to mining provisions – 41 – 122 81 – 186
Other financial result 152 – 233 385 – 186
Financial result 149 – 304 453 – 454
19
1RWE on the capital market
3Responsibility statement
2Combined review of operationsBusiness performance
5Review report
4Interim consolidated financial statements (condensed)
6Financial calendar 2021 / 2022
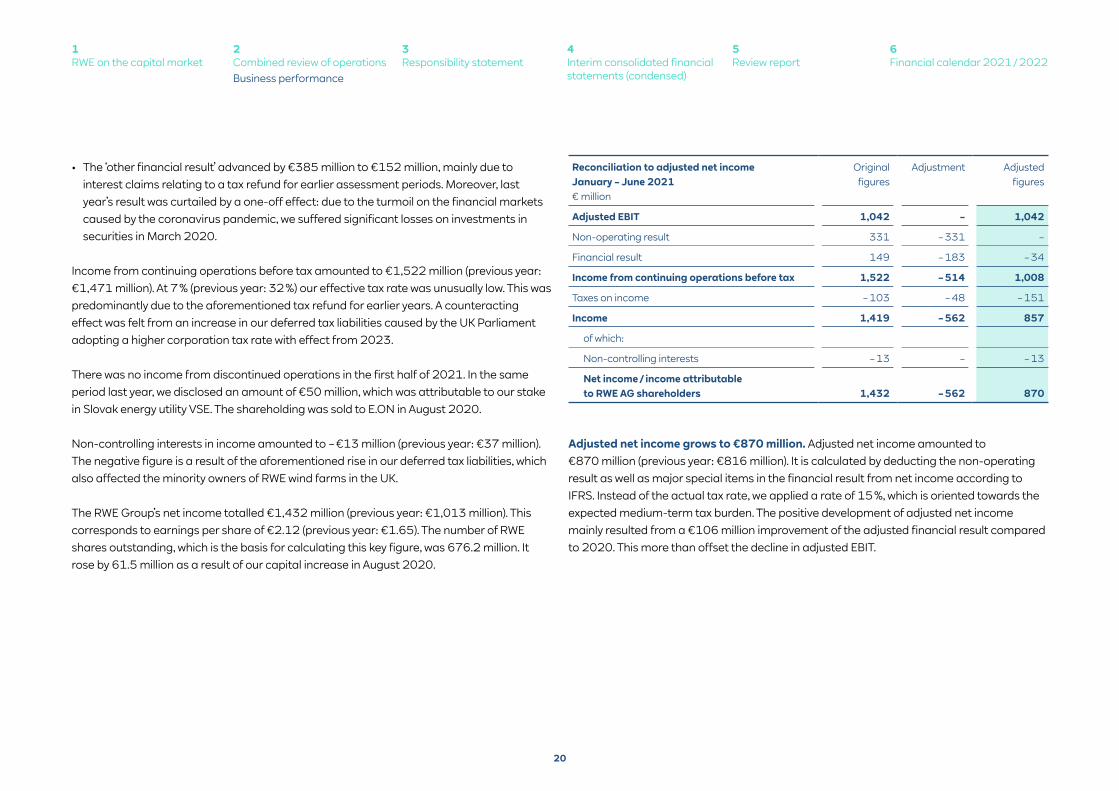
• The ‘other financial result’ advanced by €385 million to €152 million, mainly due to interest claims relating to a tax refund for earlier assessment periods. Moreover, last year’s result was curtailed by a one-off effect: due to the turmoil on the financial markets caused by the coronavirus pandemic, we suffered significant losses on investments in securities in March 2020.
Income from continuing operations before tax amounted to €1,522 million (previous year: €1,471 million). At 7 % (previous year: 32 %) our effective tax rate was unusually low. This was predominantly due to the aforementioned tax refund for earlier years. A counteracting effect was felt from an increase in our deferred tax liabilities caused by the UK Parliament adopting a higher corporation tax rate with effect from 2023.
There was no income from discontinued operations in the first half of 2021. In the same period last year, we disclosed an amount of €50 million, which was attributable to our stake in Slovak energy utility VSE. The shareholding was sold to E.ON in August 2020.
Non-controlling interests in income amounted to – €13 million (previous year: €37 million). The negative figure is a result of the aforementioned rise in our deferred tax liabilities, which also affected the minority owners of RWE wind farms in the UK.
The RWE Group’s net income totalled €1,432 million (previous year: €1,013 million). This corresponds to earnings per share of €2.12 (previous year: €1.65). The number of RWE shares outstanding, which is the basis for calculating this key figure, was 676.2 million. It rose by 61.5 million as a result of our capital increase in August 2020.
Adjusted net income grows to €870 million. Adjusted net income amounted to €870 million (previous year: €816 million). It is calculated by deducting the non-operating result as well as major special items in the financial result from net income according to IFRS. Instead of the actual tax rate, we applied a rate of 15 %, which is oriented towards the expected medium-term tax burden. The positive development of adjusted net income mainly resulted from a €106 million improvement of the adjusted financial result compared to 2020. This more than offset the decline in adjusted EBIT.
Reconciliation to adjusted net income January – June 2021 € million
Original figures
Adjustment Adjusted figures
Adjusted EBIT 1,042 – 1,042
Non-operating result 331 – 331 –
Financial result 149 – 183 – 34
Income from continuing operations before tax 1,522 – 514 1,008
Taxes on income – 103 – 48 – 151
Income 1,419 – 562 857
of which:
Non-controlling interests – 13 – – 13
Net income / income attributable to RWE AG shareholders 1,432 – 562 870
20
1RWE on the capital market
3Responsibility statement
2Combined review of operationsBusiness performance
5Review report
4Interim consolidated financial statements (condensed)
6Financial calendar 2021 / 2022
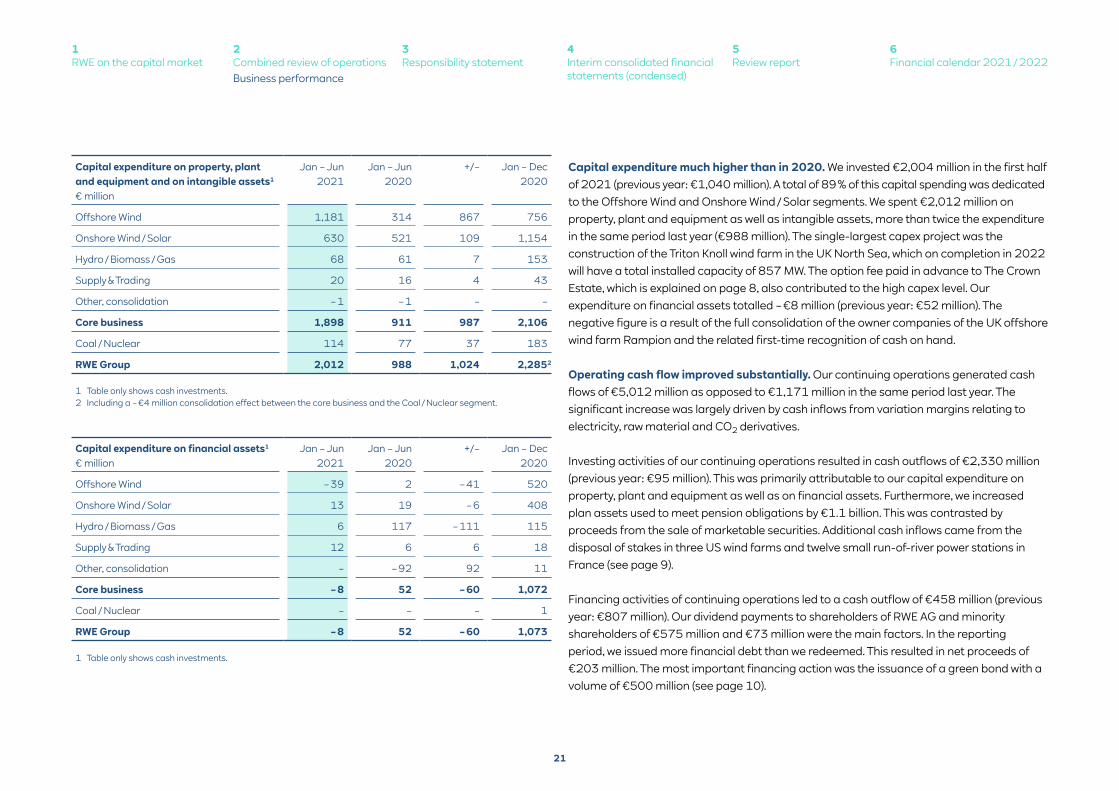
Capital expenditure much higher than in 2020. We invested €2,004 million in the first half of 2021 (previous year: €1,040 million). A total of 89 % of this capital spending was dedicated to the Offshore Wind and Onshore Wind / Solar segments. We spent €2,012 million on property, plant and equipment as well as intangible assets, more than twice the expenditure in the same period last year (€988 million). The single-largest capex project was the construction of the Triton Knoll wind farm in the UK North Sea, which on completion in 2022 will have a total installed capacity of 857 MW. The option fee paid in advance to The Crown Estate, which is explained on page 8, also contributed to the high capex level. Our expenditure on financial assets totalled – €8 million (previous year: €52 million). The negative figure is a result of the full consolidation of the owner companies of the UK offshore wind farm Rampion and the related first-time recognition of cash on hand.
Operating cash flow improved substantially. Our continuing operations generated cash flows of €5,012 million as opposed to €1,171 million in the same period last year. The significant increase was largely driven by cash inflows from variation margins relating to electricity, raw material and CO2 derivatives.
Investing activities of our continuing operations resulted in cash outflows of €2,330 million (previous year: €95 million). This was primarily attributable to our capital expenditure on property, plant and equipment as well as on financial assets. Furthermore, we increased plan assets used to meet pension obligations by €1.1 billion. This was contrasted by proceeds from the sale of marketable securities. Additional cash inflows came from the disposal of stakes in three US wind farms and twelve small run-of-river power stations in France (see page 9).
Financing activities of continuing operations led to a cash outflow of €458 million (previous year: €807 million). Our dividend payments to shareholders of RWE AG and minority shareholders of €575 million and €73 million were the main factors. In the reporting period, we issued more financial debt than we redeemed. This resulted in net proceeds of €203 million. The most important financing action was the issuance of a green bond with a volume of €500 million (see page 10).
1 Table only shows cash investments.
1 Table only shows cash investments.2 Including a – €4 million consolidation effect between the core business and the Coal / Nuclear segment.
Capital expenditure on property, plant and equipment and on intangible assets1
€ million
Jan – Jun 2021
Jan – Jun 2020
+/– Jan – Dec 2020
Offshore Wind 1,181 314 867 756
Onshore Wind / Solar 630 521 109 1,154
Hydro / Biomass / Gas 68 61 7 153
Supply & Trading 20 16 4 43
Other, consolidation – 1 – 1 – –
Core business 1,898 911 987 2,106
Coal / Nuclear 114 77 37 183
RWE Group 2,012 988 1,024 2,2852
Capital expenditure on financial assets1
€ millionJan – Jun
2021Jan – Jun
2020+/– Jan – Dec
2020
Offshore Wind – 39 2 – 41 520
Onshore Wind / Solar 13 19 – 6 408
Hydro / Biomass / Gas 6 117 – 111 115
Supply & Trading 12 6 6 18
Other, consolidation – – 92 92 11
Core business – 8 52 – 60 1,072
Coal / Nuclear – – – 1
RWE Group – 8 52 – 60 1,073
21
1RWE on the capital market
3Responsibility statement
2Combined review of operationsBusiness performance
5Review report
4Interim consolidated financial statements (condensed)
6Financial calendar 2021 / 2022
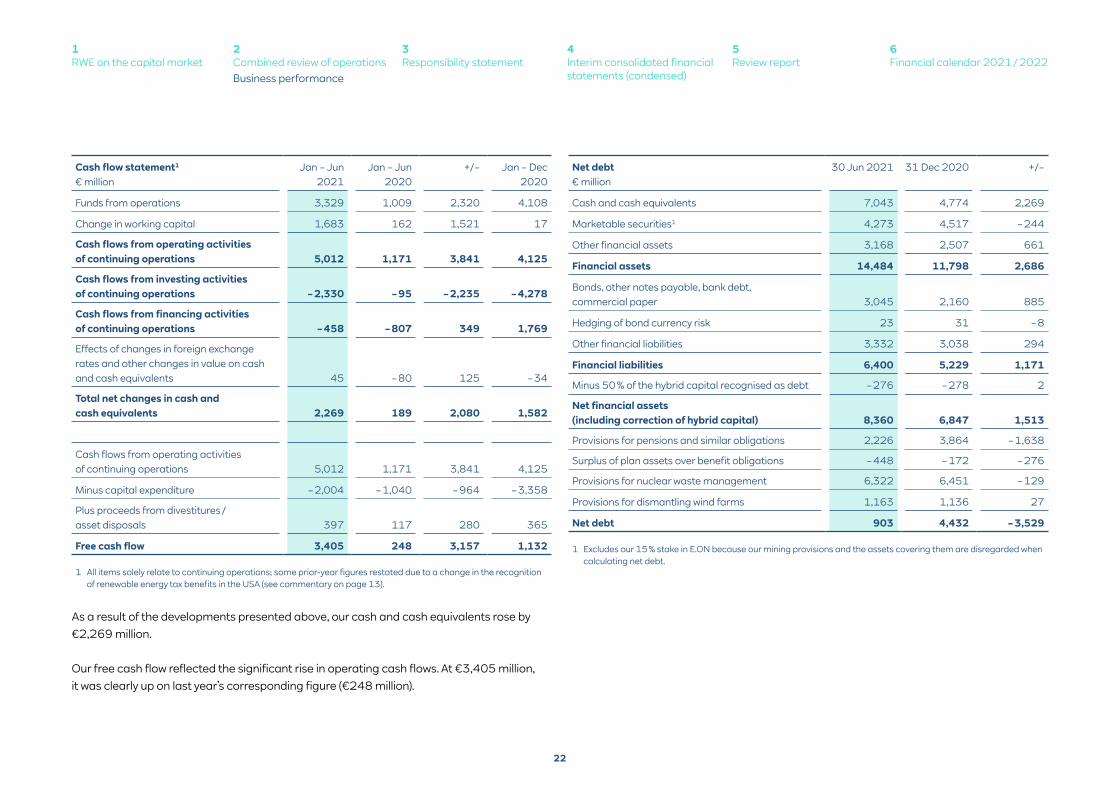
As a result of the developments presented above, our cash and cash equivalents rose by €2,269 million.
Our free cash flow reflected the significant rise in operating cash flows. At €3,405 million, it was clearly up on last year’s corresponding figure (€248 million).
1 Excludes our 15 % stake in E.ON because our mining provisions and the assets covering them are disregarded when calculating net debt.
1 All items solely relate to continuing operations; some prior-year figures restated due to a change in the recognition of renewable energy tax benefits in the USA (see commentary on page 13).
Cash flow statement1
€ millionJan – Jun
2021Jan – Jun
2020+/– Jan – Dec
2020
Funds from operations 3,329 1,009 2,320 4,108
Change in working capital 1,683 162 1,521 17
Cash flows from operating activities of continuing operations 5,012 1,171 3,841 4,125
Cash flows from investing activities of continuing operations – 2,330 – 95 – 2,235 – 4,278
Cash flows from financing activities of continuing operations – 458 – 807 349 1,769
Effects of changes in foreign exchange rates and other changes in value on cash and cash equivalents 45 – 80 125 – 34
Total net changes in cash and cash equivalents 2,269 189 2,080 1,582
Cash flows from operating activities of continuing operations 5,012 1,171 3,841 4,125
Minus capital expenditure – 2,004 – 1,040 – 964 – 3,358
Plus proceeds from divestitures / asset disposals 397 117 280 365
Free cash flow 3,405 248 3,157 1,132
Net debt€ million
30 Jun 2021 31 Dec 2020 +/–
Cash and cash equivalents 7,043 4,774 2,269
Marketable securities1 4,273 4,517 – 244
Other financial assets 3,168 2,507 661
Financial assets 14,484 11,798 2,686
Bonds, other notes payable, bank debt, commercial paper 3,045 2,160 885
Hedging of bond currency risk 23 31 – 8
Other financial liabilities 3,332 3,038 294
Financial liabilities 6,400 5,229 1,171
Minus 50 % of the hybrid capital recognised as debt – 276 – 278 2
Net financial assets (including correction of hybrid capital) 8,360 6,847 1,513
Provisions for pensions and similar obligations 2,226 3,864 – 1,638
Surplus of plan assets over benefit obligations – 448 – 172 – 276
Provisions for nuclear waste management 6,322 6,451 – 129
Provisions for dismantling wind farms 1,163 1,136 27
Net debt 903 4,432 – 3,529
22
1RWE on the capital market
3Responsibility statement
2Combined review of operationsBusiness performance
5Review report
4Interim consolidated financial statements (condensed)
6Financial calendar 2021 / 2022
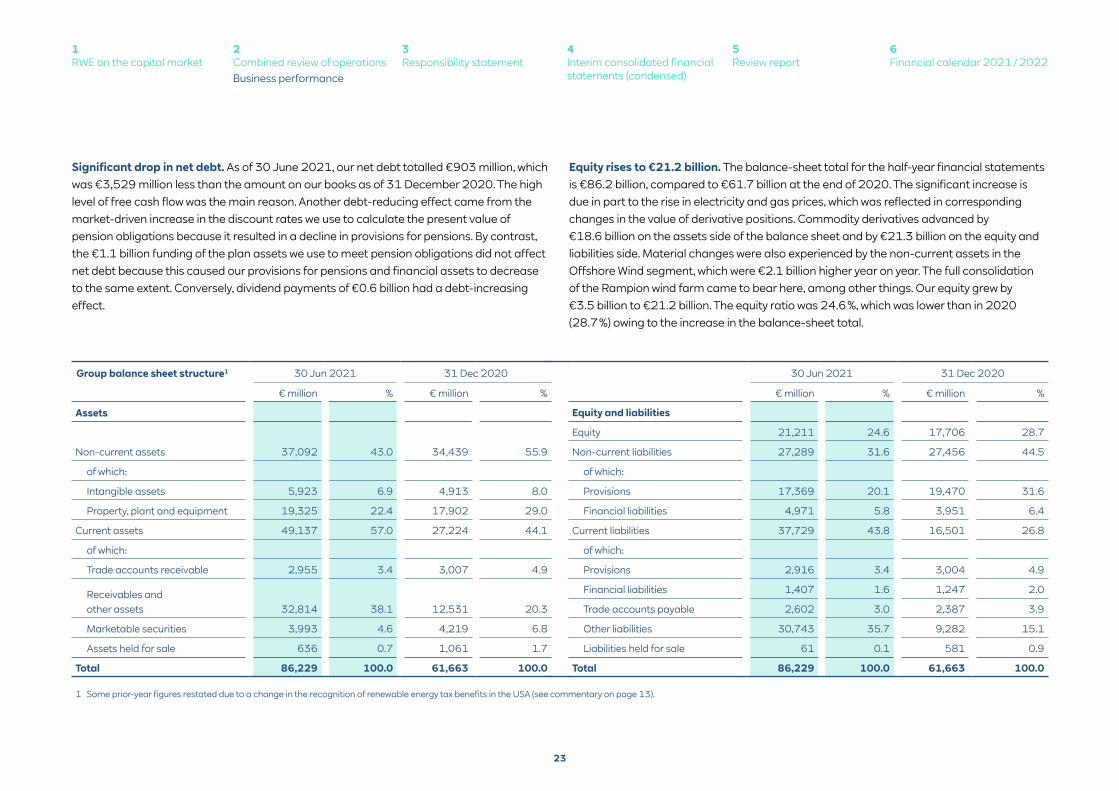
Significant drop in net debt. As of 30 June 2021, our net debt totalled €903 million, which was €3,529 million less than the amount on our books as of 31 December 2020. The high level of free cash flow was the main reason. Another debt-reducing effect came from the market-driven increase in the discount rates we use to calculate the present value of pension obligations because it resulted in a decline in provisions for pensions. By contrast, the €1.1 billion funding of the plan assets we use to meet pension obligations did not affect net debt because this caused our provisions for pensions and financial assets to decrease to the same extent. Conversely, dividend payments of €0.6 billion had a debt-increasing effect.
Equity rises to €21.2 billion. The balance-sheet total for the half-year financial statements is €86.2 billion, compared to €61.7 billion at the end of 2020. The significant increase is due in part to the rise in electricity and gas prices, which was reflected in corresponding changes in the value of derivative positions. Commodity derivatives advanced by €18.6 billion on the assets side of the balance sheet and by €21.3 billion on the equity and liabilities side. Material changes were also experienced by the non-current assets in the Offshore Wind segment, which were €2.1 billion higher year on year. The full consolidation of the Rampion wind farm came to bear here, among other things. Our equity grew by €3.5 billion to €21.2 billion. The equity ratio was 24.6 %, which was lower than in 2020 (28.7 %) owing to the increase in the balance-sheet total.
1 Some prior-year figures restated due to a change in the recognition of renewable energy tax benefits in the USA (see commentary on page 13).
30 Jun 2021 31 Dec 2020
€ million % € million %
Assets
Non-current assets 37,092 43.0 34,439 55.9
of which:
Intangible assets 5,923 6.9 4,913 8.0
Property, plant and equipment 19,325 22.4 17,902 29.0
Current assets 49,137 57.0 27,224 44.1
of which:
Trade accounts receivable 2,955 3.4 3,007 4.9
Receivables and other assets 32,814 38.1 12,531 20.3
Marketable securities 3,993 4.6 4,219 6.8
Assets held for sale 636 0.7 1,061 1.7
Total 86,229 100.0 61,663 100.0
30 Jun 2021 31 Dec 2020
€ million % € million %
Equity and liabilities
Equity 21,211 24.6 17,706 28.7
Non-current liabilities 27,289 31.6 27,456 44.5
of which:
Provisions 17,369 20.1 19,470 31.6
Financial liabilities 4,971 5.8 3,951 6.4
Current liabilities 37,729 43.8 16,501 26.8
of which:
Provisions 2,916 3.4 3,004 4.9
Financial liabilities 1,407 1.6 1,247 2.0
Trade accounts payable 2,602 3.0 2,387 3.9
Other liabilities 30,743 35.7 9,282 15.1
Liabilities held for sale 61 0.1 581 0.9
Total 86,229 100.0 61,663 100.0
Group balance sheet structure1
23
1RWE on the capital market
3Responsibility statement
2Combined review of operationsBusiness performance
5Review report
4Interim consolidated financial statements (condensed)
6Financial calendar 2021 / 2022
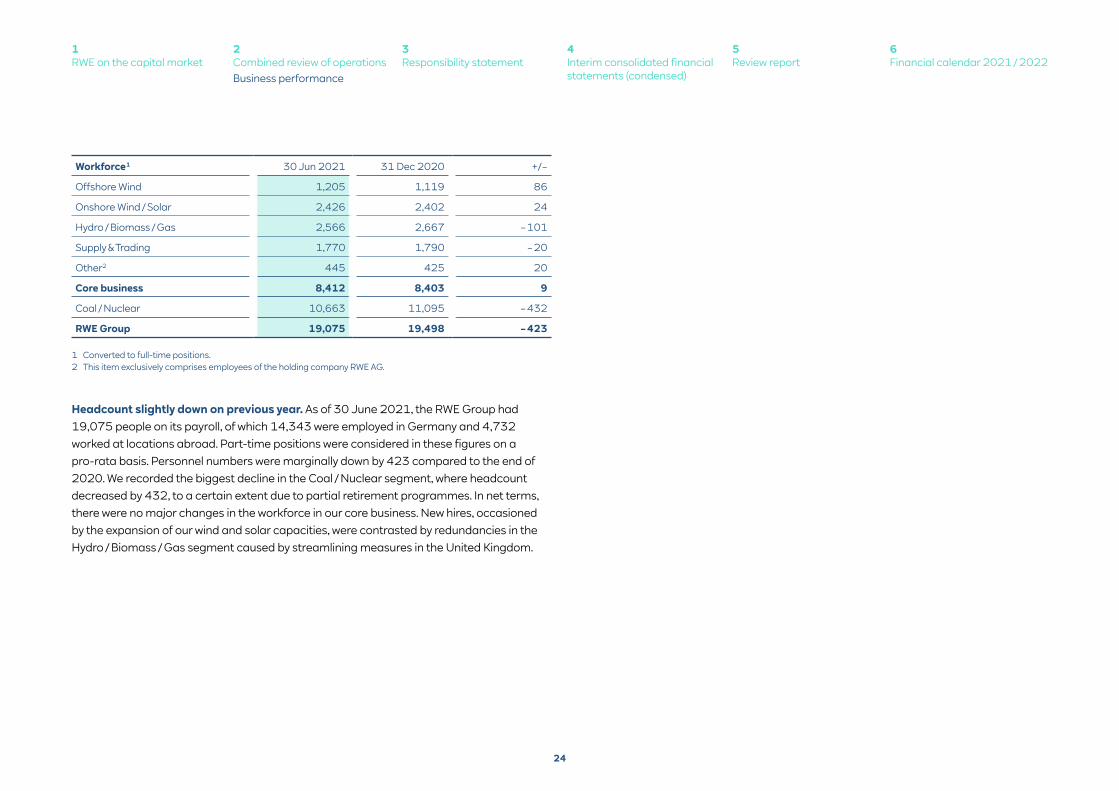
1 Converted to full-time positions.2 This item exclusively comprises employees of the holding company RWE AG.
Workforce 1 30 Jun 2021 31 Dec 2020 +/–
Offshore Wind 1,205 1,119 86
Onshore Wind / Solar 2,426 2,402 24
Hydro / Biomass / Gas 2,566 2,667 – 101
Supply & Trading 1,770 1,790 – 20
Other2 445 425 20
Core business 8,412 8,403 9
Coal / Nuclear 10,663 11,095 – 432
RWE Group 19,075 19,498 – 423
Headcount slightly down on previous year. As of 30 June 2021, the RWE Group had 19,075 people on its payroll, of which 14,343 were employed in Germany and 4,732 worked at locations abroad. Part-time positions were considered in these figures on a pro-rata basis. Personnel numbers were marginally down by 423 compared to the end of 2020. We recorded the biggest decline in the Coal / Nuclear segment, where headcount decreased by 432, to a certain extent due to partial retirement programmes. In net terms, there were no major changes in the workforce in our core business. New hires, occasioned by the expansion of our wind and solar capacities, were contrasted by redundancies in the Hydro / Biomass / Gas segment caused by streamlining measures in the United Kingdom.
24
1RWE on the capital market
3Responsibility statement
2Combined review of operationsBusiness performance
5Review report
4Interim consolidated financial statements (condensed)
6Financial calendar 2021 / 2022
Outlook for 2021
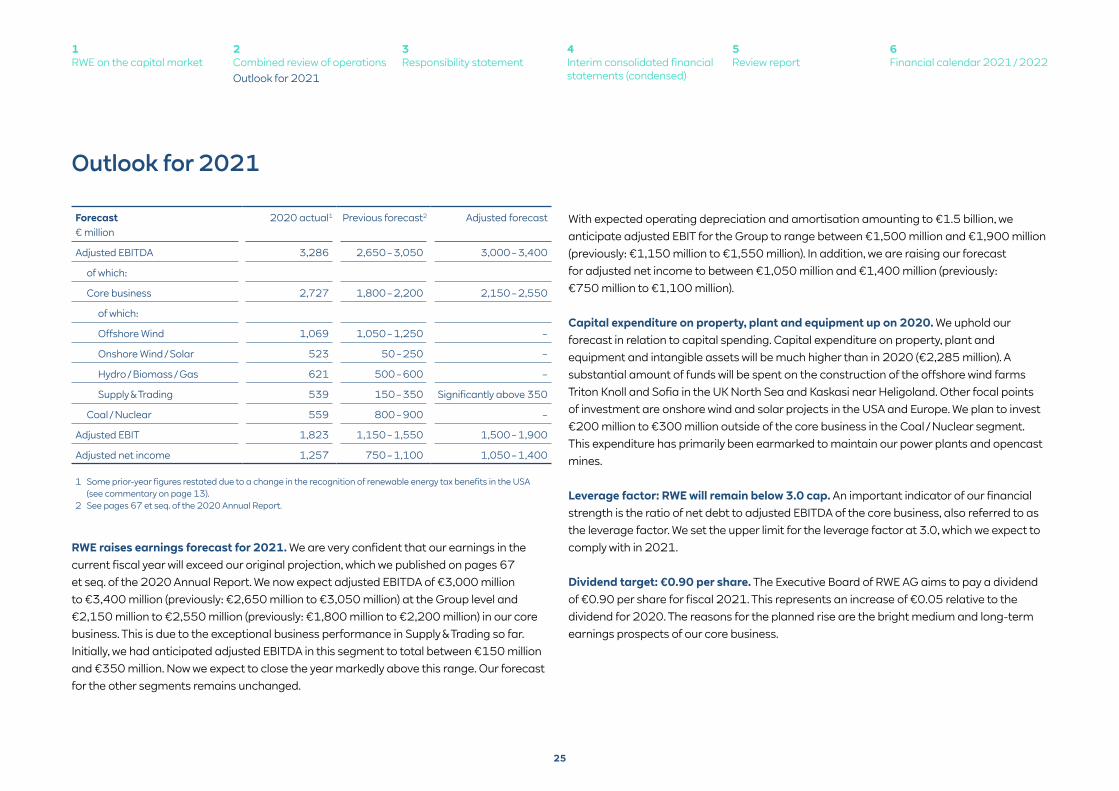
RWE raises earnings forecast for 2021. We are very confident that our earnings in the current fiscal year will exceed our original projection, which we published on pages 67 et seq. of the 2020 Annual Report. We now expect adjusted EBITDA of €3,000 million to €3,400 million (previously: €2,650 million to €3,050 million) at the Group level and €2,150 million to €2,550 million (previously: €1,800 million to €2,200 million) in our core business. This is due to the exceptional business performance in Supply & Trading so far. Initially, we had anticipated adjusted EBITDA in this segment to total between €150 million and €350 million. Now we expect to close the year markedly above this range. Our forecast for the other segments remains unchanged.
Forecast € million
2020 actual1 Previous forecast2 Adjusted forecast
Adjusted EBITDA 3,286 2,650 – 3,050 3,000 – 3,400
of which:
Core business 2,727 1,800 – 2,200 2,150 – 2,550
of which:
Offshore Wind 1,069 1,050 – 1,250 –
Onshore Wind / Solar 523 50 – 250 –
Hydro / Biomass / Gas 621 500 – 600 –
Supply & Trading 539 150 – 350 Significantly above 350
Coal / Nuclear 559 800 – 900 –
Adjusted EBIT 1,823 1,150 – 1,550 1,500 – 1,900
Adjusted net income 1,257 750 – 1,100 1,050 – 1,400
1 Some prior-year figures restated due to a change in the recognition of renewable energy tax benefits in the USA (see commentary on page 13).
2 See pages 67 et seq. of the 2020 Annual Report.
With expected operating depreciation and amortisation amounting to €1.5 billion, we anticipate adjusted EBIT for the Group to range between €1,500 million and €1,900 million (previously: €1,150 million to €1,550 million). In addition, we are raising our forecast for adjusted net income to between €1,050 million and €1,400 million (previously: €750 million to €1,100 million).
Capital expenditure on property, plant and equipment up on 2020. We uphold our forecast in relation to capital spending. Capital expenditure on property, plant and equipment and intangible assets will be much higher than in 2020 (€2,285 million). A substantial amount of funds will be spent on the construction of the offshore wind farms Triton Knoll and Sofia in the UK North Sea and Kaskasi near Heligoland. Other focal points of investment are onshore wind and solar projects in the USA and Europe. We plan to invest €200 million to €300 million outside of the core business in the Coal / Nuclear segment. This expenditure has primarily been earmarked to maintain our power plants and opencast mines.
Leverage factor: RWE will remain below 3.0 cap. An important indicator of our financial strength is the ratio of net debt to adjusted EBITDA of the core business, also referred to as the leverage factor. We set the upper limit for the leverage factor at 3.0, which we expect to comply with in 2021.
Dividend target: €0.90 per share. The Executive Board of RWE AG aims to pay a dividend of €0.90 per share for fiscal 2021. This represents an increase of €0.05 relative to the dividend for 2020. The reasons for the planned rise are the bright medium and long-term earnings prospects of our core business.
25
1RWE on the capital market
3Responsibility statement
2Combined review of operationsOutlook for 2021
5Review report
4Interim consolidated financial statements (condensed)
6Financial calendar 2021 / 2022
Current assessment of risk exposure
Risks remain medium and low. Information on the structure and processes of our risk management, the responsible organisational units, the major risks and opportunities as well as our measures to control and monitor risks is presented on pages 69 et seqq. of our 2020 Annual Report and reflects the knowledge we had as of February 2021. We break down our risks by cause into the seven following classes: (1) market risks, (2) regulatory and political risks, (3) legal risks, (4) operational risks, (5) financial risks, (6) creditworthiness of business partners, and (7) other risks. We assess the risks in each of these classes, based on the highest individual risk. The categories are ‘low’, ‘medium’ and ‘high’. We assess risks twice a year, using a bottom-up analysis. The most recent assessment was performed in the spring of 2021, resulting in our lowering the classification of ‘other risks’ from medium to low (see commentary below). There were no changes to the rest of the risk classes. Aside from the legal and other risks, which we classify as low, we have assigned all risk classes to the medium category.
Among the material risk factors on which we commented in the 2020 Annual Report are the coronavirus pandemic and the framework conditions of our lignite business. Recent developments in these areas are presented here:
• As in 2020, operating earnings in 2021 also suffered only minor setbacks due to the coronavirus pandemic. Our preventive measures and emergency plans enabled us to ensure the reliable operation of our assets. Further delays were incurred in completing US wind farms, but the associated earnings shortfalls were insignificant. Thanks to the economy’s recent strong recovery and a substantial increase in electricity prices, the corona-induced margin risk exposure of our generation assets decreased. In consequence, so did the danger of having to recognise impairment losses due to the pandemic. Therefore, we classify our other risks, in which we consider this topic, as low.
• In March 2021, the European Commission launched its probe into the compensation for the early shutdown of lignite-fired power plants stipulated by the German Coal Phaseout Act for compliance with state aid law. In early May, the Commission published the opening resolution on the aid proceedings, which afforded us and others the opportunity to make a statement within a month. We have submitted that our financial burdens exceed the amount of €2.6 billion in compensation envisaged by law. Nevertheless, the risk of the Commission questioning the level of the compensation remains.
• As set out on page 4, Germany raised its climate goal for 2030. The envisaged greenhouse gas emission reduction is now 65 % compared to 1990. It remains to be seen which measures will be taken to hit this target. This issue must be addressed after the elections to the Lower House of Parliament in September 2021. It is conceivable that the future government will revise the current lignite phaseout roadmap, forcing us to close our power plants earlier.
Risk indicators in the first half of 2021. We manage and monitor commodity price and financial market risks using indicators such as the Value at Risk (VaR), Cash Flow at Risk (CFaR) and sensitivities.
The risk exposure of the trading operations of RWE Supply & Trading is measured using the VaR. It specifies the maximum loss from a risk position not exceeded with a given probability over a certain period of time. The VaR figures within the RWE Group are generally based on a confidence interval of 95 %. The assumed holding period for a position is one day. This means that, with a probability of 95 %, the maximum daily loss does not exceed the VaR. The VaR for the price risks associated with commodity positions in the trading business is subject to a daily limit, which was €40 million in the last few years and was increased to €50 million at the beginning of 2021. In the first half of the year, actual figures averaged €31 million, usually remaining significantly below the limit. The highest daily amount was €50 million.
26
1RWE on the capital market
3Responsibility statement
5Review report
4Interim consolidated financial statements (condensed)
6Financial calendar 2021 / 2022
2Combined review of operationsCurrent assessment of risk exposure
The management of our gas portfolio and LNG business is pooled in a dedicated organisational unit at RWE Supply & Trading. Since the beginning of 2021, the daily VaR ceiling for these activities has been €24 million (previously €14 million). Only part of this headroom was utilised. The highest daily amount was €12 million, and the average for the first half of the year was €10 million.
The development of market interest rates is a major financial risk. If they rise, we can suffer losses on the securities on our books. This primarily relates to fixed-interest bonds. In 2021, we started measuring the securities price risk using a sensitivity analysis. This led to the following results as of the balance-sheet date: if market interest rates had increased by 100 basis points, the value of the bonds on our books would have dropped by €93 million.
In addition, rising interest rates drive up our finance costs. We measure this risk using the Cash Flow at Risk (CFaR). In doing so, we apply a confidence level of 95 % and a holding period of one year. In the first half of 2021, the average CFaR was €20 million.
The securities on our books typically include equities. We currently hold a 15 % stake in E.ON, which had a market value of €3.9 billion on 30 June 2021. Therefore, changes in the price of the E.ON share can have a substantial effect on our financial strength.
We now also measure risks associated with our financial positions held in foreign currencies via a sensitivity analysis. In doing so, we calculate the extent to which a 10 % change in foreign exchange rates would affect the value of the positions. As of 30 June, this sensitivity was €0.3 million.
27
1RWE on the capital market
3Responsibility statement
5Review report
4Interim consolidated financial statements (condensed)
6Financial calendar 2021 / 2022
2Combined review of operationsCurrent assessment of risk exposure
Responsibility statement
To the best of our knowledge, and in accordance with the applicable reporting principles for half-year financial reporting, the interim consolidated financial statements give a true and fair view of the assets, liabilities, financial position and profit or loss of the Group, and the interim Group review of operations includes a fair review of the development and performance of the business and the position of the Group, together with a description of the principal opportunities and risks associated with the expected development of the Group for the remaining months of the financial year.
Essen, 10 August 2021
The Executive Board
Krebber Müller Seeger
28
1RWE on the capital market
3Responsibility statement
5Review report
4Interim consolidated financial statements (condensed)
6Financial calendar 2021 / 2022
2Combined review of operations
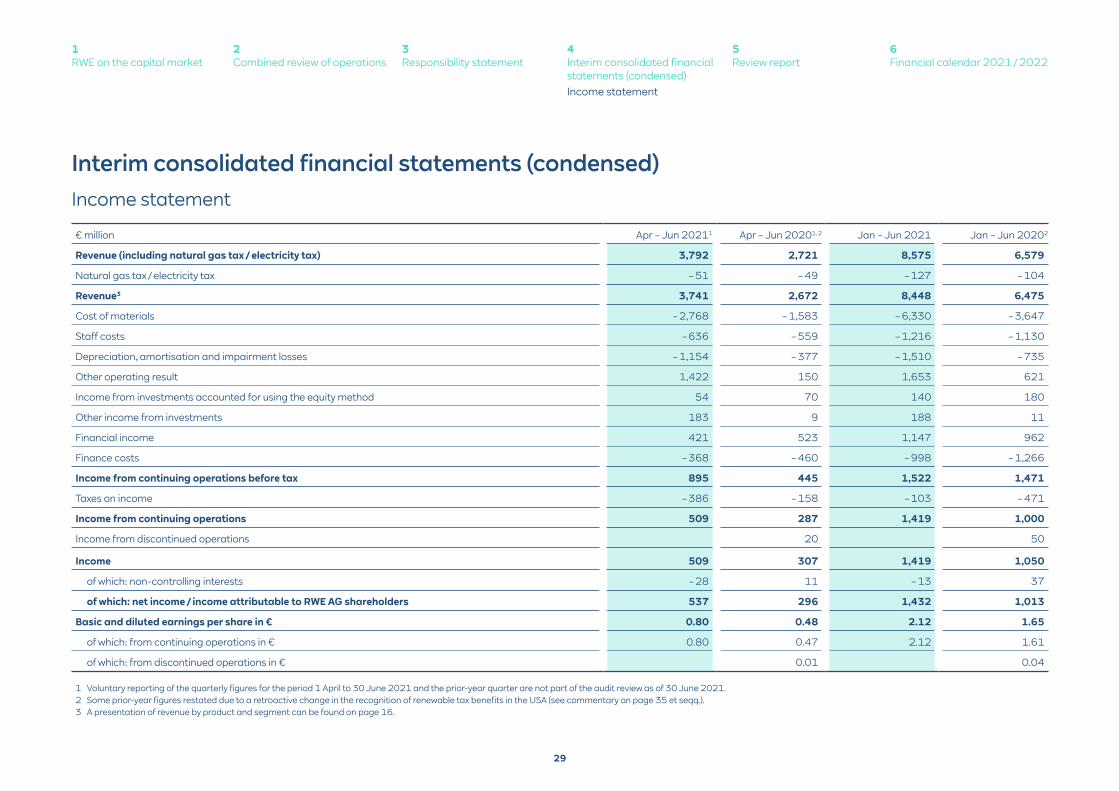
Interim consolidated financial statements (condensed)Income statement
€ million Apr – Jun 20211 Apr – Jun 20201, 2 Jan – Jun 2021 Jan – Jun 20202
Revenue (including natural gas tax / electricity tax) 3,792 2,721 8,575 6,579
Natural gas tax / electricity tax – 51 – 49 – 127 – 104
Revenue3 3,741 2,672 8,448 6,475
Cost of materials – 2,768 – 1,583 – 6,330 – 3,647
Staff costs – 636 – 559 – 1,216 – 1,130
Depreciation, amortisation and impairment losses – 1,154 – 377 – 1,510 – 735
Other operating result 1,422 150 1,653 621
Income from investments accounted for using the equity method 54 70 140 180
Other income from investments 183 9 188 11
Financial income 421 523 1,147 962
Finance costs – 368 – 460 – 998 – 1,266
Income from continuing operations before tax 895 445 1,522 1,471
Taxes on income – 386 – 158 – 103 – 471
Income from continuing operations 509 287 1,419 1,000
Income from discontinued operations 20 50
Income 509 307 1,419 1,050
of which: non-controlling interests – 28 11 – 13 37
of which: net income / income attributable to RWE AG shareholders 537 296 1,432 1,013
Basic and diluted earnings per share in € 0.80 0.48 2.12 1.65
of which: from continuing operations in € 0.80 0.47 2.12 1.61
of which: from discontinued operations in € 0.01 0.04
1 Voluntary reporting of the quarterly figures for the period 1 April to 30 June 2021 and the prior-year quarter are not part of the audit review as of 30 June 2021.2 Some prior-year figures restated due to a retroactive change in the recognition of renewable tax benefits in the USA (see commentary on page 35 et seqq.).3 A presentation of revenue by product and segment can be found on page 16.
29
1RWE on the capital market
3Responsibility statement
2Combined review of operations
5Review report
4Interim consolidated financial statements (condensed)Income statement
6Financial calendar 2021 / 2022
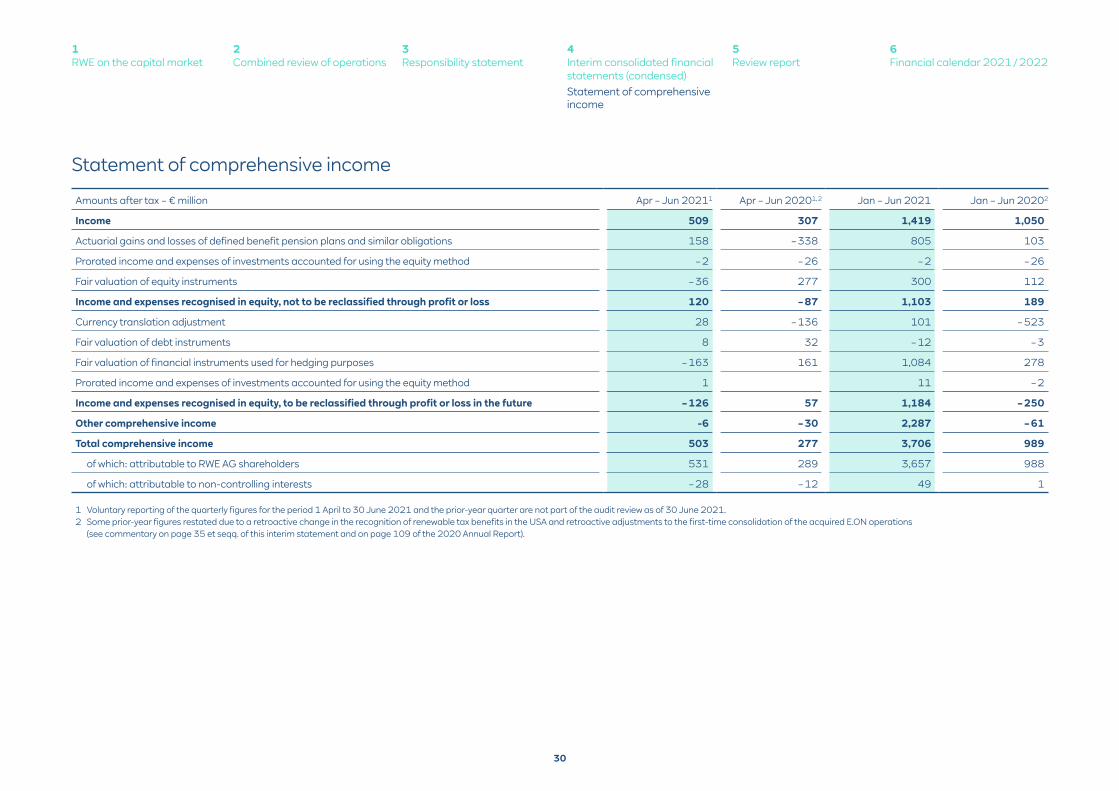
Statement of comprehensive income
Amounts after tax – € million Apr – Jun 20211 Apr – Jun 20201, 2 Jan – Jun 2021 Jan – Jun 20202
Income 509 307 1,419 1,050
Actuarial gains and losses of defined benefit pension plans and similar obligations 158 – 338 805 103
Prorated income and expenses of investments accounted for using the equity method – 2 – 26 – 2 – 26
Fair valuation of equity instruments – 36 277 300 112
Income and expenses recognised in equity, not to be reclassified through profit or loss 120 – 87 1,103 189
Currency translation adjustment 28 – 136 101 – 523
Fair valuation of debt instruments 8 32 – 12 – 3
Fair valuation of financial instruments used for hedging purposes – 163 161 1,084 278
Prorated income and expenses of investments accounted for using the equity method 1 11 – 2
Income and expenses recognised in equity, to be reclassified through profit or loss in the future – 126 57 1,184 – 250
Other comprehensive income -6 – 30 2,287 – 61
Total comprehensive income 503 277 3,706 989
of which: attributable to RWE AG shareholders 531 289 3,657 988
of which: attributable to non-controlling interests – 28 – 12 49 1
1 Voluntary reporting of the quarterly figures for the period 1 April to 30 June 2021 and the prior-year quarter are not part of the audit review as of 30 June 2021.2 Some prior-year figures restated due to a retroactive change in the recognition of renewable tax benefits in the USA and retroactive adjustments to the first-time consolidation of the acquired E.ON operations
(see commentary on page 35 et seqq. of this interim statement and on page 109 of the 2020 Annual Report).
30
1RWE on the capital market
3Responsibility statement
2Combined review of operations
5Review report
6Financial calendar 2021 / 2022
4Interim consolidated financial statements (condensed)Statement of comprehensive income
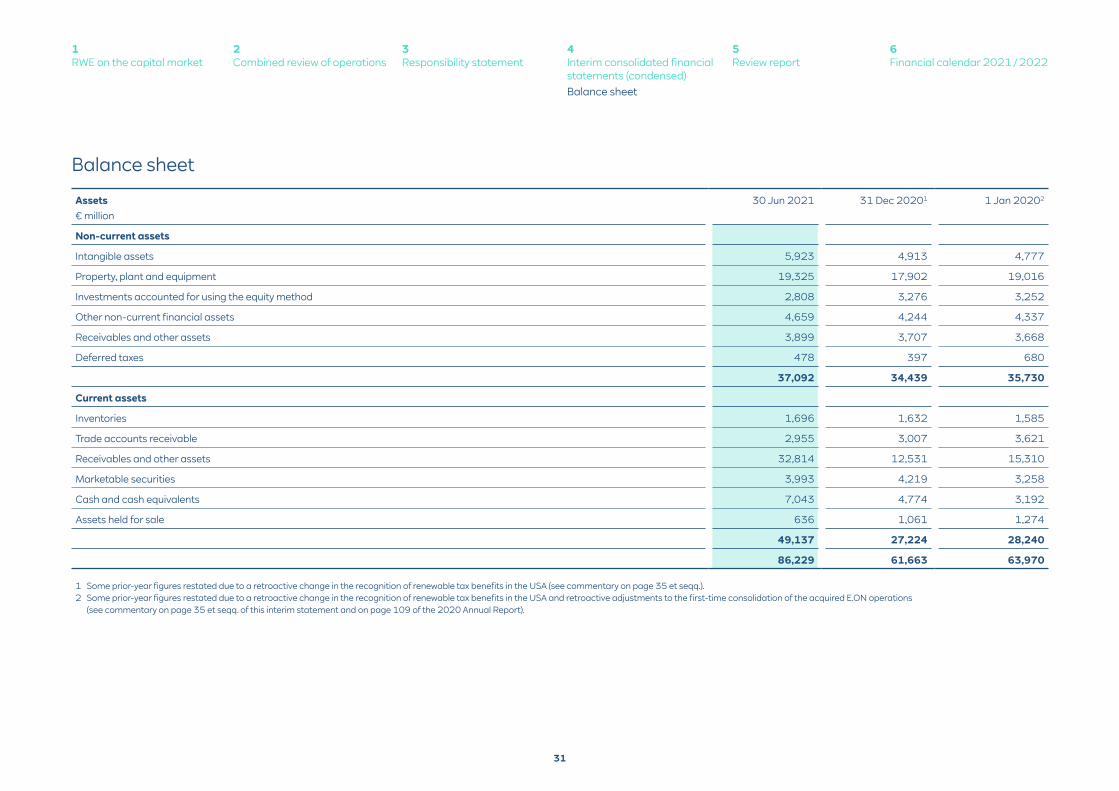
Balance sheet
Assets 30 Jun 2021 31 Dec 20201 1 Jan 20202
€ million
Non-current assets
Intangible assets 5,923 4,913 4,777
Property, plant and equipment 19,325 17,902 19,016
Investments accounted for using the equity method 2,808 3,276 3,252
Other non-current financial assets 4,659 4,244 4,337
Receivables and other assets 3,899 3,707 3,668
Deferred taxes 478 397 680
37,092 34,439 35,730
Current assets
Inventories 1,696 1,632 1,585
Trade accounts receivable 2,955 3,007 3,621
Receivables and other assets 32,814 12,531 15,310
Marketable securities 3,993 4,219 3,258
Cash and cash equivalents 7,043 4,774 3,192
Assets held for sale 636 1,061 1,274
49,137 27,224 28,240
86,229 61,663 63,970
1 Some prior-year figures restated due to a retroactive change in the recognition of renewable tax benefits in the USA (see commentary on page 35 et seqq.).2 Some prior-year figures restated due to a retroactive change in the recognition of renewable tax benefits in the USA and retroactive adjustments to the first-time consolidation of the acquired E.ON operations
(see commentary on page 35 et seqq. of this interim statement and on page 109 of the 2020 Annual Report).
31
1RWE on the capital market
3Responsibility statement
2Combined review of operations
5Review report
4Interim consolidated financial statements (condensed)Balance sheet
6Financial calendar 2021 / 2022
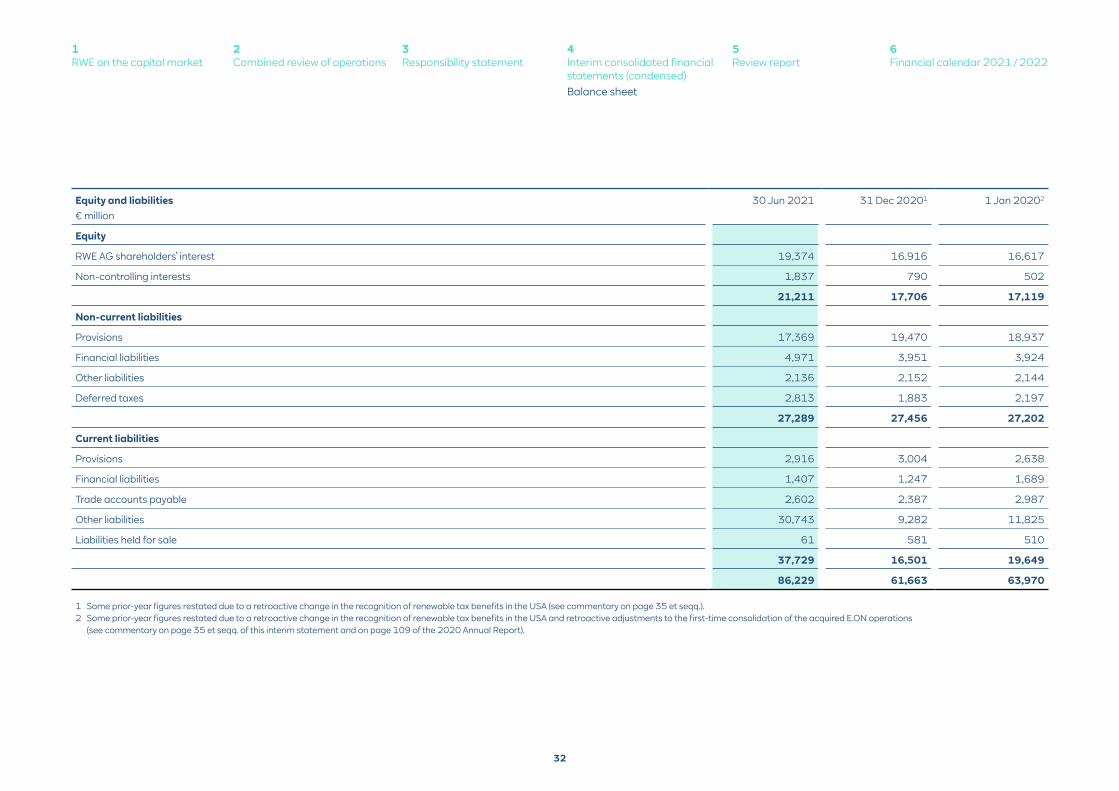
Equity and liabilities 30 Jun 2021 31 Dec 20201 1 Jan 20202
€ million
Equity
RWE AG shareholders’ interest 19,374 16,916 16,617
Non-controlling interests 1,837 790 502
21,211 17,706 17,119
Non-current liabilities
Provisions 17,369 19,470 18,937
Financial liabilities 4,971 3,951 3,924
Other liabilities 2,136 2,152 2,144
Deferred taxes 2,813 1,883 2,197
27,289 27,456 27,202
Current liabilities
Provisions 2,916 3,004 2,638
Financial liabilities 1,407 1,247 1,689
Trade accounts payable 2,602 2,387 2,987
Other liabilities 30,743 9,282 11,825
Liabilities held for sale 61 581 510
37,729 16,501 19,649
86,229 61,663 63,970
1 Some prior-year figures restated due to a retroactive change in the recognition of renewable tax benefits in the USA (see commentary on page 35 et seqq.).2 Some prior-year figures restated due to a retroactive change in the recognition of renewable tax benefits in the USA and retroactive adjustments to the first-time consolidation of the acquired E.ON operations
(see commentary on page 35 et seqq. of this interim statement and on page 109 of the 2020 Annual Report).
32
1RWE on the capital market
3Responsibility statement
2Combined review of operations
5Review report
4Interim consolidated financial statements (condensed)Balance sheet
6Financial calendar 2021 / 2022
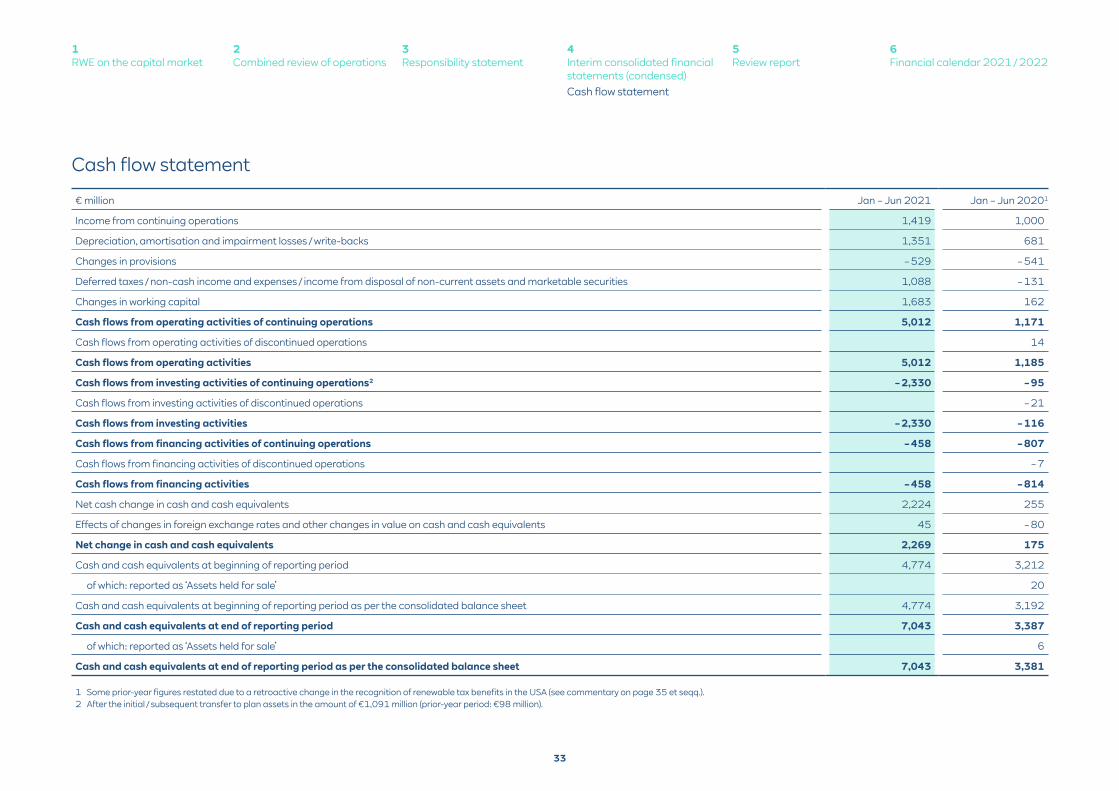
Cash flow statement
€ million Jan – Jun 2021 Jan – Jun 20201
Income from continuing operations 1,419 1,000
Depreciation, amortisation and impairment losses / write-backs 1,351 681
Changes in provisions – 529 – 541
Deferred taxes / non-cash income and expenses / income from disposal of non-current assets and marketable securities 1,088 – 131
Changes in working capital 1,683 162
Cash flows from operating activities of continuing operations 5,012 1,171
Cash flows from operating activities of discontinued operations 14
Cash flows from operating activities 5,012 1,185
Cash flows from investing activities of continuing operations2 – 2,330 – 95
Cash flows from investing activities of discontinued operations – 21
Cash flows from investing activities – 2,330 – 116
Cash flows from financing activities of continuing operations – 458 – 807
Cash flows from financing activities of discontinued operations – 7
Cash flows from financing activities – 458 – 814
Net cash change in cash and cash equivalents 2,224 255
Effects of changes in foreign exchange rates and other changes in value on cash and cash equivalents 45 – 80
Net change in cash and cash equivalents 2,269 175
Cash and cash equivalents at beginning of reporting period 4,774 3,212
of which: reported as ‘Assets held for sale’ 20
Cash and cash equivalents at beginning of reporting period as per the consolidated balance sheet 4,774 3,192
Cash and cash equivalents at end of reporting period 7,043 3,387
of which: reported as ‘Assets held for sale’ 6
Cash and cash equivalents at end of reporting period as per the consolidated balance sheet 7,043 3,381
1 Some prior-year figures restated due to a retroactive change in the recognition of renewable tax benefits in the USA (see commentary on page 35 et seqq.).2 After the initial / subsequent transfer to plan assets in the amount of €1,091 million (prior-year period: €98 million).
33
1RWE on the capital market
3Responsibility statement
2Combined review of operations
5Review report
4Interim consolidated financial statements (condensed)Cash flow statement
6Financial calendar 2021 / 2022
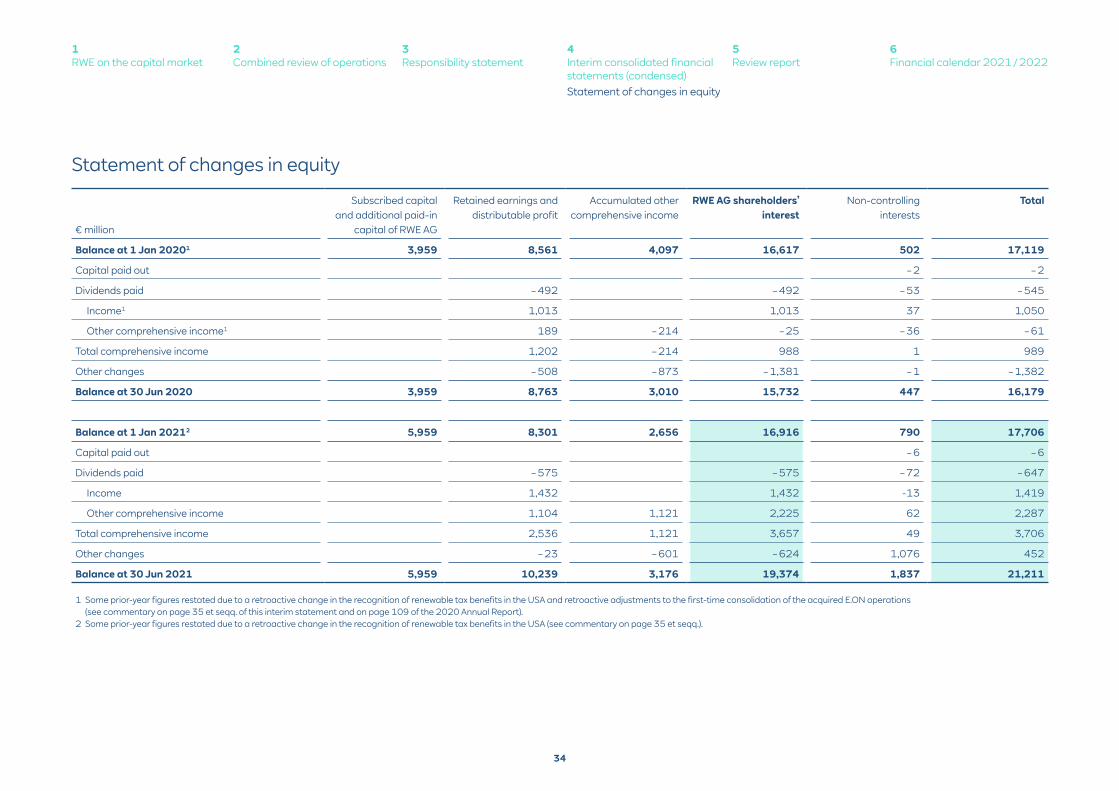
Statement of changes in equity
€ million
Subscribed capital and additional paid-in
capital of RWE AG
Retained earnings and distributable profit
Accumulated other comprehensive income
RWE AG shareholders’ interest
Non-controlling interests
Total
Balance at 1 Jan 20201 3,959 8,561 4,097 16,617 502 17,119
Capital paid out – 2 – 2
Dividends paid – 492 – 492 – 53 – 545
Income1 1,013 1,013 37 1,050
Other comprehensive income1 189 – 214 – 25 – 36 – 61
Total comprehensive income 1,202 – 214 988 1 989
Other changes – 508 – 873 – 1,381 – 1 – 1,382
Balance at 30 Jun 2020 3,959 8,763 3,010 15,732 447 16,179
Balance at 1 Jan 20212 5,959 8,301 2,656 16,916 790 17,706
Capital paid out – 6 – 6
Dividends paid – 575 – 575 – 72 – 647
Income 1,432 1,432 -13 1,419
Other comprehensive income 1,104 1,121 2,225 62 2,287
Total comprehensive income 2,536 1,121 3,657 49 3,706
Other changes – 23 – 601 – 624 1,076 452
Balance at 30 Jun 2021 5,959 10,239 3,176 19,374 1,837 21,211
1 Some prior-year figures restated due to a retroactive change in the recognition of renewable tax benefits in the USA and retroactive adjustments to the first-time consolidation of the acquired E.ON operations (see commentary on page 35 et seqq. of this interim statement and on page 109 of the 2020 Annual Report).
2 Some prior-year figures restated due to a retroactive change in the recognition of renewable tax benefits in the USA (see commentary on page 35 et seqq.).
34
1RWE on the capital market
3Responsibility statement
2Combined review of operations
5Review report
4Interim consolidated financial statements (condensed)Statement of changes in equity
6Financial calendar 2021 / 2022
Notes
Accounting policies
RWE AG, headquartered in Essen, Germany, is the parent company of the RWE Group (‘RWE’ or ‘Group’).
The interim consolidated financial statements as of 30 June 2021, including the additional information
in the interim Group review of operations, have been prepared in accordance with the International
Financial Reporting Standards (IFRSs) applicable in the European Union (EU). The statements were
authorised for issue on 10 August 2021.
In line with IAS 34, the scope of reporting for the presentation of the interim consolidated financial
statements for the period ended 30 June 2021 was condensed compared with the scope applied to
the consolidated financial statements as of 31 December 2020. With the exception of the changes and
new rules described below, these interim consolidated financial statements were prepared using the
accounting policies applied in the consolidated financial statements for the period ended 31 December
2020. For further information, please see the Group’s 2020 Annual Report, which provides the basis for
this half-year financial report.
The discount rate applied to provisions for nuclear waste management is 0.0% (31 December 2020:
0.0%), and 2.1% (31 December 2020: 2.0%) for mining-related provisions. Provisions for pensions and
similar obligations are discounted at an interest rate of 1.1% in Germany and 1.9% abroad (31 Decem-
ber 2020: 0.8% and 1.3%, respectively).
Changes in accounting regulations
The International Accounting Standards Board (IASB) has approved several amendments to existing
IFRSs, which are effective for the RWE Group as of fiscal 2021, due to EU endorsement:
• Amendments to IFRS 4 Deferral of IFRS 9 (2020),
• Amendments to IAS 39, IFRS 4, IFRS 7, IFRS 9 and IFRS 16 Interest Rate Benchmark Reform
(Phase 2) (2020).
These new policies do not have any material effects on the RWE Group’s consolidated financial state-
ments.
Changes to the accounting of tax benefits in relation to tax equity contracts. At the start of
fiscal 2021, RWE changed the accounting policy on certain tax benefits (so-called ‘tax benefits’) in
relation to tax equity contracts in the USA. These tax benefits, which mainly stem from the option of
accelerated depreciation, are a component of the subsidy system for renewables in the USA, which is
based on tax incentives (see page 37 of the 2020 Annual Report). With tax equity contracts, tax benefits
are transferred to the tax equity investor for partial interest and capital repayments of the amount
provided to RWE.
In the past, tax benefits were reported in taxes on income. With this change to the accounting policy,
since 2021 the transfer of tax benefits to the tax equity investor is recognised as a process that is similar
to a sales transaction.
35
1RWE on the capital market
3Responsibility statement
2Combined review of operations
5Review report
4Interim consolidated financial statements (condensed)Notes
6Financial calendar 2021 / 2022
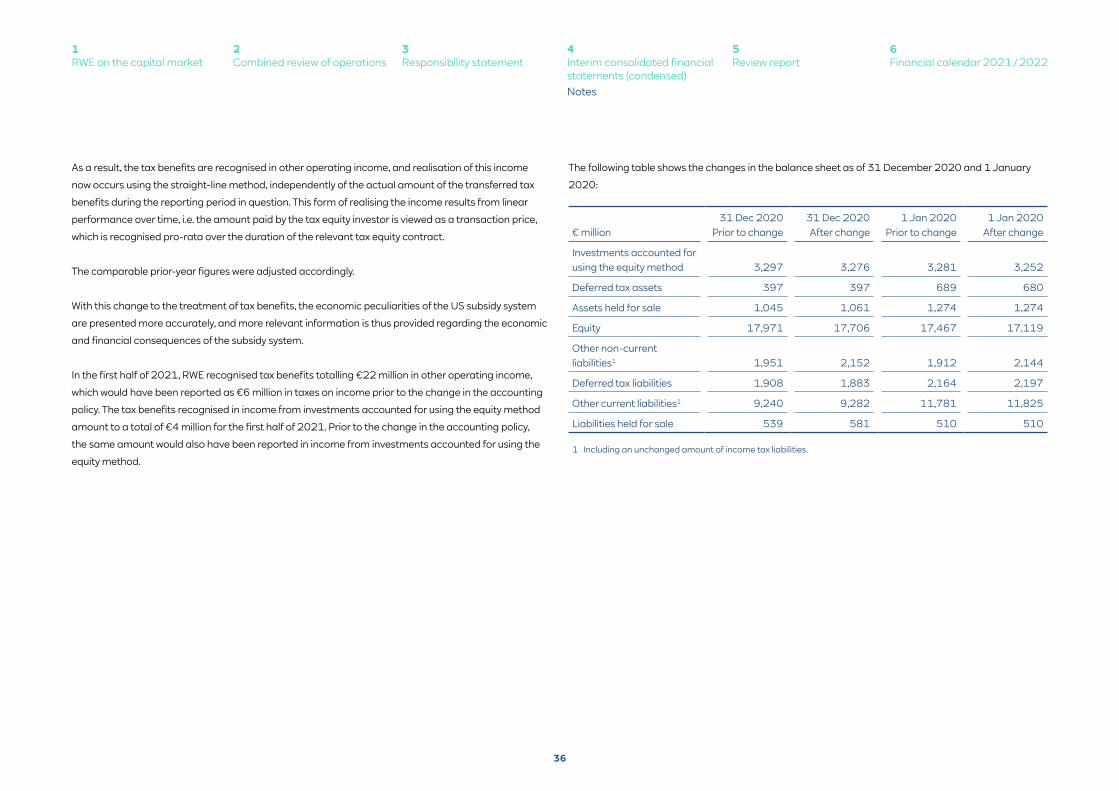
As a result, the tax benefits are recognised in other operating income, and realisation of this income
now occurs using the straight-line method, independently of the actual amount of the transferred tax
benefits during the reporting period in question. This form of realising the income results from linear
performance over time, i.e. the amount paid by the tax equity investor is viewed as a transaction price,
which is recognised pro-rata over the duration of the relevant tax equity contract.
The comparable prior-year figures were adjusted accordingly.
With this change to the treatment of tax benefits, the economic peculiarities of the US subsidy system
are presented more accurately, and more relevant information is thus provided regarding the economic
and financial consequences of the subsidy system.
In the first half of 2021, RWE recognised tax benefits totalling €22 million in other operating income,
which would have been reported as €6 million in taxes on income prior to the change in the accounting
policy. The tax benefits recognised in income from investments accounted for using the equity method
amount to a total of €4 million for the first half of 2021. Prior to the change in the accounting policy,
the same amount would also have been reported in income from investments accounted for using the
equity method.
The following table shows the changes in the balance sheet as of 31 December 2020 and 1 January
2020:
€ million31 Dec 2020
Prior to change31 Dec 2020 After change
1 Jan 2020 Prior to change
1 Jan 2020 After change
Investments accounted for using the equity method 3,297 3,276 3,281 3,252
Deferred tax assets 397 397 689 680
Assets held for sale 1,045 1,061 1,274 1,274
Equity 17,971 17,706 17,467 17,119
Other non-current liabilities1 1,951 2,152 1,912 2,144
Deferred tax liabilities 1,908 1,883 2,164 2,197
Other current liabilities1 9,240 9,282 11,781 11,825
Liabilities held for sale 539 581 510 510
1 Including an unchanged amount of income tax liabilities.
36
1RWE on the capital market
3Responsibility statement
2Combined review of operations
5Review report
4Interim consolidated financial statements (condensed)Notes
6Financial calendar 2021 / 2022
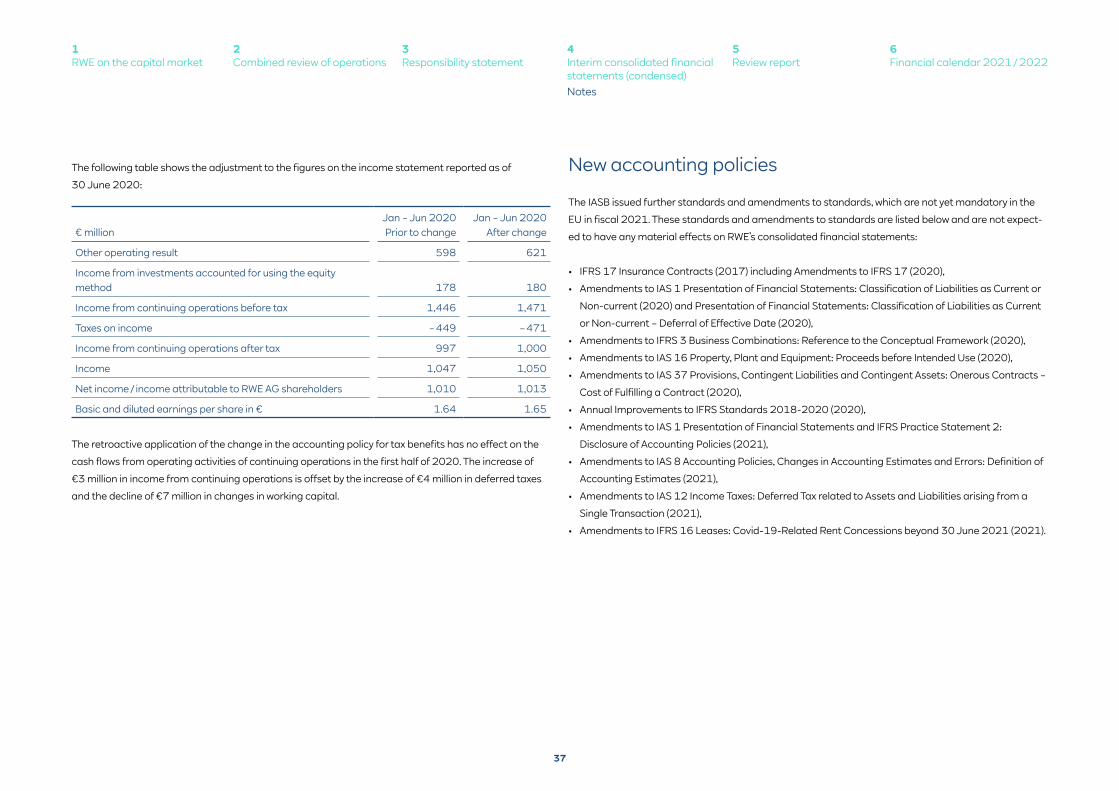
The following table shows the adjustment to the figures on the income statement reported as of
30 June 2020:
€ million Jan – Jun 2020
Prior to change Jan – Jun 2020
After change
Other operating result 598 621
Income from investments accounted for using the equity method 178 180
Income from continuing operations before tax 1,446 1,471
Taxes on income – 449 – 471
Income from continuing operations after tax 997 1,000
Income 1,047 1,050
Net income / income attributable to RWE AG shareholders 1,010 1,013
Basic and diluted earnings per share in € 1.64 1.65
The retroactive application of the change in the accounting policy for tax benefits has no effect on the
cash flows from operating activities of continuing operations in the first half of 2020. The increase of
€3 million in income from continuing operations is offset by the increase of €4 million in deferred taxes
and the decline of €7 million in changes in working capital.
New accounting policies
The IASB issued further standards and amendments to standards, which are not yet mandatory in the
EU in fiscal 2021. These standards and amendments to standards are listed below and are not expect-
ed to have any material effects on RWE’s consolidated financial statements:
• IFRS 17 Insurance Contracts (2017) including Amendments to IFRS 17 (2020),
• Amendments to IAS 1 Presentation of Financial Statements: Classification of Liabilities as Current or
Non-current (2020) and Presentation of Financial Statements: Classification of Liabilities as Current
or Non-current – Deferral of Effective Date (2020),
• Amendments to IFRS 3 Business Combinations: Reference to the Conceptual Framework (2020),
• Amendments to IAS 16 Property, Plant and Equipment: Proceeds before Intended Use (2020),
• Amendments to IAS 37 Provisions, Contingent Liabilities and Contingent Assets: Onerous Contracts –
Cost of Fulfilling a Contract (2020),
• Annual Improvements to IFRS Standards 2018-2020 (2020),
• Amendments to IAS 1 Presentation of Financial Statements and IFRS Practice Statement 2:
Disclosure of Accounting Policies (2021),
• Amendments to IAS 8 Accounting Policies, Changes in Accounting Estimates and Errors: Definition of
Accounting Estimates (2021),
• Amendments to IAS 12 Income Taxes: Deferred Tax related to Assets and Liabilities arising from a
Single Transaction (2021),
• Amendments to IFRS 16 Leases: Covid-19-Related Rent Concessions beyond 30 June 2021 (2021).
37
1RWE on the capital market
3Responsibility statement
2Combined review of operations
5Review report
4Interim consolidated financial statements (condensed)Notes
6Financial calendar 2021 / 2022
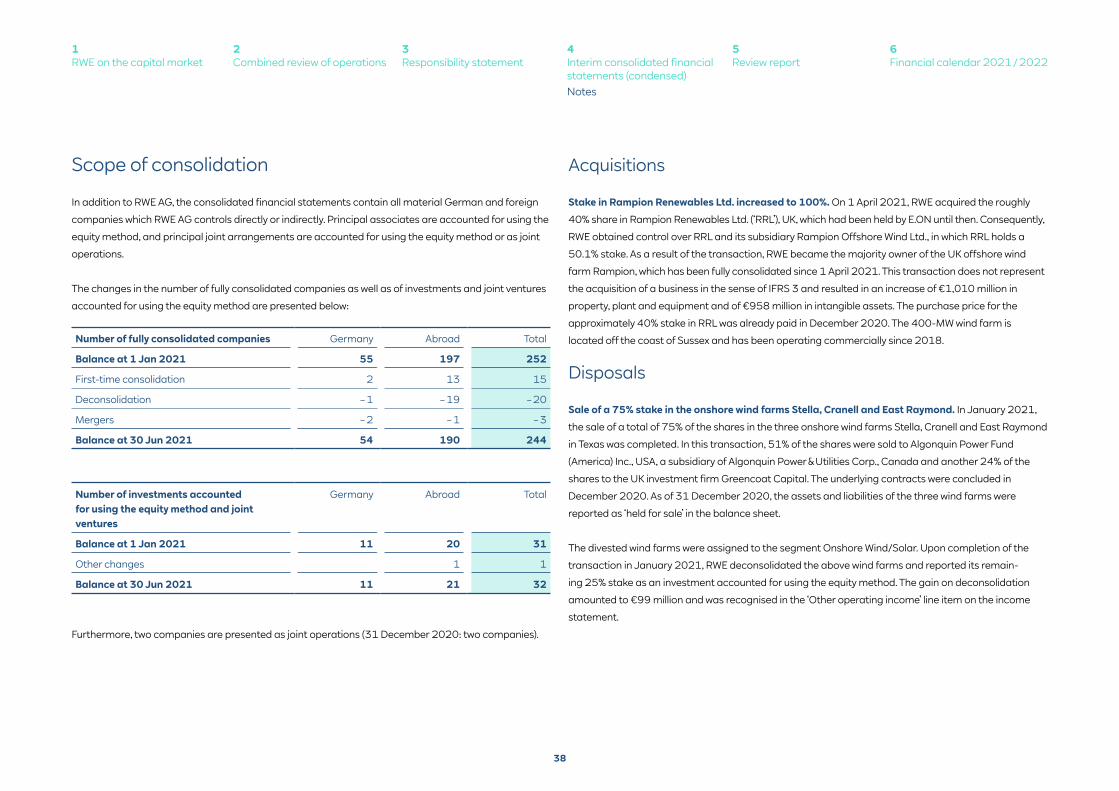
Scope of consolidation
In addition to RWE AG, the consolidated financial statements contain all material German and foreign
companies which RWE AG controls directly or indirectly. Principal associates are accounted for using the
equity method, and principal joint arrangements are accounted for using the equity method or as joint
operations.
The changes in the number of fully consolidated companies as well as of investments and joint ventures
accounted for using the equity method are presented below:
Acquisitions
Stake in Rampion Renewables Ltd. increased to 100%. On 1 April 2021, RWE acquired the roughly
40% share in Rampion Renewables Ltd. (‘RRL’), UK, which had been held by E.ON until then. Consequently,
RWE obtained control over RRL and its subsidiary Rampion Offshore Wind Ltd., in which RRL holds a
50.1% stake. As a result of the transaction, RWE became the majority owner of the UK offshore wind
farm Rampion, which has been fully consolidated since 1 April 2021. This transaction does not represent
the acquisition of a business in the sense of IFRS 3 and resulted in an increase of €1,010 million in
property, plant and equipment and of €958 million in intangible assets. The purchase price for the
approximately 40% stake in RRL was already paid in December 2020. The 400-MW wind farm is
located off the coast of Sussex and has been operating commercially since 2018.
Disposals
Sale of a 75% stake in the onshore wind farms Stella, Cranell and East Raymond. In January 2021,
the sale of a total of 75% of the shares in the three onshore wind farms Stella, Cranell and East Raymond
in Texas was completed. In this transaction, 51% of the shares were sold to Algonquin Power Fund
(America) Inc., USA, a subsidiary of Algonquin Power & Utilities Corp., Canada and another 24% of the
shares to the UK investment firm Greencoat Capital. The underlying contracts were concluded in
December 2020. As of 31 December 2020, the assets and liabilities of the three wind farms were
reported as ‘held for sale’ in the balance sheet.
The divested wind farms were assigned to the segment Onshore Wind/Solar. Upon completion of the
transaction in January 2021, RWE deconsolidated the above wind farms and reported its remain-
ing 25% stake as an investment accounted for using the equity method. The gain on deconsolidation
amounted to €99 million and was recognised in the ‘Other operating income’ line item on the income
statement.
Number of fully consolidated companies Germany Abroad Total
Balance at 1 Jan 2021 55 197 252
First-time consolidation 2 13 15
Deconsolidation – 1 – 19 – 20
Mergers – 2 – 1 – 3
Balance at 30 Jun 2021 54 190 244
Furthermore, two companies are presented as joint operations (31 December 2020: two companies).
Number of investments accounted for using the equity method and joint ventures
Germany Abroad Total
Balance at 1 Jan 2021 11 20 31
Other changes 1 1
Balance at 30 Jun 2021 11 21 32
38
1RWE on the capital market
3Responsibility statement
2Combined review of operations
5Review report
4Interim consolidated financial statements (condensed)Notes
6Financial calendar 2021 / 2022
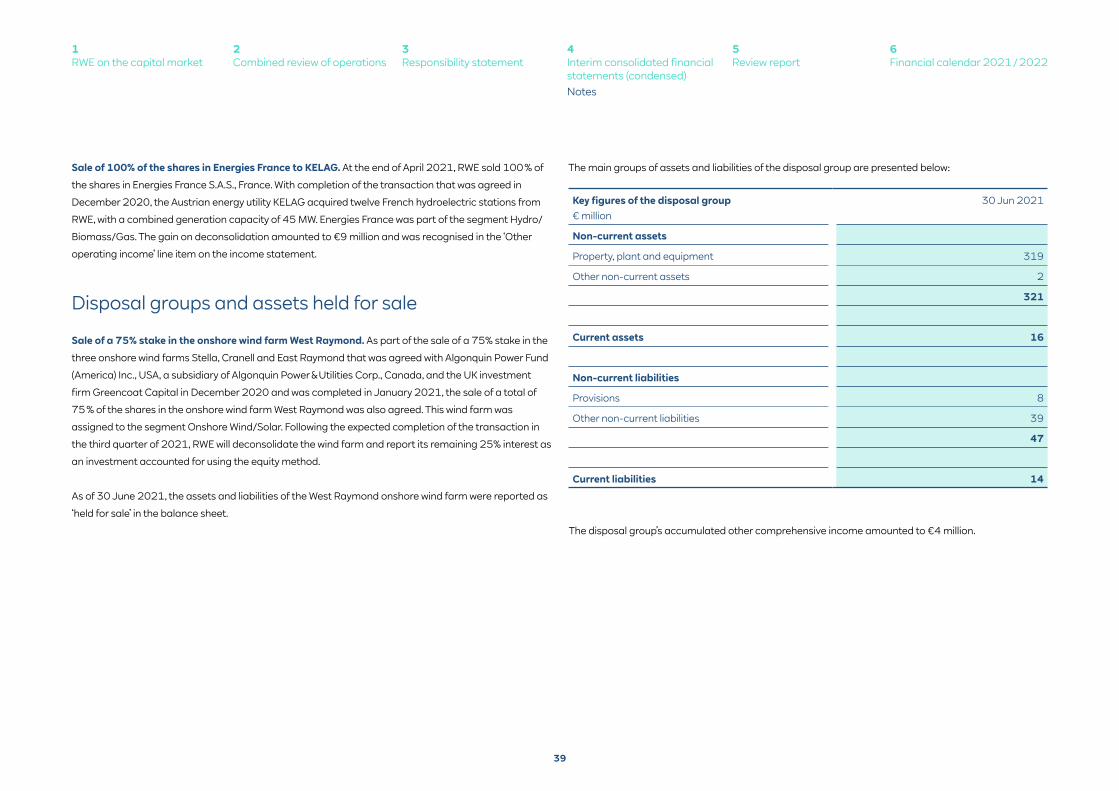
The main groups of assets and liabilities of the disposal group are presented below:Sale of 100% of the shares in Energies France to KELAG. At the end of April 2021, RWE sold 100 % of
the shares in Energies France S.A.S., France. With completion of the transaction that was agreed in
December 2020, the Austrian energy utility KELAG acquired twelve French hydroelectric stations from
RWE, with a combined generation capacity of 45 MW. Energies France was part of the segment Hydro/
Biomass/Gas. The gain on deconsolidation amounted to €9 million and was recognised in the ‘Other
operating income’ line item on the income statement.
Disposal groups and assets held for sale
Sale of a 75% stake in the onshore wind farm West Raymond. As part of the sale of a 75% stake in the
three onshore wind farms Stella, Cranell and East Raymond that was agreed with Algonquin Power Fund
(America) Inc., USA, a subsidiary of Algonquin Power & Utilities Corp., Canada, and the UK investment
firm Greencoat Capital in December 2020 and was completed in January 2021, the sale of a total of
75 % of the shares in the onshore wind farm West Raymond was also agreed. This wind farm was
assigned to the segment Onshore Wind/Solar. Following the expected completion of the transaction in
the third quarter of 2021, RWE will deconsolidate the wind farm and report its remaining 25% interest as
an investment accounted for using the equity method.
As of 30 June 2021, the assets and liabilities of the West Raymond onshore wind farm were reported as
‘held for sale’ in the balance sheet.
Key figures of the disposal group 30 Jun 2021€ million
Non-current assets
Property, plant and equipment 319
Other non-current assets 2
321
Current assets 16
Non-current liabilities
Provisions 8
Other non-current liabilities 39
47
Current liabilities 14
The disposal group’s accumulated other comprehensive income amounted to €4 million.
39
1RWE on the capital market
3Responsibility statement
2Combined review of operations
5Review report
4Interim consolidated financial statements (condensed)Notes
6Financial calendar 2021 / 2022
Sale of the grid connection for the Rampion offshore wind farm. In order to comply with competition
law requirements, RWE must sell the grid connection for the Rampion offshore wind farm, which has
been fully consolidated since 1 April 2021. Consequently, the carrying amount of the grid connection,
which consists exclusively of property, plant and equipment, is reported as ‘held for sale’ in the balance
sheet as of 30 June 2021, in the amount of €299 million. This asset held for sale is assigned to the
segment Offshore Wind. The sale is expected to be completed in the fourth quarter of 2021.
Share-based payment
The consolidated financial statements for the period ended 31 December 2020 presented the share-
based payment system for executives of RWE AG and subordinate affiliates. The plan conditions of the
Long-Term Incentive Plan for executives known as the Strategic Performance Plan (SPP) were adjusted
and extended for grants starting from fiscal 2021. In the future, share-based payments will orientate to
two more success factors in addition to the development of net income of relevance to remuneration:
the carbon footprint of our generation portfolio and the relative total shareholder return, which puts the
total return of the RWE share in relation to that of other European utility stocks. These three indicators
determine how many of the conditionally granted performance shares are finally granted at the end of
the performance period, which has been extended from the previous one year to three years according
to the new plan conditions. Once the period ends, all three success factors are given equal weight in
calculating the final grant. Thereafter, the performance shares must be held for a further year. Thus, the
vesting period will still be four years. For fiscal 2021, RWE AG issued another grant for executives based
on the new plan conditions.
Impairments
RWE has entered into long-term CO2 hedging transactions in order to hedge generation positions for its
lignite-fired power stations. As a result of the increase in CO2 prices, the fair value of these hedges has
risen sharply, leading to an improvement in equity (OCI). Conversely, the value of the lignite-fired plants
and opencast mines has declined. From an accounting perspective, the effects of the impairment (ex-
pense) and the increase in CO2 prices in OCI (income) essentially offset each other. In the segment Coal/
Nuclear, the impairment test for the cash-generating unit (CGU) Garzweiler resulted in a write-down of
€729 million on property, plant and equipment and €25 million on current assets (recoverable amount:
€0.1 billion). Additionally, impairments of €26 million on property, plant and equipment were recognised
outside of the Garzweiler CGU.
The recoverable amount as the fair value less costs to sell was determined using the same valuation
model and parameters as at 31 December 2020.
Dividend distribution
RWE AG’s Annual General Meeting, held on 28 April 2021, decided to pay a dividend of €0.85 per
dividend-bearing RWE share for fiscal 2020. The dividend payment for fiscal 2020 occurred on
3 May 2021 and totalled €575 million (previous year: €492 million).
Financing measures
RWE issued its first green corporate bond with a volume of €500 million and a 10-year maturity on
1 June 2021. Based on a coupon of 0.625% p.a. and an issue price of 99.711%, the yield-to-maturity
amounts to 0.655% p.a. In accordance with RWE’s guidelines for green bonds, the RWE Green Bond
Framework, the proceeds from the issue may only be used for the financing or refinancing of wind and
solar projects.
40
1RWE on the capital market
3Responsibility statement
2Combined review of operations
5Review report
4Interim consolidated financial statements (condensed)Notes
6Financial calendar 2021 / 2022
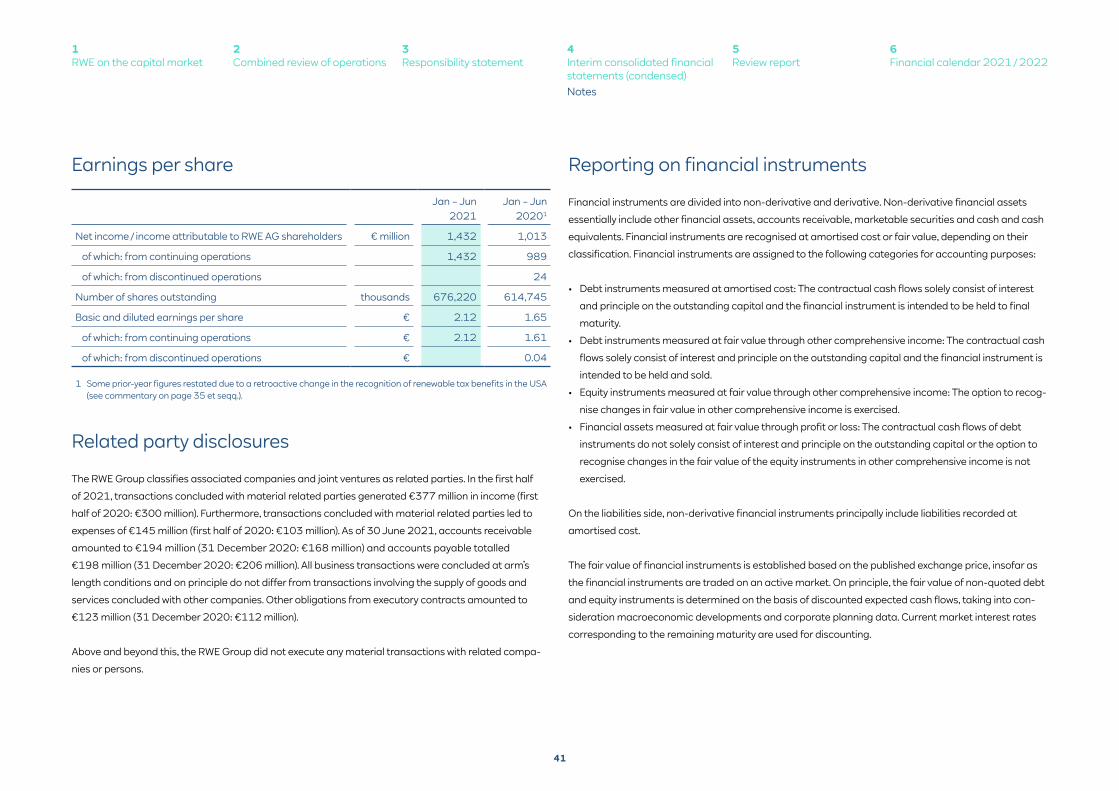
Earnings per share Reporting on financial instruments
Financial instruments are divided into non-derivative and derivative. Non-derivative financial assets
essentially include other financial assets, accounts receivable, marketable securities and cash and cash
equivalents. Financial instruments are recognised at amortised cost or fair value, depending on their
classification. Financial instruments are assigned to the following categories for accounting purposes:
• Debt instruments measured at amortised cost: The contractual cash flows solely consist of interest
and principle on the outstanding capital and the financial instrument is intended to be held to final
maturity.
• Debt instruments measured at fair value through other comprehensive income: The contractual cash
flows solely consist of interest and principle on the outstanding capital and the financial instrument is
intended to be held and sold.
• Equity instruments measured at fair value through other comprehensive income: The option to recog-
nise changes in fair value in other comprehensive income is exercised.
• Financial assets measured at fair value through profit or loss: The contractual cash flows of debt
instruments do not solely consist of interest and principle on the outstanding capital or the option to
recognise changes in the fair value of the equity instruments in other comprehensive income is not
exercised.
On the liabilities side, non-derivative financial instruments principally include liabilities recorded at
amortised cost.
The fair value of financial instruments is established based on the published exchange price, insofar as
the financial instruments are traded on an active market. On principle, the fair value of non-quoted debt
and equity instruments is determined on the basis of discounted expected cash flows, taking into con-
sideration macroeconomic developments and corporate planning data. Current market interest rates
corresponding to the remaining maturity are used for discounting.
Jan – Jun 2021
Jan – Jun 20201
Net income / income attributable to RWE AG shareholders € million 1,432 1,013
of which: from continuing operations 1,432 989
of which: from discontinued operations 24
Number of shares outstanding thousands 676,220 614,745
Basic and diluted earnings per share € 2.12 1.65
of which: from continuing operations € 2.12 1.61
of which: from discontinued operations € 0.04
1 Some prior-year figures restated due to a retroactive change in the recognition of renewable tax benefits in the USA (see commentary on page 35 et seqq.).
Related party disclosures
The RWE Group classifies associated companies and joint ventures as related parties. In the first half
of 2021, transactions concluded with material related parties generated €377 million in income (first
half of 2020: €300 million). Furthermore, transactions concluded with material related parties led to
expenses of €145 million (first half of 2020: €103 million). As of 30 June 2021, accounts receivable
amounted to €194 million (31 December 2020: €168 million) and accounts payable totalled
€198 million (31 December 2020: €206 million). All business transactions were concluded at arm’s
length conditions and on principle do not differ from transactions involving the supply of goods and
services concluded with other companies. Other obligations from executory contracts amounted to
€123 million (31 December 2020: €112 million).
Above and beyond this, the RWE Group did not execute any material transactions with related compa-
nies or persons.
41
1RWE on the capital market
3Responsibility statement
2Combined review of operations
5Review report
4Interim consolidated financial statements (condensed)Notes
6Financial calendar 2021 / 2022
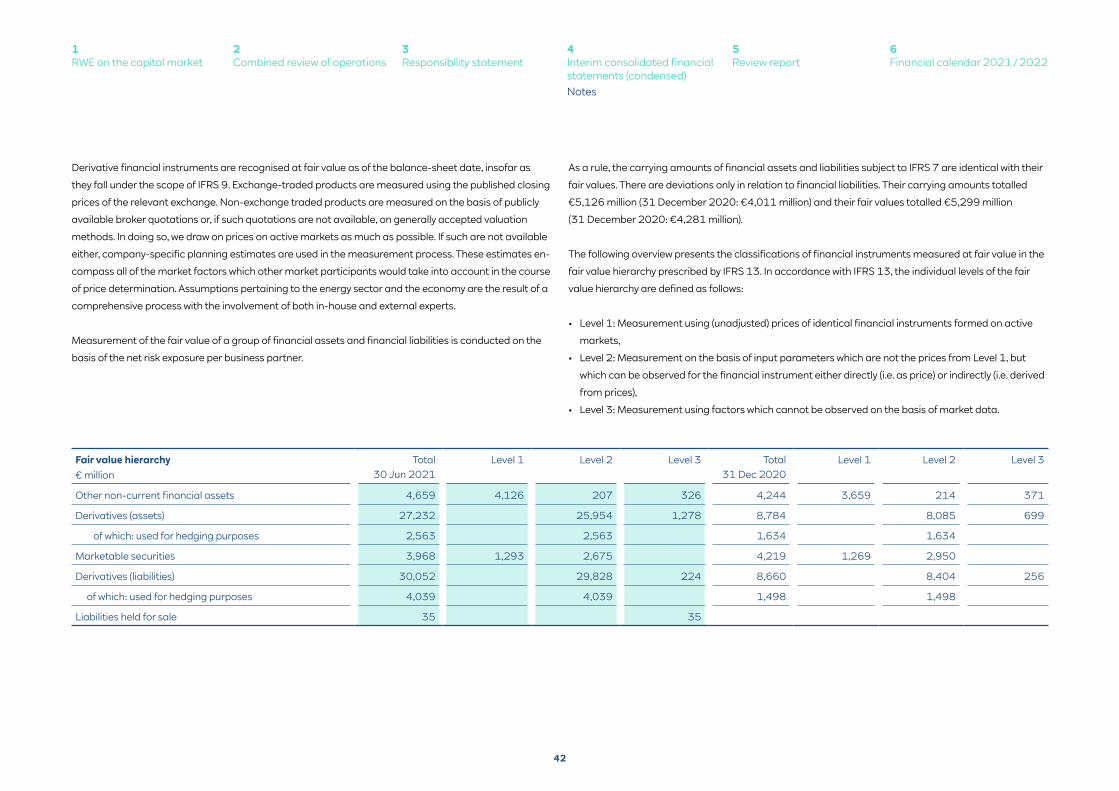
Derivative financial instruments are recognised at fair value as of the balance-sheet date, insofar as
they fall under the scope of IFRS 9. Exchange-traded products are measured using the published closing
prices of the relevant exchange. Non-exchange traded products are measured on the basis of publicly
available broker quotations or, if such quotations are not available, on generally accepted valuation
methods. In doing so, we draw on prices on active markets as much as possible. If such are not available
either, company-specific planning estimates are used in the measurement process. These estimates en-
compass all of the market factors which other market participants would take into account in the course
of price determination. Assumptions pertaining to the energy sector and the economy are the result of a
comprehensive process with the involvement of both in-house and external experts.
Measurement of the fair value of a group of financial assets and financial liabilities is conducted on the
basis of the net risk exposure per business partner.
Fair value hierarchy Total30 Jun 2021
Level 1 Level 2 Level 3 Total 31 Dec 2020
Level 1 Level 2 Level 3€ million
Other non-current financial assets 4,659 4,126 207 326 4,244 3,659 214 371
Derivatives (assets) 27,232 25,954 1,278 8,784 8,085 699
of which: used for hedging purposes 2,563 2,563 1,634 1,634
Marketable securities 3,968 1,293 2,675 4,219 1,269 2,950
Derivatives (liabilities) 30,052 29,828 224 8,660 8,404 256
of which: used for hedging purposes 4,039 4,039 1,498 1,498
Liabilities held for sale 35 35
As a rule, the carrying amounts of financial assets and liabilities subject to IFRS 7 are identical with their
fair values. There are deviations only in relation to financial liabilities. Their carrying amounts totalled
€5,126 million (31 December 2020: €4,011 million) and their fair values totalled €5,299 million
(31 December 2020: €4,281 million).
The following overview presents the classifications of financial instruments measured at fair value in the
fair value hierarchy prescribed by IFRS 13. In accordance with IFRS 13, the individual levels of the fair
value hierarchy are defined as follows:
• Level 1: Measurement using (unadjusted) prices of identical financial instruments formed on active
markets,
• Level 2: Measurement on the basis of input parameters which are not the prices from Level 1, but
which can be observed for the financial instrument either directly (i.e. as price) or indirectly (i.e. derived
from prices),
• Level 3: Measurement using factors which cannot be observed on the basis of market data.
42
1RWE on the capital market
3Responsibility statement
2Combined review of operations
5Review report
4Interim consolidated financial statements (condensed)Notes
6Financial calendar 2021 / 2022
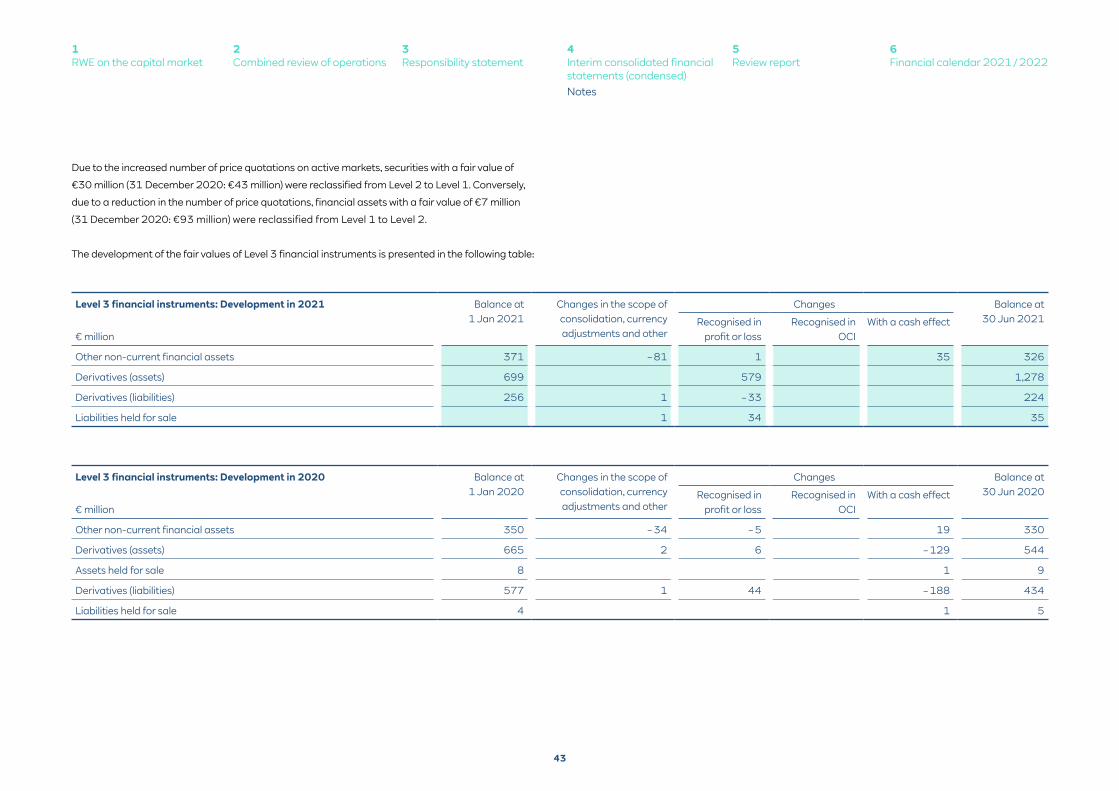
Due to the increased number of price quotations on active markets, securities with a fair value of
€30 million (31 December 2020: €43 million) were reclassified from Level 2 to Level 1. Conversely,
due to a reduction in the number of price quotations, financial assets with a fair value of €7 million
(31 December 2020: €93 million) were reclassified from Level 1 to Level 2.
The development of the fair values of Level 3 financial instruments is presented in the following table:
Level 3 financial instruments: Development in 2021 Balance at 1 Jan 2021
Changes in the scope of consolidation, currency adjustments and other
Changes Balance at 30 Jun 2021
€ millionRecognised in
profit or lossRecognised in
OCIWith a cash effect
Other non-current financial assets 371 – 81 1 35 326
Derivatives (assets) 699 579 1,278
Derivatives (liabilities) 256 1 – 33 224
Liabilities held for sale 1 34 35
Level 3 financial instruments: Development in 2020 Balance at 1 Jan 2020
Changes in the scope of consolidation, currency adjustments and other
Changes Balance at 30 Jun 2020
€ millionRecognised in
profit or lossRecognised in
OCIWith a cash effect
Other non-current financial assets 350 – 34 – 5 19 330
Derivatives (assets) 665 2 6 – 129 544
Assets held for sale 8 1 9
Derivatives (liabilities) 577 1 44 – 188 434
Liabilities held for sale 4 1 5
43
1RWE on the capital market
3Responsibility statement
2Combined review of operations
5Review report
4Interim consolidated financial statements (condensed)Notes
6Financial calendar 2021 / 2022
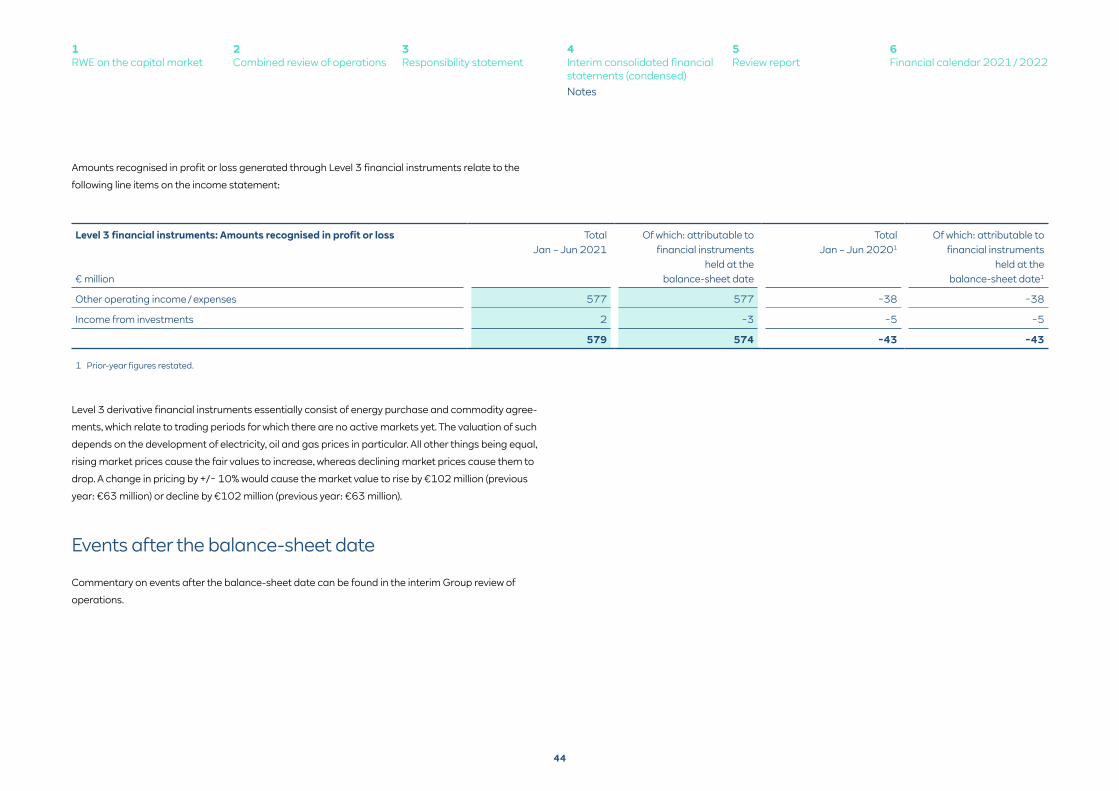
Amounts recognised in profit or loss generated through Level 3 financial instruments relate to the
following line items on the income statement:
Level 3 financial instruments: Amounts recognised in profit or loss
€ million
Total Jan – Jun 2021
Of which: attributable to financial instruments
held at the balance-sheet date
Total Jan – Jun 20201
Of which: attributable to financial instruments
held at the balance-sheet date1
Other operating income / expenses 577 577 −38 −38
Income from investments 2 −3 −5 −5
579 574 −43 −43
1 Prior-year figures restated.
Level 3 derivative financial instruments essentially consist of energy purchase and commodity agree-
ments, which relate to trading periods for which there are no active markets yet. The valuation of such
depends on the development of electricity, oil and gas prices in particular. All other things being equal,
rising market prices cause the fair values to increase, whereas declining market prices cause them to
drop. A change in pricing by +/− 10% would cause the market value to rise by €102 million (previous
year: €63 million) or decline by €102 million (previous year: €63 million).
Events after the balance-sheet date
Commentary on events after the balance-sheet date can be found in the interim Group review of
operations.
44
1RWE on the capital market
3Responsibility statement
2Combined review of operations
5Review report
4Interim consolidated financial statements (condensed)Notes
6Financial calendar 2021 / 2022
To RWE Aktiengesellschaft, Essen
We have reviewed the condensed consolidated interim financial statements – comprising the
condensed income statement, condensed statement of comprehensive income, condensed statement
of financial position, condensed statement of cash flows, condensed statement of changes in equity
and selected explanatory notes – and the interim group management report of RWE Aktiengesellschaft,
Essen, for the period from January 1, 2021 to June 30, 2021 which are part of the half-year financial
report pursuant to § (Article) 115 WpHG (“Wertpapierhandelsgesetz”: German Securities Trading Act). The
preparation of the condensed consolidated interim financial statements in accordance with the IFRS
applicable to interim financial reporting as adopted by the EU and of the interim group management
report in accordance with the provisions of the German Securities Trading Act applicable to interim
group management reports is the responsibility of the parent Company’s Board of Managing Directors.
Our responsibility is to issue a review report on the condensed consolidated interim financial statements
and on the interim group management report based on our review.
We conducted our review of the condensed consolidated interim financial statements and the interim
group management report in accordance with German generally accepted standards for the review of
financial statements promulgated by the Institut der Wirtschaftsprüfer (Institute of Public Auditors in
Germany) (IDW) and additionally observed the International Standard on Review Engagements “Review
of Interim Financial Information Performed by the Independent Auditor of the Entity” (ISRE 2410).
Those standards require that we plan and perform the review so that we can preclude through critical
evaluation, with moderate assurance, that the condensed consolidated interim financial statements
have not been prepared, in all material respects, in accordance with the IFRS applicable to interim
financial reporting as adopted by the EU and that the interim group management report has not
been prepared, in all material respects, in accordance with the provisions of the German Securities
Trading Act applicable to interim group management reports. A review is limited primarily to inquiries of
company personnel and analytical procedures and therefore does not provide the assurance attainable
in a financial statement audit. Since, in accordance with our engagement, we have not performed a
financial statement audit, we cannot express an audit opinion.
Review report
Based on our review, no matters have come to our attention that cause us to presume that the
condensed consolidated interim financial statements have not been prepared, in all material respects,
in accordance with the IFRS applicable to interim financial reporting as adopted by the EU nor that the
interim group management report has not been prepared, in all material respects, in accordance with
the provisions of the German Securities Trading Act applicable to interim group management reports.
Essen, 10 August 2021
PricewaterhouseCoopers GmbH
Wirtschaftsprüfungsgesellschaft
(sign. Markus Dittmann) (sign. Aissata Touré)
Wirtschaftsprüfer Wirtschaftsprüferin
(German Public Auditor) (German Public Auditor)
Translation - the German text is authoritative
45
1RWE on the capital market
3Responsibility statement
2Combined review of operations
5Review report
4Interim consolidated financial statements (condensed)
6Financial calendar 2021 / 2022
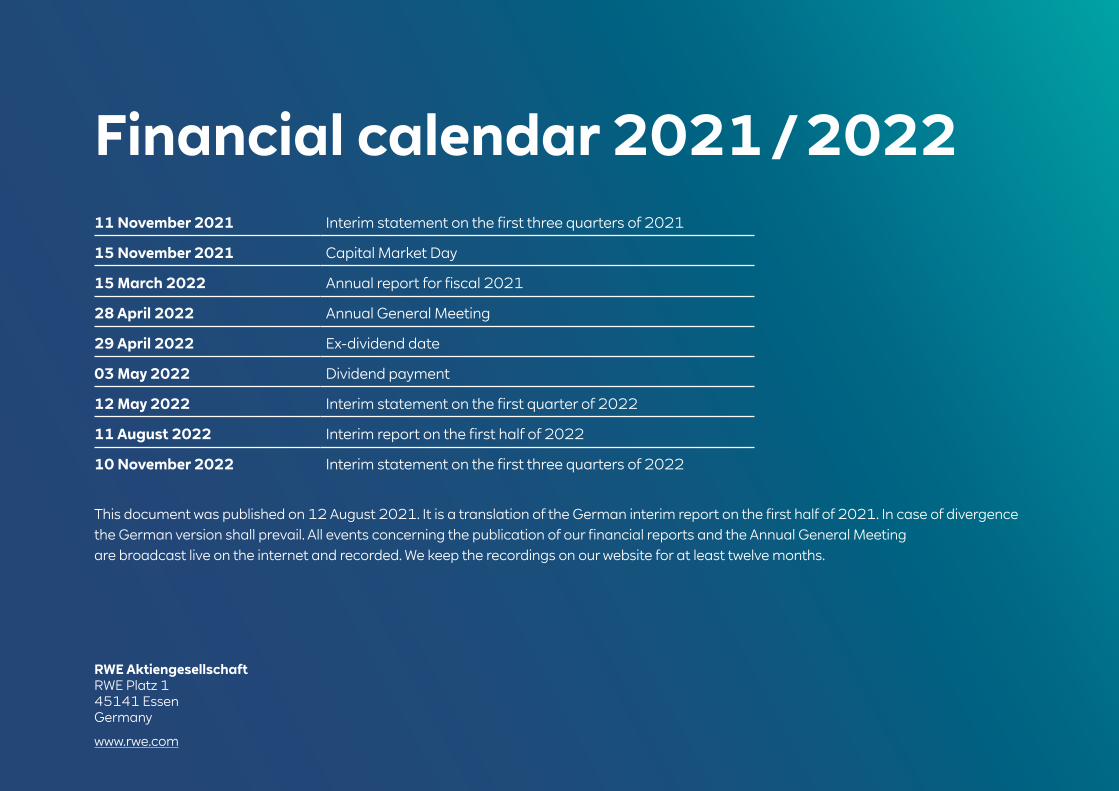
Financial calendar 2021 / 2022
RWE AktiengesellschaftRWE Platz 145141 EssenGermany
www.rwe.com
11 November 2021 Interim statement on the first three quarters of 2021
15 November 2021 Capital Market Day
15 March 2022 Annual report for fiscal 2021
28 April 2022 Annual General Meeting
29 April 2022 Ex-dividend date
03 May 2022 Dividend payment
12 May 2022 Interim statement on the first quarter of 2022
11 August 2022 Interim report on the first half of 2022
10 November 2022 Interim statement on the first three quarters of 2022
This document was published on 12 August 2021. It is a translation of the German interim report on the first half of 2021. In case of divergencethe German version shall prevail. All events concerning the publication of our financial reports and the Annual General Meetingare broadcast live on the internet and recorded. We keep the recordings on our website for at least twelve months.