Embed Size (px)
Citation preview

July 2008
This report is in the publ ic domain. Authorizat ion to reproduce i t in whole or inpart is granted.
While permission to reprint this publ icat ion is not necessary , the ci tat ion shouldbe: Interagency Task Force on Commodity Markets , Inter im Report on Crude Oi l ,Washington D.C.
Al l photographs in this document are proprietary and prior permiss ion from thephotographer is required for any use or reproduct ion of the photographs.

TABLE OF CONTENTS LIST OF FIGURES.......................................................................................................................................................................... II
INTRODUCTION...........................................................................................................................................................................1
EXECUTIVE SUMMARY ................................................................................................................................................................3
FUNDAMENTALS OF CRUDE OIL. . . . . . . . . . . . . . . . . . . . . . . . . . . . . . . . . . . . . . . . . . . . . . . . . . . . . . . . . . . . . . . . . . . . . . . . . . . . . 7
BACKGROUND ............................................................................................................................................................................7
DEMAND.....................................................................................................................................................................................7
Global Economic Activity ...............................................................................................................................................7 Increasing Consumption................................................................................................................................................8 Price Controls and Subsidies .........................................................................................................................................9
SUPPLY...................................................................................................................................................................................... 10
Stagnant Production .................................................................................................................................................... 10 Concentrated Spare Capacity .................................................................................................................................... 11 Low Inventories ............................................................................................................................................................. 12 Geopolitical Uncertainty.............................................................................................................................................. 13
PRICE-INELASTIC SUPPLY AND DEMAND ................................................................................................................................ 14
MACROECONOMIC VARIABLES............................................................................................................................................... 14
Exchange Rates.............................................................................................................................................................. 14 Interest Rates................................................................................................................................................................... 15
COMMODITY FUTURES MARKETS . . . . . . . . . . . . . . . . . . . . . . . . . . . . . . . . . . . . . . . . . . . . . . . . . . . . . . . . . . . . . . . . . . . . . . . . . . 17
THE ROLE OF COMMODITY FUTURES MARKETS .................................................................................................................... 17
Futures Contract Design, Risk Management, and Price Discovery................................................................. 17 Hedging and Speculation........................................................................................................................................... 17 Publicly Available Information about U.S. Futures Markets.............................................................................. 19
ANALYSIS OF CRUDE OIL FUTURES MARKETS ........................................................................................................................ 20
Broad Trends in the Participant Structure of Crude Oil Futures Markets ..................................................... 20 Detailed Structure of Crude Oil Futures Markets ................................................................................................. 21 Term Structure of Futures Prices ............................................................................................................................... 23 Speculators and Market Prices: Assessing Contemporaneous Relations..................................................... 25 Speculators and Market Prices: Assessing Dynamic Relations ........................................................................ 27
CONCLUDING REMARKS . . . . . . . . . . . . . . . . . . . . . . . . . . . . . . . . . . . . . . . . . . . . . . . . . . . . . . . . . . . . . . . . . . . . . . . . . . . . . . . . . . . . . . . . 31
APPENDIX . . . . . . . . . . . . . . . . . . . . . . . . . . . . . . . . . . . . . . . . . . . . . . . . . . . . . . . . . . . . . . . . . . . . . . . . . . . . . . . . . . . . . . . . . . . . . . . . . . . . . . . . . . . . . . 33
GRANGER CAUSALITY TESTS ................................................................................................................................................... 33
GLOSSARY OF FUTURES MARKETS TERMS . . . . . . . . . . . . . . . . . . . . . . . . . . . . . . . . . . . . . . . . . . . . . . . . . . . . . . . . . . . . 35
i

List of Figures Figure 1 World GDP and Oil Production............................................................................................................................7
Figure 2 Oil Intensity.................................................................................................................................................................8
Figure 3 Annual Growth in World Oil Consumption .....................................................................................................9
Figure 4 Oil Consumption Growth by Country from 2003 to 2008 ..........................................................................9
Figure 5 Non-OPEC Supply Growth.................................................................................................................................. 10
Figure 6 Increasing Reliance on OPEC Production ...................................................................................................... 11
Figure 7 Lower Surplus World Oil Production Capacity ............................................................................................. 12
Figure 8 OECD Commercial Stocks ................................................................................................................................... 13
Figure 9 Oil Prices and Exchange Rates........................................................................................................................... 15
Figure 10 WTI Average Open Interest by Non-Commerical Participants, 2003-2008....................................... 21
Figure 11 WTI Average Open Interest by Commercial Participants, 2003-2008................................................. 22
Figure 12 WTI Net Positions of Commercial Participants, January 2003 to June 2008 .................................... 23
Figure 13 Term Structure of Crude Oil Prices................................................................................................................. 24
Figure 14 Private Crude Oil and Petroleum Product Inventories ............................................................................. 25
Figure 15 Correlations between Changes in Prices and Changes in Net Positions ........................................... 26
Figure 16 Granger Causality Tests relating Daily Position Changes to Price Changes in the NYMEX WTI Crude Oil Futures Contract from January 2000 to June 2008............................................... 28
ii

ITF Interim Report on Crude Oil
Introduction The prices of crude oil and other commodities have become a key concern of consumers, businesses, and policymakers in the United States and abroad. In light of the challenges posed by high commodity prices, several Federal agencies are engaged in the analysis of developments in commodity markets. In an effort to develop, consolidate, and disseminate this knowledge, the Commodity Futures Trading Commission (CFTC or Commission) invited staff from several Federal agencies to participate in an Interagency Task Force on Commodity Markets (Task Force or ITF). The other Task Force participants include staff from the Departments of Agriculture, Energy, and the Treasury, the Board of Governors of the Federal Reserve System, the Federal Trade Commission, and the Securities & Exchange Commission.1 Each of these agencies brings unique experience and expertise to bear on the analysis of commodity markets. The Task Force is chaired by CFTC staff, which has responsibility for overseeing the U.S. commodity futures and commodity options markets. The Task Force is examining conditions in the commodity markets and will report further on its work later this year. Given the intense interest generated by the recent surge in crude oil prices, the Task Force is issuing an interim staff report limited to the crude oil market. This staff report is preliminary in nature, and the Task Force will continue to study the crude oil market as part of its longer-term activities. We hereby submit the Interagency Task Force’s Interim Report on Crude Oil.
1 Although the staff from these agencies participated in the Task Force, agency principals, Commissions, and Commissioners did not specifically authorize or vote to approve the findings of this interim report.
Introduction 1

ITF Interim Report on Crude Oil
Executive Summary In June 2008, the Commodity Futures Trading Commission (CFTC or Commission) formed an Interagency Task Force on Commodity Markets (Task Force or ITF). The Task Force draws on a broad range of government expertise on the fundamental factors and market forces affecting commodity markets. In light of the recent increases in energy prices and the resulting concerns of the public and policymakers, the Task Force has prepared this interim report on crude oil, which offers a preliminary assessment of fundamental and market factors affecting the crude oil market between January 2003 and June 2008. The Task Force’s preliminary assessment is that current oil prices and the increase in oil prices between January 2003 and June 2008 are largely due to fundamental supply and demand factors. During this same period, activity on the crude oil futures market – as measured by the number of contracts outstanding, trading activity, and the number of traders – has increased significantly. While these increases broadly coincided with the run-up in crude oil prices, the Task Force’s preliminary analysis to date does not support the proposition that speculative activity has systematically driven changes in oil prices. The world economy has expanded at its fastest pace in decades, and that strong growth has translated into substantial increases in the demand for oil, particularly from emerging market countries. On the supply side, the production of oil has responded sluggishly, compounded by production shortfalls associated with geopolitical unrest in countries with large oil reserves. As it is very difficult to rely on substitutes for oil in the short term, very large price increases have occurred as the market balances supply and demand. If a group of market participants has systematically driven prices, detailed daily position data should show that that group’s position changes preceded price changes. The Task Force’s preliminary analysis, based on the evidence available to date, suggests that changes in futures market participation by speculators have not systematically preceded price changes. On the contrary, most speculative traders typically alter their positions following price changes, suggesting that they are responding to new information – just as one would expect in an efficiently operating market. The Task Force will continue to develop its analysis of crude oil and expand its work to cover other commodities in the coming months. New data from the CFTC’s Special Calls on the activities of commodity swap dealers and commodity index traders is expected to become available for review during this time. In addition, an examination of prices in other commodities is expected to further enhance understanding of commodity markets.
Fundamentals and Crude Oil Prices
On the demand side, world economic activity has expanded at close to 5 percent per year since 2004, marking the strongest performance in two decades. Between 2004 and 2007, global oil consumption grew by 3.9 percent, driven largely by rising demand in emerging markets that are both growing rapidly and shifting toward oil-intensive activities. Also, some of the fastest growing nations also rely on price subsidies that hold down the prices of oil and refined products such as gasoline, which further boosts oil consumption. While global demand has proven strong, oil production growth has not kept pace. In the past three years, non-Organization of Petroleum Exporting Countries (OPEC) production growth has slowed to levels well
Executive Summary 3
ITF Interim Report on Crude Oil
below historical averages, and world surplus capacity has fallen below historical norms. Preliminary inventory data also shows that Organisation for Economic Co-operation and Development (OECD) stocks have fallen below 1996-2002 levels. Moreover, supply disruptions have adversely affected both world oil production and exports. The imbalance between scarce supply and growing demand, and expectations that this imbalance will persist in the future, have led to upward pressure on oil prices and greater market reactions to any actual or perceived disruptions in available supply. Under such tight market conditions, it is often the case that only large price increases can re-establish equilibrium between supply and demand. Consequently, large or rapid movements in oil prices are not inconsistent with the fundamentals of supply and demand; such price movements, by themselves, do not indicate that prices have become divorced from fundamentals. Further, if speculative positions, rather than fundamentals, were pushing prices upward, then inventories would be expected to rise. To date, there is no evidence of such an accumulation; in fact, known inventory levels actually have declined.
Analysis of Crude Oil Futures Markets
Activity in crude oil futures and options contracts has been increasing since 2004. During that period, the number of contracts outstanding (known as “open interest”) has more than tripled, and the number of traders has almost doubled. The fastest growth in open interest has been recorded among non-commercial traders – often called “speculators” – holding spread positions combining long positions in one month with short positions in another month. Thus, while the long positions of non-commercial traders have increased, the short positions of non-commercial traders also have increased. Additionally, although the net long positions of non-commercial traders have increased somewhat since 2004 – which some market observers have hypothesized has pushed prices up – the proportion of those positions has been relatively constant as a share of open interest over the last few years, undercutting that hypothesis. Much of the attention related to participants in futures markets has focused on the role of commodity index investment funds and the commodity swap dealers that often act as their intermediaries. During the period studied, January 2003 through June 2008, pension funds and other investors have increasingly used index funds as vehicles to participate in commodity markets. Some observers have suggested that this rapid inflow of investments through index funds has been a cause of oil price increases. The CFTC has issued Special Calls for data about this activity, but only partial responses have been received as of the date of publication of this interim report. An analysis of the data from these Special Calls will be made available in September. The data currently at hand – which incorporates non-public surveillance information – includes positions held by commodity swap dealers. Commodity swap dealers offer institutional investors contracts whose returns are linked to a variety of commodity indices. Broadly speaking, after netting their index fund clients’ positions against the positions of their other clients, these dealers use futures contracts to hedge the risk remaining from this business. Thus, the activity of commodity index participants should become evident in the position changes of commodity swap dealers. Non-public CFTC trading data shows that commodity swap dealers have held roughly balanced long and short positions in the crude oil market over the last year and actually held a net short position over the first five months of 2008 – that is, swap dealers’ futures positions would have benefited more from price decreases than from price increases like the ones experienced in the last few months. Moreover, any
Executive Summary 4

ITF Interim Report on Crude Oil
upward price pressure exerted by the long positions of swap dealers’ commodity index clients has largely been offset by the short positions of the dealers’ other clients. The Task Force’s preliminary analysis also suggests that changes in the positions of swap dealers and non-commercial traders most often followed price changes. This result does not support the hypothesis that the activity of these groups is driving prices higher. The Task Force has found that the activity of market participants often described as “speculators” has not resulted in systematic changes in price over the last five and a half years. On the contrary, most speculative traders typically alter their positions following price changes, suggesting that they are responding to new information – just as one would expect in an efficiently operating market. In particular, the positions of hedge funds appear to have moved inversely with the preceding price changes, suggesting instead that their positions might have provided a buffer against volatility-inducing shocks. The Task Force will continue working on the analysis of commodity markets and issue further findings later this year.2
2 Matters of illegal manipulation of commodity prices are outside the scope of this interim report.
Executive Summary 5


ITF Interim Report on Crude Oil
Fundamentals of Crude Oil Background Recent crude oil price increases are an extension of oil market developments originating in the 1990s. At that time, relatively high inventories and ample surplus production capacity served to limit oil price fluctuations. When spot market prices moved up or down, futures contracts requiring delivery in distant months generally traded close to $20 per barrel, consistent with a market expectation that producers would ensure that spot prices would eventually return to that level. However, as leading OPEC members shifted toward a tight inventory policy and global oil demand recovered from the slowing effect of Asia’s financial crisis, the global market balance tightened and inventories declined sharply at the beginning of the present decade. Oil prices rose to $30 per barrel in what might be seen as the first leg of the upward trend. By 2003, inventories were drawn down sufficiently such that subsequent increases in global demand stretched oil production to levels near capacity. The large, unexpected jump in world oil consumption growth in 2004, fostered by strong growth in economic activity in Asia, reduced excess production capacity significantly. Now, in mid-2008, despite high prices, world oil consumption growth remains strong, overall non-OPEC production growth continues to slow, and OPEC oil production has not grown sufficiently to fill the gap. In addition, geopolitical risks create considerable uncertainty about future supplies.
Demand Global Economic Activity
The key driver of oil demand has been robust global economic growth, particularly in emerging market economies. As shown in Figure 1, world gross domestic product (GDP) growth (with countries weighted by oil consumption shares) has averaged close to 5 percent per year since 2004, marking the strongest performance in two decades. Figure 1 World GDP and Oil Product on i
Fundamentals of Crude Oil 7

ITF Interim Report on Crude Oil
In addition to the pace of world economic activity, oil demand has been further supported by thecomposition of growth across countries. As shown in Figure 2, China, India, and the Middle East usesubstantially more oil to produce a dollar’s worth of real output than the United States. These economiesare among the fastest growing in the world; together they have accounted for nearly two-thirds of the risein world oil consumption since 2004. Moreover, these economies still consume relatively little oil on a per capita basis. Over the longer term, as these economies continue to develop and incomes rise, percapita energy use is likely to increase further.
Figure 2 O l Intensityi
Increasing Consumption
The rise in global economic activity has been accompanied by corresponding growth in world oilconsumption. Since 2003, world oil consumption growth has averaged 1.8 percent per year, representingan estimated 1 million barrels per day in 2008. Non-member countries of the OECD, especially China,India, and the Middle East, represent the largest part of this growth. (Figures 3 and 4) Despite higherprices, growth in world oil consumption remains strong.
Fundamentals of Crude Oil 8

ITF Interim Report on Crude Oil
Figure 3 Annual Growth in World O l Consumptioni
Figure 4 O l Consumption Growth by Country from 2003 to 2008i
Price Controls and Subsidies
Many emerging market and developing economies use subsidies and other administrative measures tocontrol domestic fuel prices. These administered prices are generally set below global market prices and,therefore, artificially boost the demand for oil. Indeed, essentially all of the increase in global oil consumption this year is expected to be in countries where fuel prices are subsidized and demand is not
Fundamentals of Crude Oil 9

ITF Interim Report on Crude Oil
fully responsive to price signals. Price controls and subsidies interfere with the economic link betweenmarket prices and consumption.
SupplyStagnant Production
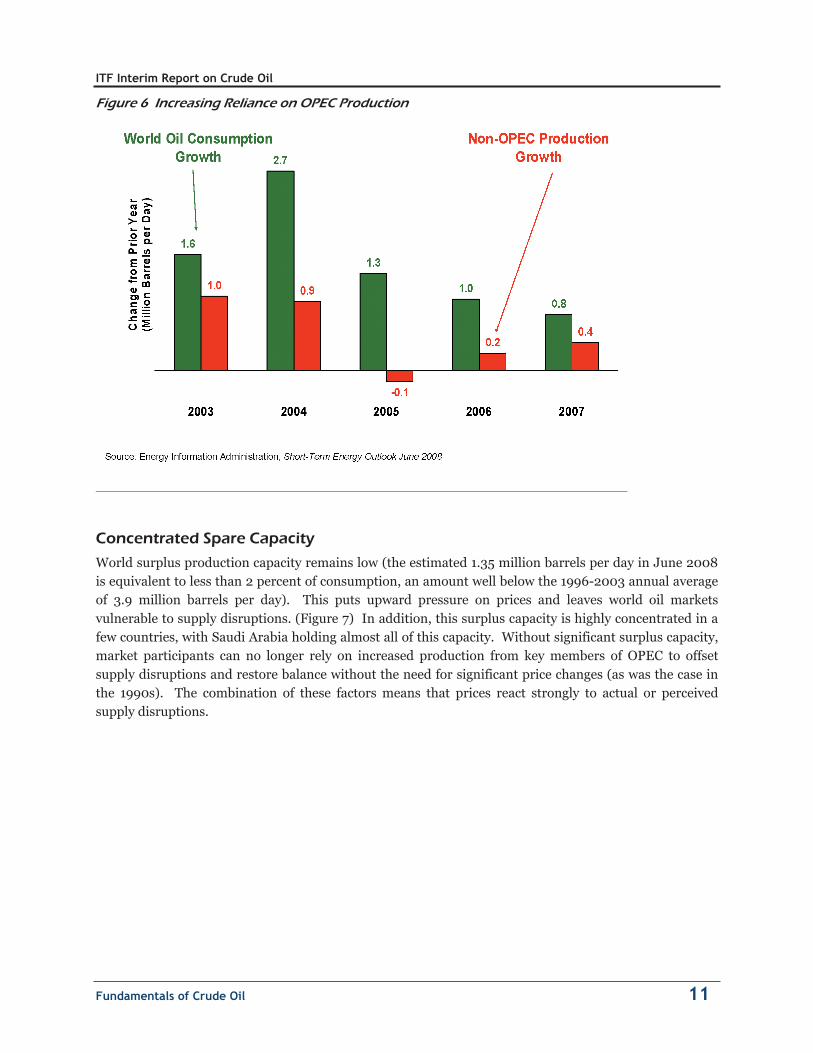
While global demand has remained strong, overall non-OPEC production growth has slowed. In the pastthree years, non-OPEC production growth has been well below rates seen earlier this decade. World oil consumption growth has simply outpaced non-OPEC production growth every year since 2003. This imbalance increases reliance upon OPEC production and/or inventories to fill the gap. However, since2003, OPEC oil production has grown by only 2.4 million barrels per day while the “call on OPEC” (defined as the difference between world consumption and non-OPEC production) increased by 4.4 million barrels per day. As a result, the world oil market balance has tightened significantly. (Figures 5and 6)
Figure 5 Non-OPEC Supply Growth
Fundamentals of Crude Oil 10
ITF Interim Report on Crude Oil
Figure 6 Increas ng Reliance on OPEC Productioni
Concentrated Spare Capacity
World surplus production capacity remains low (the estimated 1.35 million barrels per day in June 2008is equivalent to less than 2 percent of consumption, an amount well below the 1996-2003 annual averageof 3.9 million barrels per day). This puts upward pressure on prices and leaves world oil markets vulnerable to supply disruptions. (Figure 7) In addition, this surplus capacity is highly concentrated in afew countries, with Saudi Arabia holding almost all of this capacity. Without significant surplus capacity,market participants can no longer rely on increased production from key members of OPEC to offsetsupply disruptions and restore balance without the need for significant price changes (as was the case in the 1990s). The combination of these factors means that prices react strongly to actual or perceivedsupply disruptions.
Fundamentals of Crude Oil 11

ITF Interim Report on Crude Oil
Figure 7 Lower Surplus World Oil Production Capacity
Low Inventories
OECD stocks were at record lows in 2003, following a major strike by oil workers in Venezuela. (Figure 8) Preliminary OECD inventory data for the first part of 2008 shows that OECD stocks have again fallenbelow levels seen in 1996-2002. Because oil use has been growing over time, inventories are even tighterwhen considered on a “days of supply” basis (defined as dividing inventories by the level of consumption).In addition, U.S. inventories for crude oil and key petroleum products are relatively low. After remainingrelatively high for much of 2006 and the first half of 2007, U.S. crude oil inventories have fallen towardthe bottom end of the average range. Crude oil and petroleum product stocks in other OECD regionsexhibit the same declining trend.
Fundamentals of Crude Oil 12

ITF Interim Report on Crude Oil
Figure 8 OECD Commercial Stocks
Geopolitical Uncertainty
There is currently a high degree of uncertainty in world oil markets due to fears about the adequacy of oil supplies in the future. Current world oil supplies are highly concentrated, and much of those supplies are held by nations that limit access to private investment, thereby preventing full development of productionthrough enhanced expertise and technology. In 2007, the top 10 oil producers represented about half oftotal world production. In addition, geopolitical risk surrounds many of these top producers, eitherbecause of current supply disruptions (Iraq, Nigeria) or the perceived threat of a disruption (Iran,Venezuela). Finally, as noted previously, there is little surplus production capacity available to offset anydisruption.
Supply disruptions are a frequent occurrence in the oil industry. During the past 24 months, there have been almost two dozen supply disruptions, lasting from a few days to many weeks, which affected worldoil production and exports. These disruptions were caused by power failures, worker strikes, pipeline leaks and explosions, cyclones and hurricanes, saboteurs, and civil wars. More than half of thesedisruptions resulted in oil production outages exceeding 100,000 barrels per day. The most significant of these to oil markets resulted from the ongoing strife in Iraq and Nigeria. These disruptions have varied in size over time, with Iraq losing more than 500,000 barrels per day of exports in March 2008 and Nigeria reaching more than 1.4 million barrels per day of shut-in production at one point in April 2008.
Actual supply disruptions directly affect world oil markets due to a loss of physical barrels available to themarket. Concern over the impact of potential supply disruptions is reinforced by the limited amount of spare production capacity available. As long as potential disruptions, either realized (as in Iraq and
Fundamentals of Crude Oil 13

ITF Interim Report on Crude Oil
Nigeria) or perceived (as in concerns about the potential loss of supply from Iran), exceed the amount of additional production capacity that can be brought online quickly, geopolitical concerns will weigh heavily on oil markets.
Price-Inelastic Supply and Demand The current short-run demand for oil is relatively price inelastic, meaning the quantity demanded does not change much relative to price changes (it takes a very large price increase to reduce the quantity demanded significantly). In the short run, the supply of oil is inelastic as well: the quantity supplied is not responsive to changes in market price, due to low spare capacity, the inability to bring new supplies online quickly, and relatively low inventories to draw down. If both supply and demand are not very responsive to prices, it takes large price increases to return markets to equilibrium if they get out of balance temporarily. As noted previously, world oil production has remained relatively flat in recent years as global economic growth has kept demand strong. Consequently, oil prices have risen to keep world oil consumption in line with production (the two must be equal aside from changes in inventories). As oil demand is very insensitive to moves in oil prices in the near term, the rise in oil prices has been disproportionately large in order to offset the robust, income-driven rise in demand. An implication of these structural features of the oil market is that large and rapid movements in oil prices are not, by themselves, evidence that prices are behaving in a manner that is inconsistent with the fundamentals of demand and supply. Indeed, in such tight market conditions, relatively small changes in demand and supply should be expected to lead to large price swings. That said, there is a certain degree of uncertainty regarding the true state of market fundamentals at any point in time.
Macroeconomic Variables Exchange Rates
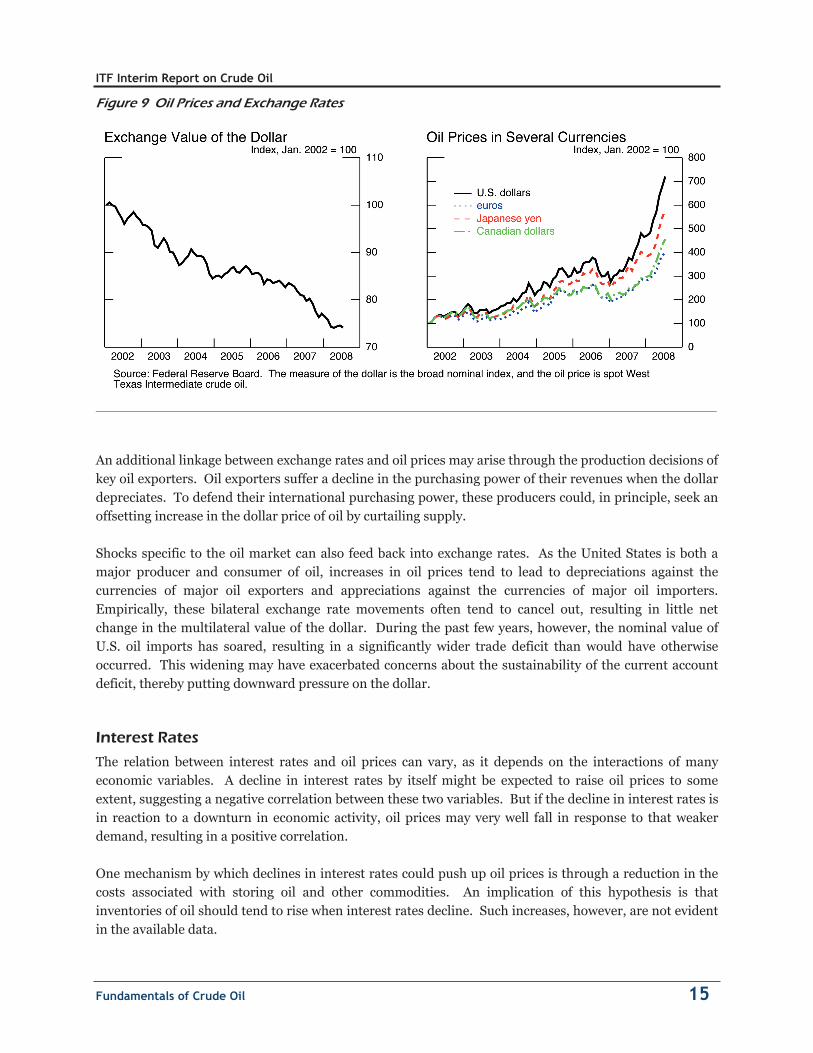
The relationship between exchange rates and oil prices is complex, and the causality can run both from exchange rates to oil prices and from oil prices to exchange rates. Typically, a depreciation of the dollar would be expected to lead to a rise in the dollar price of oil. As oil is priced in dollars, a lower exchange value of the dollar reduces the foreign-currency price and thus boosts demand. To clear the market, the dollar price of oil must then rise, assuming (reasonably) that supply is not perfectly elastic. Empirical studies do not reveal a clear, precisely estimated relationship between oil prices and the exchange value of the dollar. The available evidence suggests that oil prices respond approximately proportionately to changes in the dollar when all other economic factors are held constant. In other words, a 10 percent depreciation of the nominal, trade-weighted, multilateral exchange value of the dollar is associated with a 10 percent rise in the dollar price of oil when other factors are held constant. That finding suggests that the depreciation of the dollar since 2002 has contributed to the rise of the dollar price of oil, but can explain only a portion of the overall run-up. This point is also evident in Figure 9, which graphs the spot price of West Texas Intermediate crude oil in several currencies. Clearly, oil prices have risen sharply regardless of the currency of denomination. Moreover, from mid-March through June 2008, the dollar was stable, whereas oil prices increased appreciably.
Fundamentals of Crude Oil 14
ITF Interim Report on Crude Oil
Figure 9 O l Prices and Exchange Ratesi
An additional linkage between exchange rates and oil prices may arise through the production decisions of key oil exporters. Oil exporters suffer a decline in the purchasing power of their revenues when the dollardepreciates. To defend their international purchasing power, these producers could, in principle, seek anoffsetting increase in the dollar price of oil by curtailing supply.
Shocks specific to the oil market can also feed back into exchange rates. As the United States is both amajor producer and consumer of oil, increases in oil prices tend to lead to depreciations against thecurrencies of major oil exporters and appreciations against the currencies of major oil importers. Empirically, these bilateral exchange rate movements often tend to cancel out, resulting in little netchange in the multilateral value of the dollar. During the past few years, however, the nominal value ofU.S. oil imports has soared, resulting in a significantly wider trade deficit than would have otherwiseoccurred. This widening may have exacerbated concerns about the sustainability of the current accountdeficit, thereby putting downward pressure on the dollar.
Interest Rates
The relation between interest rates and oil prices can vary, as it depends on the interactions of manyeconomic variables. A decline in interest rates by itself might be expected to raise oil prices to someextent, suggesting a negative correlation between these two variables. But if the decline in interest rates is in reaction to a downturn in economic activity, oil prices may very well fall in response to that weakerdemand, resulting in a positive correlation.
One mechanism by which declines in interest rates could push up oil prices is through a reduction in thecosts associated with storing oil and other commodities. An implication of this hypothesis is thatinventories of oil should tend to rise when interest rates decline. Such increases, however, are not evidentin the available data.
Fundamentals of Crude Oil 15

ITF Interim Report on Crude Oil
Another channel through which lower U.S. interest rates could drive up oil prices is by leading to excessively expansionary policies and faster increases in oil demand in countries that peg their currencies to or manage their currencies against the dollar. In the current setting, the stance of monetary policy in the United States, which has come in response to concerns about the domestic economic outlook, may not be appropriate for many fast-growing, commodity-intensive economies. In practice, however, much uncertainty surrounds the extent to which foreign central banks have matched U.S. monetary policy moves, the effect of this on foreign economic growth, and its ultimate influence on commodity prices.
Fundamentals of Crude Oil 16

ITF Interim Report on Crude Oil
Commodity Futures Markets 17
Commodity Futures Markets The Role of Commodity Futures Markets Futures Contract Design, Risk Management, and Price Discovery3
A futures contract is an agreement between two parties to buy and sell a given amount of a commodity at an agreed upon date in the future, at an agreed upon price and at a given location. For example, the New York Mercantile Exchange (NYMEX) West Texas Intermediate (WTI) December 2008 oil contract is an agreement to deliver 1000 barrels (42 thousand gallons) of oil at Cushing, Oklahoma during December 2008. The buyer (or long trader) and the seller (or short trader) agree to a price when they enter into the contract. Unless offset, these contracts require their counterparties to deliver or to take physical delivery of a commodity.4 A party whose contract remains open at its expiration date is obligated to make or take delivery as promised. Futures contracts are instruments primarily designed to manage risk - they are identical in all aspects except for the contracted price; they are generally traded on exchanges; cleared through designated clearinghouses; and often may be settled in cash rather than requiring physical delivery. Due to their standardization, crude oil futures contracts are not generally suited to allocate the physical commodity. For example, to serve a mainly allocative role, crude oil futures contracts would need to offer multiple locations for physical delivery. In fact, between 2003 and May 2008, only about 2 percent of oil futures contracts resulted in physical delivery. Because futures contracts are standardized in all respects other than price, futures markets are ideal for aggregating a multiplicity of opinions about the expected price of a commodity at different points in time. It is often easier for a common view on an expected price to emerge at a futures exchange than among dispersed producers and consumers of a physical (cash) commodity. For that reason, futures markets are an important source of price information - prices are often said to be “discovered” in futures markets and then communicated to participants in certain cash markets. The price discovery function of futures markets is extremely valuable in terms of planning business activities and for allocating commodity price risk. The availability of publicly-observed futures prices for several years into the future makes it possible to recognize, plan, and finance needed adjustments in supply and demand early on. This, in turn, may help reduce price volatility. For example, price volatility is generally higher in markets without a successful futures contract, such as those for fertilizers, coal, tea, and onions. For example, while onion futures contracts are explicitly banned by law, it has been reported that cash prices for onions rose 400 percent between October 2006 and April 2007, fell 96 percent by March 2008, and then rebounded 300 percent by April 2008. Hedging and Speculation
The distinction between hedging and speculation in futures markets is less clear than it may appear. Traditionally, those with a commercial interest in or an exposure to a physical commodity have been called hedgers, while those without such an exposure have been called speculators. In practice, however,
3 Glossary of Futures Markets Terms is provided at the end of this report. 4 Not all futures contracts require physical delivery.
ITF Interim Report on Crude Oil
Commodity Futures Markets 18
hedgers may be “taking a view” on the price of a commodity, and even those who are not participating in the futures market despite having an exposure to the commodity could be considered speculators. Traditional speculators enter into futures contracts with the intention of reversing their positions before they would be required to deliver (short positions) or to accept physical delivery (long positions) of a commodity. As such, speculators serve important market functions – immediacy of execution, liquidity, and information aggregation. Traditional speculators could further be differentiated depending on the time horizons during which they operate. Speculators known as scalpers or market makers operate at the shortest time horizon – sometimes trading within seconds. These traders typically do not trade with a view as to where prices are going. Instead, they provide immediacy of execution to others wishing to trade. That is, they “make markets” by standing ready to buy or sell at a moment’s notice. These market makers will usually offset their positions soon after entering into them. The goal of a market maker is to buy contracts at slightly lower prices than the current market price and sell them at slightly higher prices, perhaps at only a fraction of a cent profit on each contract. By trading hundreds or even thousands of contacts a day, skilled market makers can earn a profit. Absent a market maker, a market participant would have to wait until the arrival of another party with an opposite trading interest. Other types of speculators take longer term positions based on their view of where prices may be headed. These speculators may anticipate price trends lasting from minutes or hours to days, weeks or months and take positions accordingly. At the monthly horizon, these speculators often trade in the futures markets with spread positions—taking long positions in one month while taking short positions in another. Through their efforts to gather information on underlying commodities, the activity of these traders serves to bring information to the markets and aid in price discovery. These speculators are also important to the market in that they often supply overall liquidity to hedgers in futures market. While hedgers are not generally associated with price discovery activities, these commercial interests often do play an important price discovery role. In essence, futures prices are a consensus of the opinions of those who enter the market. Moreover, the actions of those who choose not to enter the futures market are also quite important for price discovery. For example, a commercial trader holding physical inventory, but choosing not to hedge this inventory with a short position in the futures market, will withhold a downward pressure on the price. Futures markets are not the only way for traders to manage exposure to commodities. Crude oil options on futures can also be used to manage crude oil exposures. In fact, traders who combine options and futures positions can speculate on price ranges and volatility changes in addition to the direction of expected futures price changes. A robust over-the-counter (OTC) market exists to trade oil contracts as well. Activities that occur in the OTC market can affect U.S. futures markets as well. Intermediaries in the OTC market often use futures contracts to manage the price exposures inherent in their OTC activities, for instance. Commodity swap dealers, in particular, offer complex and tailored swap contracts to clients in the OTC markets. As intermediaries, these swap dealers can often offset the long positions of one client with the short positions of another client. Where mismatches exist, however, the swap dealer may be exposed to price risk as the counterparty to an unmatched trade. In these instances, swap dealers increasingly look to the futures

ITF Interim Report on Crude Oil
Commodity Futures Markets 19
markets to manage this risk. Indeed, for this reason, the CFTC has long considered swap dealers as hedgers in the futures markets. Publicly Available Information about U.S. Futures Markets
To provide the public with information on the activity of traders in the futures and options markets, the CFTC publishes a weekly Commitments of Traders (COT) report. The report is released every Friday at 3:30 p.m. Eastern time and contains a summary of traders’ positions as of the close of business on the previous Tuesday for each market in which 20 or more traders hold positions equal to or above the large trader reporting levels established by the CFTC.5 The summary of market activity contained in the weekly COT reports is available in a variety of formats—i.e., long and short format, as well as in futures-only and futures-and-options-combined format—and are available on the CFTC’s website. Beginning in 2007, the CFTC also began publishing a supplemental report for selected agricultural markets showing all the information in the short format report plus the positions of traders classified as “index traders.” These supplemental reports have been produced specifically to shed light on index trader activity in the U.S. futures markets. The CFTC recognizes the value of increased transparency as financial entities increasingly participate in commodity markets.6
The information regarding the reportable positions of traders contained in the COT reports is drawn from the reports that the CFTC receives daily from clearing members, futures commission merchants, and foreign brokers. If, at the daily market close, a reporting firm has a trader with a position at or above the CFTC’s reporting level in any single futures month or option expiration, the firm reports that trader’s entire position in all futures and options expiration months in that commodity, regardless of size. The aggregate of all traders’ positions reported to the CFTC usually represents 70 to 90 percent of the total open interest in any given market. From time to time, the CFTC will raise or lower the reporting levels in specific markets to strike a balance between collecting sufficient information to oversee the markets and minimizing the reporting burden on the futures industry. During the past five years, the COT reports for crude oil capture well over 90 percent of total open interest. When an individual reportable trader is identified to the CFTC, the trader is classified either as “commercial” or “non-commercial.” All of a trader’s reported futures positions in a commodity are classified as commercial if the trader uses futures contracts in that particular commodity for hedging as defined in CFTC regulations. Generally, this definition reflects a matching of a futures position with a commercial market risk and does not consider the motivation for entering into a hedge. A trading entity generally gets classified as a “commercial” trader by filing a statement with the CFTC, on a standard reporting form, that it is commercially “…engaged in business activities hedged by the use of the futures or option markets.” To ensure that traders are classified with accuracy and consistency, CFTC staff may exercise judgment in re-classifying a trader if it has additional information about the trader’s use of the markets.7
5 Reporting levels can be found in CFTC regulations and can be accessed from the CFTC’s website, www.cftc.gov. 6 For more information on the CFTC’s Supplemental report see, “Commodity Futures Trading Commission: Commission Actions in Response to the ‘Comprehensive Review of the Commitments of Traders Reporting Program’ (June 21, 2006),” available at the CFTC’s website, www.cftc.gov. 7 The analysis in this report is based on data updated through July 18, 2008.
ITF Interim Report on Crude Oil
Commodity Futures Markets 20
A trader may be classified as a commercial trader in some commodities and as a non-commercial trader in other commodities. A single trading entity cannot be classified as both a commercial and non-commercial trader in the same commodity. Nonetheless, a multi-functional organization that has more than one trading entity may have each trading entity classified separately in a commodity. For example, a financial organization trading financial futures may have a banking entity whose positions are classified as commercial and have a separate money-management entity whose position are classified as non-commercial. In classifying traders as commercial or non-commercial rather than hedgers and speculators, the CFTC recognizes that the ultimate motivations for trading futures by commercial and non-commercial traders cannot be observed. That is, while a commercial trader may be matching a futures position against a cash market price risk, it is not known whether such a trader is doing so on a routine basis in order to minimize ongoing price risks or doing so selectively based on specific market expectations. Thus, some of the trading information captured by the commercial trading category may reflect activity that could be characterized more as speculative rather than hedging.
Analysis of Crude Oil Futures Markets8
Broad Trends in the Participant Structure of Crude Oil Futures Markets
According to the publicly-available Commitments of Traders (COT) reports, activity in the West Texas Intermediate (WTI) light sweet crude oil contracts has grown markedly since 2000. In the last three and a half years alone, open interest across all available contract maturities (the number of contracts open at the end of each day) in WTI futures and futures-equivalent (or “adjusted”) option contracts traded on the New York Mercantile Exchange (NYMEX) has more than tripled from around 900,000 contracts in January 2004 to more than 2.9 million contracts in June 2008. During the same period, the number of large traders has also grown – almost doubling since January 2004, from approximately 220 to just under 400 reporting traders. These figures speak to the competitiveness and depth of the crude oil futures markets in the U.S. The COT reports also present the breakdown of the overall open interest between commercial and non-commercial traders grouped into long, short, and spread positions. While all types of positions have grown during the last three and a half years, the COT data suggests that it is the spread positions of non-commercial traders that have had the fastest growth rate. While overall open interest has tripled since 2004, non-commercial spread positions have increased six-fold. Notably, spread positions involve long positions in one month combined with short positions in another month so that spread traders are speculating on differences between futures prices in different months rather than the overall price level of crude oil. Since 2004, both the long and short positions of non-commercial traders have increased. Over that time period, the positions of non-commercial traders have been net long and have also increased; however, the proportion of those positions has been relatively constant as a share of open interest over the last few
8 This section largely summarizes findings in an upcoming CFTC research paper analyzing changes in the level and composition of end-of-day open interest in the U.S. crude oil futures market. See Büyükşahin, Haigh, Harris, Overdahl and Robe: “Market Growth and Trader Participation in Futures Markets,” CFTC – Office of the Chief Economist Working Paper, forthcoming, August 2008.

ITF Interim Report on Crude Oil
years, undercutting the hypothesis that an increase in the net long positions by non-commercial traders has pushed prices up recently.
Detailed Structure of Crude Oil Futures Markets
Whereas the publicly available data only identifies “commercial” and “non-commercial” categories of participants in the crude oil futures market, the COT report is built upon confidential CFTC data collected for market surveillance purposes that allows for a more precise categorization. For both analytical and presentational purposes, this confidential data was aggregated into broad sub-categories. Sub-categories for commercial participants include commercial producers, commercial manufacturers, commercial dealers, and swap dealers. Sub-categories for non-commercial participants include hedge funds and floor brokers and traders. These six commercial and non-commercial sub-categories account for approximately 80 percent of open interest in the crude oil futures market. Figures 10 and 11 show that the increases in both commercial and non-commercial activity, as previously summarized in publicly available COT data, are broad-based. Among the non-commercial participants, both hedge funds and floor brokers and traders exhibit robust growth in open interest.
Figure 10 WTI Average Open Interest by Non-Commer cal Participants, 2003-2008 i
2003 2004 2005 2006 2007 2008
Floor Brokers & Traders
Hedge Funds-
250,000
500,000
750,000
1,000,000
Source: Büyüksahin et al, CFTC, 2008
Source: Büyüksahin et al, CFTC, 2008
Among commercial traders, much of the growth in open interest comes from greater activity by two categories – commodity swap dealers and commercial dealers. While commercial dealers utilize futures trading to manage price risk for the purchase and sale of physical commodities, commodity swap dealers
Commodity Futures Markets 21

ITF Interim Report on Crude Oil
use futures markets to manage price risk stemming from their OTC swap business (as discussed previously) and also to handle the majority of commodity index trades in the futures markets. To improve market transparency, in June 2008, the CFTC issued a Special Call for, among other things, disaggregated information concerning OTC swaps from swap dealers and commodity index traders.
Figure 11 WTI Average Open Interest by Commercial Participants, 2003-2008
2003 2004 2005 2006 2007 2008
Manufacturers
ProducersCommercial Dealers
Commodity Sw ap Dealers
-
250,000
500,000
750,000
1,000,000
Source: Büyüksahin et al, CFTC, 2008
Source: Büyüksahin et al, CFTC, 2008
Commodity index funds have grown significantly during the past few years, bringing significant long positions to commodity markets. In the futures markets, these funds have typically been long-only funds, buying near-term futures contracts and rolling their positions into more distant months as the delivery month approaches. Commodity index funds are often utilized by pension funds and other large institutions that seek commodity exposure to diversify existing portfolios of stocks and bonds and this exposure is provided by swap dealers. Although commodity swap dealers’ gross positions have grown significantly, swap dealers' net positions decreased substantially between 2006 and June 2008. (Figure 12) This suggests that flows from commodity index funds have been offset by other swap dealer activity and thus have not necessarily contributed to the recent price increases in crude oil.
Commodity Futures Markets 22

ITF Interim Report on Crude Oil
Figure 12 WTI Net Positions of Commercial Participants, January 2003 to June 2008
20032004
20052006
20072008
Manufacturers
Producers
Commercial Dealers
Commodity Sw ap Dealers -10%
-8%
-6%
-4%
-2%
0%
2%
4%
6%
Source: Büyüksahin et al, CFTC, 2008
Source: Büyüksahin et al, CFTC, 2008
Across all maturities, the aggregate position of swap dealers in WTI crude oil futures contracts was only marginally net long as of the end of June 2008 and was net short on average during the first five months of 2008. This means that swap dealers’ futures positions, on balance, were poised to benefit more from a fall in crude oil prices than from a rise in crude oil prices. Term Structure of Futures Prices
The term structure of futures prices depicts a series of prices for contracts that mature at given dates in the future. It is similar to a yield curve for Treasury bonds in the way information is both presented and interpreted. Futures are said to be in “contango” when prices rise with maturity and in “backwardation” when prices fall with maturity. Over time, the whole term structure may shift upward or downward, as well as rotate. Figure 13 presents a time series of the term structure of crude oil futures prices between March 2004 and May 2008. The solid red line depicts the evolution of the cash (spot) price of crude oil, while each dashed curves shows the terms structure of crude oil futures prices at selected points in time.
Commodity Futures Markets 23

ITF Interim Report on Crude Oil
Figure 13 Term Structure of Crude Oil Prices
20
40
60
80
100
120
140
Mar‐03
Aug‐04
Dec‐05
Apr‐07
Sep‐08
Jan‐10
Jun‐11
Oct‐12
Price Pe
r Ba
rrel
Source: Energy Information Administration and the Commodity Futures Trading Commission. Prices for futures contracts shown are for liquid markets (1000 or more contracts).
According to Figure 13, during the last four years, the term structure has been steadily shifting upward. With a few exceptions, futures prices have been mostly in backwardation, that is, distant prices have been lower than near-term prices. The shape of the term structure provides information about inventories to market participants. Expectations of higher prices in the future are generally viewed as a signal to build up physical inventories. Crude oil inventories can also shed light on whether the price run-up depicted in Figure 13 reflects mostly fundamental supply and demand factors. Artificially high prices will create an imbalance between supply and demand that should lead to inventory accumulation. However, as shown in Figure 14, inventories of crude oil and petroleum products in the United States and in OECD countries have generally declined over the past year. Based on these inventory figures, current prices, although high, are not prompting the inventory accumulation that would be associated with artificially high prices.
Commodity Futures Markets 24

ITF Interim Report on Crude Oil
F gure 14 Private Crude Oil and Petroleum Product Inventor esi i
Speculators and Market Prices: Assessing Contemporaneous Relations
Correlations measure the strength and direction of a statistical relation between two variables. If changes in positions from one day to the next of any category of traders are associated with daily changes in prices,then a pattern in contemporaneous correlations should emerge. Figure 15 presents a time series ofcontemporaneous correlations between daily front month crude oil futures prices and daily net positionchanges of different trader categories.9
According to the top half of Figure 15, during the past five and a half years, changes in commercial traders’ net positions have been largely negatively correlated with crude oil price changes (meaning that positionchanges have moved in the opposite direction from price changes), albeit with a high degree of volatility over time. Non-commercial position changes, on the other hand, have been generally positivelycorrelated with price changes (meaning that position changes have moved in the same direction as pricechanges).
9 Correlations displayed here represent the 30-day historical moving average correlations of position changes (by trader category) with price changes.
Commodity Futures Markets 25

ITF Interim Report on Crude Oil
Figure 15 Correlations between Changes in Prices and Changes in Net Positions
The bottom half of Figure 15 presents correlations for the largest two sub-categories of non-commercialand commercial traders – hedge funds and swap dealers. Correlations between hedge fund positionchanges and price changes (bottom right panel) largely mirror those of non-commercial traders in general (top right panel). In contrast, swap dealer correlations (bottom left panel) are significantly different,centering around zero during the past five and a half years.
According to the above analysis, between 2003 and 2008, the correlations between position changes andprice changes tend to be quite variable. While it is true that the positions of non-commercial traders in general, and hedge funds in particular, often move in the same direction as prices, these correlations,standing alone, do not provide definitive information about causation. Thus, further assessment of thedynamic relations between position changes and price changes is warranted.
Commodity Futures Markets 26
Source: Commodity Futures Trading Commission
ITF Interim Report on Crude Oil
Commodity Futures Markets 27
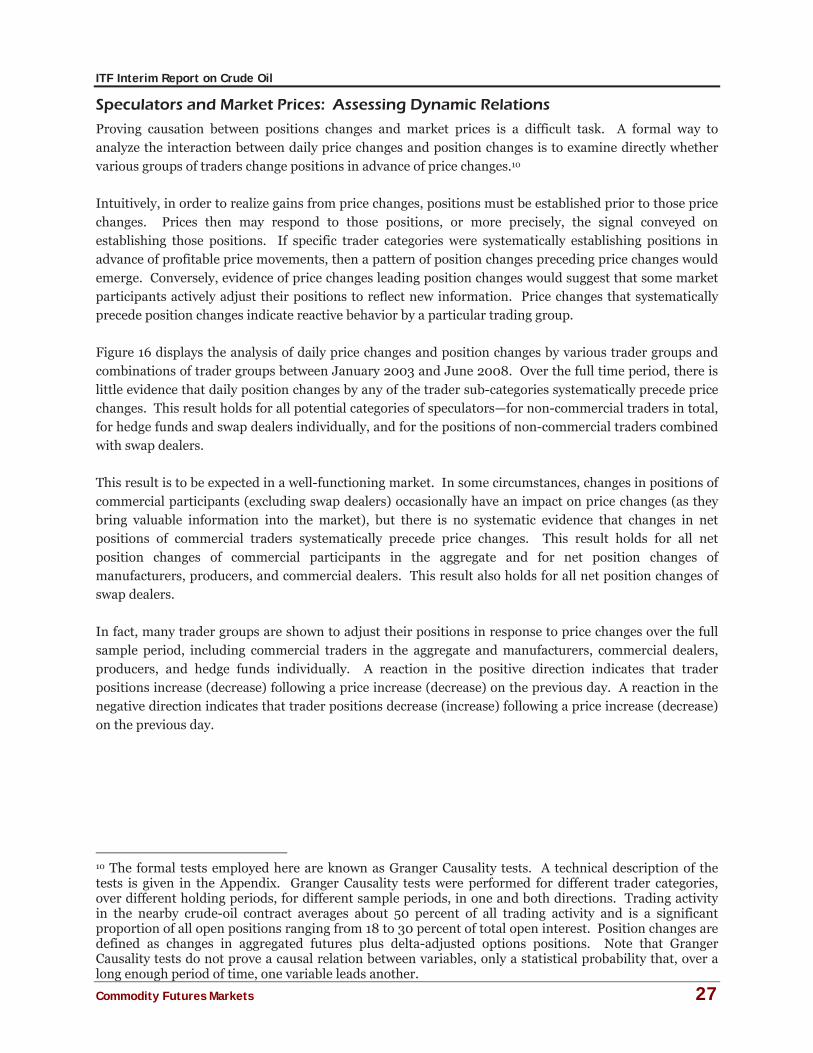
Speculators and Market Prices: Assessing Dynamic Relations
Proving causation between positions changes and market prices is a difficult task. A formal way to analyze the interaction between daily price changes and position changes is to examine directly whether various groups of traders change positions in advance of price changes.10
Intuitively, in order to realize gains from price changes, positions must be established prior to those price changes. Prices then may respond to those positions, or more precisely, the signal conveyed on establishing those positions. If specific trader categories were systematically establishing positions in advance of profitable price movements, then a pattern of position changes preceding price changes would emerge. Conversely, evidence of price changes leading position changes would suggest that some market participants actively adjust their positions to reflect new information. Price changes that systematically precede position changes indicate reactive behavior by a particular trading group. Figure 16 displays the analysis of daily price changes and position changes by various trader groups and combinations of trader groups between January 2003 and June 2008. Over the full time period, there is little evidence that daily position changes by any of the trader sub-categories systematically precede price changes. This result holds for all potential categories of speculators—for non-commercial traders in total, for hedge funds and swap dealers individually, and for the positions of non-commercial traders combined with swap dealers. This result is to be expected in a well-functioning market. In some circumstances, changes in positions of commercial participants (excluding swap dealers) occasionally have an impact on price changes (as they bring valuable information into the market), but there is no systematic evidence that changes in net positions of commercial traders systematically precede price changes. This result holds for all net position changes of commercial participants in the aggregate and for net position changes of manufacturers, producers, and commercial dealers. This result also holds for all net position changes of swap dealers. In fact, many trader groups are shown to adjust their positions in response to price changes over the full sample period, including commercial traders in the aggregate and manufacturers, commercial dealers, producers, and hedge funds individually. A reaction in the positive direction indicates that trader positions increase (decrease) following a price increase (decrease) on the previous day. A reaction in the negative direction indicates that trader positions decrease (increase) following a price increase (decrease) on the previous day.
10 The formal tests employed here are known as Granger Causality tests. A technical description of the tests is given in the Appendix. Granger Causality tests were performed for different trader categories, over different holding periods, for different sample periods, in one and both directions. Trading activity in the nearby crude-oil contract averages about 50 percent of all trading activity and is a significant proportion of all open positions ranging from 18 to 30 percent of total open interest. Position changes are defined as changes in aggregated futures plus delta-adjusted options positions. Note that Granger Causality tests do not prove a causal relation between variables, only a statistical probability that, over a long enough period of time, one variable leads another.

ITF Interim Report on Crude Oil
Commodity Futures Markets 28
Figure 16 Granger Causality Tests relating Daily Position Changes to Price Changes in the NYMEX WTI Crude Oil Futures Contract from January 2000 to June 2008
Hypothesized Direction of Causality Price Changes lead Position
Changes Position Changes lead Price
Changes Trader Classification
Direction Significant? P
Value Direction Significant?
P Value
All Commercials (includes Manufacturers, Commercial
Dealers, Producers, Other Commercial Traders, and
Swap Dealers)
+ Yes 0.028 . No 0.896
Manufacturers + Yes 0.048 . No 0.191
Commercial Dealers + Yes 0.040
. No 0.908
Producers + Yes 0.032
. No 0.449
Other Commercial Traders . No
0.918
. No 0.391
Swap Dealer . No 0.114
. No 0.832
All Non-Commercials (includes Hedge Funds, Floor
Brokers & Traders) . No
0.062 . No 0.764
Hedge Funds - Yes 0.003
. No 0.585
Floor Brokers &
Traders . No 0.741
. No 0.494
All Non-Commercials combined with Swap Dealers
. No 0.062 . No 0.947
Source: Commodity Futures Trading Commission
These results are representative and have been subject to a variety of robustness checks. Importantly, the results remain qualitatively similar during the most recent price run-up between January 2006 and June 2008. In addition, tests uncover no evidence that position changes by trader categories that might be deemed speculative are systematically leading price changes over 2-, 3-, 4- and 5-day intervals. While these statistical tests present the most complete examination to date of the relation between position changes and price changes, they – like all statistical tests – have some limitations. First, the analysis was performed for trader groups rather than individual traders. Consequently, these tests would not be able to detect if the positions of some traders within a trading category have much greater influence over prices than the positions of other traders in that category. Second, the tests utilize end of day position data. Thus, the tests may not capture any intraday position-price relationships. Finally, the tests

ITF Interim Report on Crude Oil
Commodity Futures Markets 29
were performed on aggregated net position changes in the nearby contracts alone (defining nearby as the futures contract with the largest open interest). As a result, the tests do not reflect a systematic effect of position changes at different maturities on either the prices of the nearby futures contract or on the whole term structure of futures prices. That said, if the actions of particular groups of traders had systematically driven the recent oil price increases, the tests performed should have made it quite apparent. Again, it is useful to note that while the tests do not find that changes in daily positions systematically lead changes in prices, such a finding would not necessarily imply that position changes were responsible for the price changes. Nevertheless, the lack of significant position changes leading price changes is informative. Taken as a whole, these statistical correlations and tests are consistent with the view that current oil prices are being driven by fundamental supply and demand factors.


ITF Interim Report on Crude Oil
Concluding Remarks In this interim report, the Interagency Task Force on Commodity Markets examined both fundamental factors and trading activity in the crude oil futures market during the period January 2003 through June 2008. Fundamentals have changed in important ways during the past few years. Demand for oil has shifted upward, reflecting strong economic growth in commodity-intensive, emerging market economies, notably China, India and the Middle East. Some nations provide subsidies that hold down fuel prices, thereby further boosting oil consumption. At the same time, supply has not kept pace. World oil production has increased only slightly over the past few years. Consequently, oil prices have risen to keep world oil consumption in line with production (the two must be equal aside from changes in inventories). As oil demand is very insensitive to moves in oil prices in the near term, the rise in oil prices has been disproportionately large in order to offset the robust, income-driven rise in demand. In addition, the decline in the foreign exchange value of the dollar also has contributed somewhat to the increase in the dollar price of oil. These new demand and supply realities have contributed to an increased interest to participate in futures markets. Commercial entities seeking to avoid exposure to changes in the prices of crude oil they will purchase or sell are motivated to establish hedges. In addition, some participants perceive holding long crude oil futures positions as offering protection from further declines in the dollar. Still others utilize futures positions to ameliorate risk from their other portfolio holdings. A robust increase in trading activity in the crude oil futures market had largely occurred during the same time that the price of crude oil was rising. This prompted a need to examine if the behavior of some market participants had a possible impact on the price of crude oil. This study examined whether there is any statistically significant evidence that the trading activity of commercial and non-commercial traders and their sub-categories—commercial producers, commercial manufacturers, commercial dealers, swap dealers, hedge funds, and floor brokers and traders—had a systematic influence on the price of crude oil. To date, there is no statistically significant evidence that the position changes of any category or sub-category of traders systematically affect prices. This is to be expected in well-functioning markets. On the contrary, there is evidence that non-commercial entities alter their position following price changes. This is also expected because new prices convey information affecting the prospects and the risks of those entities. This being an interim report, the Task Force intends to examine these findings further as it continues its work. However, to this point of the examination, the evidence supports the position that changes in fundamental factors provide the best explanation for the recent crude oil price increases. Observed increases in the speculative activity and the number of traders in the crude oil futures market do not appear to have systematically affected prices. Moreover, if speculative activity has pushed oil prices above the levels consistent with physical supply and demand, increases in inventories should emerge as higher prices reduce consumption and investment in productive capacity is encouraged. Although this process may take time to unfold, inventories of crude oil and petroleum products, according to available data, have declined significantly over the past year. The view that financial investors have pushed prices above fundamental values is also difficult to square with the fact that prices for other commodities that do not trade on established futures markets (such as coal, steel, and onions) have risen sharply as well.
Concluding Remarks 31

ITF Interim Report on Crude Oil
The Task Force will continue its examination of the dynamics of the crude oil futures market and other commodity markets and will report further on its work later this year.11
11 In June 2008, the CFTC issued requests for disaggregated information – Special Calls – to swap dealers and commodity index traders. Data submitted in response to the special calls is expected to enable a detailed analysis of index trading and over-the-counter swaps across a wide variety of futures markets. This analysis, in turn, would enable the CFTC to gauge the effectiveness of current rules and regulations governing the dynamics of futures markets.
Concluding Remarks 32

ITF Interim Report on Crude Oil
AppendixGranger Causality Tests A formal way to statistically test for whether one variable leads another are known as Granger Causality tests (see Granger, C. W. J., 1969, Investigating causal relations by econometric models and cross-spectral methods, Econometrica 37, 424-438).
Granger Causality tests reported above are performed by employing bivariate regressions in the form of
where p is the change in nearby price; NP is the change in net nearby positions of the specific trader category; and l is the optimal lag chosen. Applying the Akaike Information Criterion, one lag in eachequation was found to be sufficient.
The first equation asks whether changes in net positions at the end of each reporting day reliably predict changes in settlement prices given the prior change in settlement price. The second equation askswhether changes in settlement price reliably predict changes in end-of-day net positions given the prior change in positions.
The test is whether the variance of residuals from the respective unrestricted equation is significantly less than the variance of residuals from the corresponding restricted equation.
Results utilize 1378 daily price change and position change observations sampled from January 1, 2003 through June 30, 2008. Position changes are defined by net daily position changes in the nearby futuresplus delta-adjusted options contract. P-values are reported for F-tests and indicate probabilities that thevariance of residuals from the respective unrestricted equation differs from the variance of thecorresponding restricted equation.
Appendix 33
Corel Equation Editor
p p NPt l t l l t l tl
k
l
k
= + + +==
0
11
NP NP pt l t l l t l tl
k
l
k
= + + +==
0
11
Microsoft Equation Editor
= =
+++=k
l
k
l
tltlltlt NPpp1 1
0
= =
+++=k
l
k
l
tltlltlt pNPNP1 1
0
MATH Type
0
1 1
0
1 1
k k
t l t l l t l t
l l
k k
t l t l l t l t
l l
p p NP
NP NP p
= =
= =
= + + +
= + + +


ITF Interim Report on Crude Oil
Glossary of Futures Markets Terms Backwardation: Market situation in which futures prices are progressively lower in the distant delivery months. (Backwardation is the opposite of contango).
Bid: An offer to buy a specific quantity of a commodity at a stated price.
Board of Trade: Any organized exchange or other trading facility for the trading of futures and/or option contracts.
Cash Market: The market for the cash commodity (as contrasted to a futures contract) taking the form of either an organized, self-regulated central market (e.g., a commodity exchange) or a decentralized over-the-counter market.
CFTC Form 40: The form used by large traders to report their futures and option positions and the purposes of those positions.
Clearing: The procedure through which the clearing organization becomes the buyer to each seller of a futures contract or other derivative, and the seller to each buyer for clearing members.
Clearing Member: A member of a clearing organization. All trades of a non-clearing member must be processed and eventually settled through a clearing member.
Clearing Organization or Clearing House: An entity through which futures and other derivative transactions are cleared and settled. It is also charged with assuring the proper conduct of each contract’s delivery procedures and the adequate financing of trading. A clearing organization may be a division of a particular exchange, an adjunct or affiliate thereof, or a freestanding entity.
Commercial: A trader involved in the production, processing, or merchandising of a commodity.
Commitments of Traders Report (COT): A weekly report from the CFTC providing a breakdown of each Tuesday's open interest for markets in which 20 or more traders hold positions equal to or above the reporting levels established by the CFTC. Open interest is broken down by aggregate commercial, non-commercial, and non-reportable holdings.
Commodity Index: An index or average, which may be weighted, of selected commodity prices, intended to be representative of the markets in general or a specific subset of commodities, e.g., grains or livestock.
Commodity Pool Operator (CPO): A person engaged in a business similar to an investment trust or a syndicate and who solicits or accepts funds, securities, or property for the purpose of trading commodity futures contracts or commodity options and who generally must register with the CFTC as a CPO.
Commodity Swap: A swap in which the payout to at least one counterparty is based on the price of a commodity or the level of a commodity index.
Contango: Market situation in which prices in succeeding delivery months are progressively higher than in the nearest delivery month; the opposite of backwardation.
Counterparty: The opposite party in a bilateral agreement, contract, or transaction, such as a swap.
Day Trader: A trader who takes positions and then offsets them during the same trading session prior to the close of trading.
Glossary of Futures Markets Terms 35

ITF Interim Report on Crude Oil
Dealer/Merchant (AD): A large trader that declares itself a “Dealer/Merchant” on CFTC Form 40, which provides as examples “wholesaler, exporter/importer, shipper, grain elevator operator, crude oil marketer.”
Derivative: A financial instrument, traded on or off an exchange, the price of which is directly dependent upon (i.e., "derived from") the value of one or more underlying securities, equity indices, debt instruments, commodities, other derivative instruments, or any agreed upon pricing index or arrangement (e.g., the movement over time of the Consumer Price Index or freight rates). Derivatives involve the trading of rights or obligations based on the underlying product, but do not directly transfer property. They are used to hedge risk or to exchange a floating rate of return for fixed rate of return. Derivatives include futures, options, and swaps. For example, futures contracts are derivatives of the physical contract and options on futures are derivatives of futures contracts.
Electronic Trading Facility: A trading facility that operates by an electronic or telecommunications network instead of a trading floor and maintains an automated audit trail of transactions.
Eligible Commercial Entity: An eligible contract participant or other entity approved by the CFTC that has a demonstrable ability to make or take delivery of an underlying commodity of a contract; incurs risks related to the commodity; or is a dealer that regularly provides risk management, hedging services, or market-making activities to entities trading commodities or derivative agreements, contracts, or transactions in commodities.
Eligible Contract Participant: An entity, such as a financial institution, insurance company, or commodity pool, that is classified by the Commodity Exchange Act as an eligible contract participant based upon its regulated status or amount of assets. This classification permits these persons to engage in transactions (such as trading on a derivatives transaction execution facility) not generally available to non-eligible contract participants, i.e., retail customers.
Exchange-Traded Fund (ETF): An investment vehicle holding an asset such as a commodity that issues shares that are traded like a stock on a securities exchange.
Exempt Commercial Market: An electronic trading facility that trades exempt commodities on a principal-to-principal basis solely between persons that are eligible commercial entities.
Floor Broker: A person with exchange trading privileges, who, in any pit, ring, post, or other place provided by an exchange for the meeting of persons similarly engaged, executes for another person any orders for the purchase or sale of any commodity for future delivery.
Foreign Board of Trade: A futures exchange located outside the United States.
Forward Contract: A cash transaction common in many industries, including commodity merchandising, in which a commercial buyer and seller agree upon delivery of a specified quality and quantity of goods at a specified future date. Terms may be more “personalized” than is the case with standardized futures contracts (i.e., delivery time and amount are as determined between seller and buyer). A price may be agreed upon in advance, or there may be agreement that the price will be determined at the time of delivery.
Futures Commission Merchant (FCM): Individuals, associations, partnerships, corporations, and trusts that solicit or accept orders for the purchase or sale of any commodity for future delivery on or subject to the rules of any exchange and that accept payment from or extend credit to those whose orders are accepted.
Glossary of Futures Markets Terms 36
ITF Interim Report on Crude Oil
Futures Contract: An agreement to purchase or sell a commodity for delivery at a specified time in the future: (1) at a price that is determined at initiation of the contract; (2) that obligates each party to the contract to fulfill the contract at the specified price; (3) that is used to assume or shift price risk; and (4) that may be satisfied by delivery or offset.
Hedge Exemption: An exemption from speculative position limits for bona fide hedgers and certain other persons who meet the requirements of exchange and CFTC rules.
Hedge Fund: A private investment fund or pool that trades and invests in various assets such as securities, commodities, currency, and derivatives on behalf of its clients, typically wealthy individuals.
Hedger: A trader who enters into a position in a futures market opposite to a position held in the cash market to minimize the risk of financial loss from an adverse price change; or who purchases or sells futures as a temporary substitute for a cash transaction that will occur later. One can hedge either a long cash market position (e.g., one owns the cash commodity) or a short cash market position (e.g., one plans on buying the cash commodity in the future).
Hybrid Instruments: Financial instruments that possess, in varying combinations, characteristics of forward contracts, futures contracts, option contracts, debt instruments, bank depository interests, and other interests. Certain hybrid instruments are exempt from CFTC regulation.
Large Traders: A large trader is one who holds or controls a position in any one future or in any one option expiration series of a commodity on any one exchange equaling or exceeding the exchange or CFTC-specified reporting level.
Liquidity: An aspect of a market indicating that selling and buying can be accomplished with minimal effect on price. The more liquid a market is, the easier it is to execute large trades with minimal price impact.
Long: (1) One who has bought a futures contract to establish a market position; (2) a market position that obligates the holder to take delivery; (3) one who owns an inventory of commodities.
Managed Money Traders (MMTs): Futures market participants who engage in futures trades on behalf of investment funds or clients. While MMTs are commonly equated with hedge funds, they may include Commodity Pool Operators and other managed accounts as well as hedge funds. While CFTC Form 40 does not provide a place to declare oneself a Managed Money Trader, a large trader can declare itself a “Hedge Fund (H)” or “Managed Accounts and Commodity Pools.”
Manufacturer (AM): A large trader that declares itself a “Manufacturer” on CFTC Form 40, which provides as examples “refiner, miller, crusher, fabricator, sawmill, coffee roaster, cocoa grinder.” In the crude oil and product futures and option markets, Manufacturers are likely to be refiners.
Margin: The amount of money or collateral deposited by a customer with his broker, by a broker with a clearing member, or by a clearing member with a clearing organization. The margin is not partial payment on a purchase. Also called Performance Bond. (1) Initial margin is the amount of margin required by the broker when a futures position is opened; (2) Maintenance margin is an amount that must be maintained on deposit at all times. If the equity in a customer's account drops to or below the level of maintenance margin because of adverse price movement, the broker must issue a margin call to restore the customer's equity to the initial level. Exchanges specify levels of initial margin and maintenance margin for each futures contract, but futures commission merchants may require their customers to post margin at higher levels than those specified by the exchange.
Glossary of Futures Markets Terms 37
ITF Interim Report on Crude Oil
Market Maker: In the futures industry, a trader who, in speculating for his own account, provides bids and offers for commercial users of the market.
Nearbys: The nearest delivery months of a commodity futures market.
Nearby Delivery Month: The month of the futures contract closest to maturity.
Non-commercial: A trader other than a commercial, that is, a trader that is not involved in the production, processing, or merchandising of the commodity it is trading.
Offer: An indication of willingness to sell at a given price; opposite of bid, the price level of the offer may be referred to as the “ask.”
Offset: Liquidating a purchase of futures contracts through the sale of an equal number of contracts of the same delivery month, or liquidating a short sale of futures through the purchase of an equal number of contracts of the same delivery month.
Open Interest: The total number of futures contracts long or short in a delivery month or market that has been entered into and not yet liquidated by an offsetting transaction or fulfilled by delivery.
Option: A contract that gives the buyer the right, but not the obligation, to buy (call) or sell (put) a specified quantity of a commodity or other instrument at a specific price within a specified period of time, regardless of the market price of that instrument.
Over-the-Counter (OTC): The trading of commodities, contracts, or other instruments not listed on any exchange. OTC transactions can occur electronically or over the telephone.
Position Accountability: A rule adopted by an exchange requiring persons holding a certain number of outstanding contracts to report the nature of the position, trading strategy, and hedging information of the position to the exchange, upon request of the exchange. See Speculative Position Limit.
Position Limit: See Speculative Position Limit.
Price Discovery: The process of determining the price level for a commodity based on supply and demand conditions. Price discovery may occur in a futures market or cash market.
Producer (AP): A large trader that declares itself a “Producer” on CFTC Form 40, which provides as examples, “farmer” and “miner.” A firm that extracts crude oil or natural gas from the ground would also be considered a Producer.
Reporting Level: Sizes of positions set by the exchanges and/or the CFTC at or above which commodity traders or brokers who carry these accounts must make daily reports about the size of the position by commodity, by delivery month, and whether the position is controlled by a commercial or non-commercial trader.
Scalper: A speculator who buys and sells rapidly, with small profits or losses, holding his positions for only a short time during a trading session. Typically, a scalper will stand ready to buy at a fraction below the last transaction price and to sell at a fraction above, e.g., to buy at the bid and sell at the offer or ask price, with the intent of capturing the spread between the two, thus creating market liquidity.
Short: (1) The selling side of an open futures contract; (2) a trader whose net position in the futures market shows an excess of open sales over open purchases.
Glossary of Futures Markets Terms 38

ITF Interim Report on Crude Oil
Special Call: A request pursuant to CFTC Regulation 18.05 for further details regarding a large trader’s futures and cash market positions.
Speculative Position Limit: The maximum position, either net long or net short, in one commodity future (or option) or in all futures (or options) of one commodity combined that may be held or controlled by one person (other than a person eligible for a hedge exemption) as prescribed by an exchange and/or by the CFTC.
Speculator: In commodity futures, a trader who does not hedge, but who trades with the objective of achieving profits through the successful anticipation of price movements.
Spot: Market of immediate delivery of and payment for the product.
Spot Commodity: (1) The actual commodity as distinguished from a futures contract; (2) sometimes used to refer to cash commodities available for immediate delivery.
Spot Month: The futures contract that matures and becomes deliverable during the present month.
Spot Price: The price at which a physical commodity for immediate delivery is selling at a given time and place.
Spread: The purchase of one futures delivery month against the sale of another futures delivery month of the same commodity; the purchase of one delivery month of one commodity against the sale of that same delivery month of a different commodity; or the purchase of one commodity in one market against the sale of the commodity in another market, to take advantage of a profit from a change in price relationships. The term spread is also used to refer to the difference between the price of a futures month and the price of another month of the same commodity. A spread can also apply to options.
Swap: In general, an OTC contract for the exchange of one asset or liability for a similar asset or liability for the purpose of lengthening or shortening maturities or otherwise shifting risks. See Commodity Swap.
Swap Dealer (AS): An entity such as a bank or investment bank that markets swaps to end users. Swap dealers often hedge their swap positions in futures markets. Alternatively, an entity that declares itself a “Swap/Derivatives Dealer” on CFTC Form 40.
Yield Curve: A graphic representation of market yield for a fixed income security plotted against the maturity of the security. The yield curve is positive when long-term rates are higher than short-term rates.
Glossary of Futures Markets Terms 39


Notes

Notes

For further information about this in ter im report , contact the CommodityFutures Trading Commission’s Off ice of External Affairs at 202-418-5080or via emai l at TaskForce@cftc .gov.
An electronic vers ion of the Interagency Task Force on Commodit y Markets ’Inter im Report on Crude Oi l is avai lable on the Internet at www.cftc .gov.